Select a Market Report to Read:
- National Market Update Overview
- Bay Area Report
- North Bay Report
- East Bay Report
- Silicon Valley Report
- San Francisco Report
Welcome to the latest San Francisco Real Estate Market Report from Kinoko Real Estate! As your trusted local Real Estate experts in San Francisco, we're committed to providing you with the most accurate and insightful data to guide your home buying or selling journey in this dynamic city.
The Local Lowdown
Quick Take
- Homes in the San Francisco area continue to sell within their historical average range.
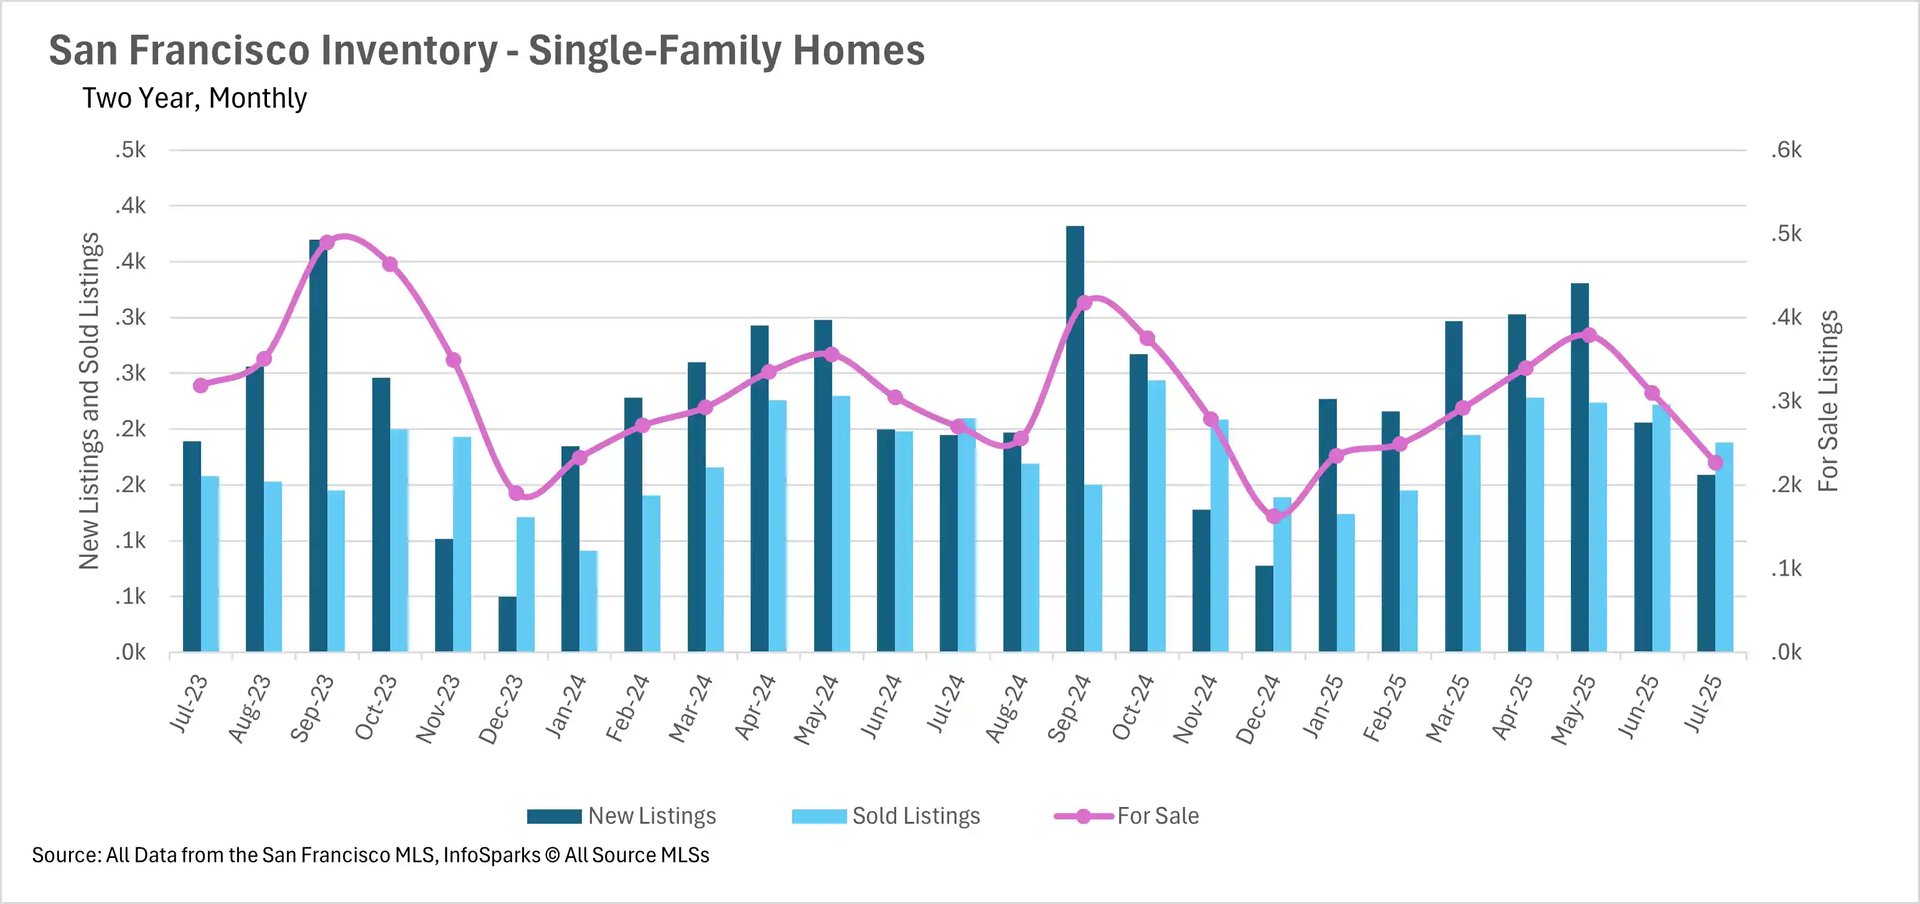
- Lack of inventory remains a huge issue throughout San Francisco.
- Despite inventory being an issue, condos are still sitting on the market for quite some time.
Note: You can find the charts/graphs for the Local Lowdown at the end of this section.
*National Association of REALTORS® data is released two months behind, so we estimate the most recent month's data when possible and appropriate.
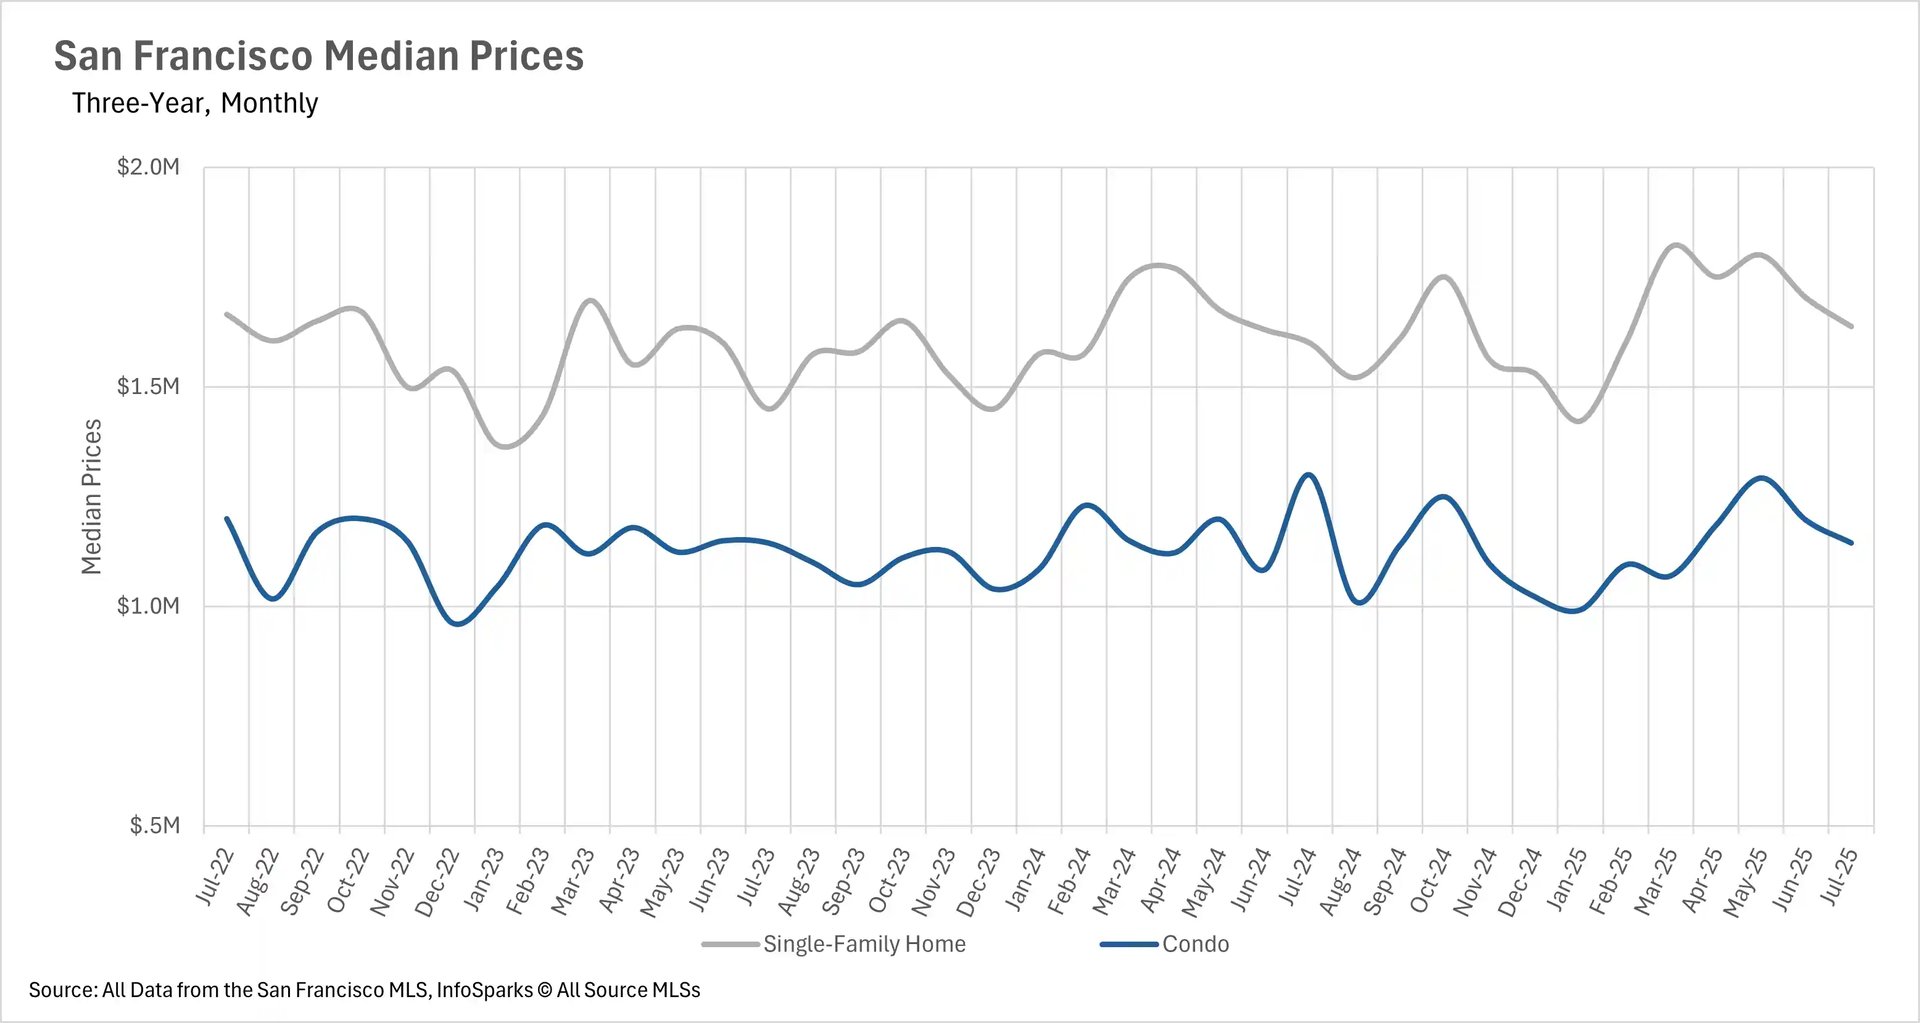
Home values in San Francisco are “business as usual”
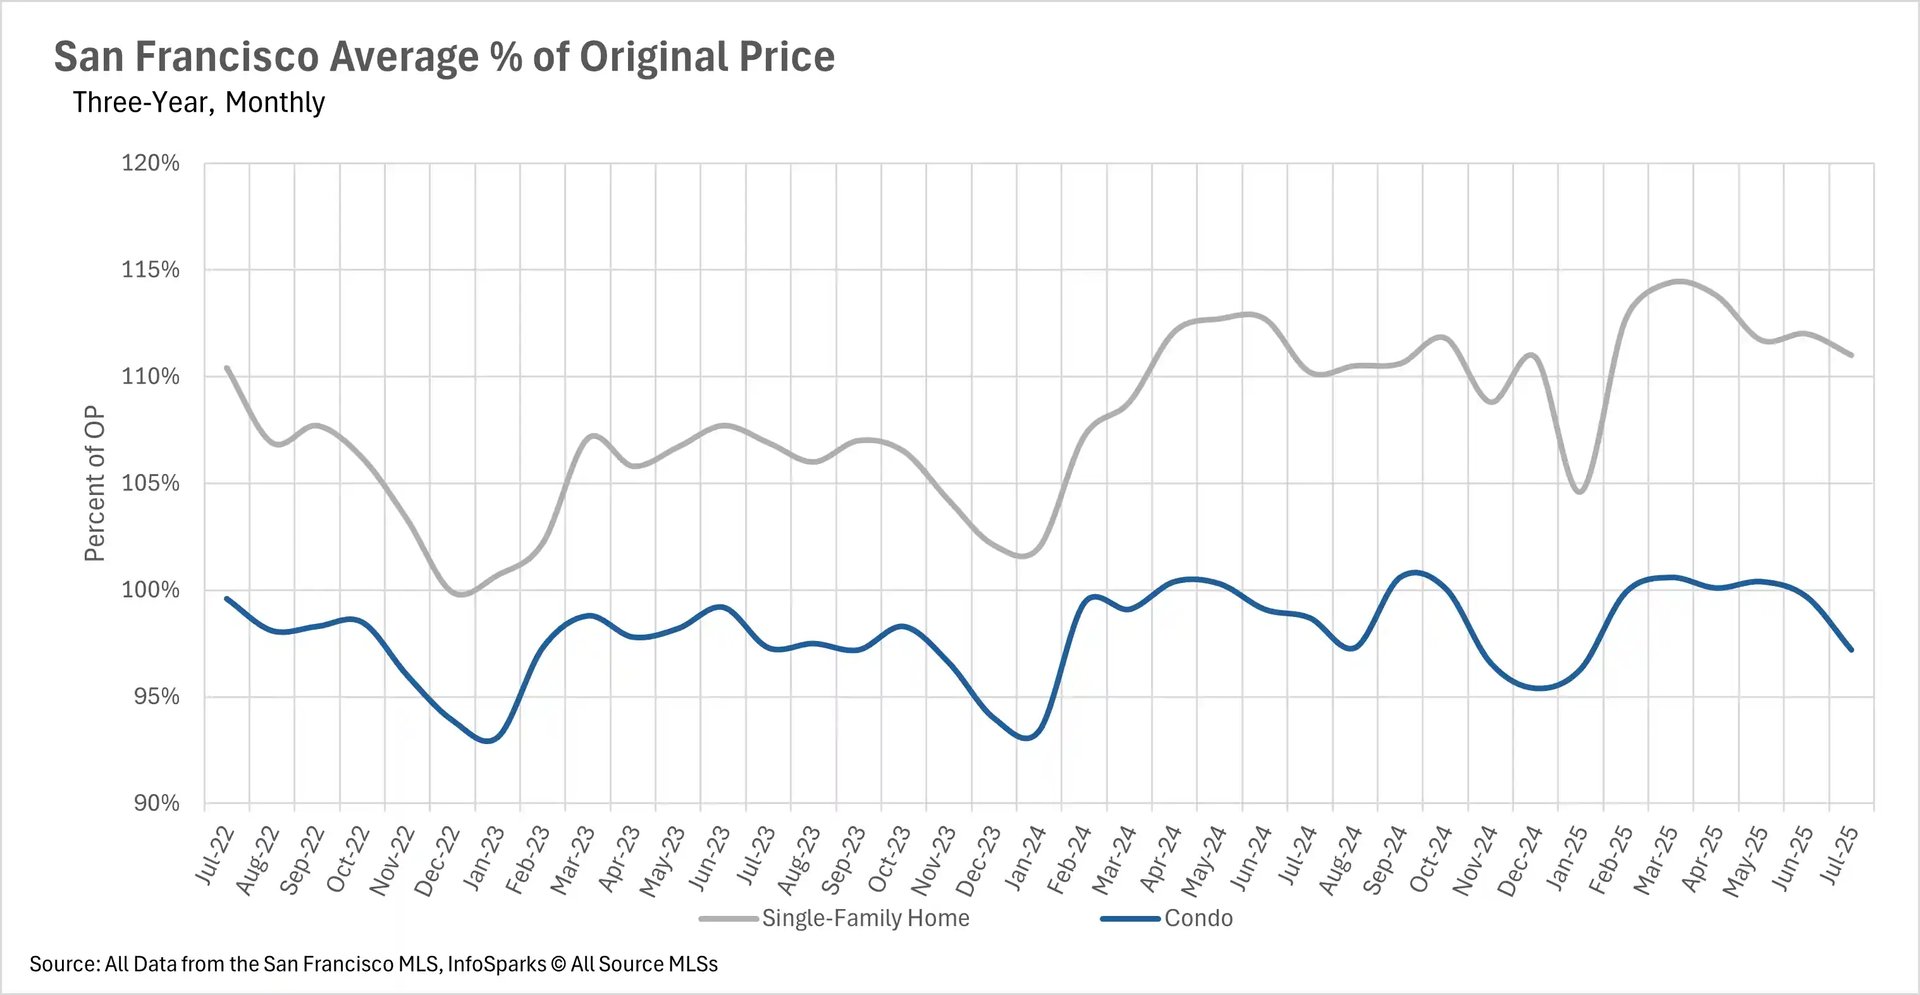
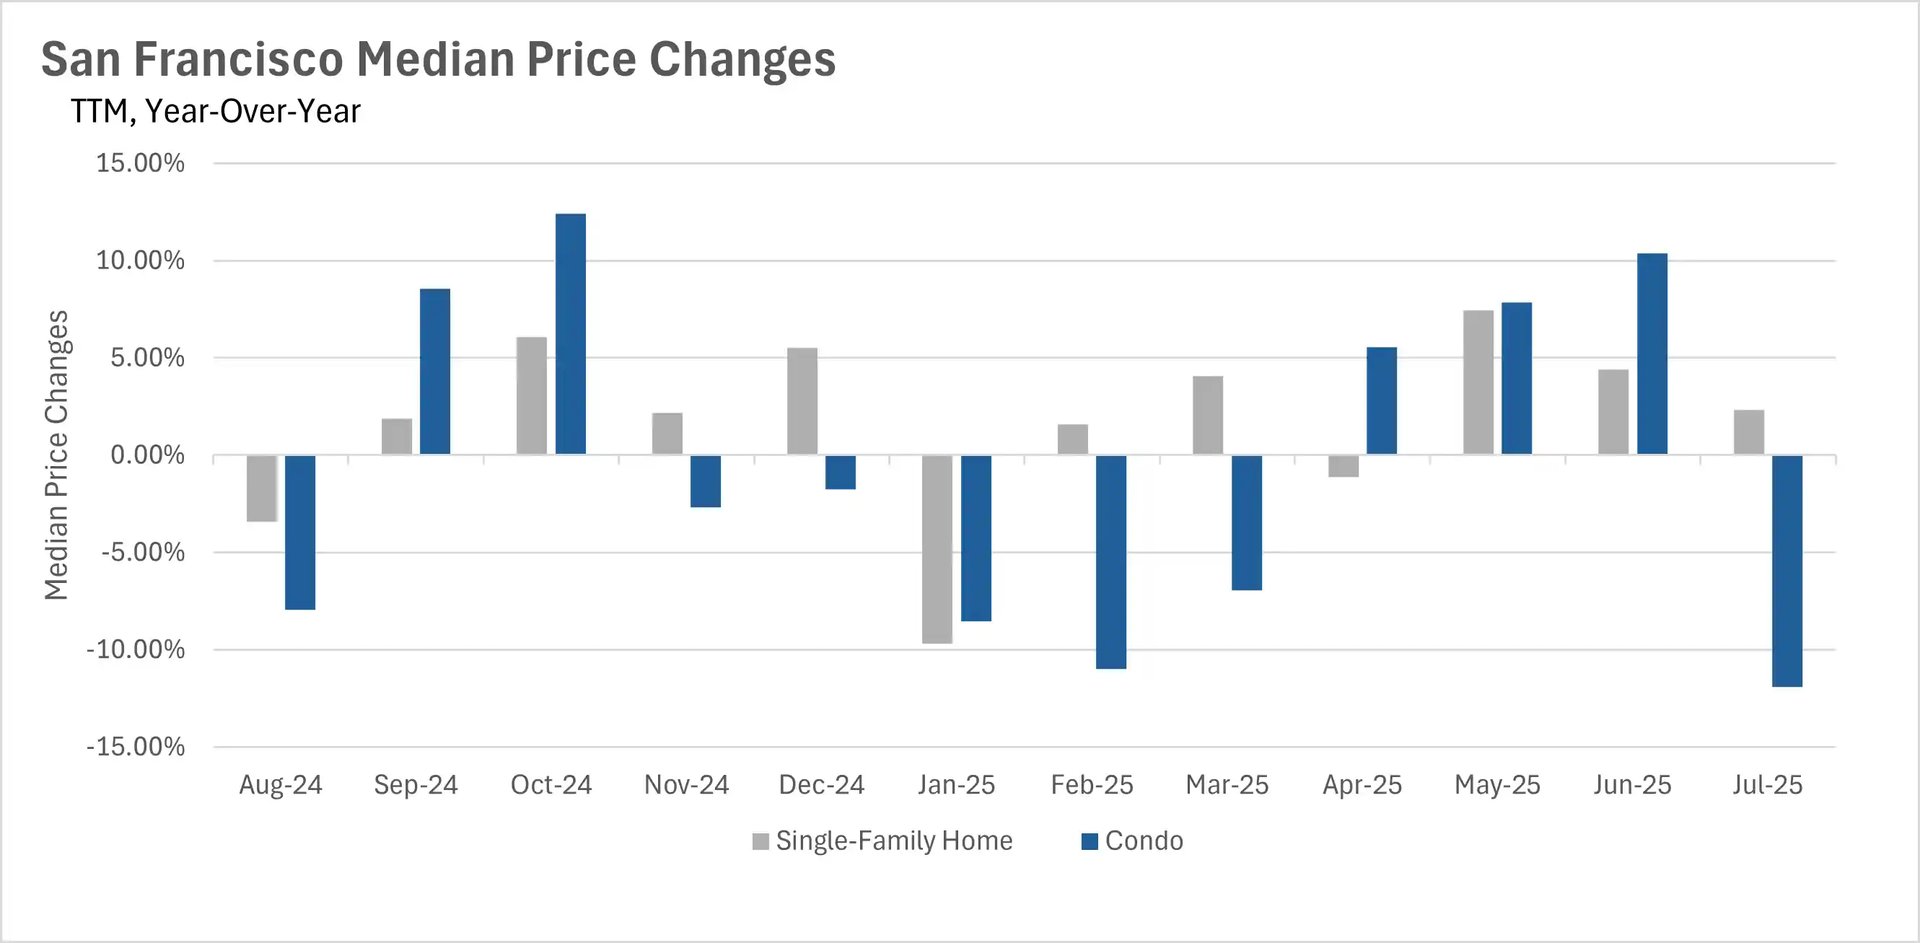
Although inventories have been steadily declining over time, median sales prices in San Francisco are holding inside a familiar band for both single-family homes and condos. While the median sale price for condos decreased by 11.92% year-over-year, that movement is largely driven by normal volatility in this metric. In contrast, the single-family home median sale price ticked up by 2.34% year-over-year, underscoring continued strength in San Francisco single-family housing.
The inventory issue doesn’t look like it will be solved anytime soon
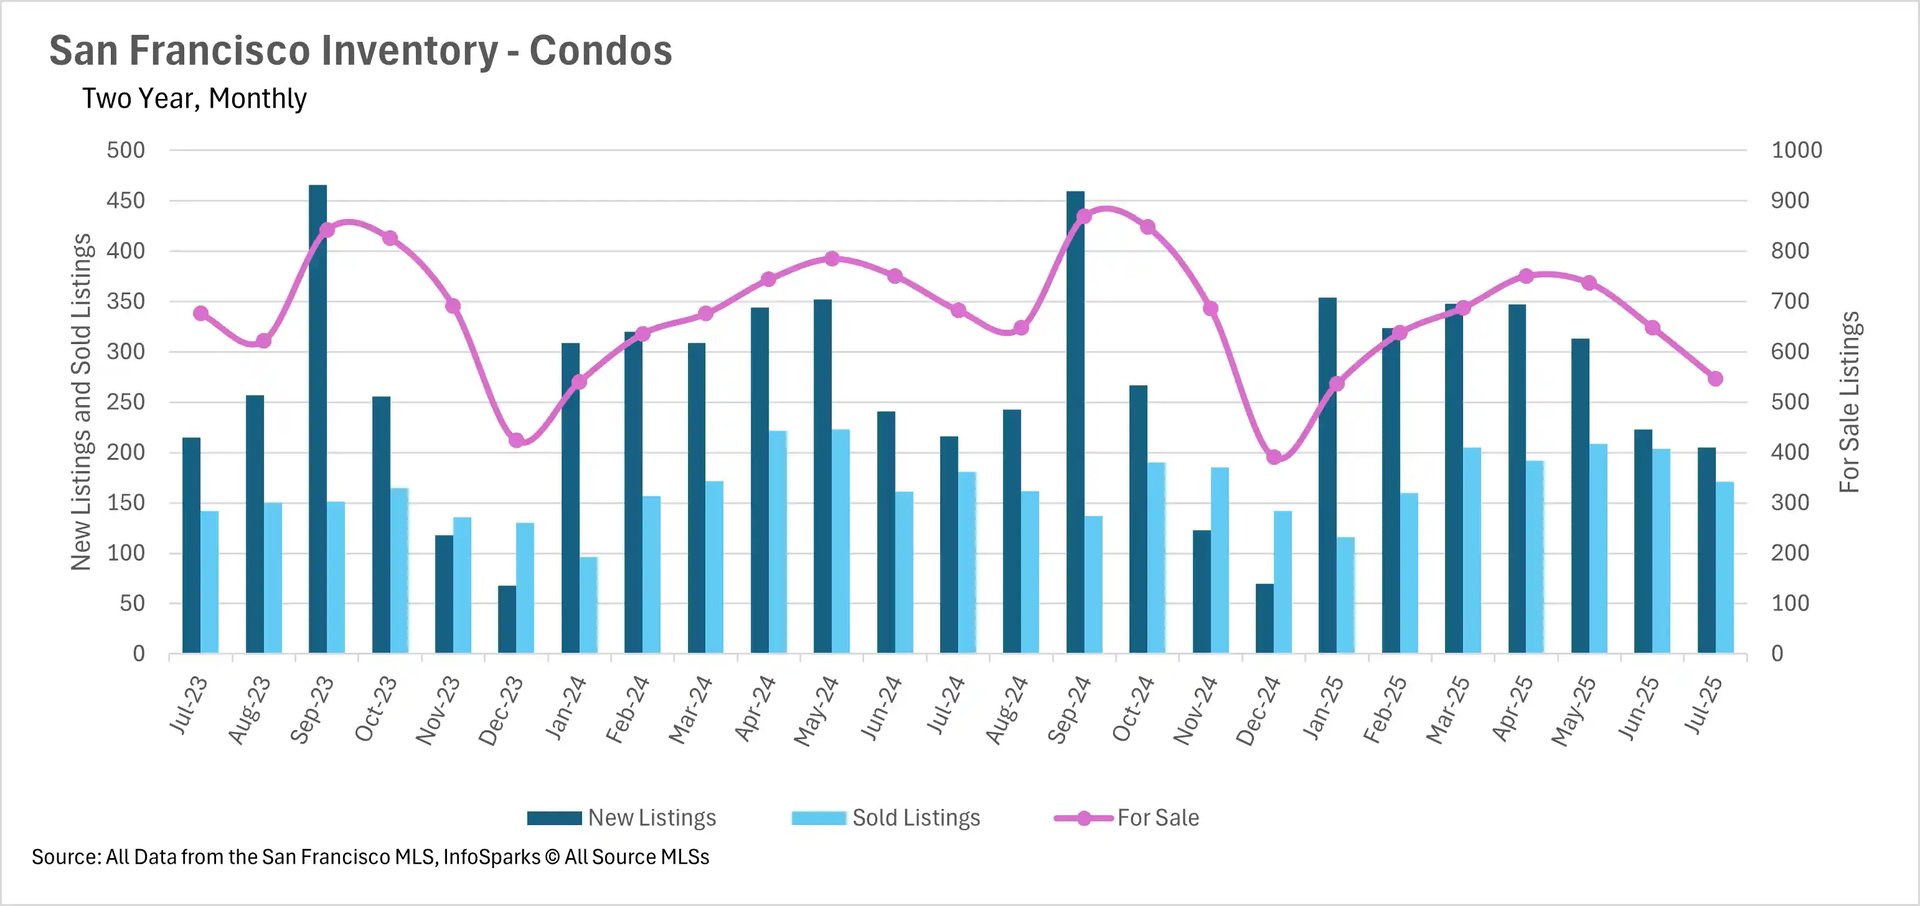
San Francisco continues to diverge from much of the Bay Area on supply: instead of piling up, inventory here is shrinking. In July, we recorded 15.93% less single-family inventory year-over-year and 19.91% less condo inventory. That’s driven by fewer new listings hitting the market — single-family new listings were down 18.46% year-over-year in July, while the condo market saw 5.09% fewer new listings.
If you’re thinking of selling your San Francisco home, now is a strategic time to reach buyers; see our Sellers Guide for a breakdown of how we reduce time on market and maximize value.
Condos continue to sit on the market, while single-family homes are snapped up
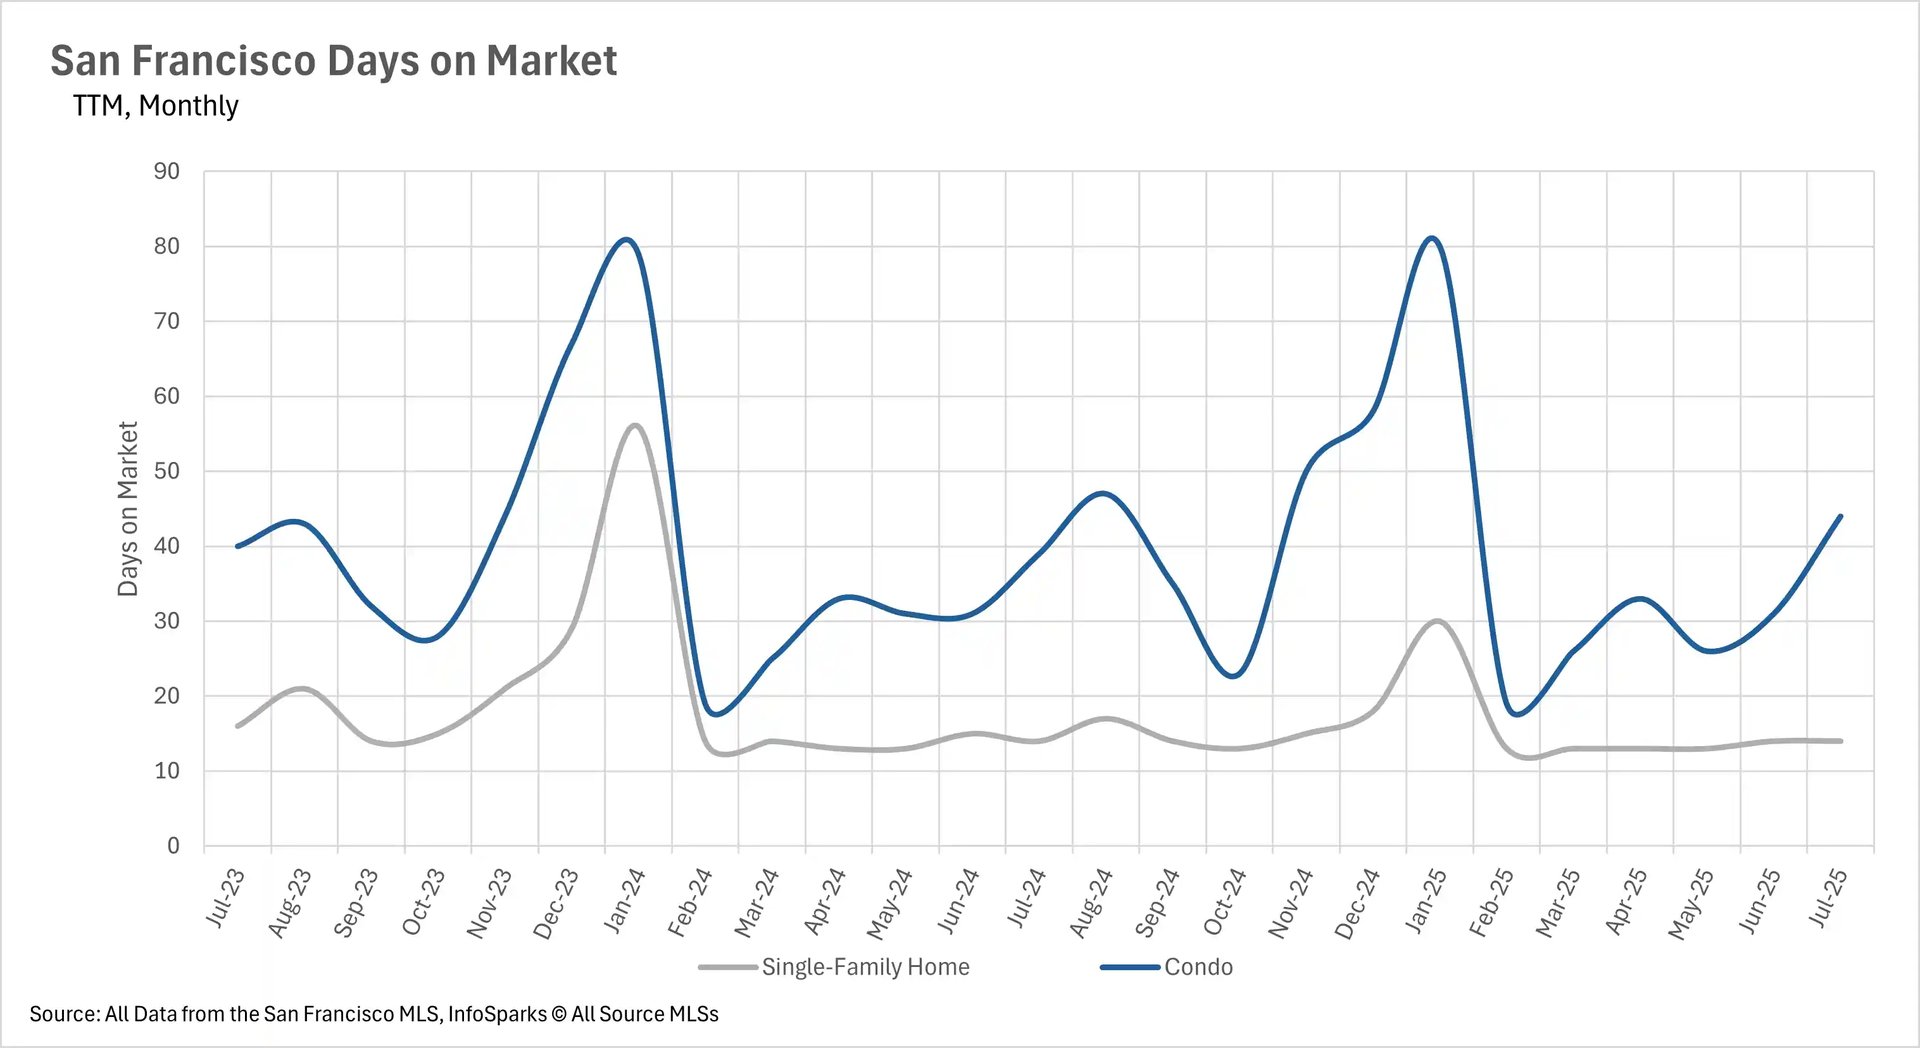
Inventory scarcity doesn’t affect every property type the same way. Single-family homes in San Francisco are moving very quickly — the average single-family listing sat on the market for just 14 days. By contrast, the average condo took 44 days to sell in July, which represents a 12.82% increase year-over-year. That gap is familiar to San Francisco agents and buyers: condos historically take longer to sell than single-family homes, and July’s data continues that pattern.
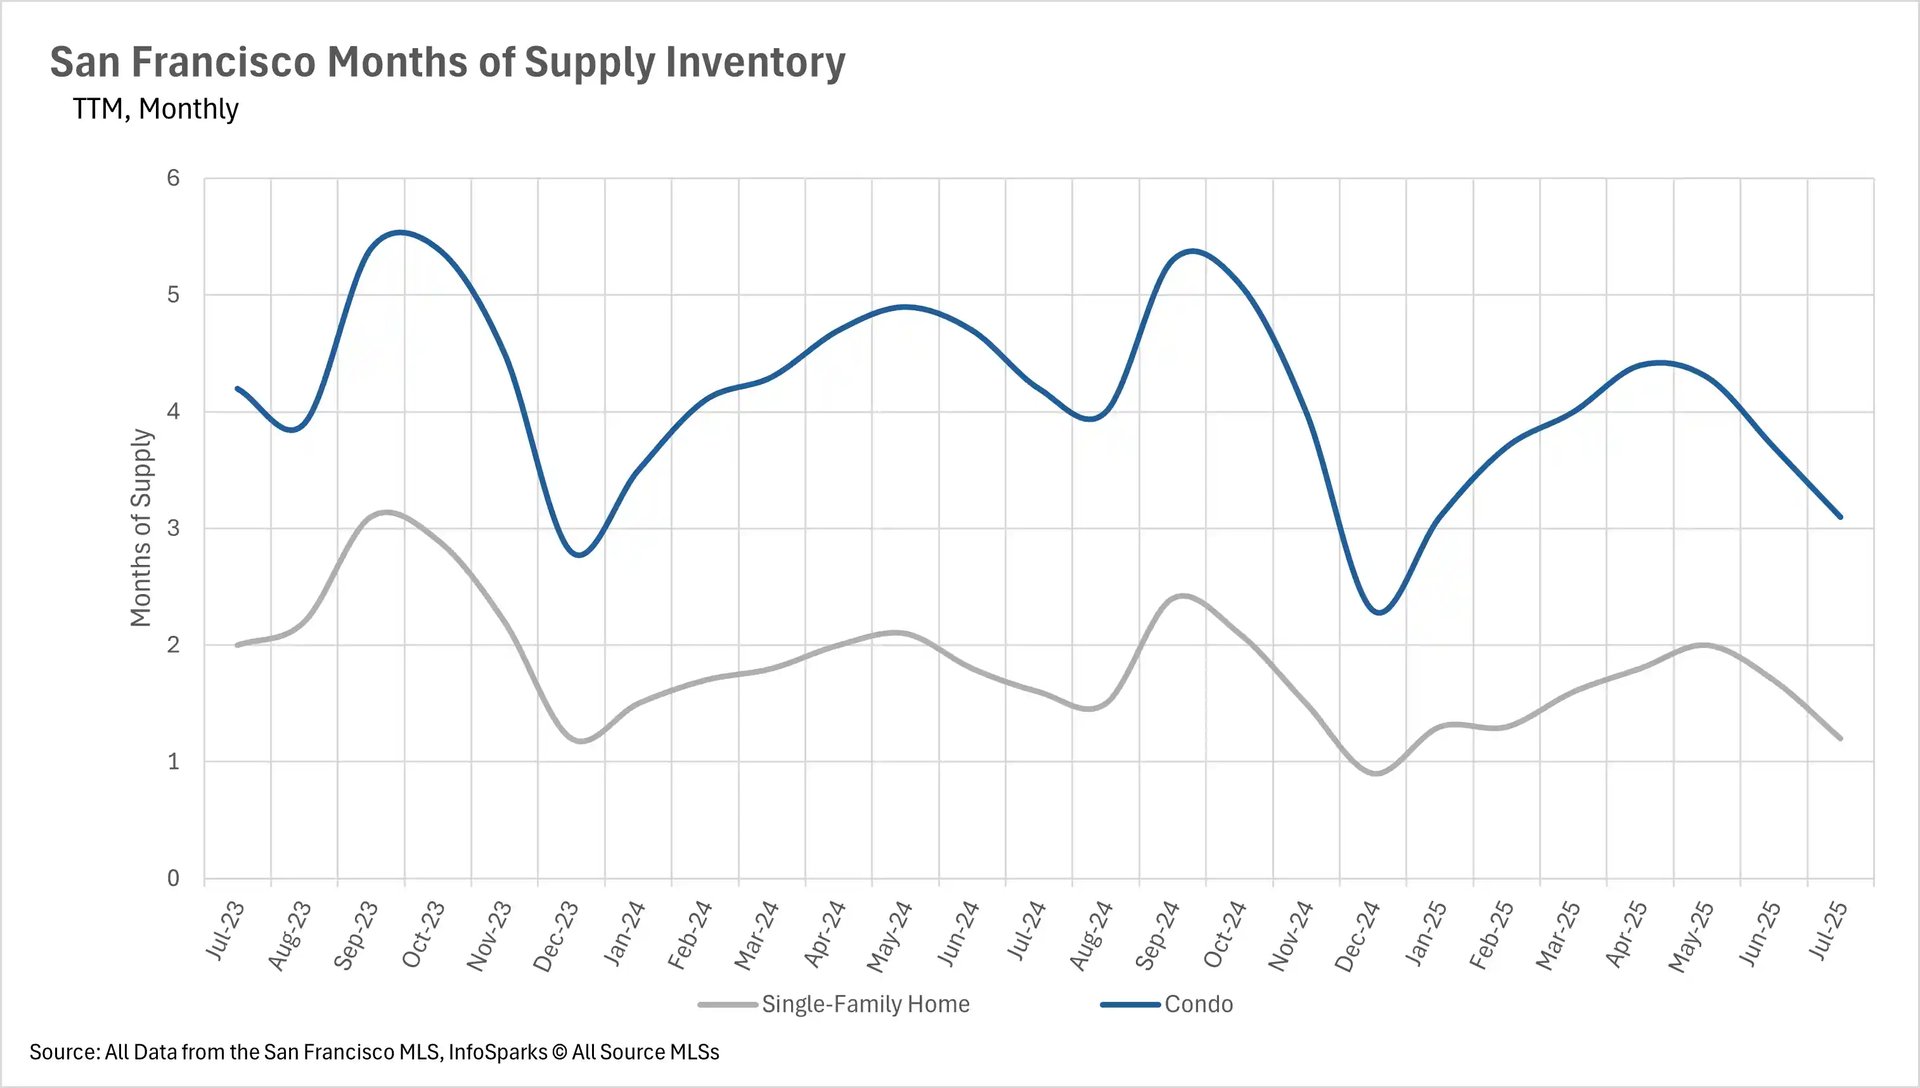
The condo market becomes more balanced
We use Months of Supply Inventory (MSI) to judge market balance. In California, around three months of MSI is historically a balanced market. Less than three months points to a seller’s market; above three months points to a buyer’s market.
-
Condos: with 3.1 months of supply, the condo market in San Francisco has edged back toward balance — and could look like a buyer’s market within a month or two if this trend continues.
-
Single-family homes: remain a clear seller’s market at just 1.2 months of supply.
These MSI levels help explain why single-family homes are selling so quickly while condos have more time on market. For neighborhood-level MSI and how it affects pricing power in places like Pacific Heights, Noe Valley, or the Mission, visit our San Francisco Neighborhood Guides.
What this means for buyers and sellers in San Francisco
- Sellers (single-family): You’re in a strong position — low supply (1.2 months MSI) and fast days on market (14 days) typically support competitive offers. Use targeted marketing to capture buyer urgency.
- Sellers (condo): With 3.1 months of supply and longer time on market, precise pricing and standout presentation matter more than ever.
- Buyers: For single-family homes, be prepared to move quickly and present clean, competitive offers. For condos, you may find more room to negotiate — but watch for neighborhood-specific dynamics.
If you’d like tailored advice for your San Francisco property, our team at Kinoko Real Estate helps buyers and sellers across the city — Feel free to contact our agents to schedule a consultation.
Local Lowdown Data
You May Also Like: