Select a Market Report to Read:
- National Market Update Overview
- Bay Area Report
- North Bay Report
- East Bay Report
- Silicon Valley Report
- San Francisco Report
The Local Lowdown
Quick Take:
- Median sale prices in the East Bay have fallen for six months straight.
- Inventories remain higher on a year-over-year basis as the number of sold listings falls.
- Homes are spending more time on the market, as inventories rise and sale prices fall.
Note: You can find the charts/graphs for the Local Lowdown at the end of this section.
*National Association of REALTORS® data is released two months behind, so we estimate the most recent month's data when possible and appropriate.
Median sale prices continue to fall throughout the East Bay
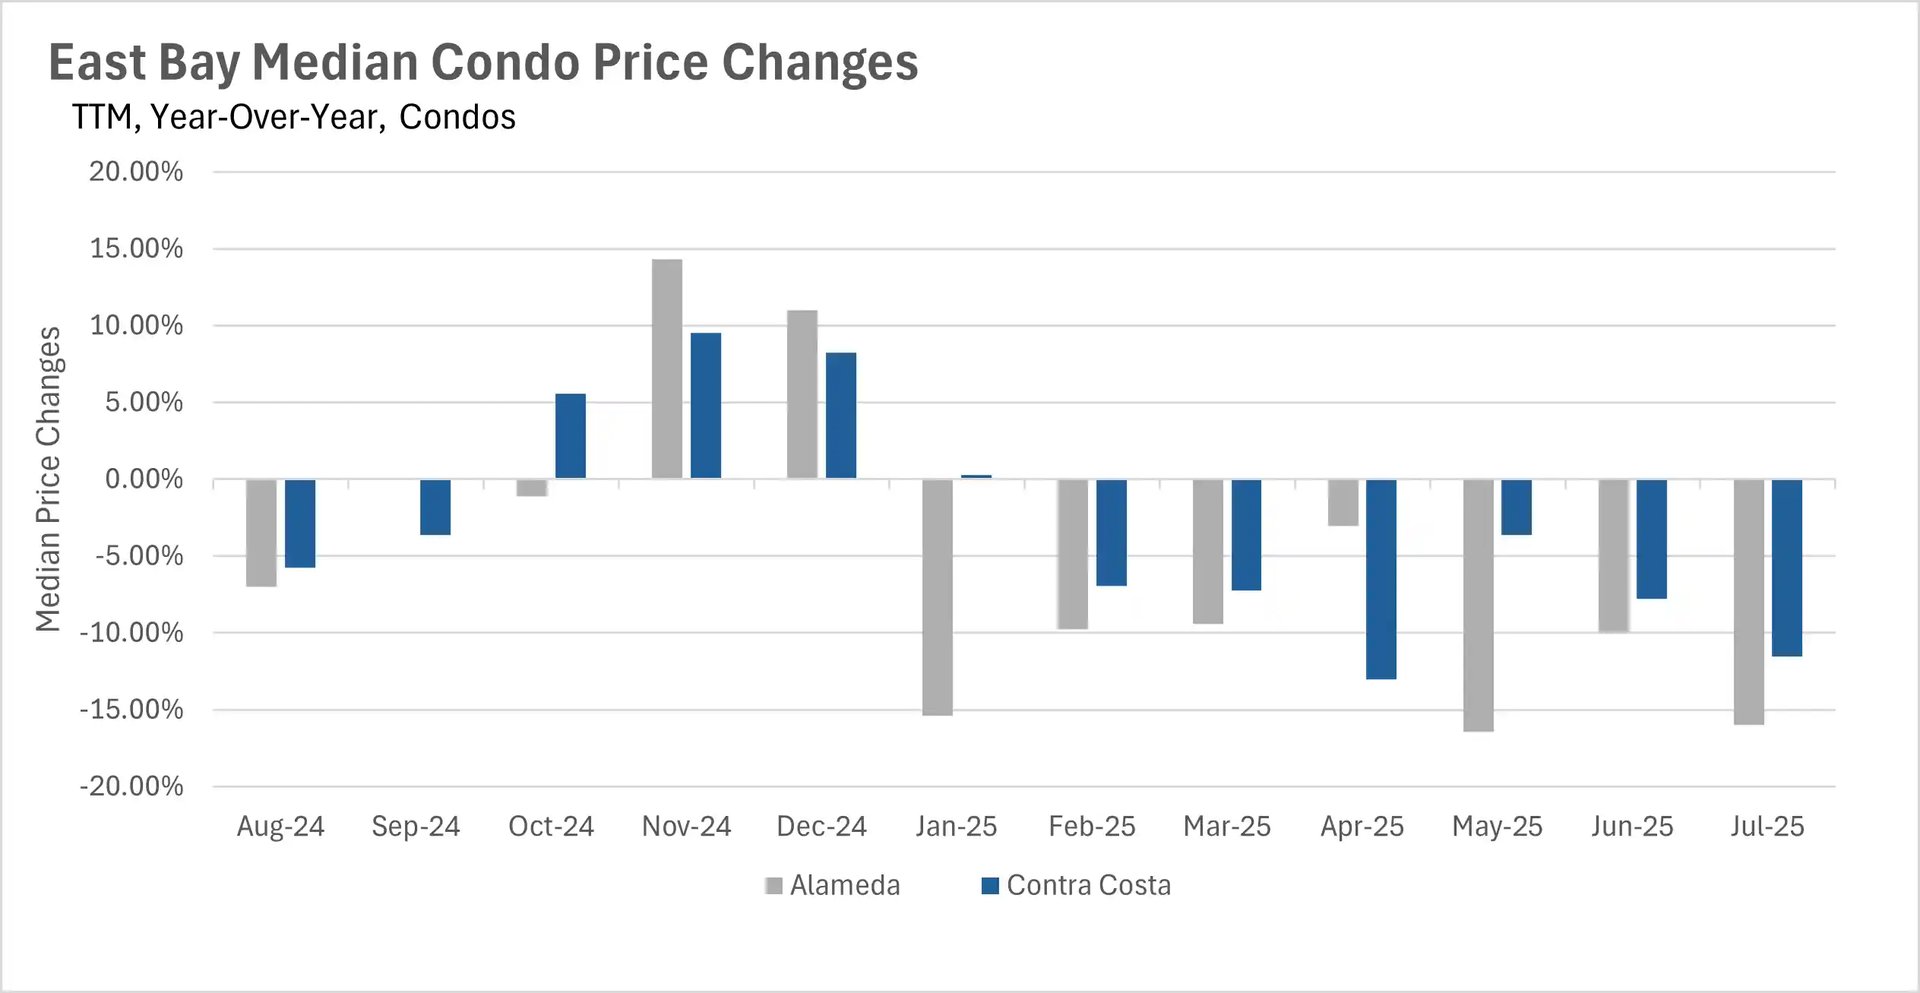
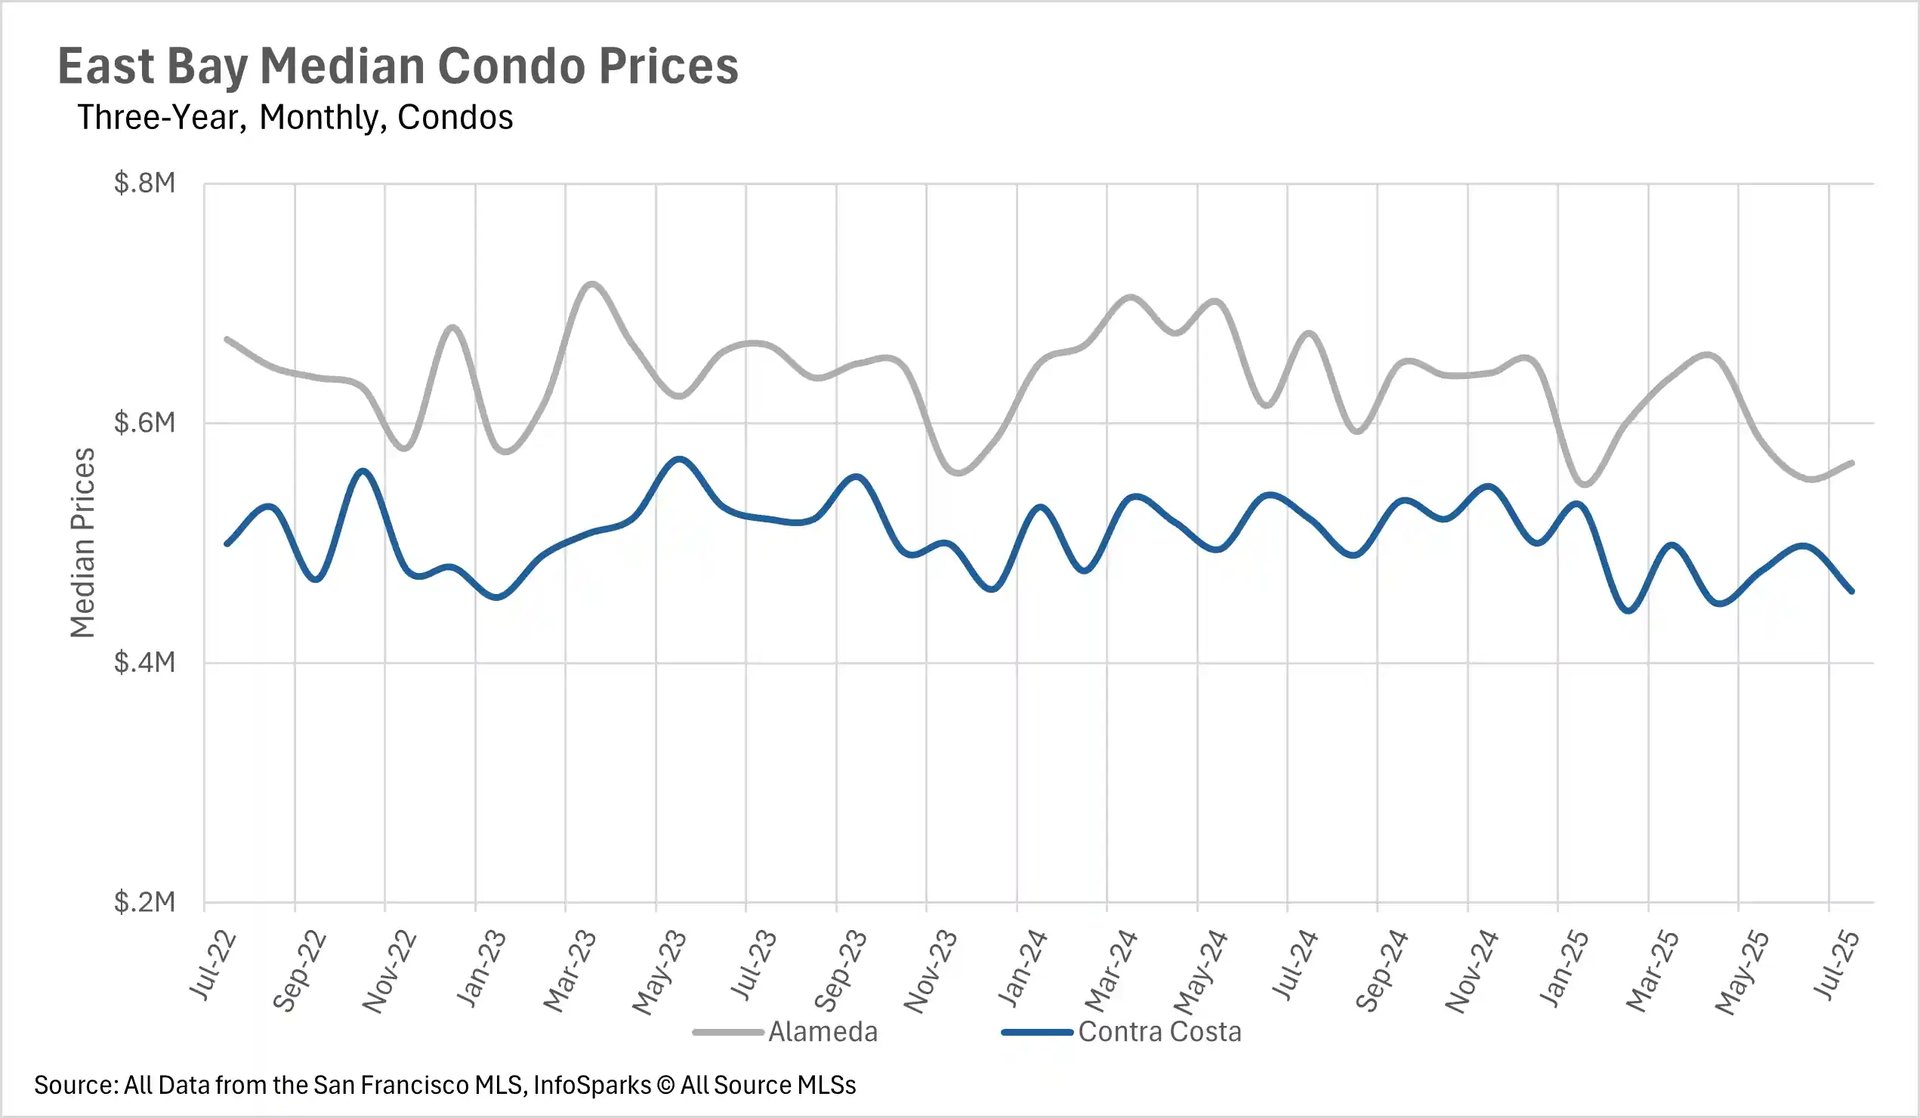
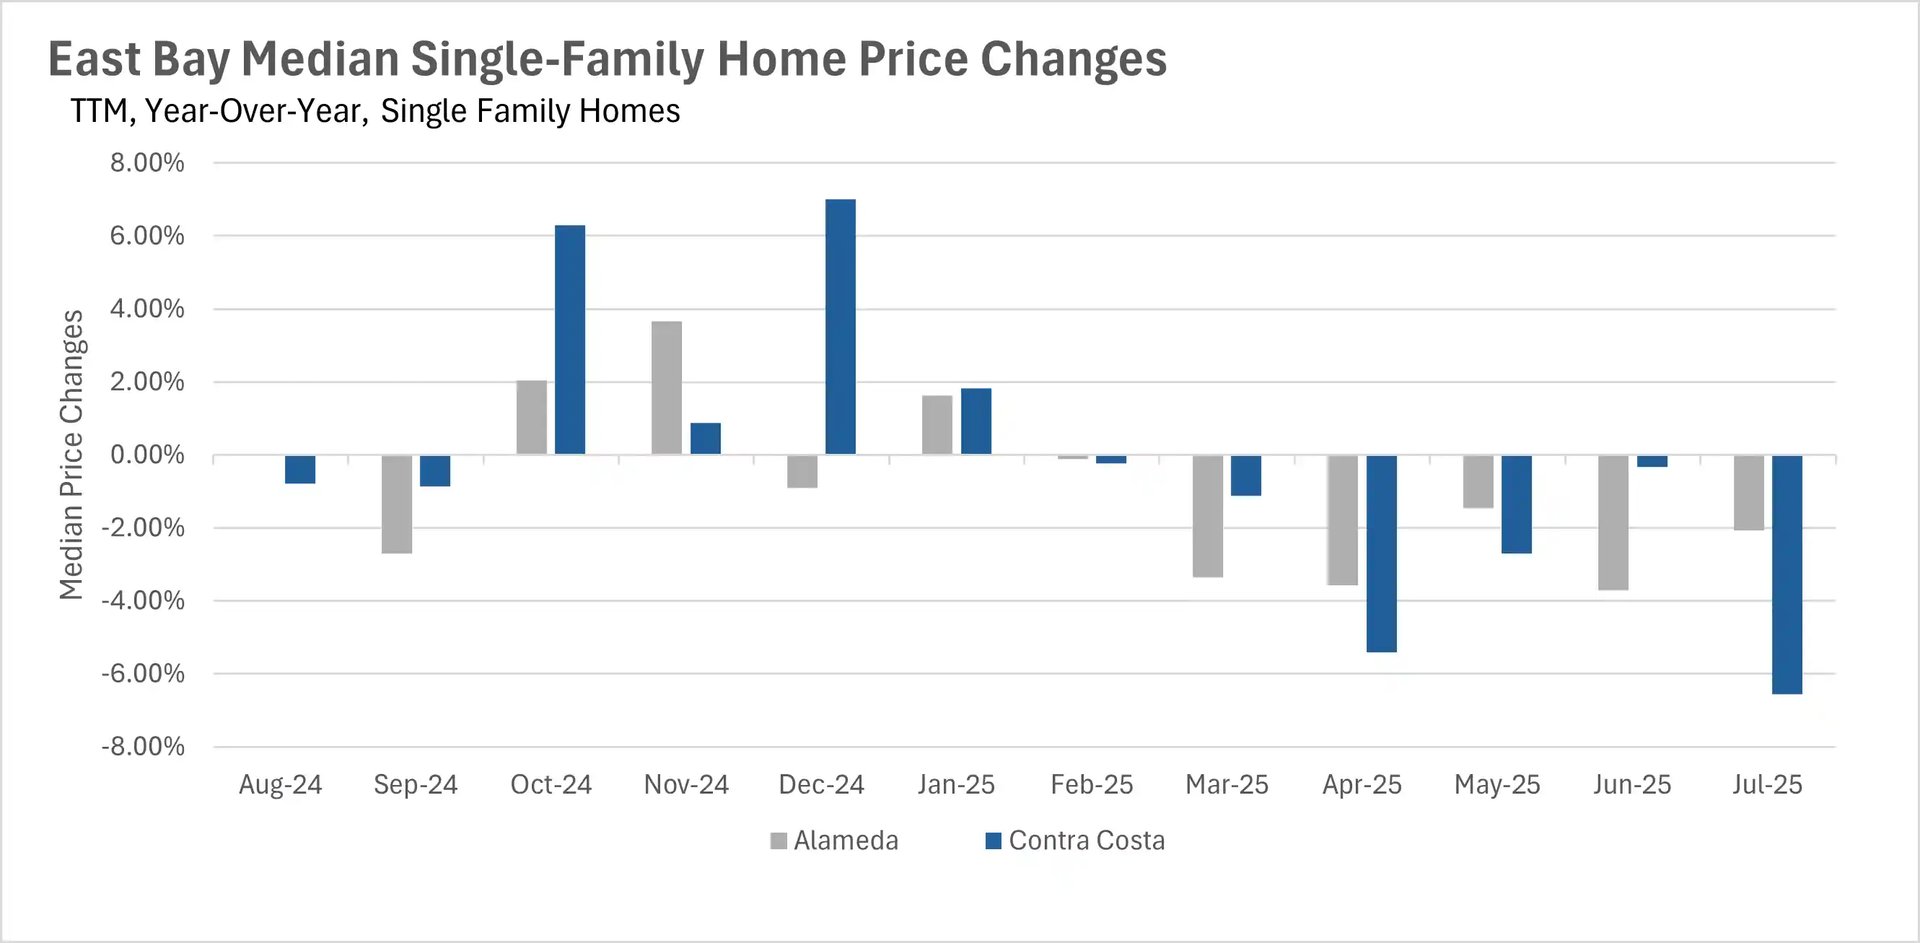
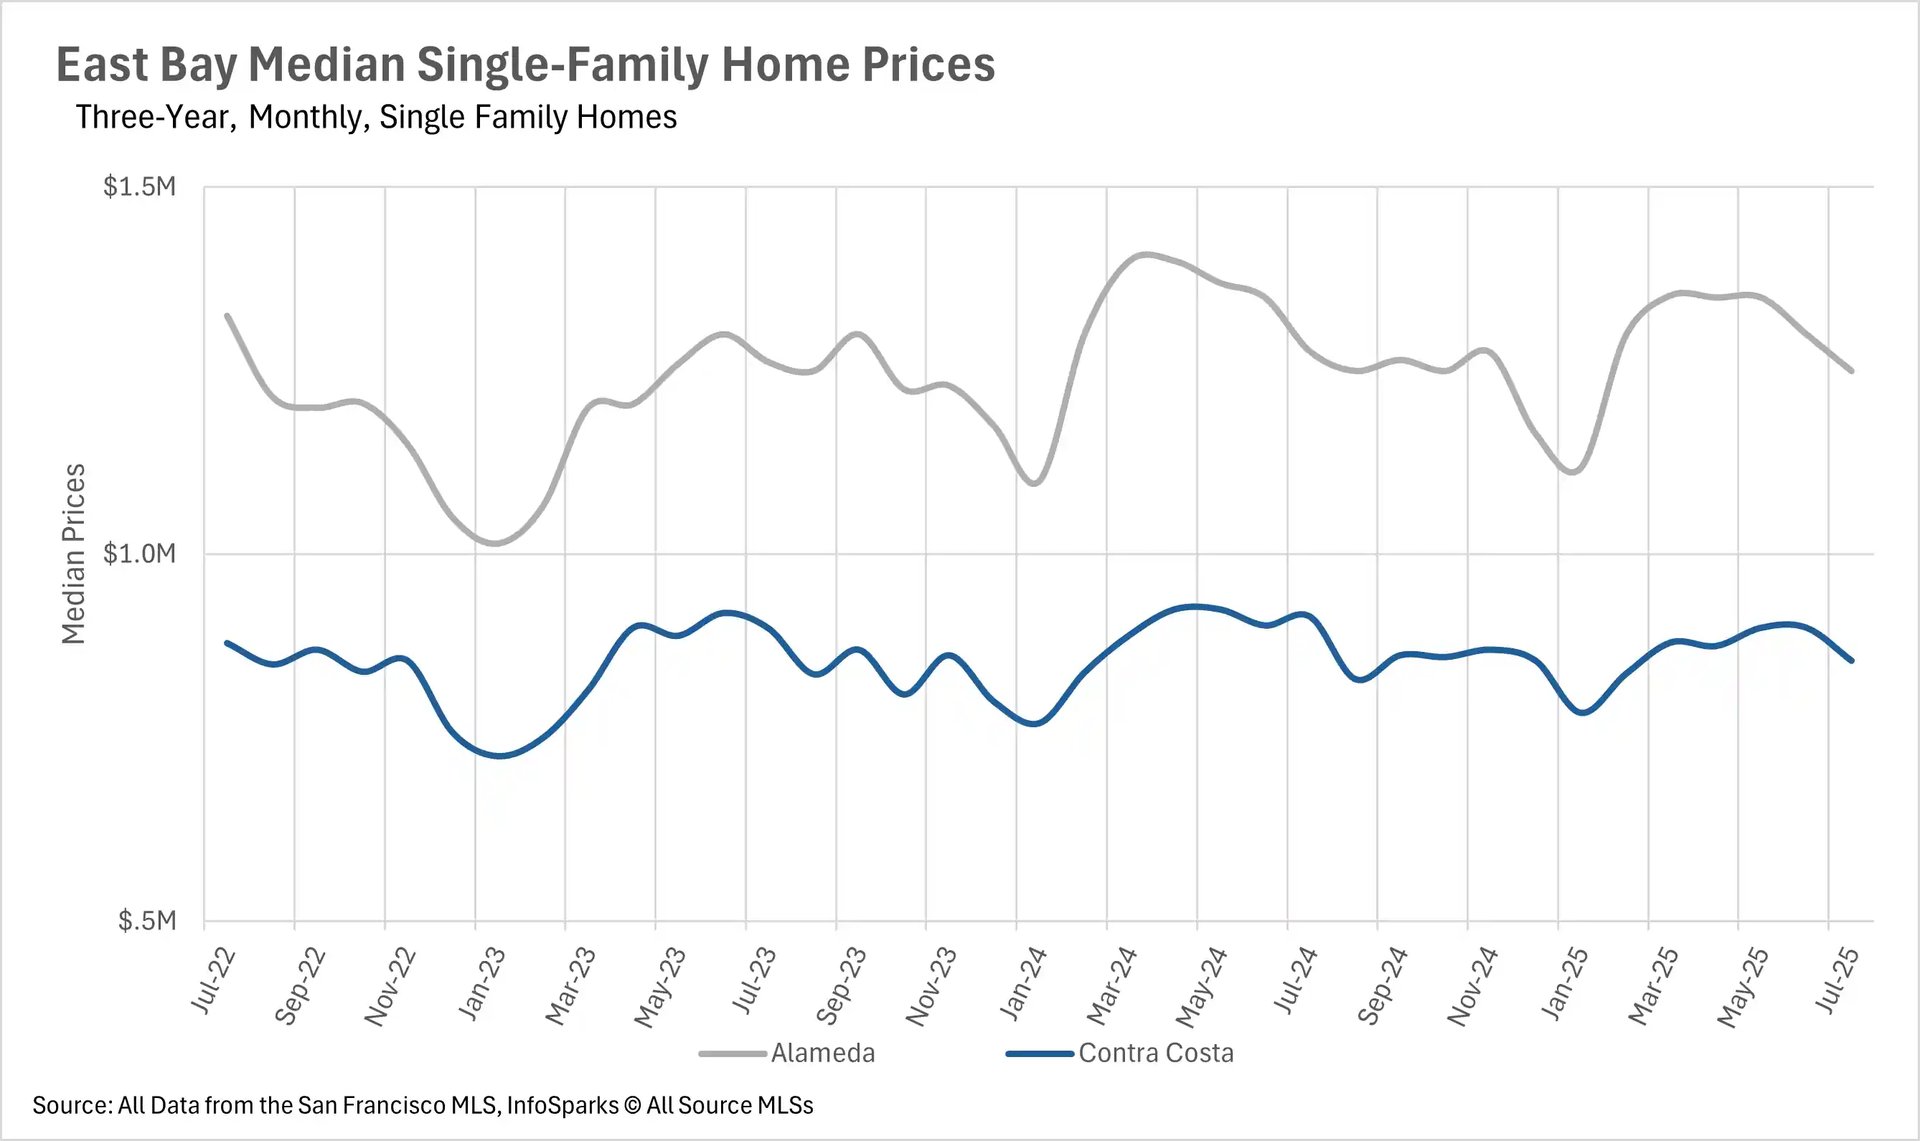
In July, we saw median sale prices in the East Bay fall on a year-over-year basis for the sixth month in a row! Single-family home median sale prices decreased by 2.08% and 6.56% on a year-over-year basis in Alameda and Contra Costa Counties, respectively. We also saw median sale prices for condos decrease by 11.54% in Contra Costa County and 16.00% in Alameda County. However, it is worth noting that although we’ve seen year-over-year declines in median sale prices throughout the East Bay, we are not seeing a downward acceleration, meaning that property values are not in freefall. Instead, they’re maintaining a steady price point that’s several percentage points lower than what homes were selling for last year.
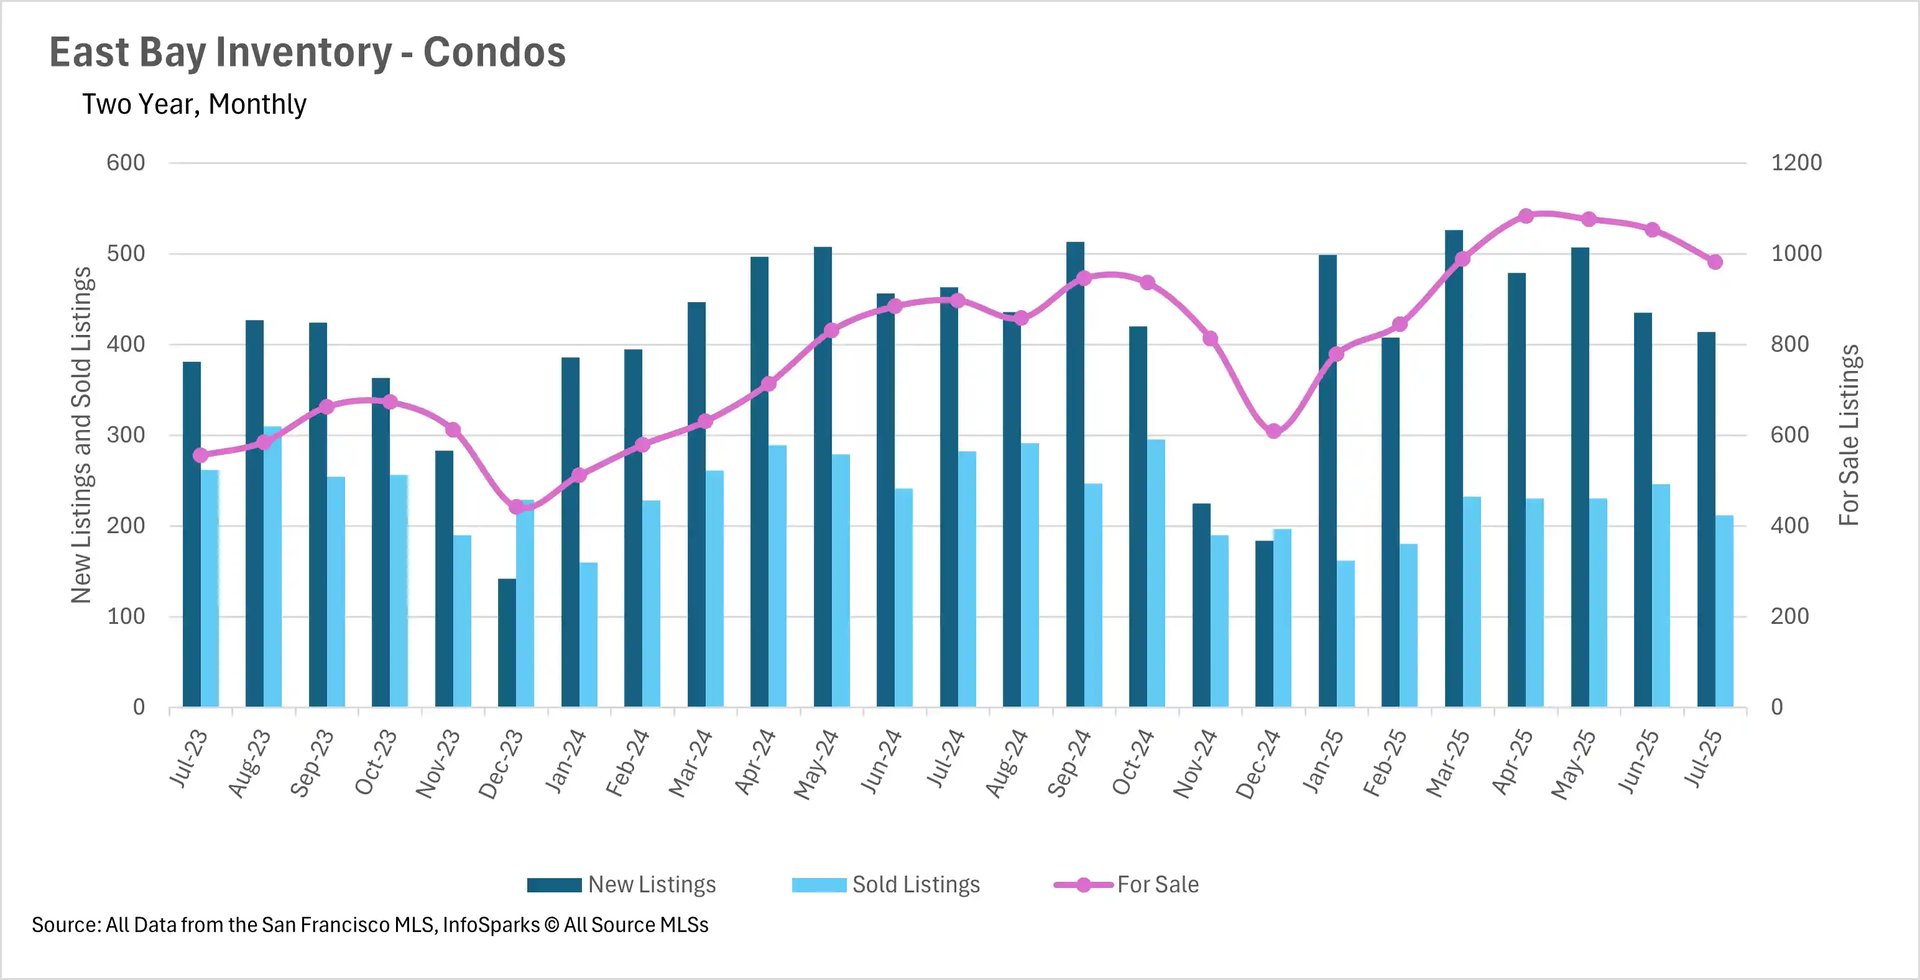
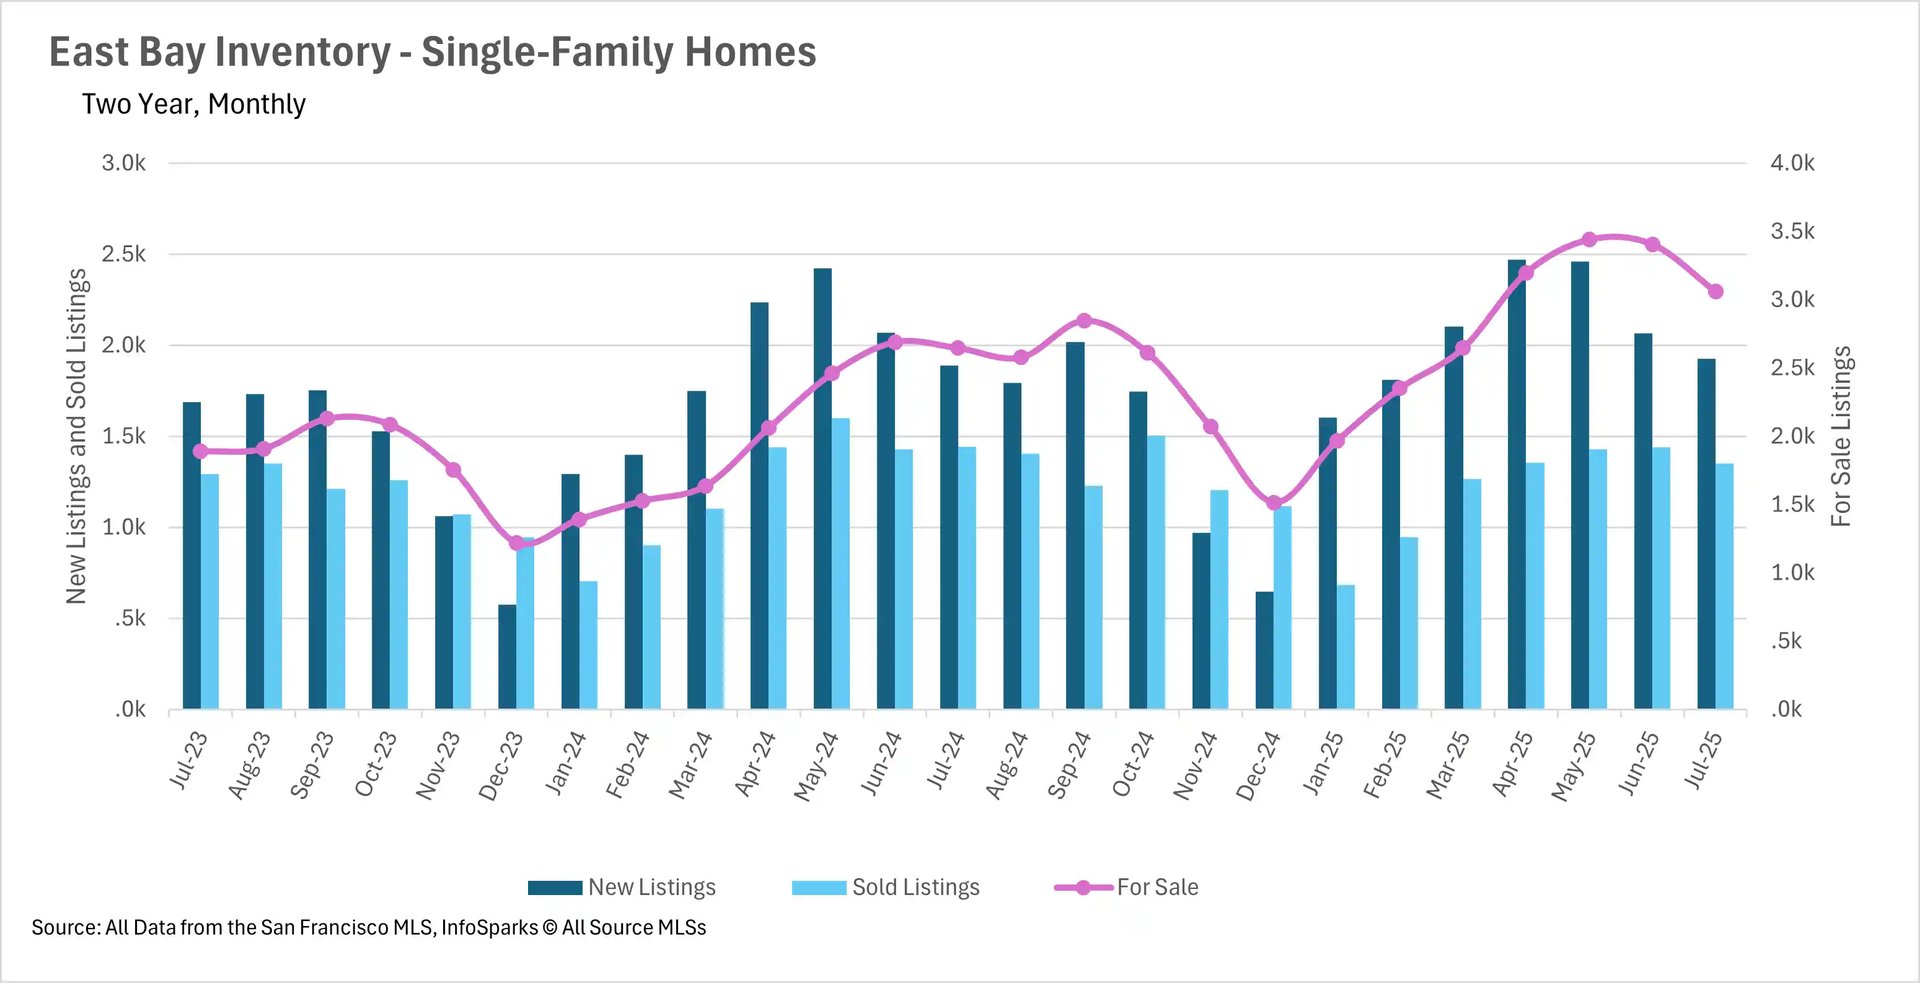
While median sale prices remain low, inventories remain high
The cause of the decrease in median sale prices that we’ve seen over the past six months is more than likely the recent spike in inventory, combined with a decrease in the number of listings being sold. In July, the single-family home market saw a 6.17% decrease in the number of sold listings and a 15.68% increase in the number of active listings on the market on a year-over-year basis. Likewise, the condo market saw a 24.82% decrease in the number of sold listings and a 9.48% increase in the number of active listings. It’s also worth noting that there were 10.58% fewer new condo listings on a year-over-year basis as well!
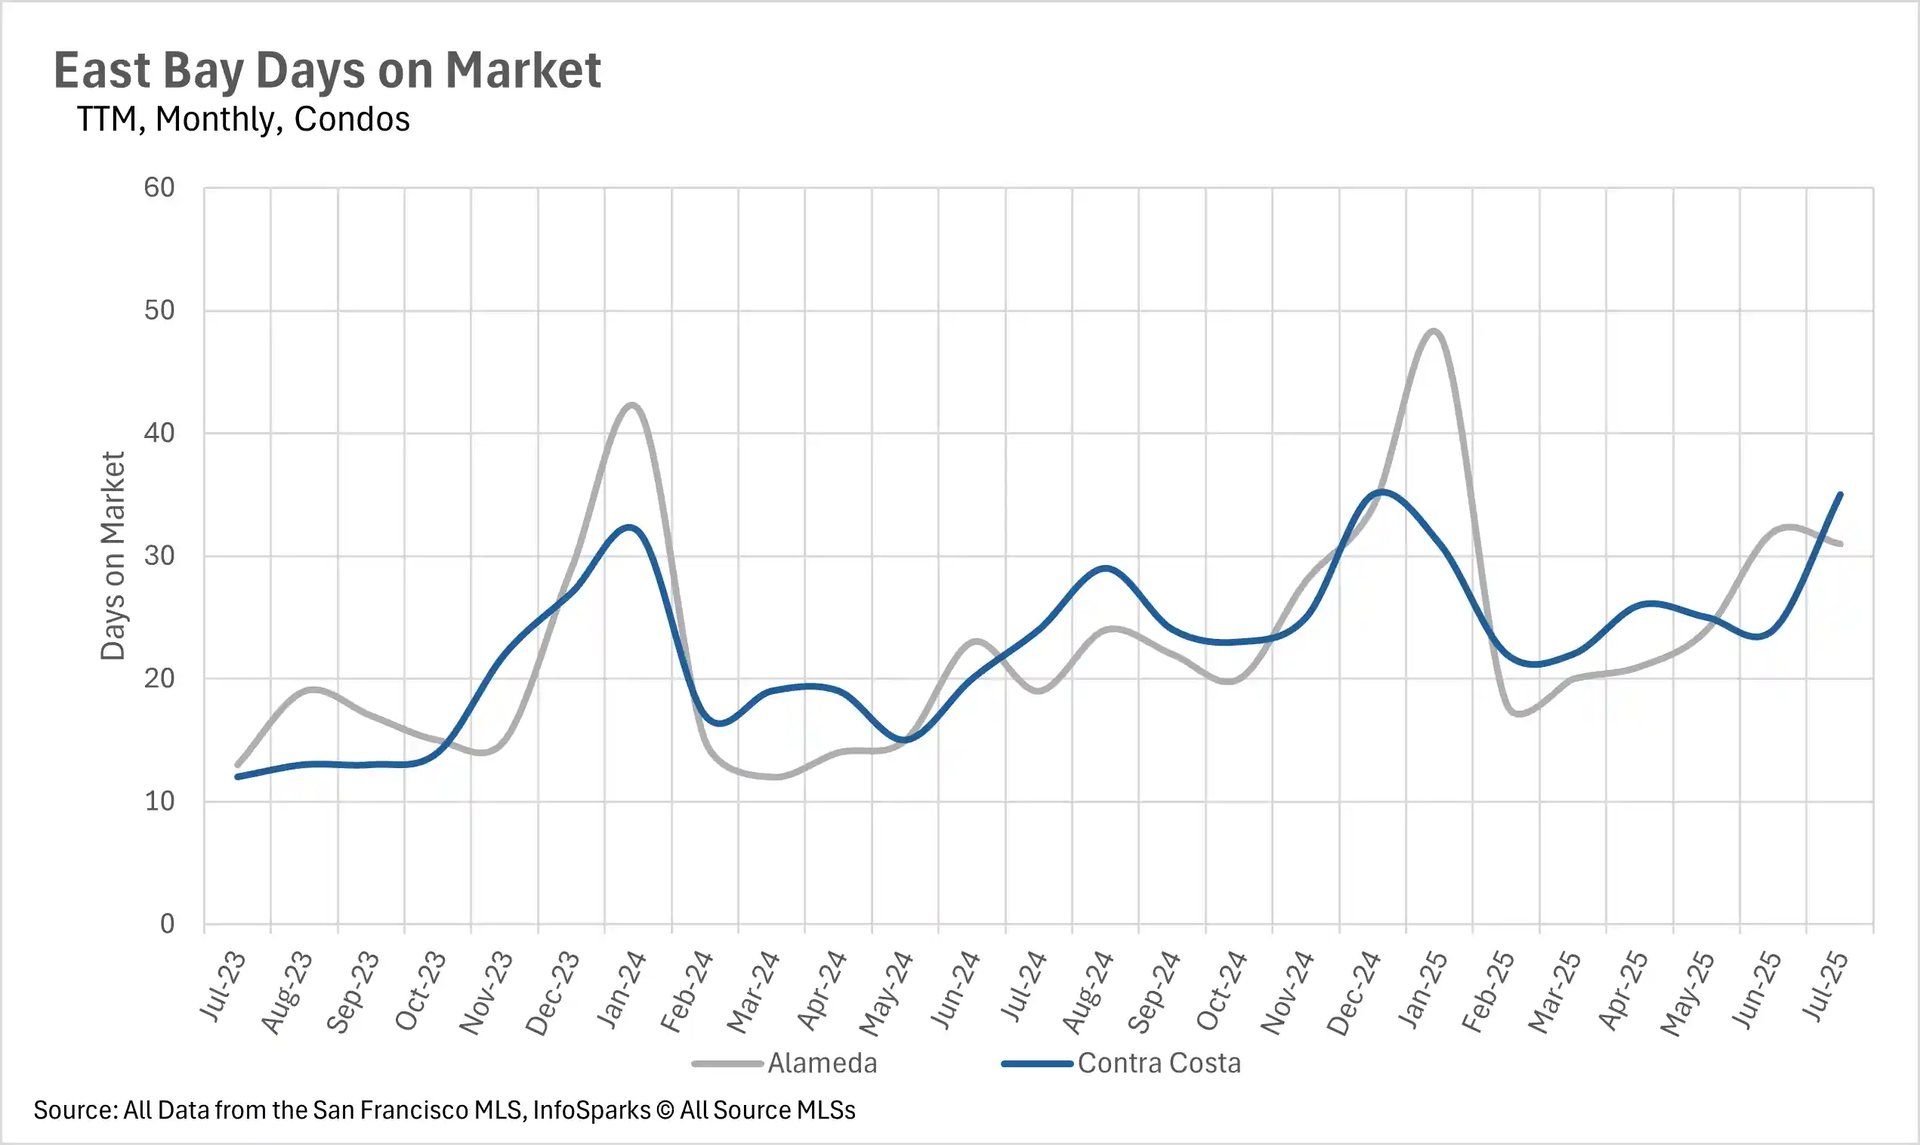
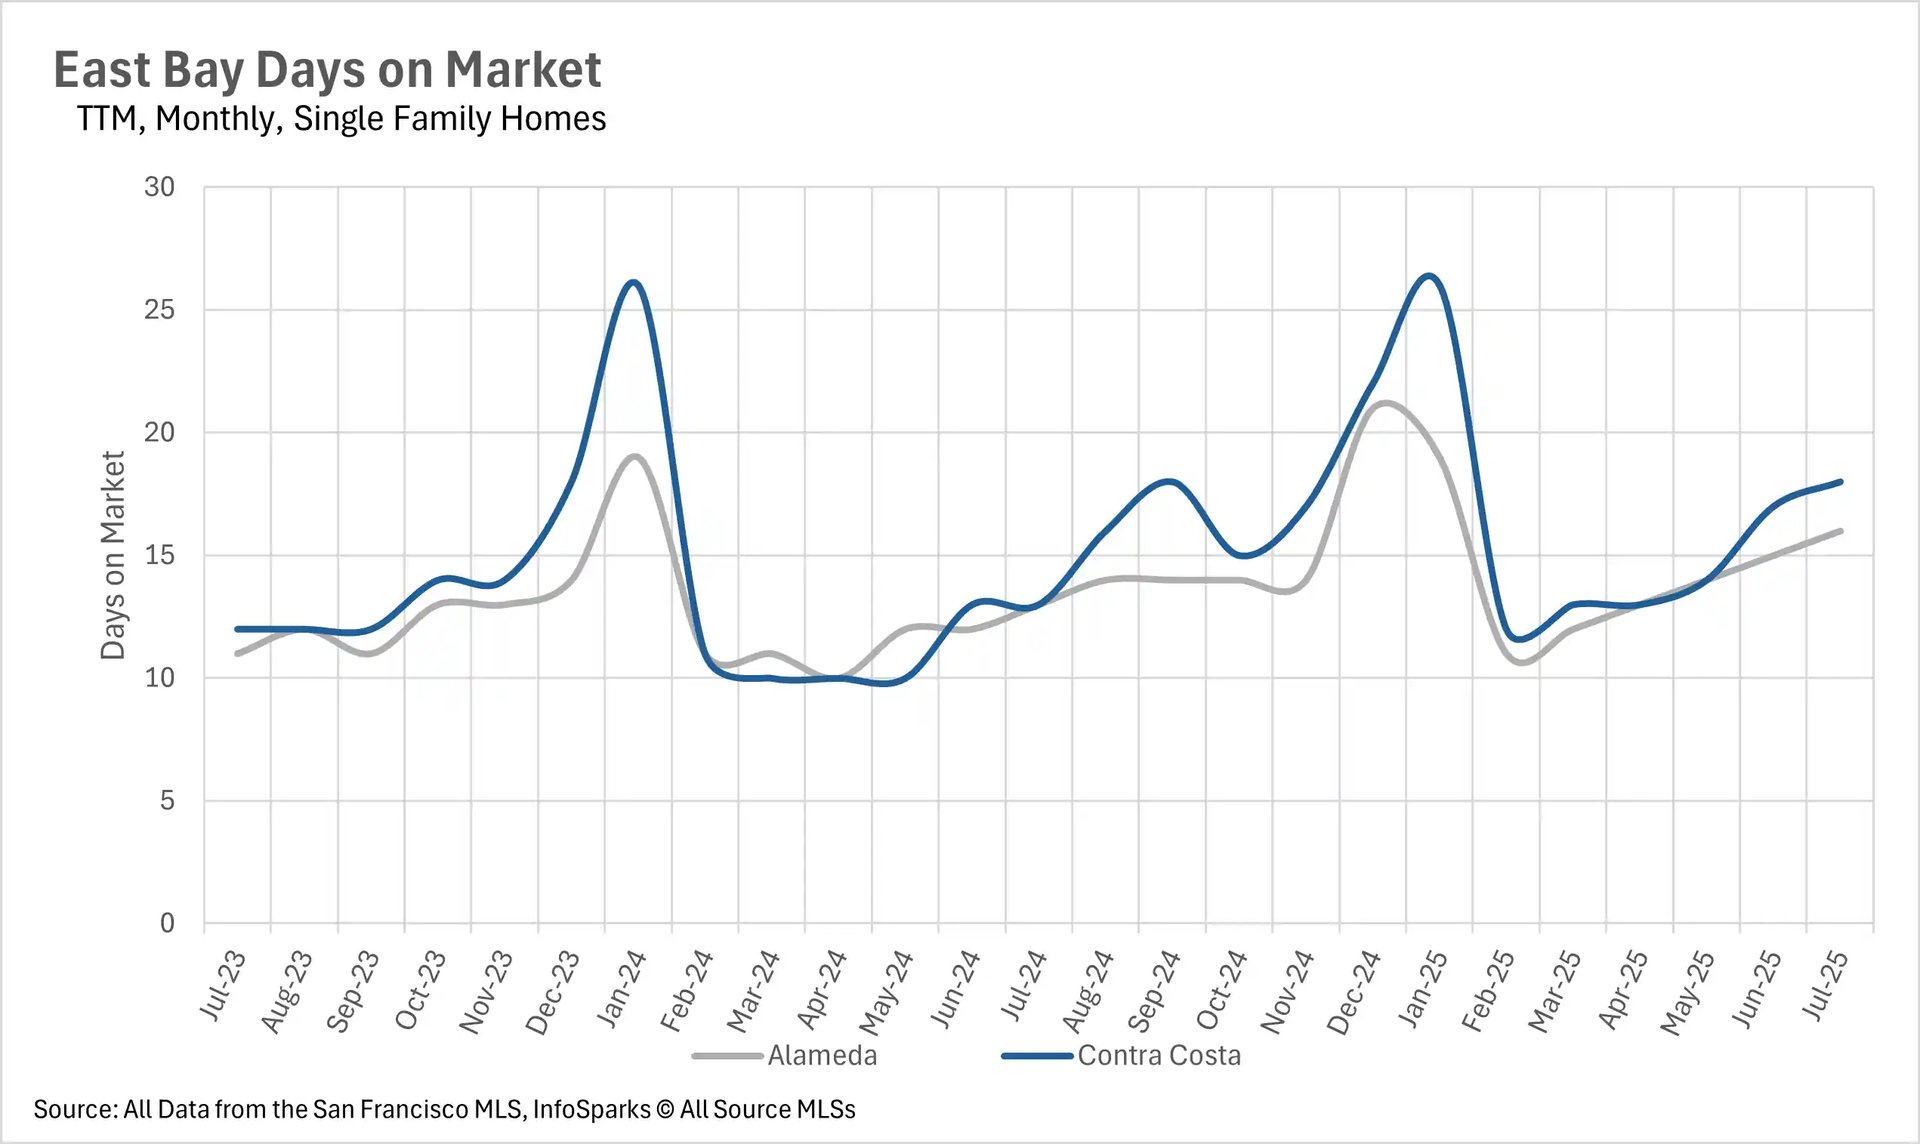
As inventories rise, listings are spending considerably more time on the market
Last month, we saw a pretty substantial increase in the number of days that listings are spending on the market. Historically, inventory has moved very quickly in the East Bay, but as of July, the average single-family home is spending 16 days on the market in Alameda County and 18 days on the market in Contra Costa County, compared to homes spending 13 days on the market in both counties in July 2024. Condos are spending even more time on the market, with the average Alameda County condo spending 31 days on the market and the average Contra Costa County condo spending 35 days on the market, compared to 19 and 24 days on the market in July of 2024.
The single-family home market remains a seller's market, and the condo market continues to be a buyer's market
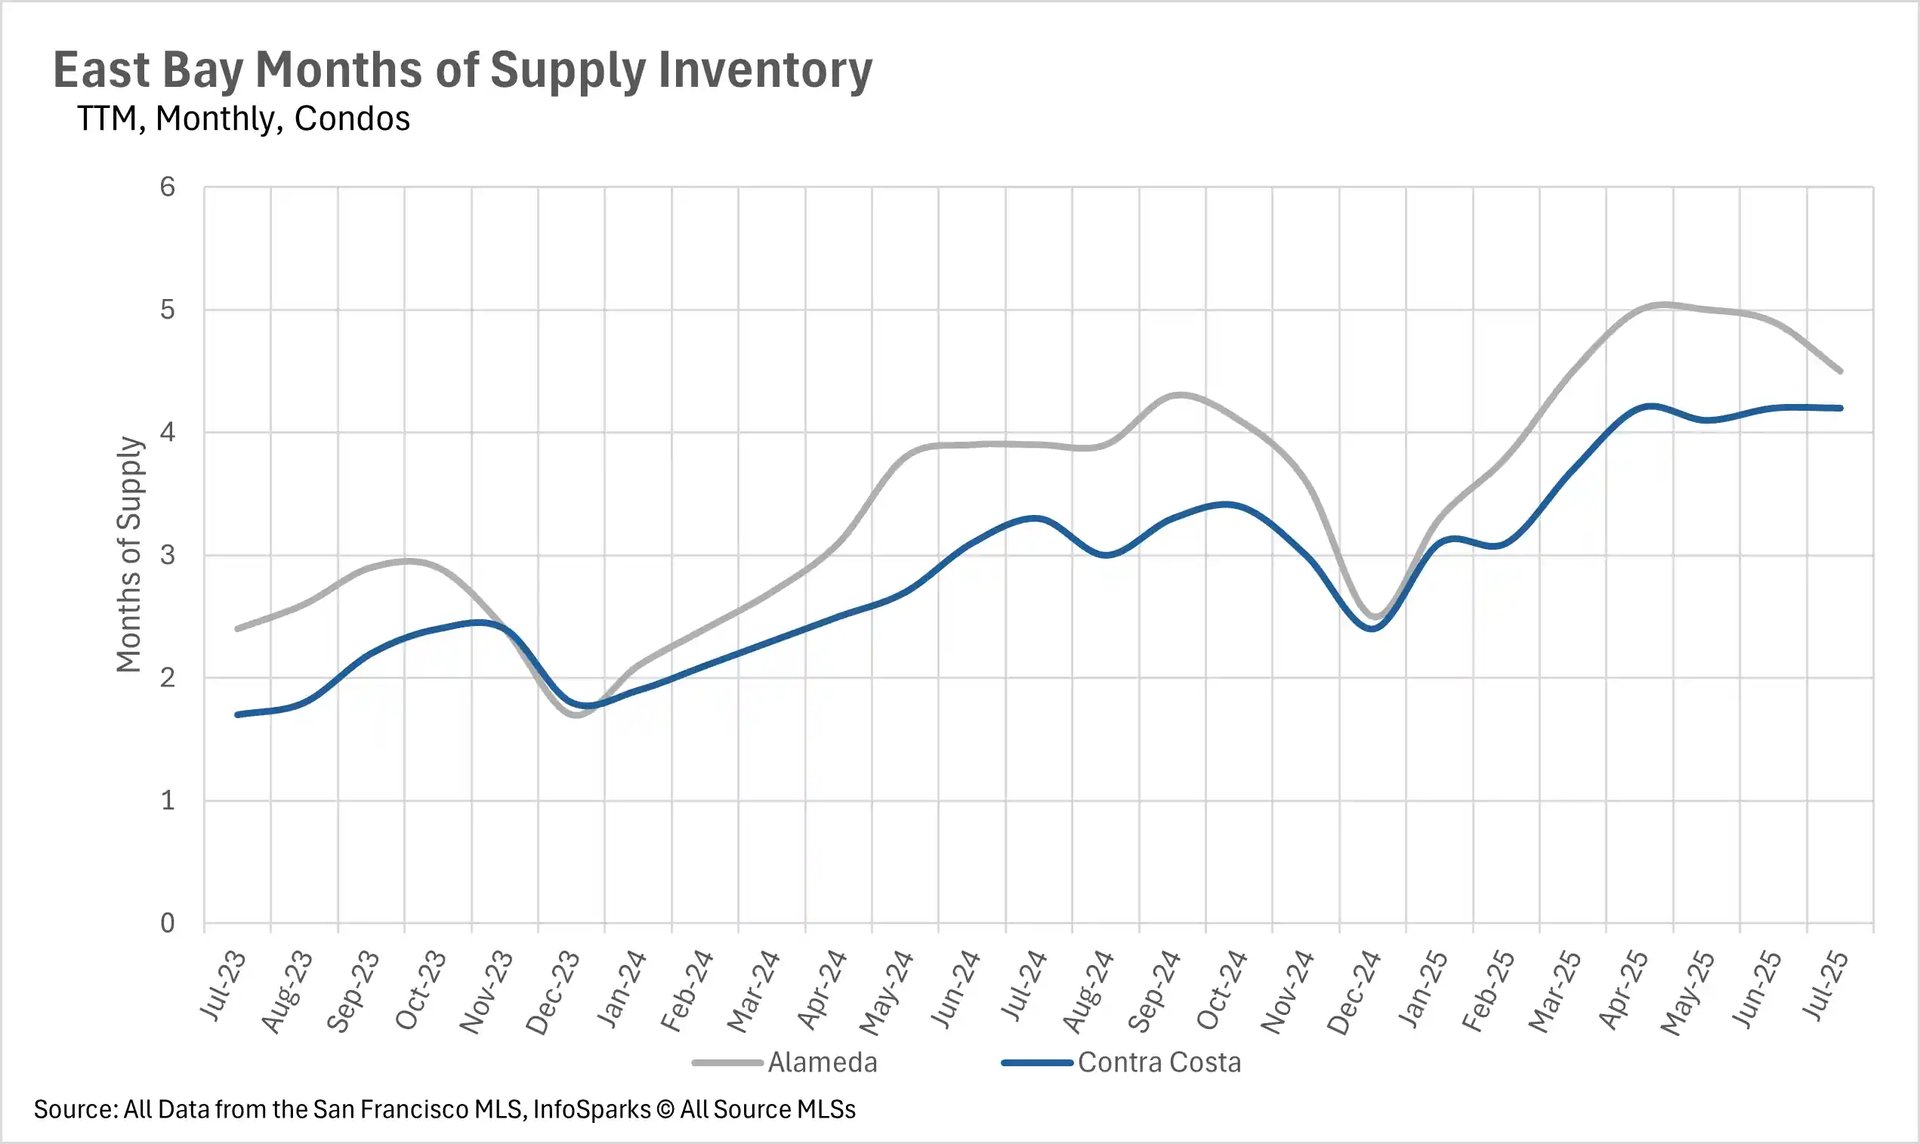
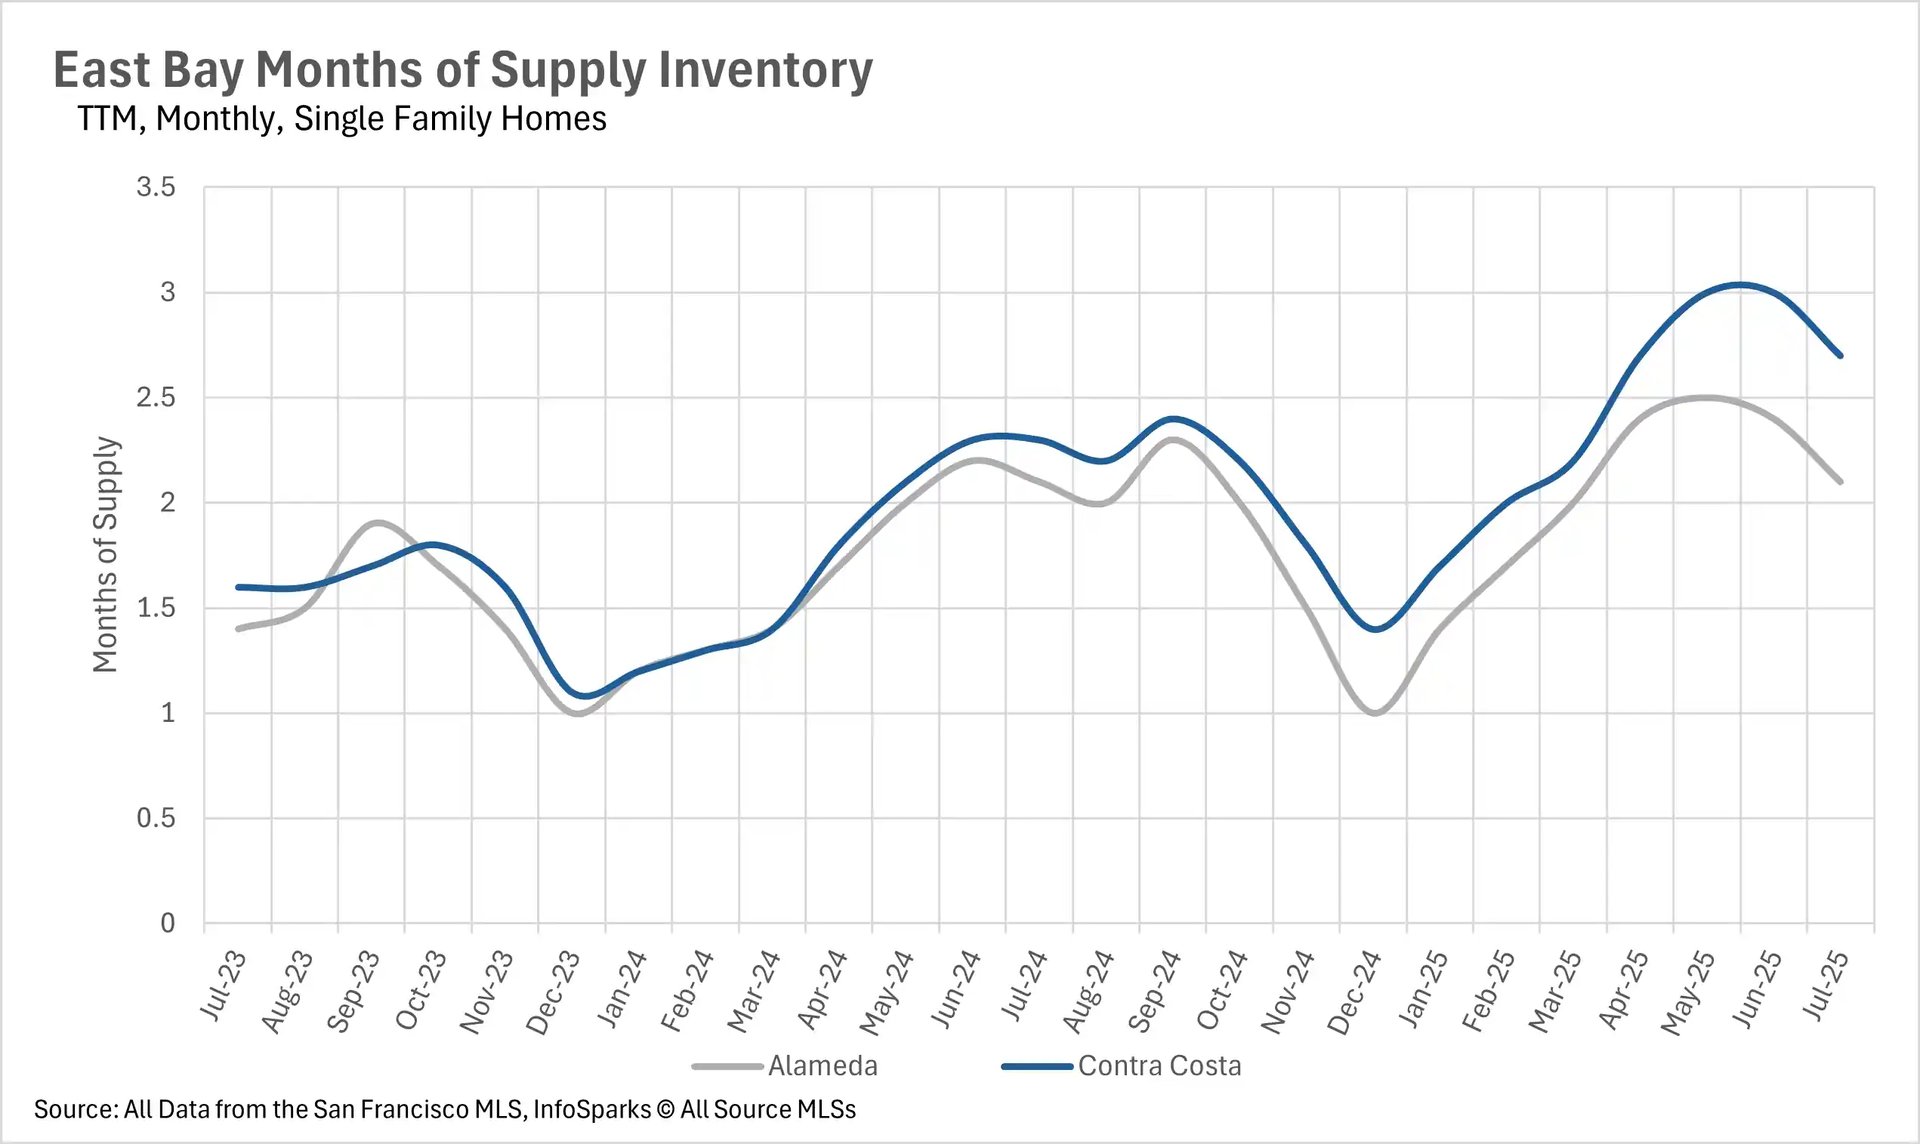
When determining whether a market is a buyers’ market or a sellers’ market, we look to the Months of Supply Inventory (MSI) metric. The state of California has historically averaged around three months of MSI, so any area with at or around three months of MSI is considered a balanced market. Any market that has lower than three months of MSI is considered a seller’s market, whereas markets with more than three months of MSI are considered buyer’s markets.
Despite rising inventories and falling prices, the single-family home market within the East Bay remains a seller's market, with 2.1 and 2.7 months of supply on the market in Alameda and Contra Costa Counties, respectively. On the flip side, the condo market remains a buyer's market, with Alameda and Contra Costa Counties having 4.5 and 4.2 months' worth of condo supply on the market.