Silicon Valley Lights

Silicon Valley Real Estate Market Report - August 2025

Select a Market Report to Read:

The Local Lowdown

Quick Take

  • Median sale prices in Santa Clara County continue their impressive growth streak
  • Inventories remain higher on a year-over-year basis
  • Listings are spending more time on the market across the board

Note: You can find the charts/graphs for the Local Lowdown at the end of this section.

*National Association of REALTORS® data is released two months behind, so we estimate the most recent month's data when possible and appropriate.

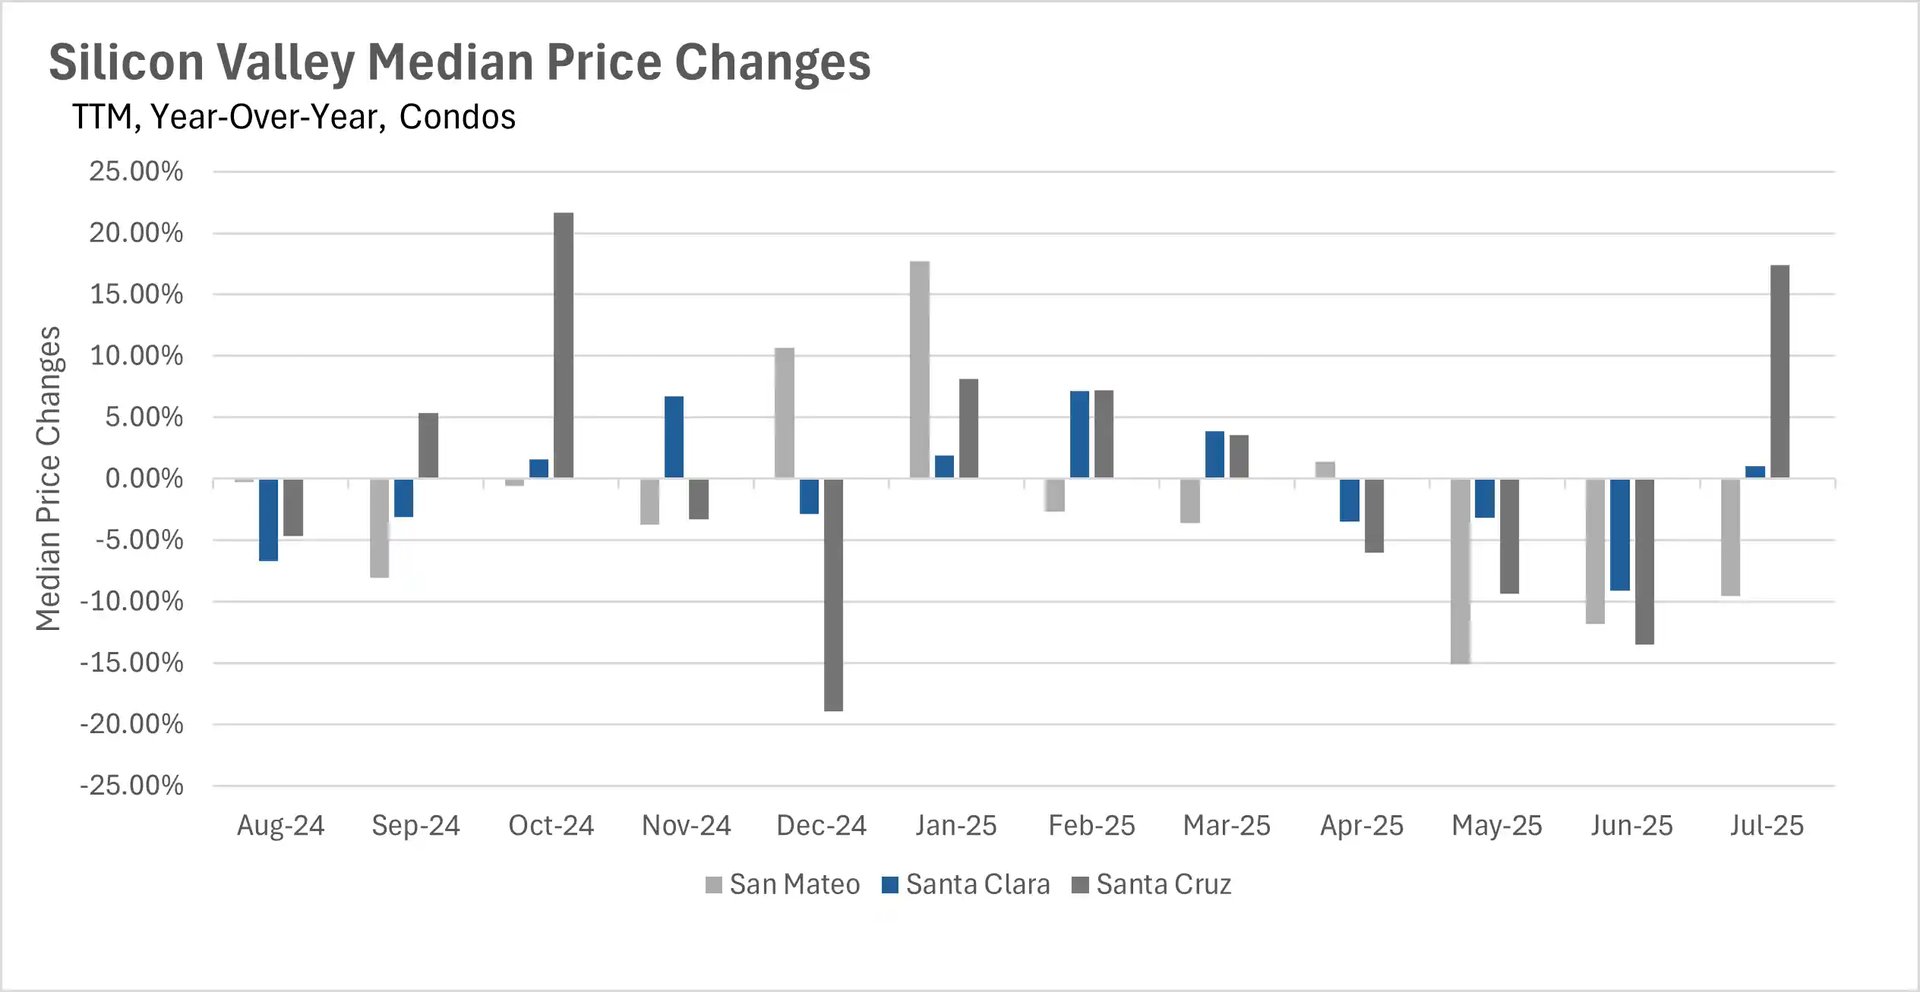
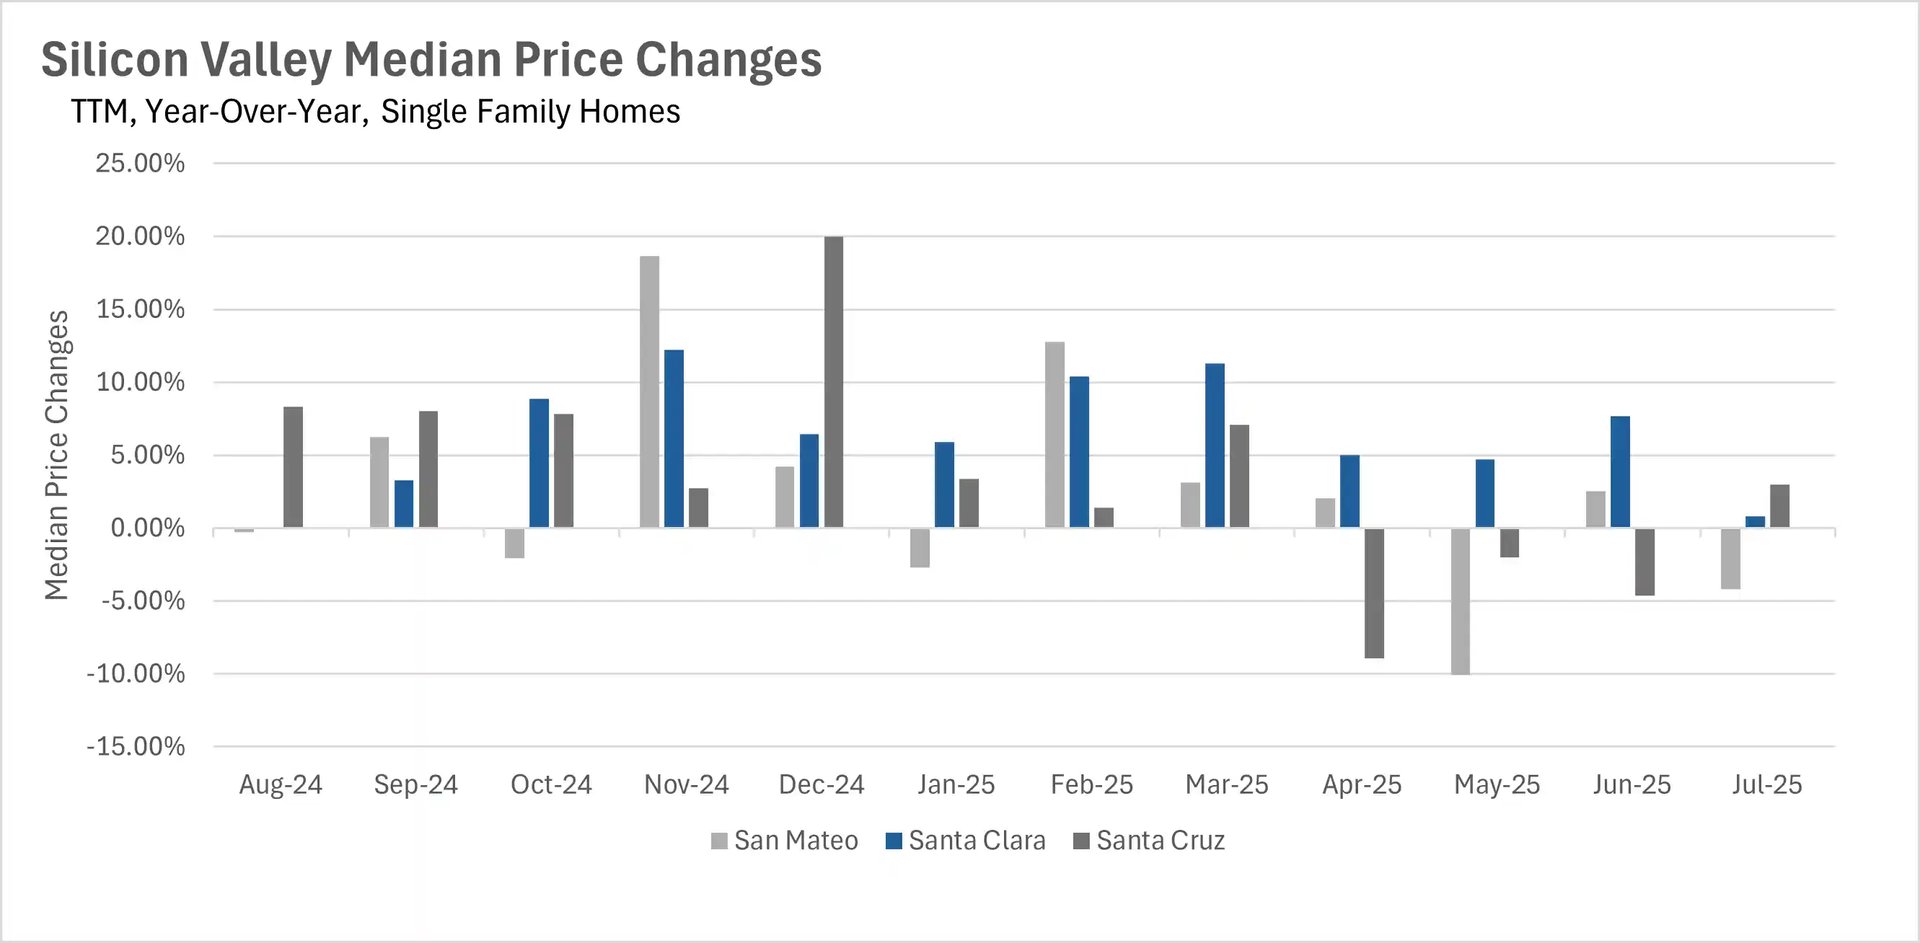
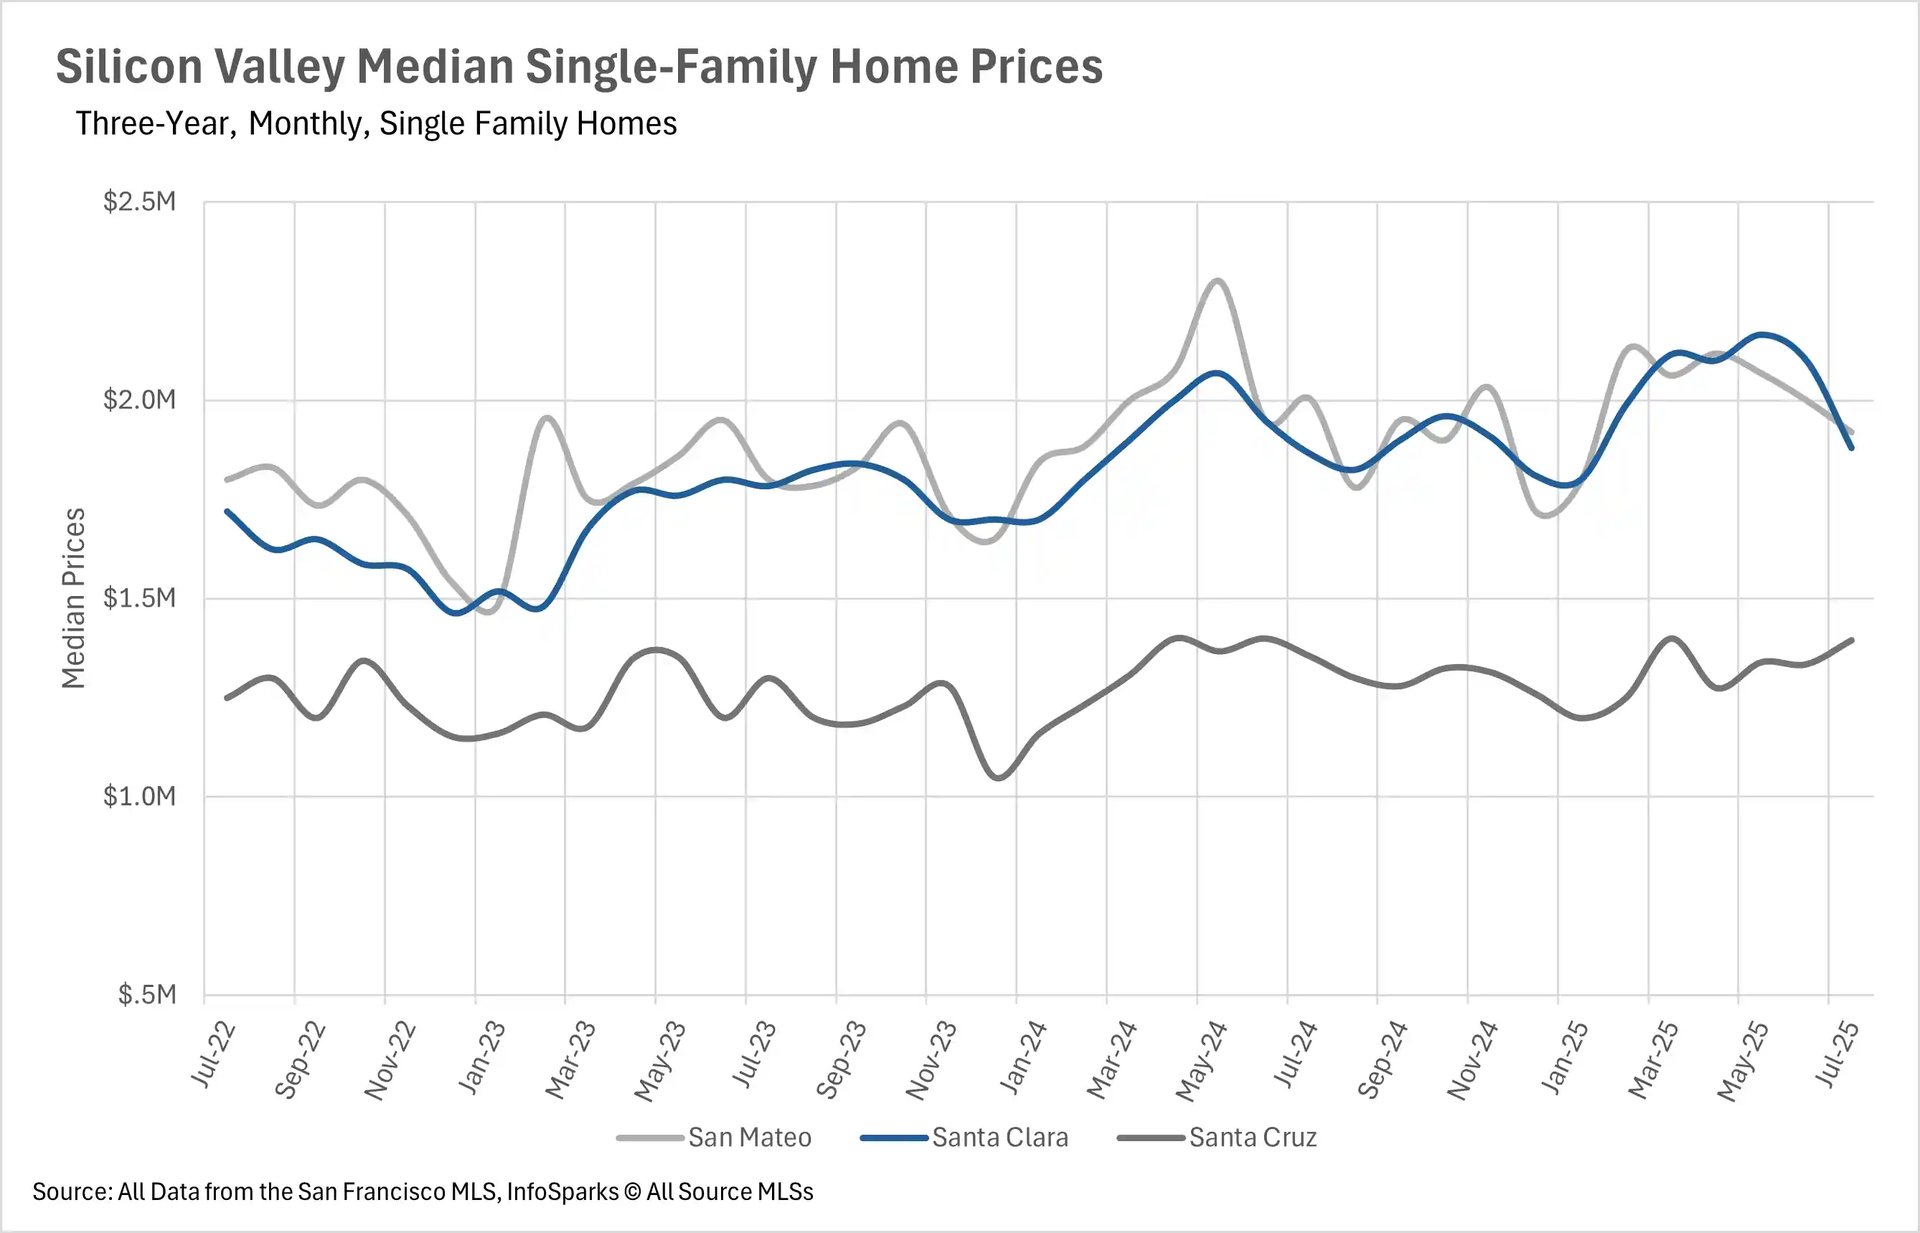
Santa Clara County median sale prices haven’t decreased in more than 12 months

While median sale prices have remained incredibly resilient throughout Silicon Valley, the single-family home market in Santa Clara County has remained incredibly strong. In fact, we haven’t seen median sale prices for single-family homes in Santa Clara County decrease on a year-over-year basis in more than a year. This steady up and to the right trajectory is astounding, given the inventory headwinds that the real estate market has experienced lately. However, it is worth noting that while Santa Clara County real estate has performed spectacularly, the entire Silicon Valley has more than retained its value throughout the same time period.

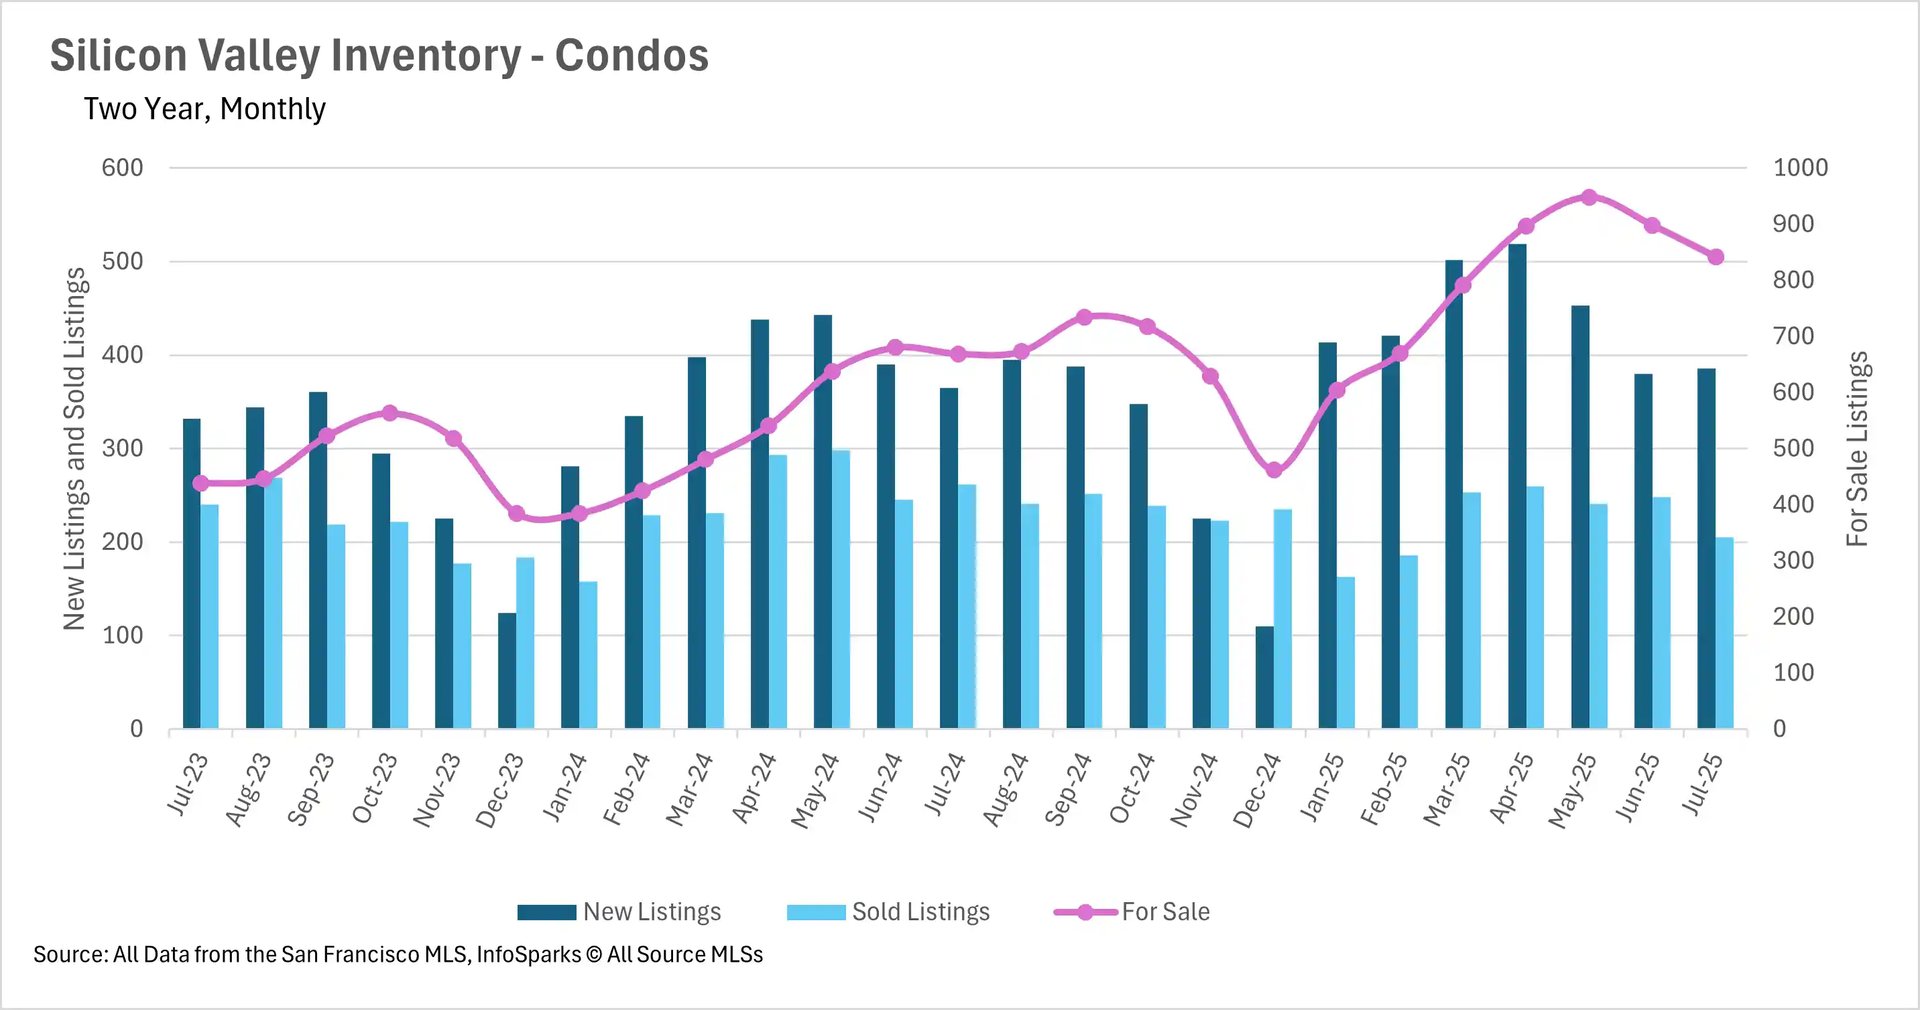
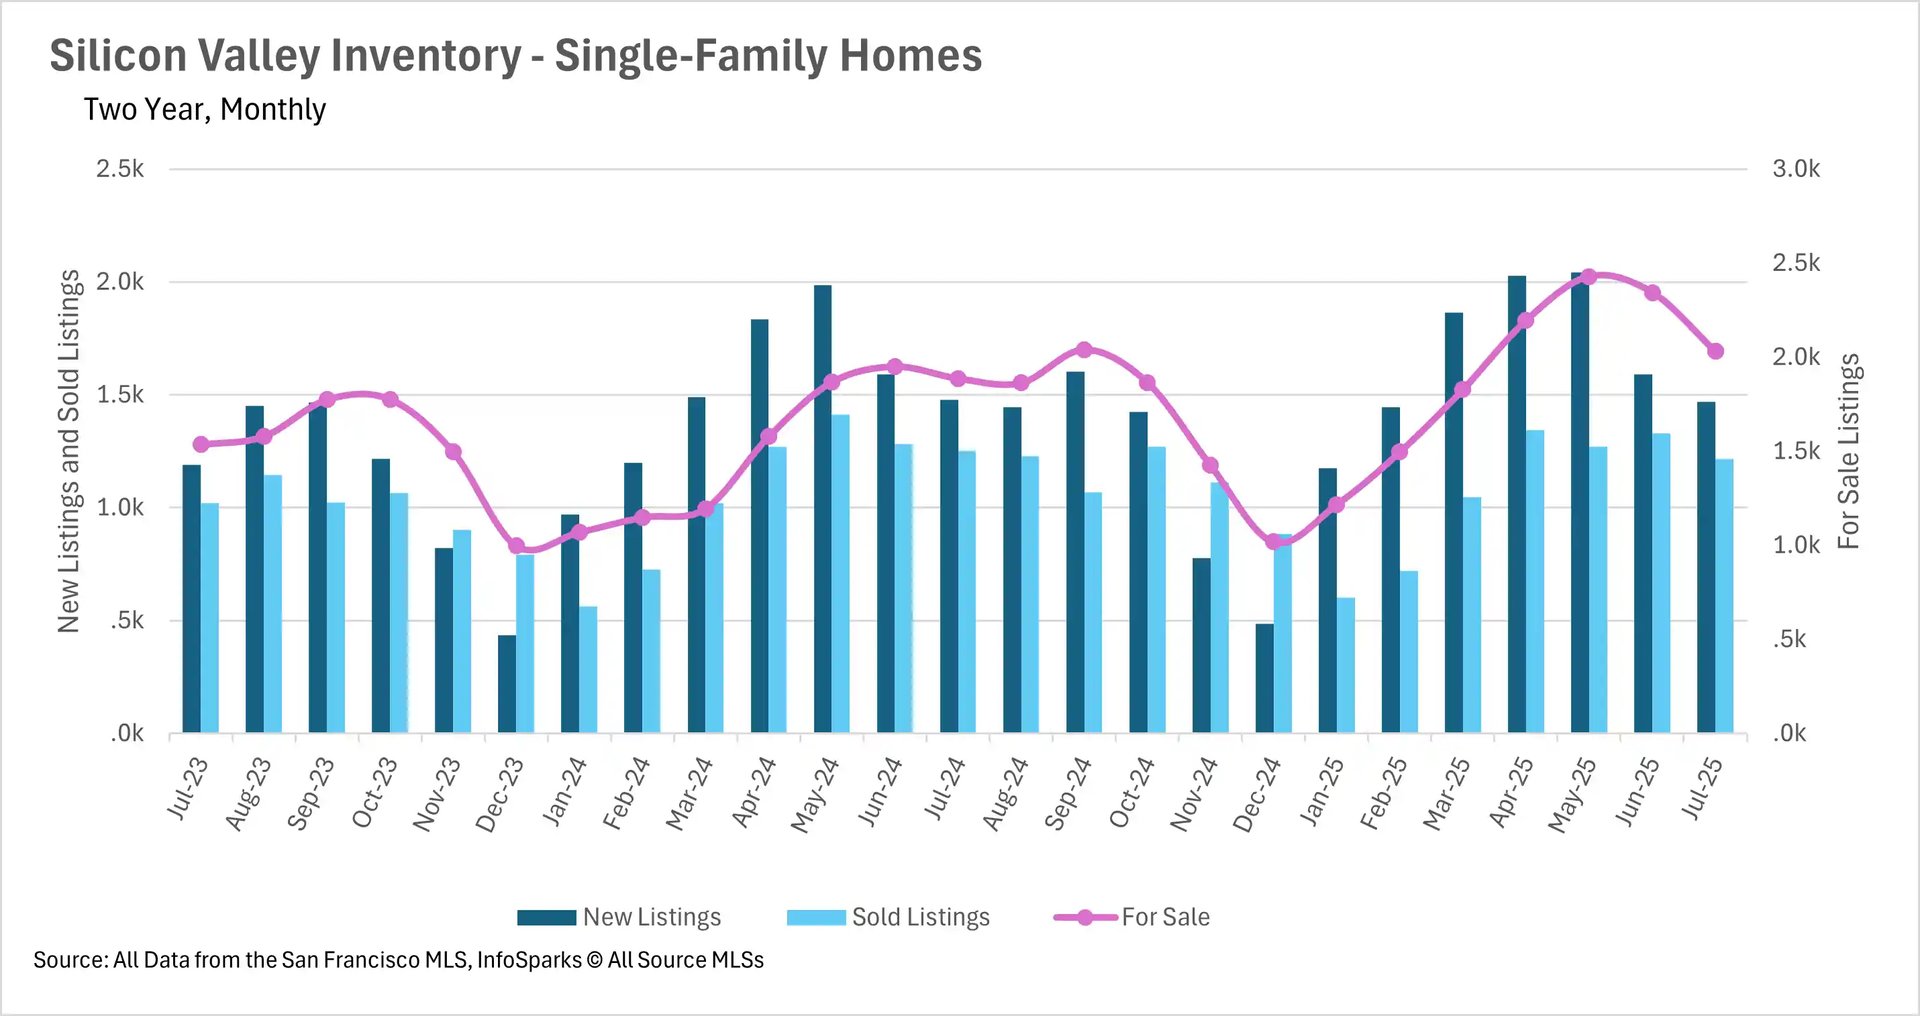
Inventories grow as fewer homes sell throughout Silicon Valley

Although median sale prices are holding strong in Silicon Valley, the area is experiencing the same phenomenon that much of the Bay Area is seeing. That phenomenon is the rise in inventories! The Silicon Valley single-family home market had 7.63% more inventory on the market in July on a year-over-year basis. The condo market saw an even steeper 25.86% increase. These increases can largely be attributed to the fact that homes aren’t selling as quickly as they were last year. In July, there were 2.64% fewer single-family homes sold and 21.76% fewer condos sold when compared to last year!

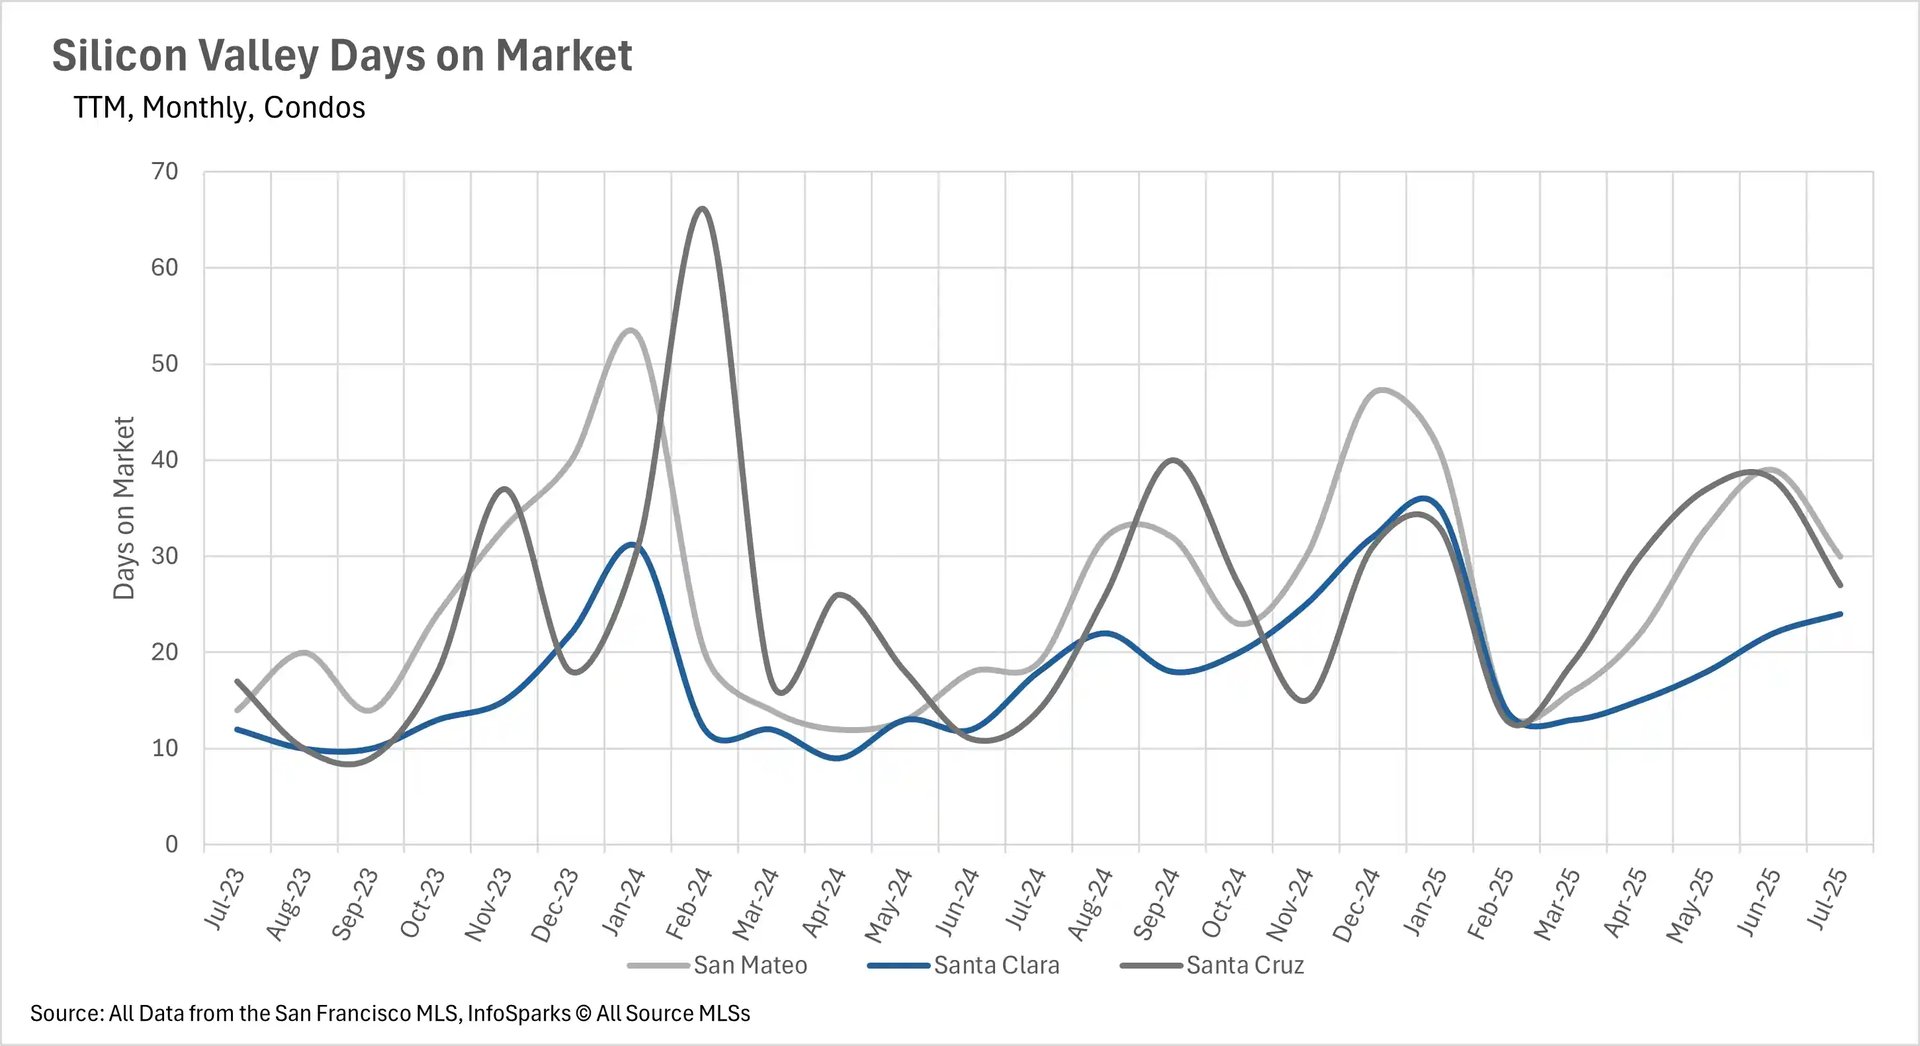
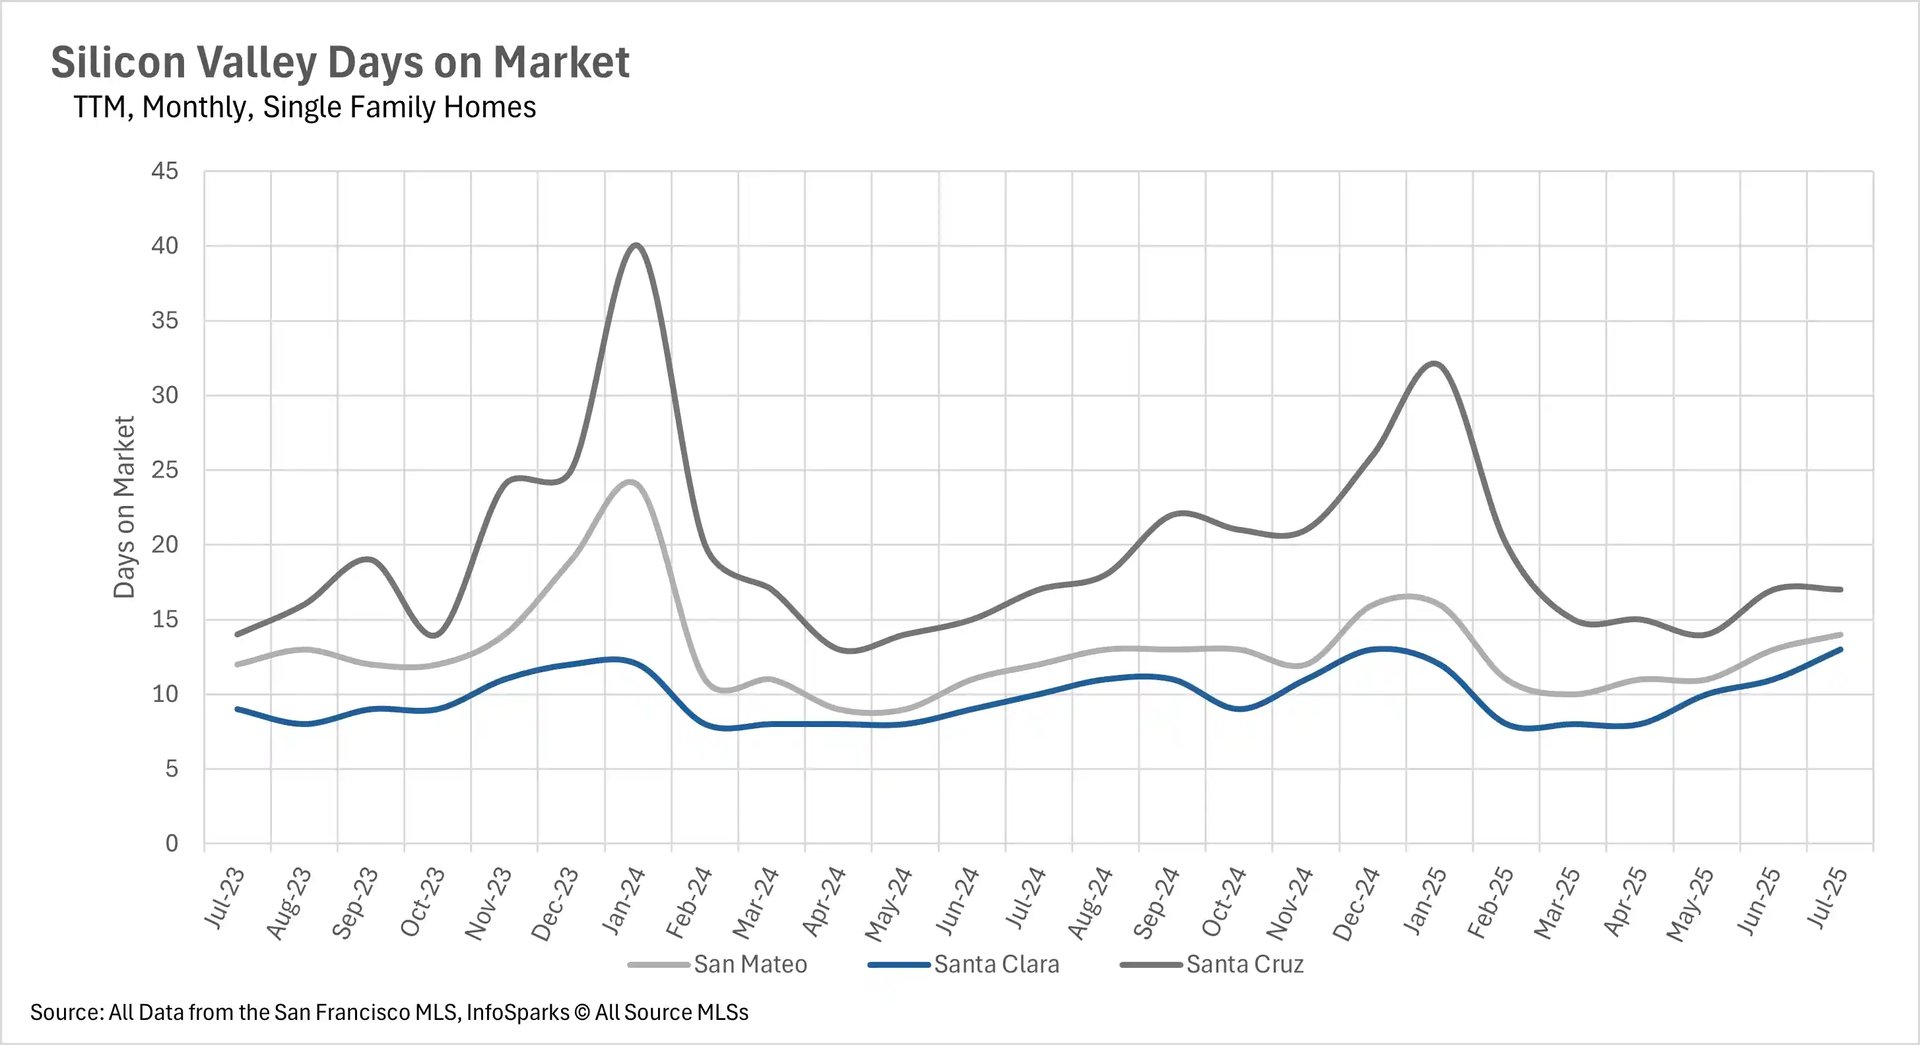
As inventories grow, listings continue to spend more time on the market

As you might already know, an increase in inventories often comes hand-in-hand with an increase in the amount of time it takes a listing to sell. The Silicon Valley market has largely not been an exception to this rule. Single-family homes in San Mateo and Santa Clara Counties are spending more time on the market than they were last year, while the amount of time homes in Santa Cruz County spend on the market has remained unchanged. With that being said, the single-family home market is still hot, with the average home being sold in less than 2.5 weeks throughout the entire Silicon Valley.

The single-family home market in San Mateo and Santa Clara Counties remains profoundly competitive

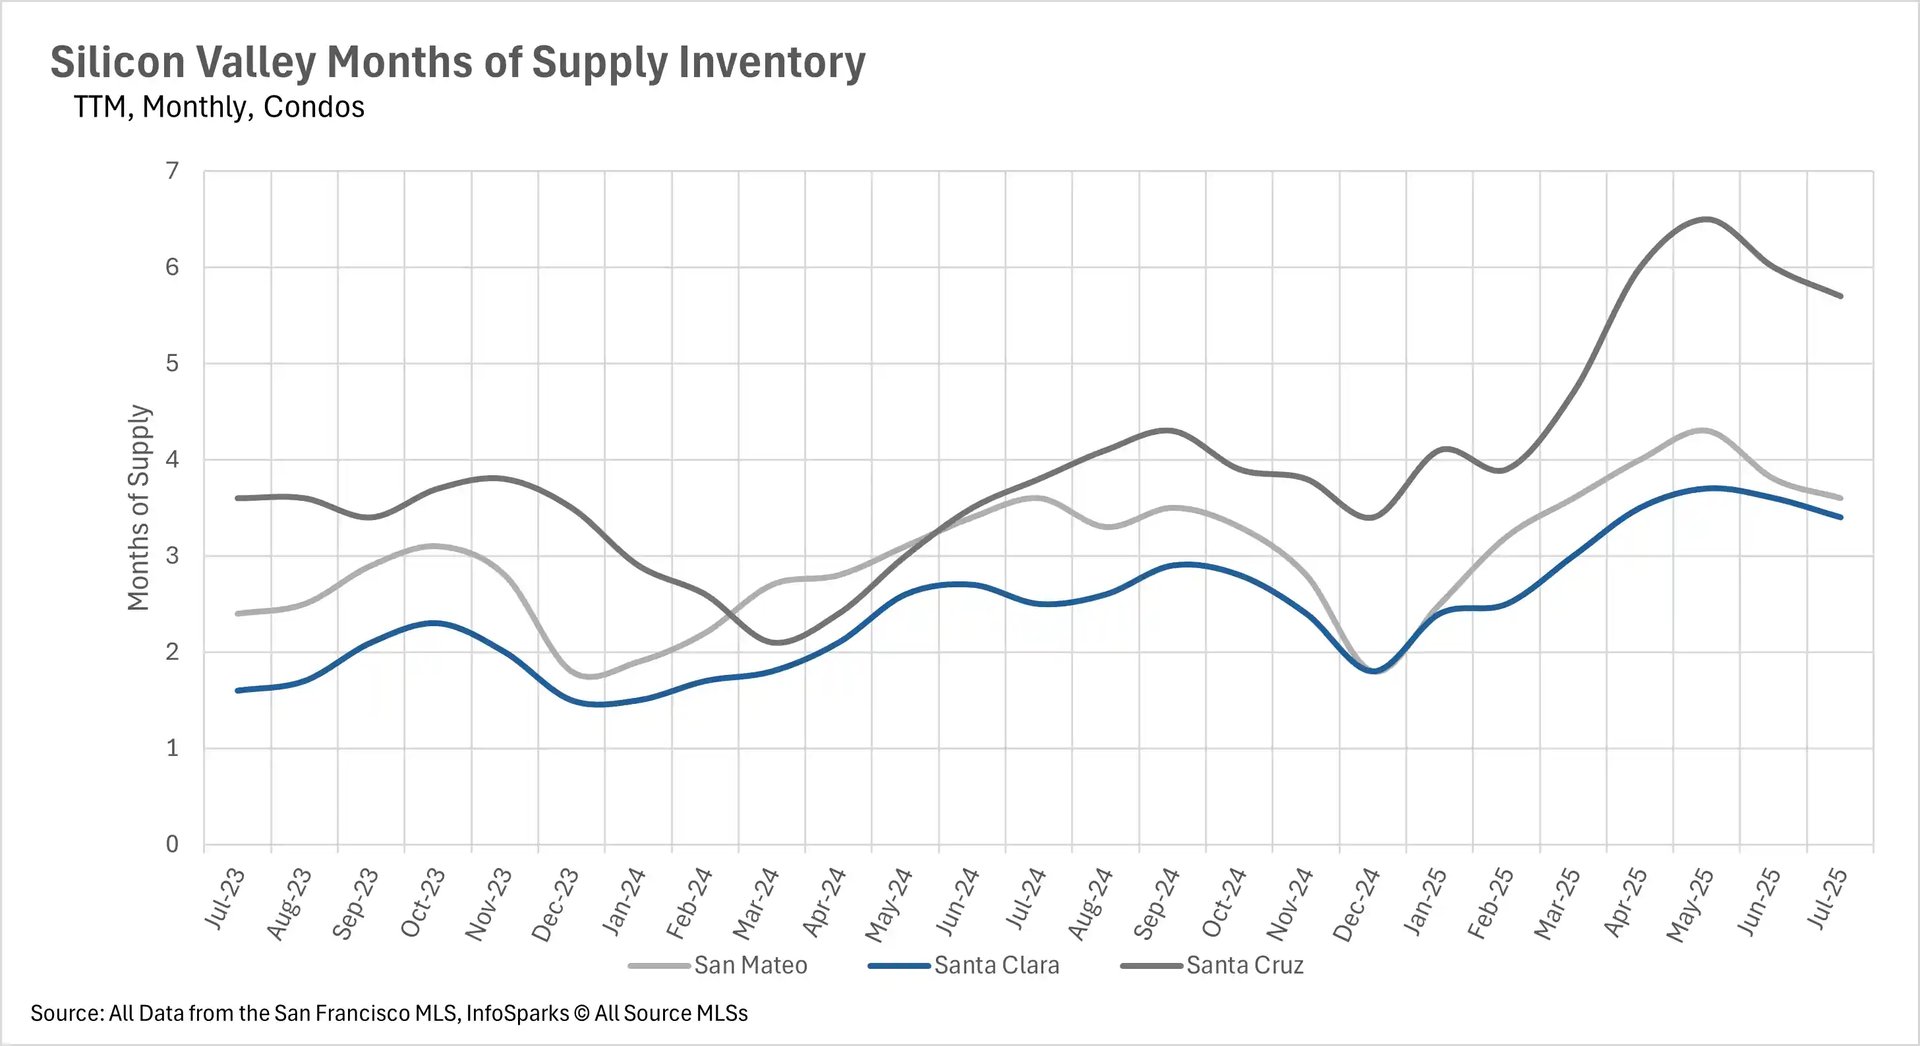
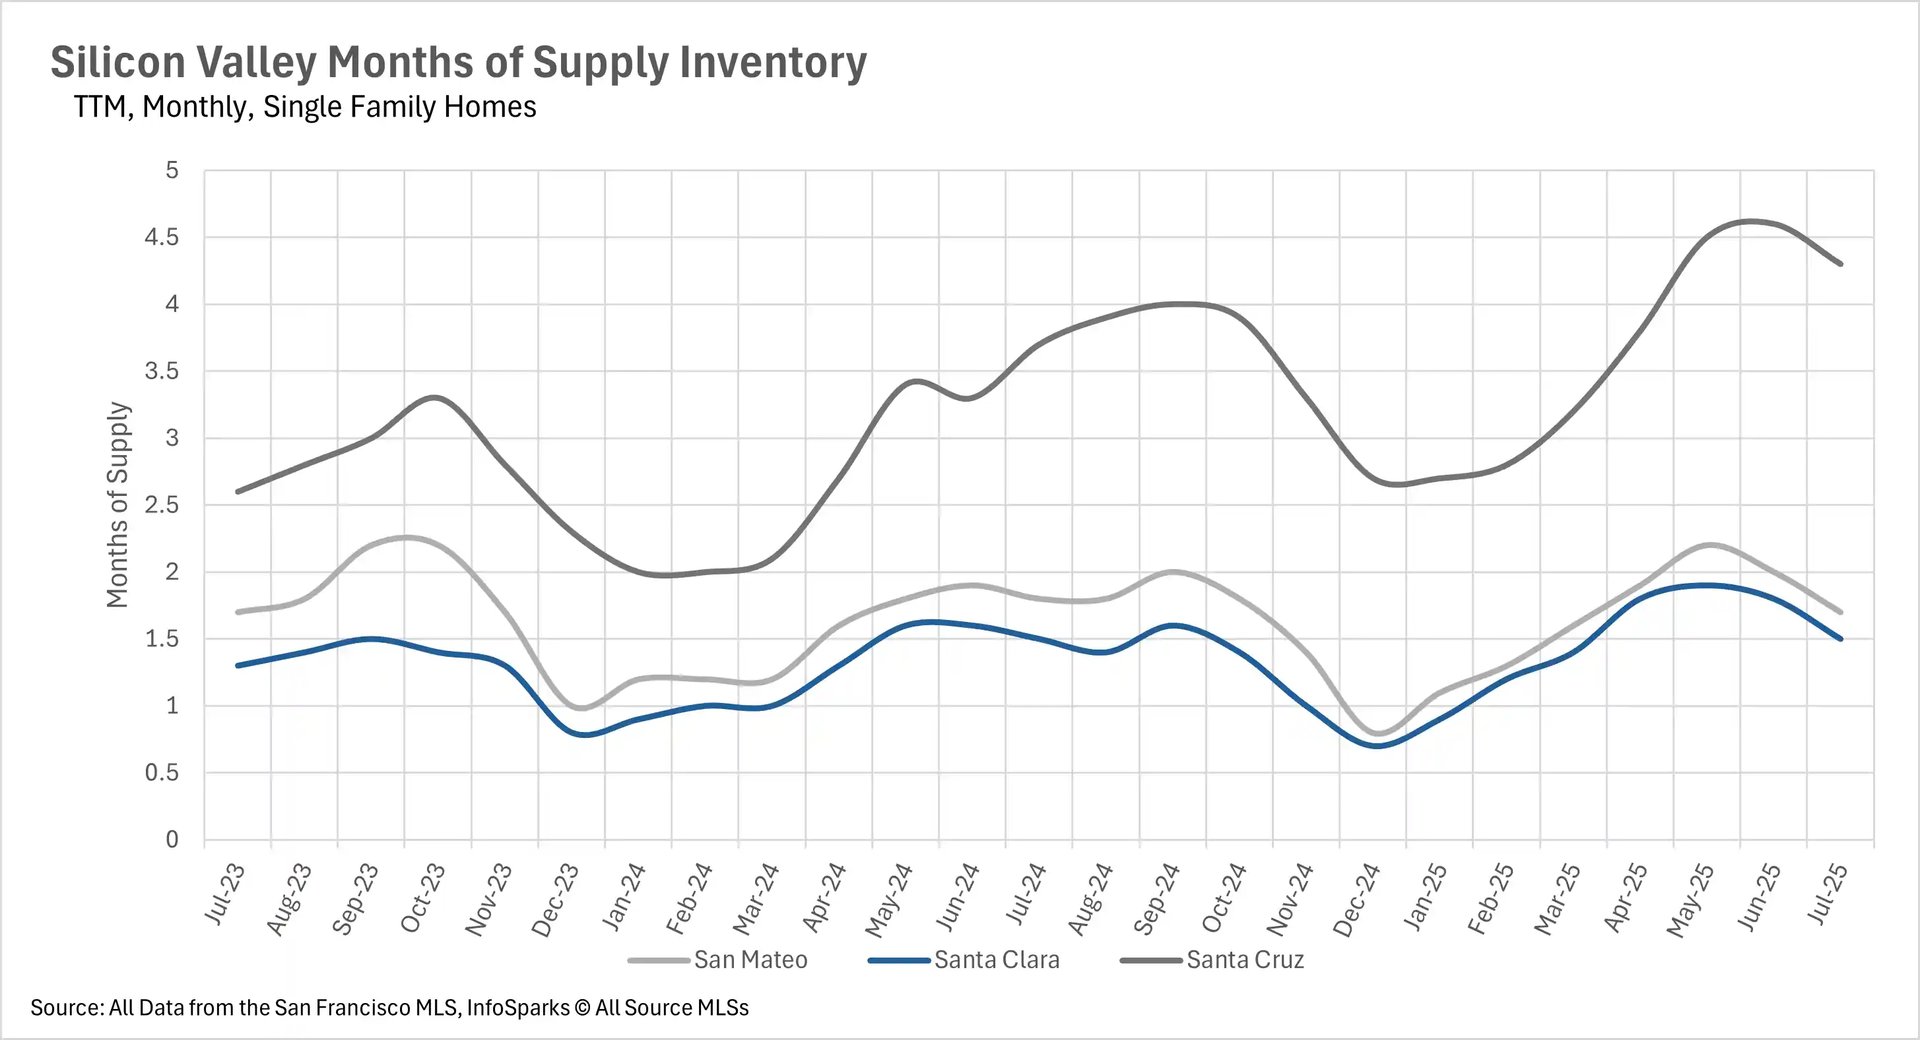
When determining whether a market is a buyers’ market or a sellers’ market, we look to the Months of Supply Inventory (MSI) metric. The state of California has historically averaged around three months of MSI, so any area with at or around three months of MSI is considered a balanced market. Any market that has lower than three months of MSI is considered a seller’s market, whereas markets with more than three months of MSI are considered buyers’ markets.

San Mateo and Santa Clara County single-family home markets have been incredibly hot for quite some time, and that trend has continued. They remain fiercely competitive markets, with just 1.7 and 1.5 months' worth of supply listed on the market. The single-family home market in Santa Cruz County is more buyer-driven, with 4.3 months' worth of supply on the market. Lastly, the condo market is entirely buyer-driven, with 3.6 months of supply on the market in San Mateo County, 3.4 months of supply on the market in Santa Clara County, and 5.7 months of supply on the market in Santa Cruz County.

Local Lowdown Data

A line graph titled "Silicon Valley Days on Market" for Condos. The x-axis shows months from July 2023 to July 2025. The y-axis shows Days on Market from 0 to 70. There are three lines representing San Mateo (gray), Santa Clara (blue), and Santa Cruz (dark gray). All three lines show a general upward trend in the first half of 2024, followed by a decline and then another increase. In July 2025, Santa Cruz has the highest days on market, followed by San Mateo and then Santa Clara.

A line graph titled "Silicon Valley Days on Market" for Single Family Homes. The x-axis shows months from July 2023 to July 2025. The y-axis shows Days on Market from 0 to 45. There are three lines representing San Mateo (gray), Santa Clara (blue), and Santa Cruz (dark gray). Santa Cruz consistently has the highest days on market, with a peak around January 2024. Santa Clara and San Mateo have similar, lower values, with a slight upward trend in July 2025.

A bar and line chart titled "Silicon Valley Inventory - Condos." The x-axis shows months from July 2023 to July 2025. The left y-axis shows New Listings and Sold Listings from 0 to 600, while the right y-axis shows For Sale Listings from 0 to 1000. Blue bars represent New Listings, light blue bars represent Sold Listings, and a pink line represents For Sale Listings. The "For Sale" line shows a significant increase from January 2024 to May 2025. New listings and sold listings show seasonal fluctuations.

A bar and line chart titled "Silicon Valley Inventory - Single-Family Homes." The x-axis shows months from July 2023 to July 2025. The left y-axis shows New Listings and Sold Listings from 0 to 2.5K, and the right y-axis shows For Sale Listings from 0 to 3.0K. Dark blue bars represent New Listings, light blue bars represent Sold Listings, and a pink line represents For Sale Listings. The "For Sale" line shows an increase from January 2024 to May 2025. New and sold listings show a seasonal pattern with peaks in the spring and summer.

A bar chart titled "Silicon Valley Median Price Changes" for Condos. The x-axis shows months from August 2024 to July 2025. The y-axis shows Median Price Changes from -25.00% to 25.00%. The chart compares year-over-year median price changes for San Mateo (gray), Santa Clara (blue), and Santa Cruz (dark gray). The bars show significant volatility, with Santa Cruz experiencing large drops in December 2024 and June 2025, and a large increase in July 2025. San Mateo and Santa Clara show more modest changes.

A line graph titled "Silicon Valley Median Condo Prices." The x-axis shows months from July 2022 to July 2025. The y-axis shows Median Prices from $200k to $1.0M. There are three lines representing San Mateo (gray), Santa Clara (blue), and Santa Cruz (dark gray). All three lines show prices fluctuating, generally staying within the $600k to $900k range over the three-year period.

A bar chart titled "Silicon Valley Median Price Changes" for Single Family Homes. The x-axis shows months from August 2024 to July 2025. The y-axis shows Median Price Changes from -15.00% to 25.00%. The chart compares year-over-year median price changes for San Mateo (gray), Santa Clara (blue), and Santa Cruz (dark gray). Santa Mateo shows a significant price increase in November and December 2024, while Santa Cruz experiences a large drop in April and May 2025. Santa Clara generally shows positive price changes.

A line graph titled "Silicon Valley Median Single-Family Home Prices." The x-axis shows months from July 2022 to July 2025. The y-axis shows Median Prices from $500k to $2.5M. There are three lines representing San Mateo (gray), Santa Clara (blue), and Santa Cruz (dark gray). Santa Clara and San Mateo prices are consistently higher than Santa Cruz prices, with all three lines showing a general upward trend since early 2023, followed by a slight decline in the first half of 2025.

A line graph titled "Silicon Valley Months of Supply Inventory" for Condos. The x-axis shows months from July 2023 to July 2025. The y-axis shows Months of Supply from 0 to 7. There are three lines representing San Mateo (gray), Santa Clara (blue), and Santa Cruz (dark gray). Santa Cruz and San Mateo show a steady increase in supply from late 2024 to July 2025, while Santa Clara's supply remains relatively stable, peaking in July 2025.

A line graph titled "Silicon Valley Months of Supply Inventory" for Single Family Homes. The x-axis shows months from July 2023 to July 2025. The y-axis shows Months of Supply from 0 to 5. There are three lines representing San Mateo (gray), Santa Clara (blue), and Santa Cruz (dark gray). Santa Cruz's supply is consistently the highest, showing a significant increase from late 2024 to May 2025. Santa Clara and San Mateo have similar, lower supply levels, with San Mateo's supply increasing more sharply than Santa Clara's in 2025.

Let’s Talk

You’ve got questions and we can’t wait to answer them.

Follow Us on Instagram