Select a Market Report to Read:
- National Market Update Overview
- Bay Area Report
- North Bay Report
- East Bay Report
- Silicon Valley Report
- San Francisco Report
The Big Story
Quick Take:
- The median home in the US is surprisingly appreciating at a slower rate than inflation.
- Mortgage rates remain stagnant, in the high 6-percent range that we’ve seen for a couple of years at this point.
- Inventory is continuing to build, as existing home sales remain stagnant on a year-over-year basis.
- Another FOMC meeting has come and gone, and the federal funds rate remains unchanged.
Note: You can find the charts & graphs for the Big Story at the end of the following section.
*National Association of REALTORS® data is released two months behind, so we estimate the most recent month's data when possible and appropriate.
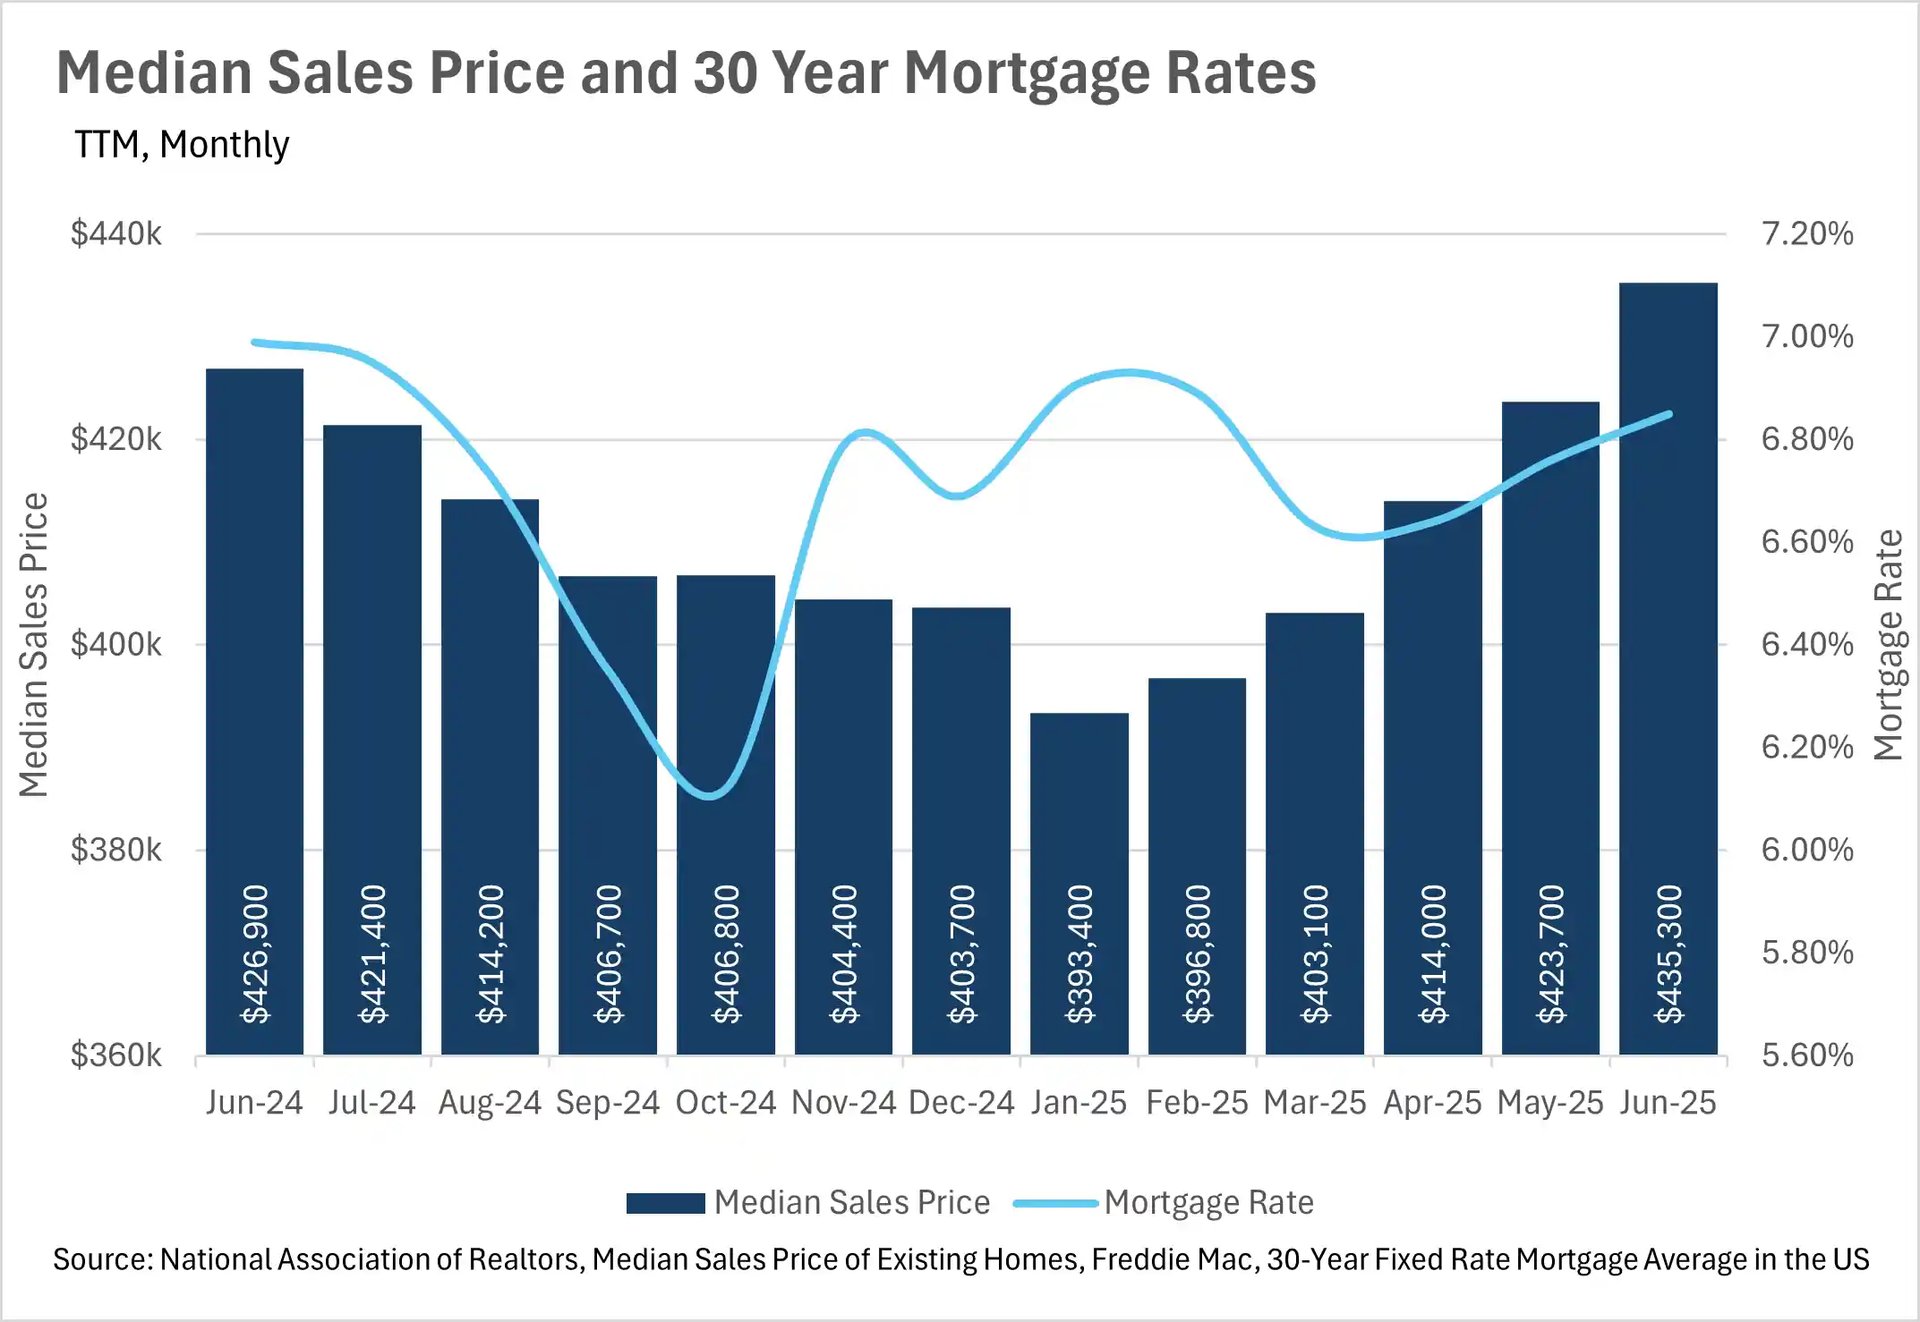
Median home sales price grew by just 1.97%
In the not-so-distant past, housing price growth outstripped inflation growth by a wide margin. However, now that the housing market has normalized, we’re seeing more modest levels of appreciation, with the median home sale price increasing by just 1.97% on a year-over-year basis in June. This represents great news for home buyers, and the housing market as a whole, considering that the June CPI reading came in at 2.7%. It’ll be worth paying attention to this over the course of the next few months, especially considering that many analysts are expecting a rate cut from the Fed in the September FOMC meeting.
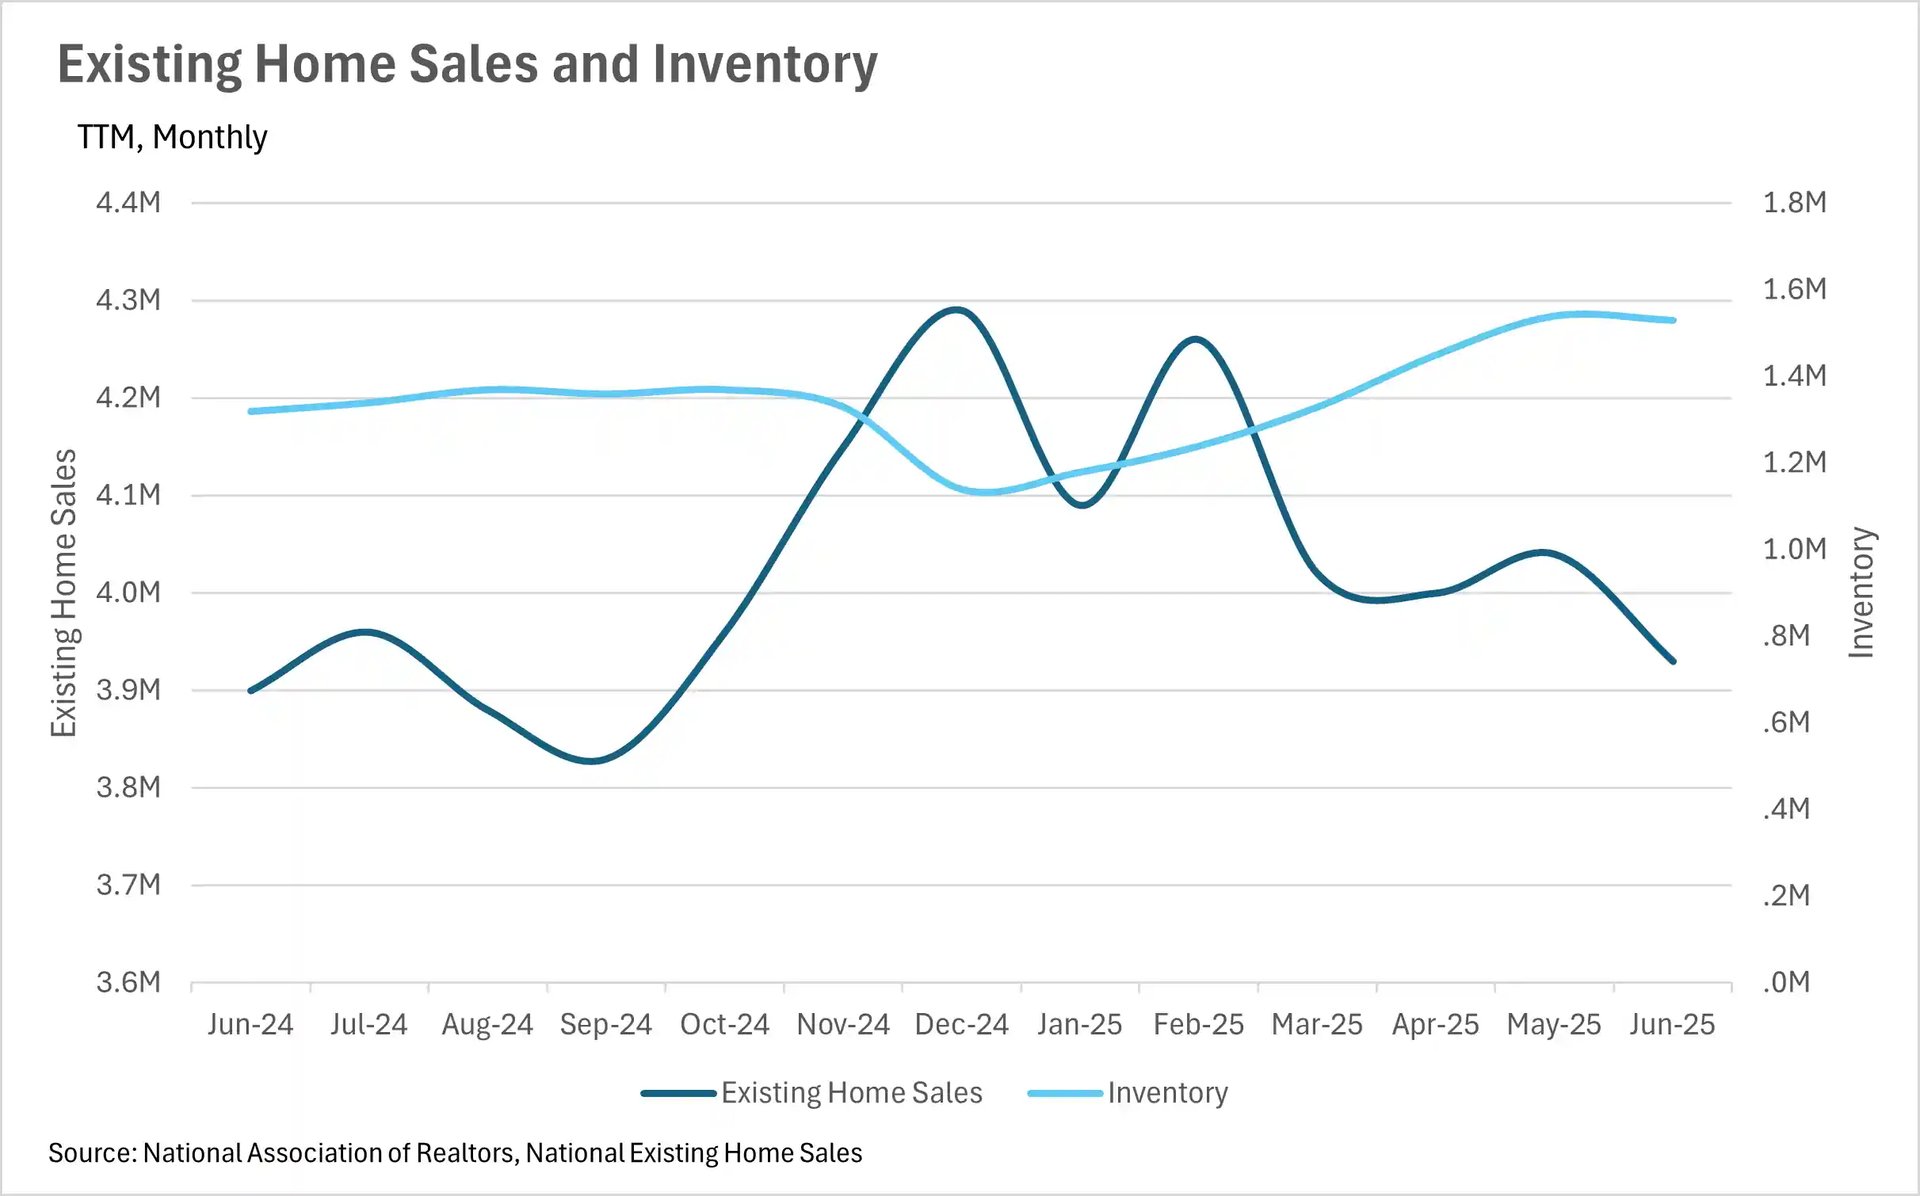
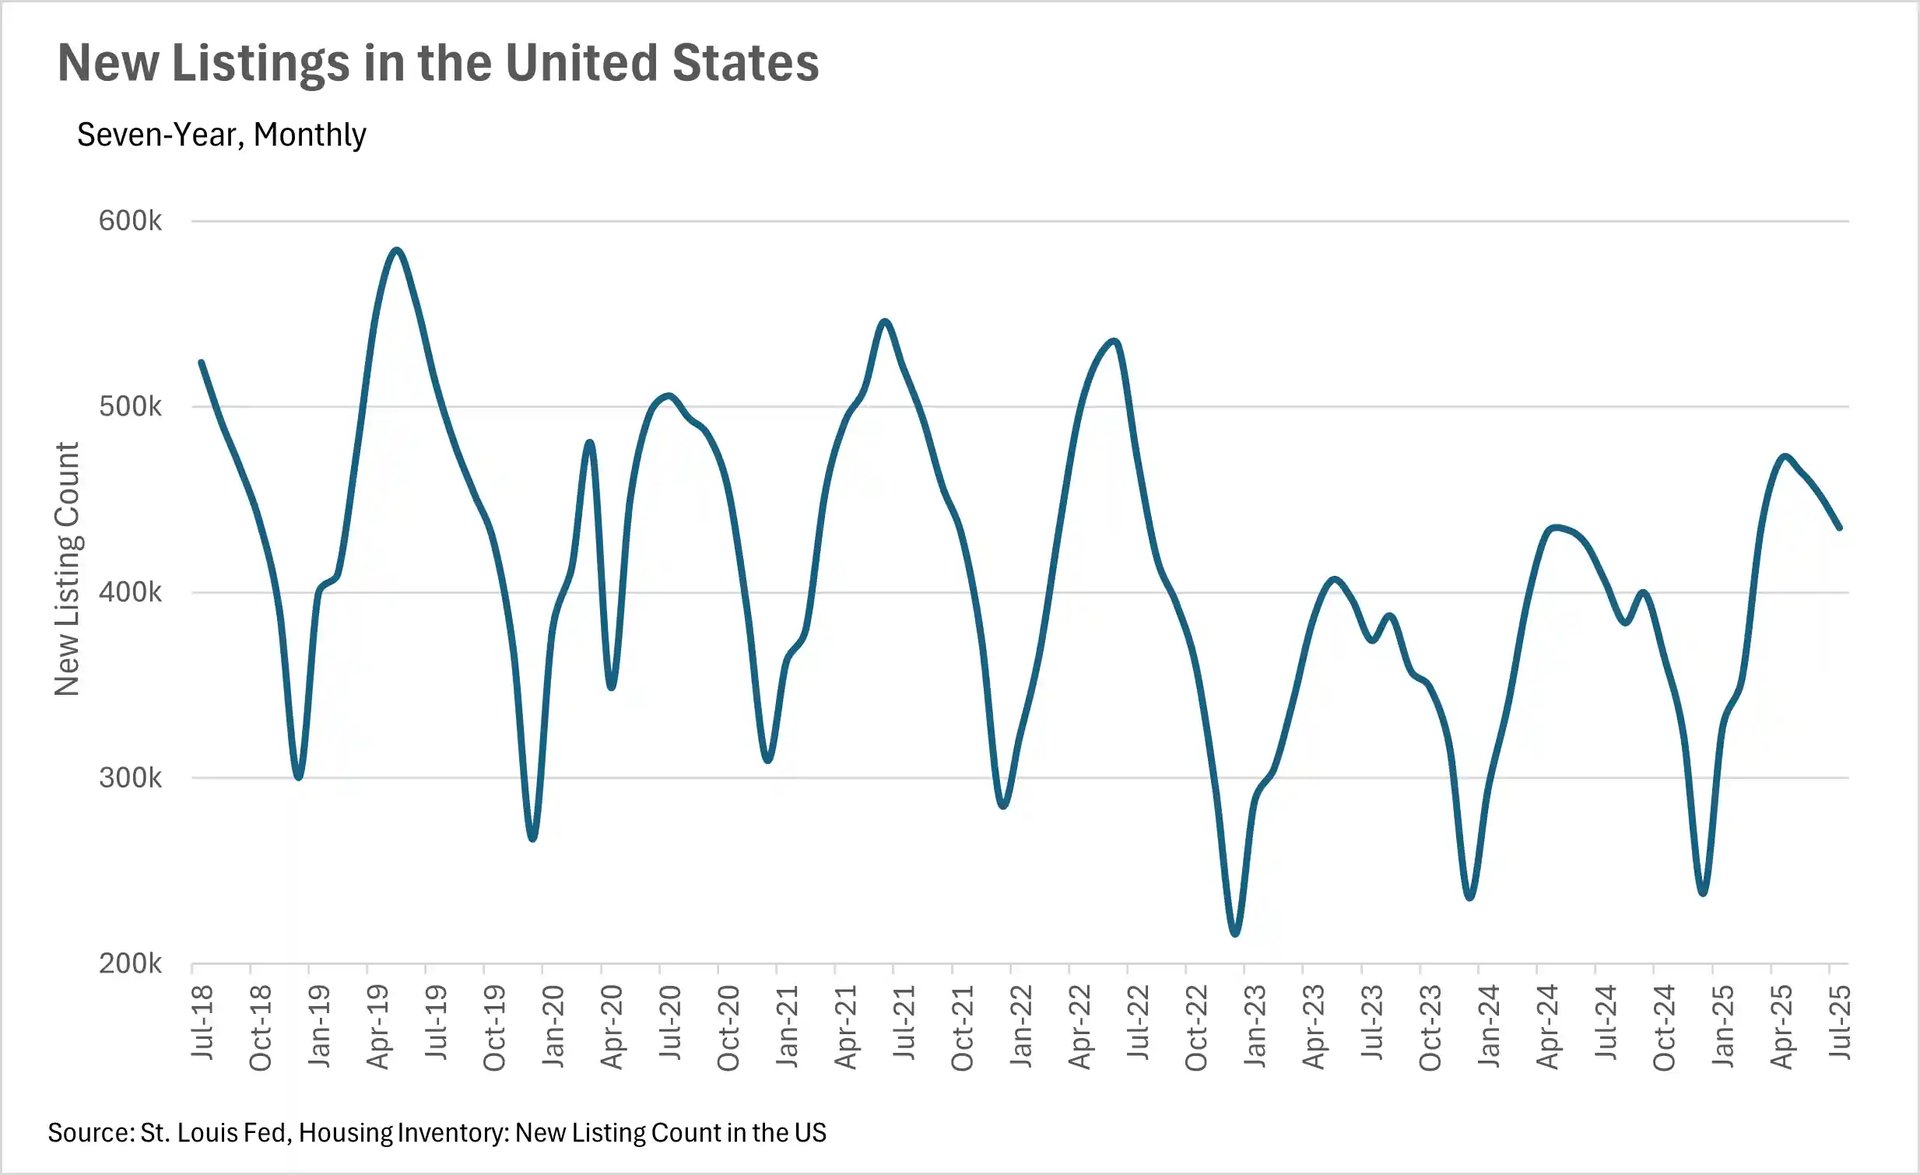
Inventory levels continue to build as more new homes hit the market
The trend of growing inventories has continued this month, with 15.91% more inventory on the market in June on a year-over-year basis. This growth in inventories can be attributed to the fact that the new homes are hitting the market at a much faster rate than new buyers are entering the market. In June, we saw a 0.77% increase in the number of existing homes sold on a year-over-year basis, while at the same time, we saw a 7.25% increase in the number of new listings hitting the market. Although there are still some buyers entering into the market every month, there is still a rather large contingent of people holding out until rates come back down.
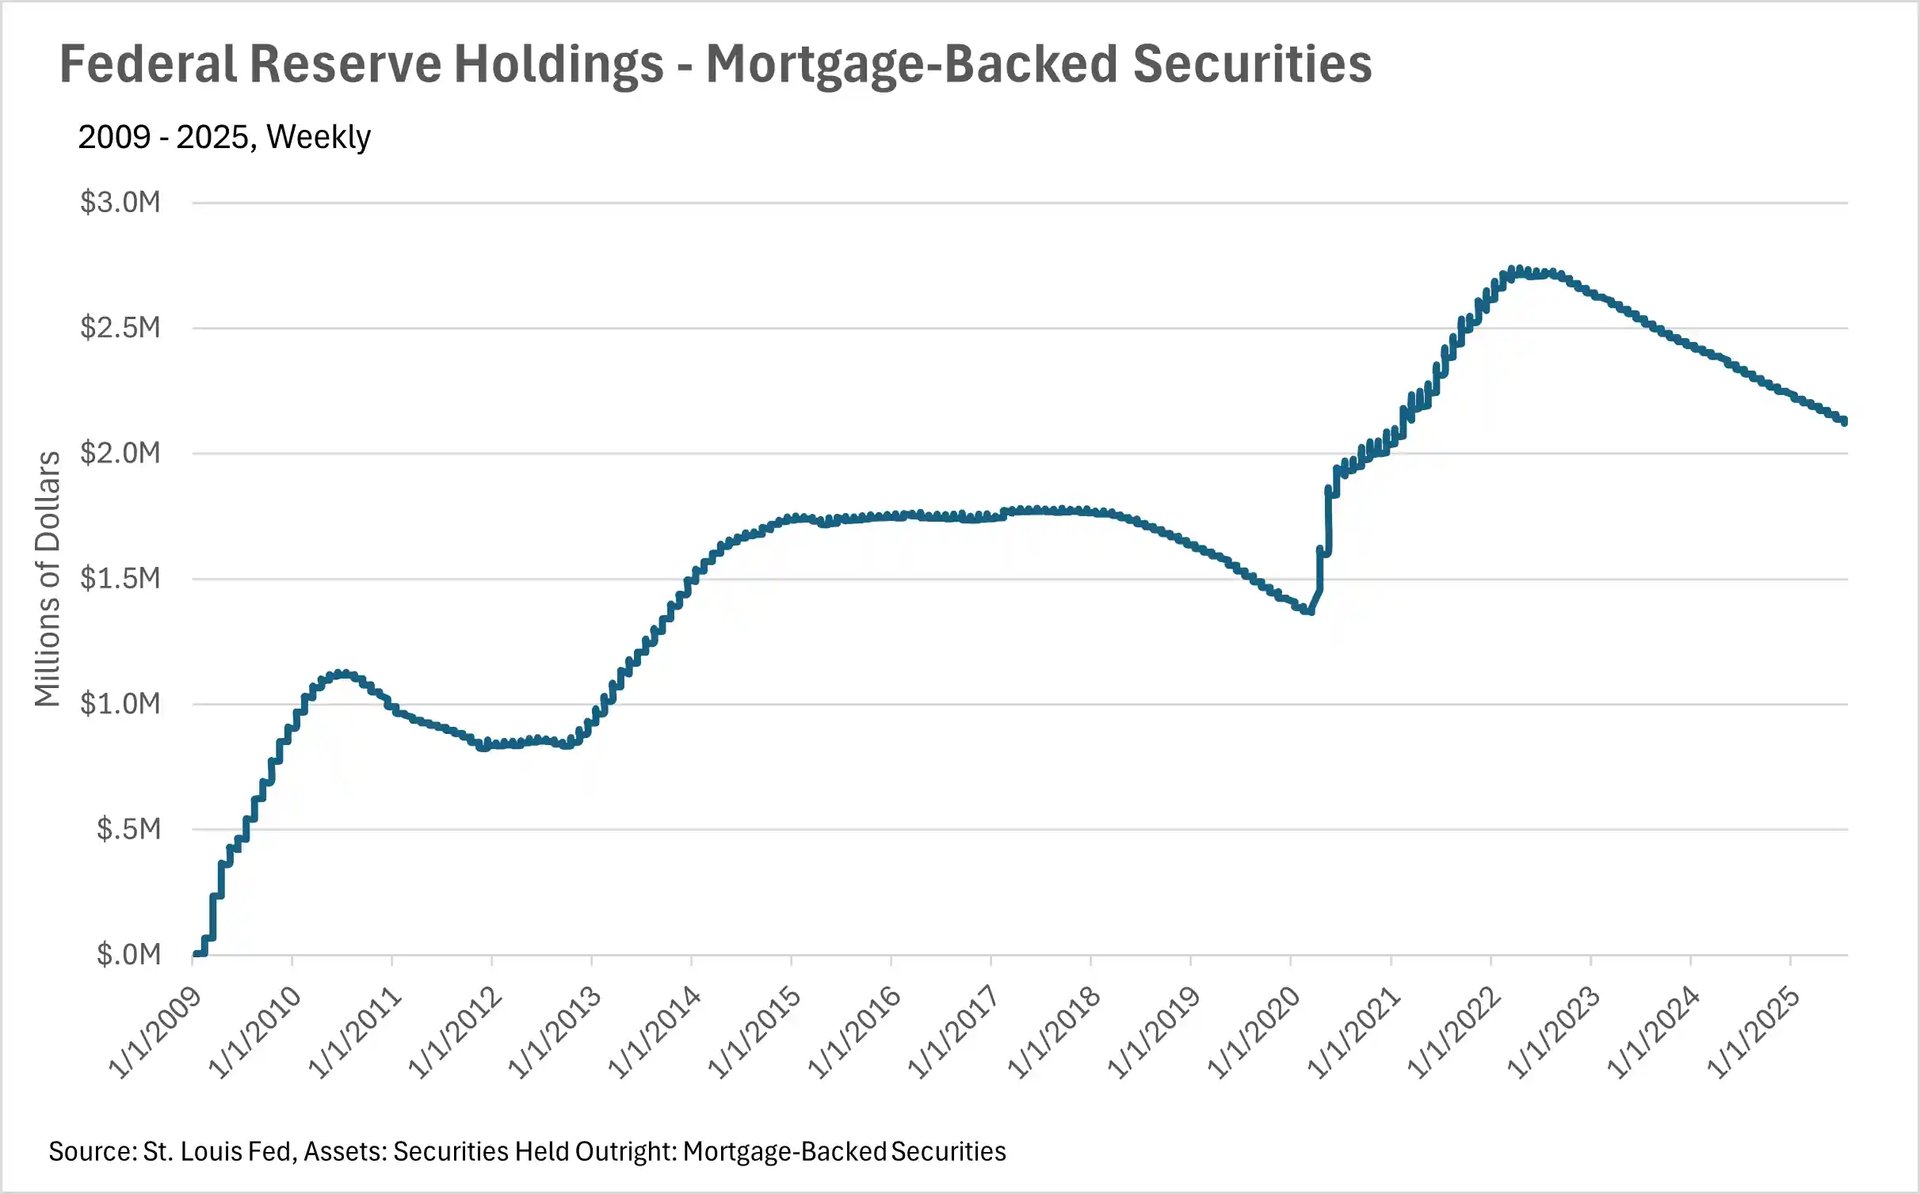
The Fed is holding rates steady due to economic uncertainty
This past month, we saw the Fed hold rates steady once again, as they brace for the consequences of the newly minted tariff policies that went into effect in early August. Although inflation data has led many to believe that we need to see substantial rate cuts in the not-so-distant future, Fed officials are incredibly concerned about the potential impacts of the freshly enacted tariff policy. Additionally, the Fed has a dual mandate; it’s responsible for controlling inflation and promoting maximum employment. At this point in time, we’re seeing relatively low inflation, and a very low unemployment rate, so Fed officials seemingly aren’t in a hurry to cut the federal funds rate.
Mortgage rates remain stagnant, but comparatively high
It probably isn’t much of a surprise that inventories are building and median sale prices have remained relatively stagnant, given the lack of movement in rates. Many believe that there is a very large contingent of people who simply aren’t willing to pay a comparatively very high interest rate to purchase a home, especially given that many have locked into rates in the 2-4% range on existing homes. The consistently high mortgage rates that we’ve seen have led people to stay in their homes for longer, resulting in more sellers on the market than buyers. However, we might see some movement if we see some positive commentary from the Fed in the upcoming FOMC meeting.
However, it’s important to remember that this is what we’re seeing at a national level. Oftentimes, what we see in California can be quite a bit different than the nation as a whole. We’ve done a deep dive into California markets in the local lowdown section below.