Select a Market Report to Read:
- National Market Update Overview
- Bay Area Report
- North Bay Report
- East Bay Report
- Silicon Valley Report
- San Francisco Report
The Local Lowdown
Quick Take:
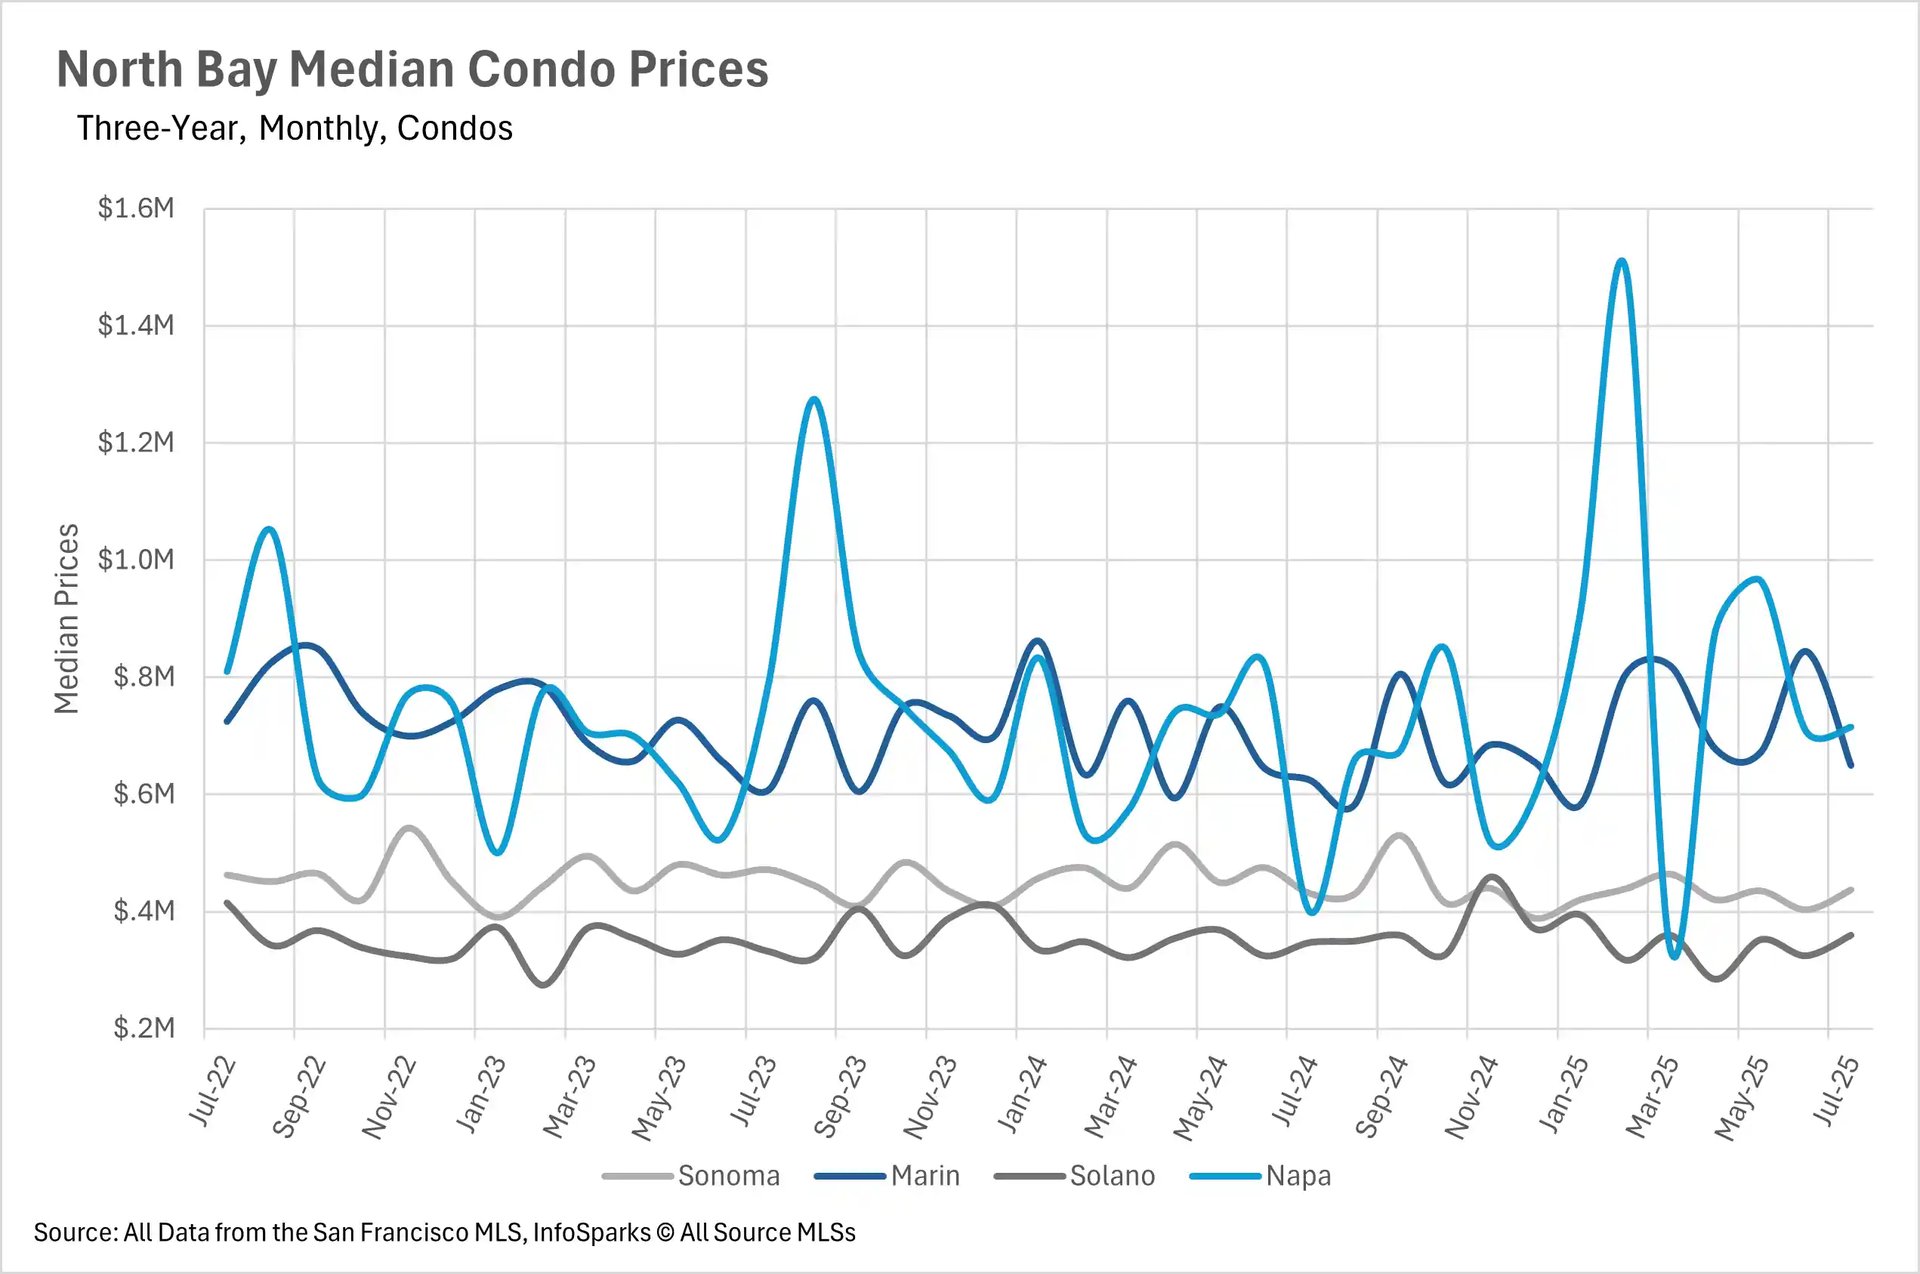
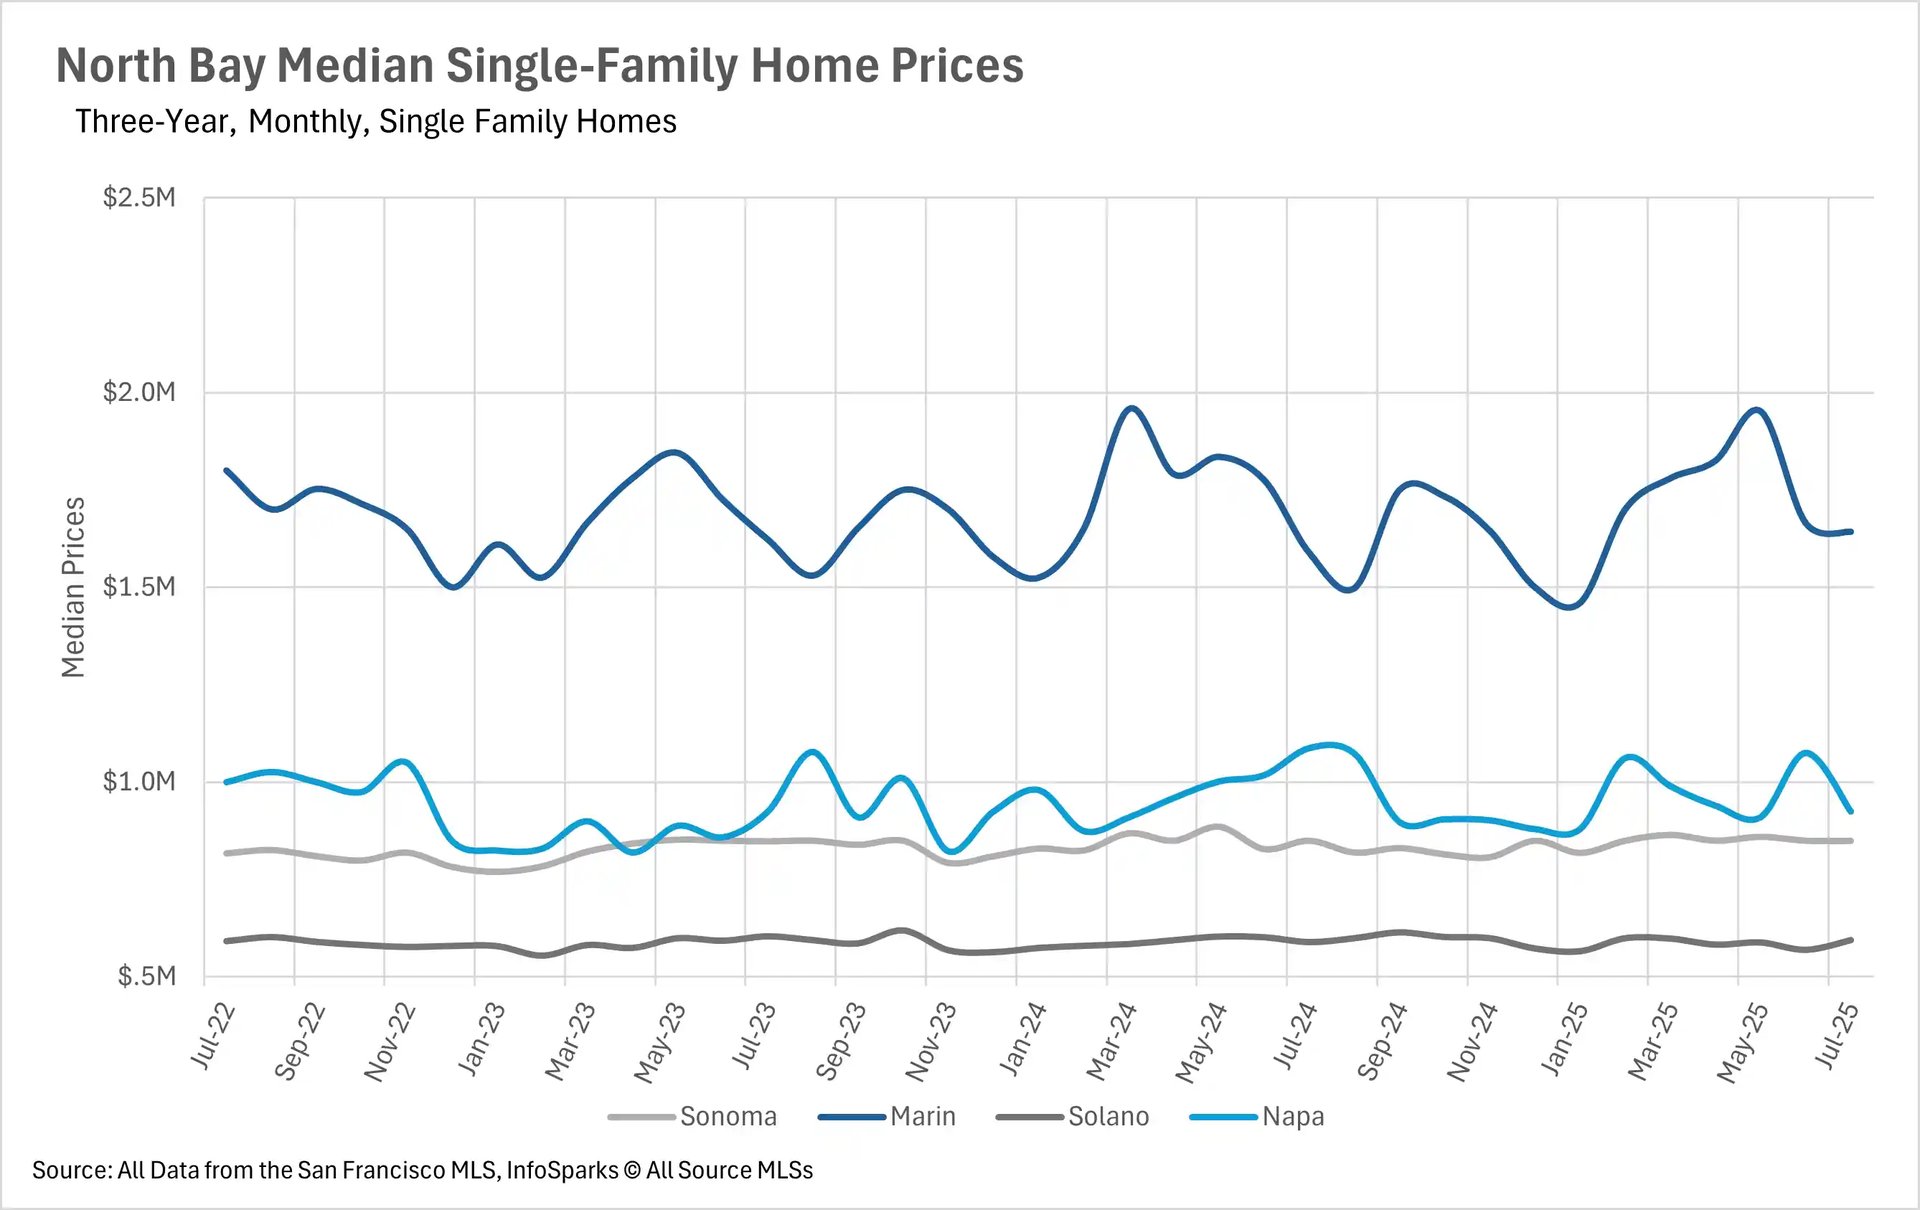
- While median sale prices remain volatile in Napa County, they’re relatively stable in surrounding counties.
- Inventory levels have bucked the trend and fallen precipitously
- Despite falling inventory levels, listings are spending quite a bit more time on the market than they were last year.
Note: You can find the charts/graphs for the Local Lowdown at the end of this section.
*National Association of REALTORS® data is released two months behind, so we estimate the most recent month's data when possible and appropriate.
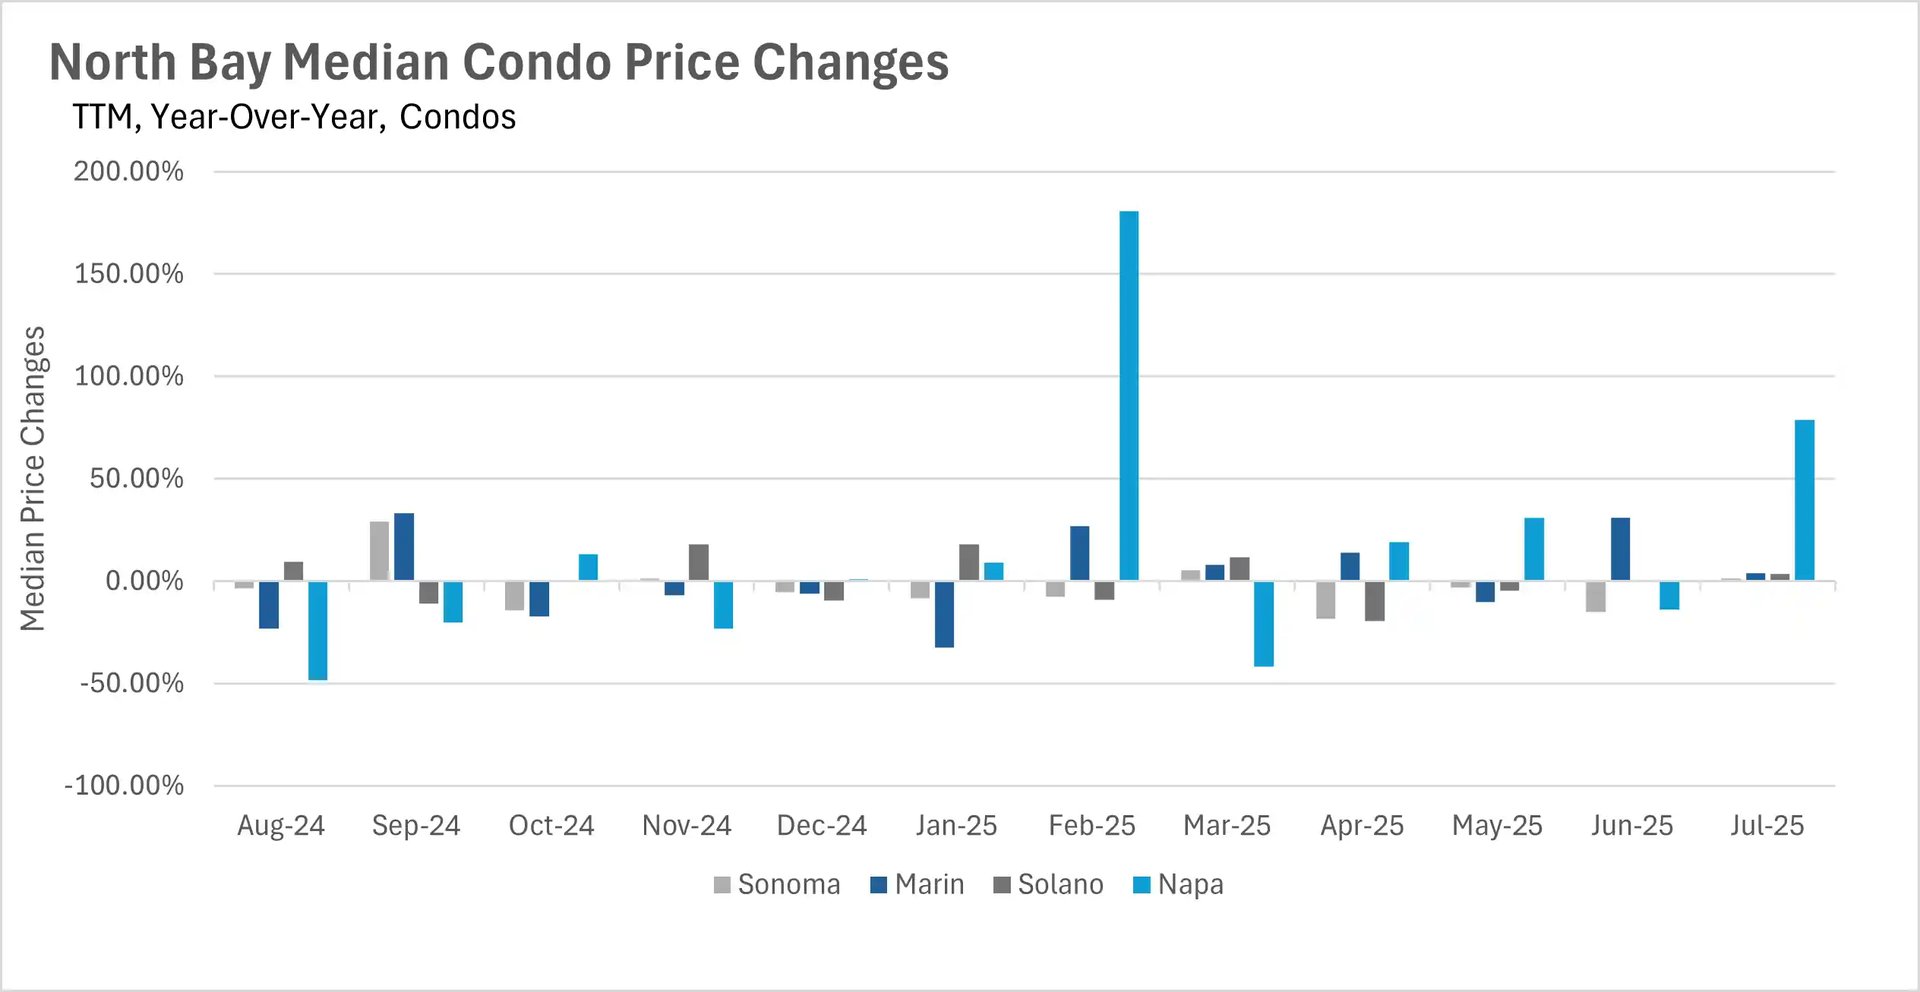
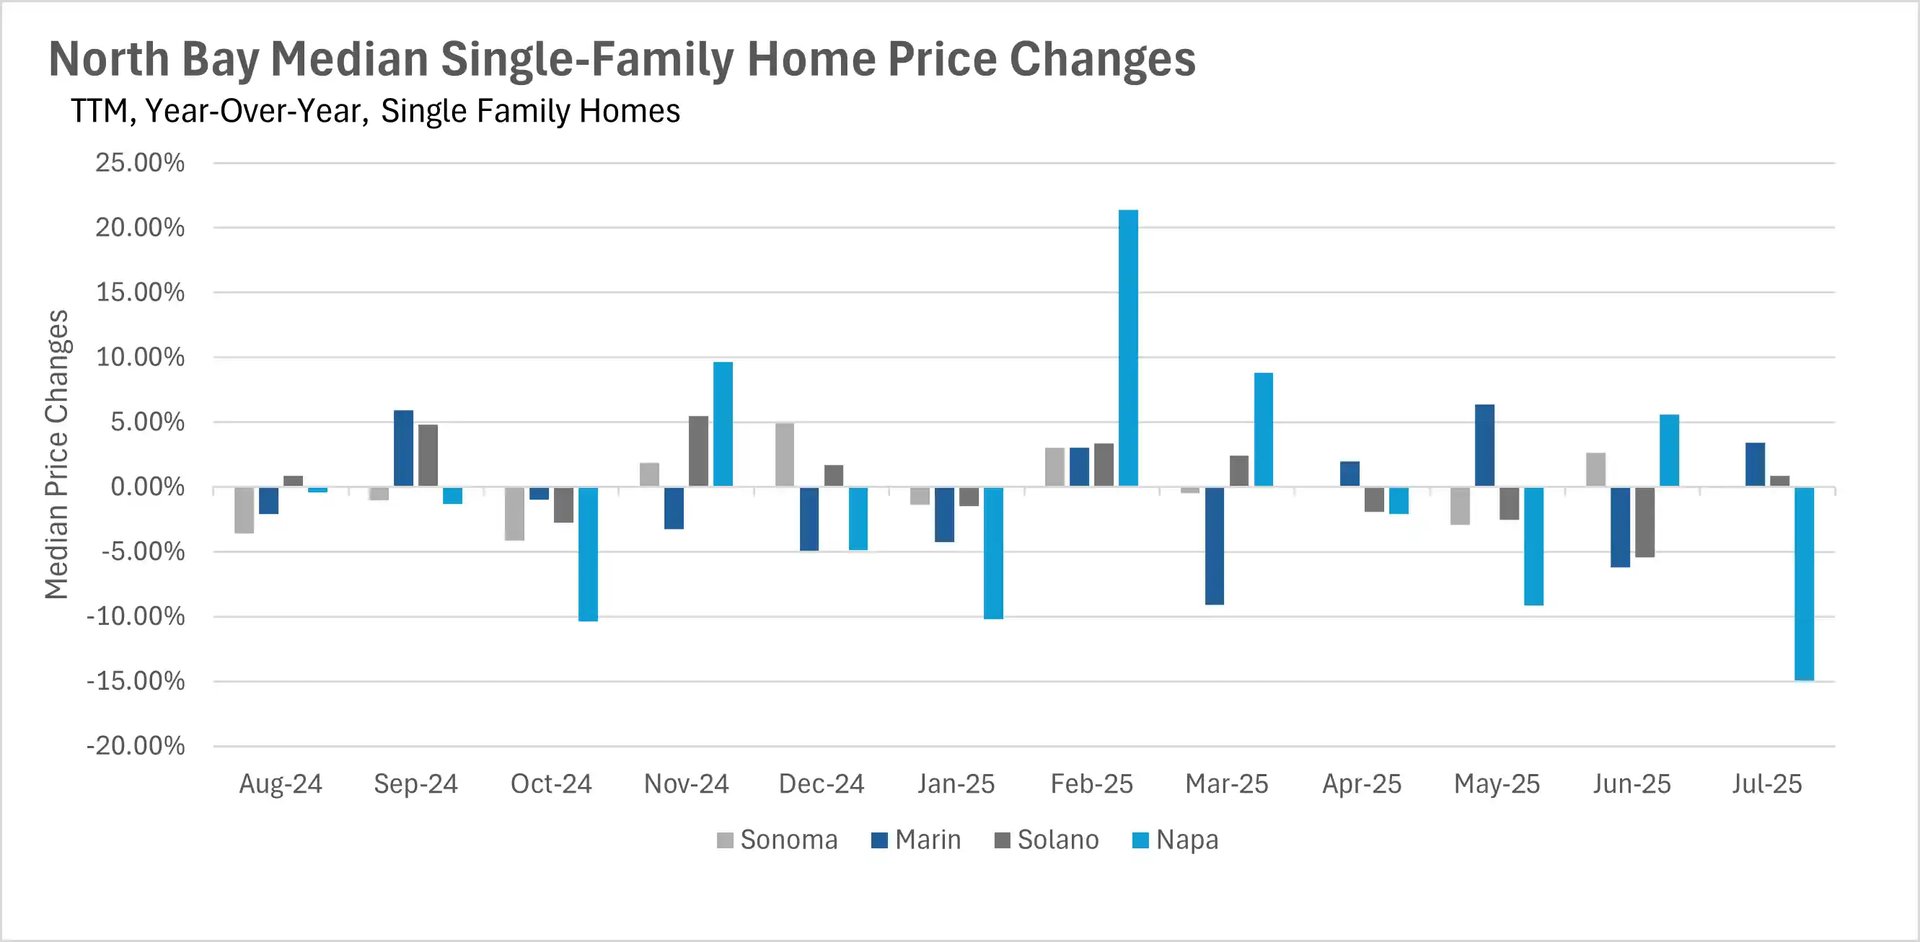
Median sale prices throughout the North Bay have remained relatively stable
Despite the trends that we’re seeing in other datasets, the median sale price of a home in the North Bay has remained relatively stable (outside of Napa County). The median sale price of single-family homes in Solano and Marin Counties increased by 0.85% and 3.43% on a year-over-year basis, respectively. In contrast, median sale prices decreased by 0.06% and 14.94% year-over-year in Sonoma and Napa Counties. In the condo market, we saw median sale price increases across the board, with Sonoma seeing a 1.39% increase year-over-year, Solano seeing a 3.60% increase, Marin seeing a 4.00% increase, and Napa seeing a 78.75% increase. We’ll be keeping our eyes on these metrics moving forward, as it’ll be interesting to see where sale prices go in the ever-evolving market that we’re in.
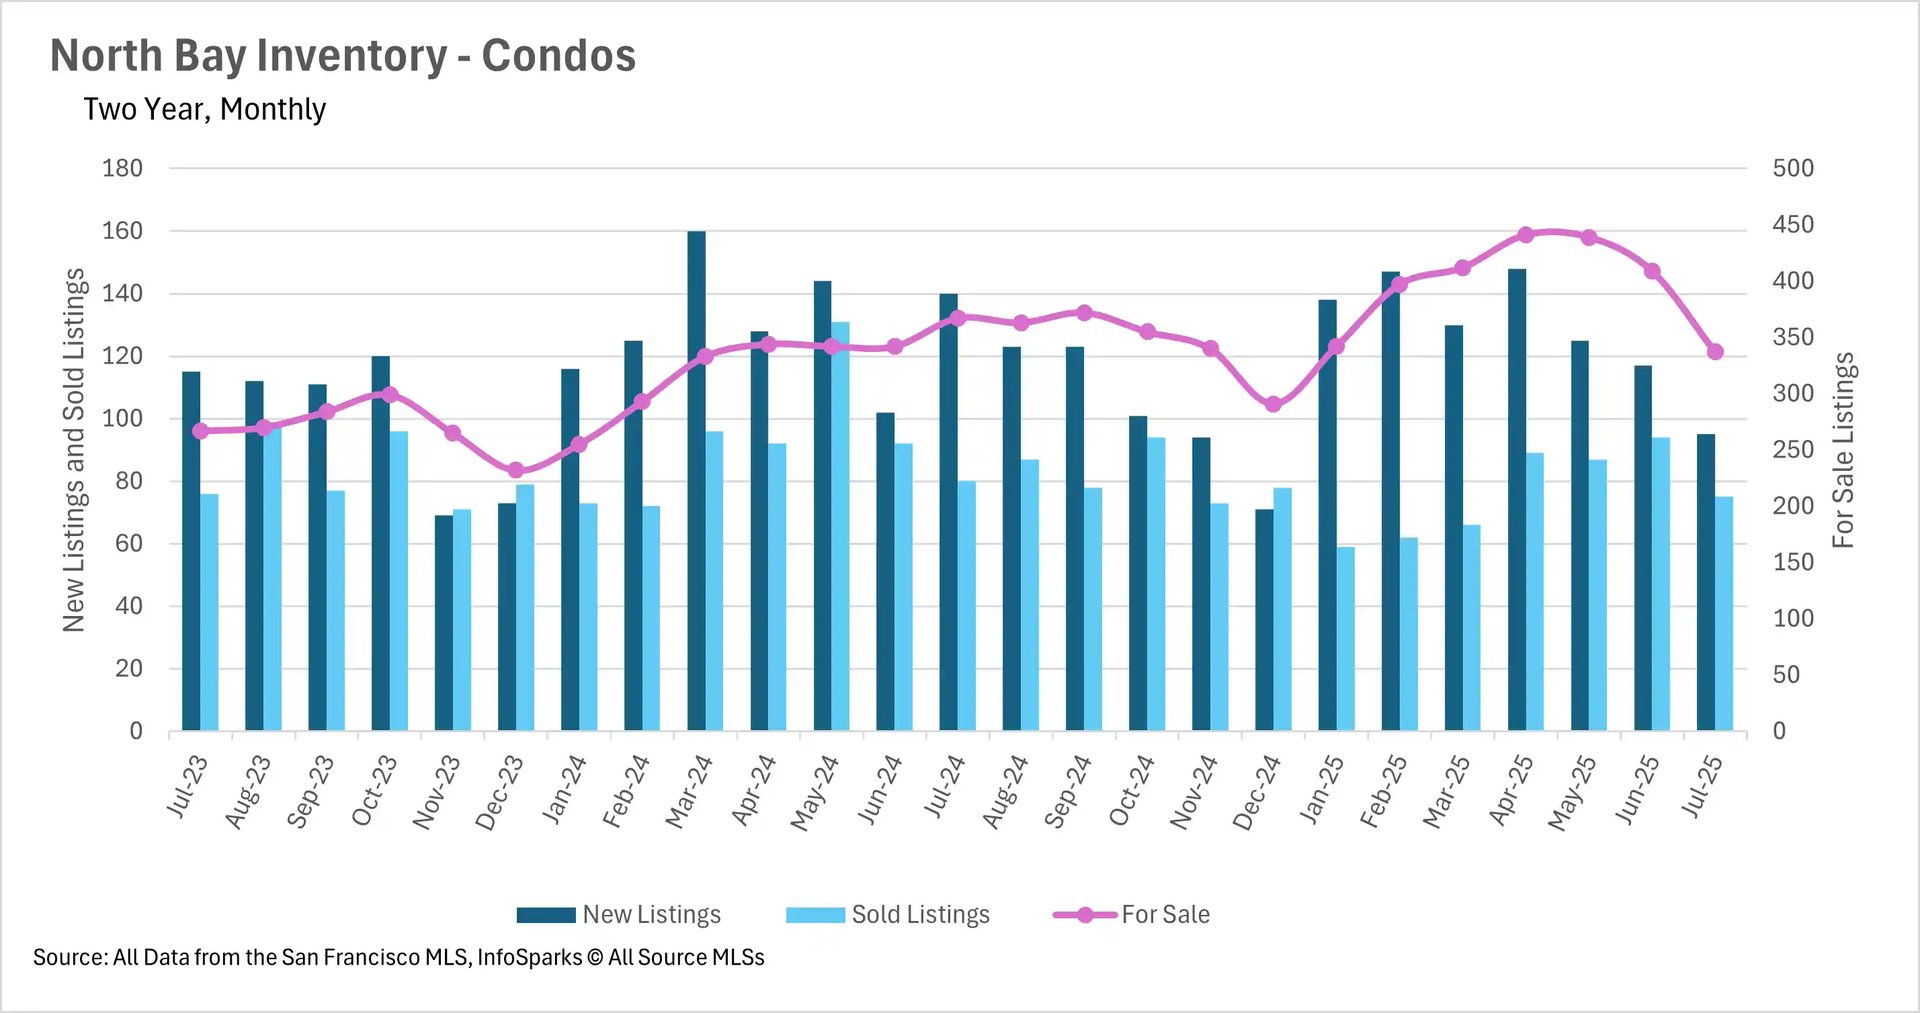
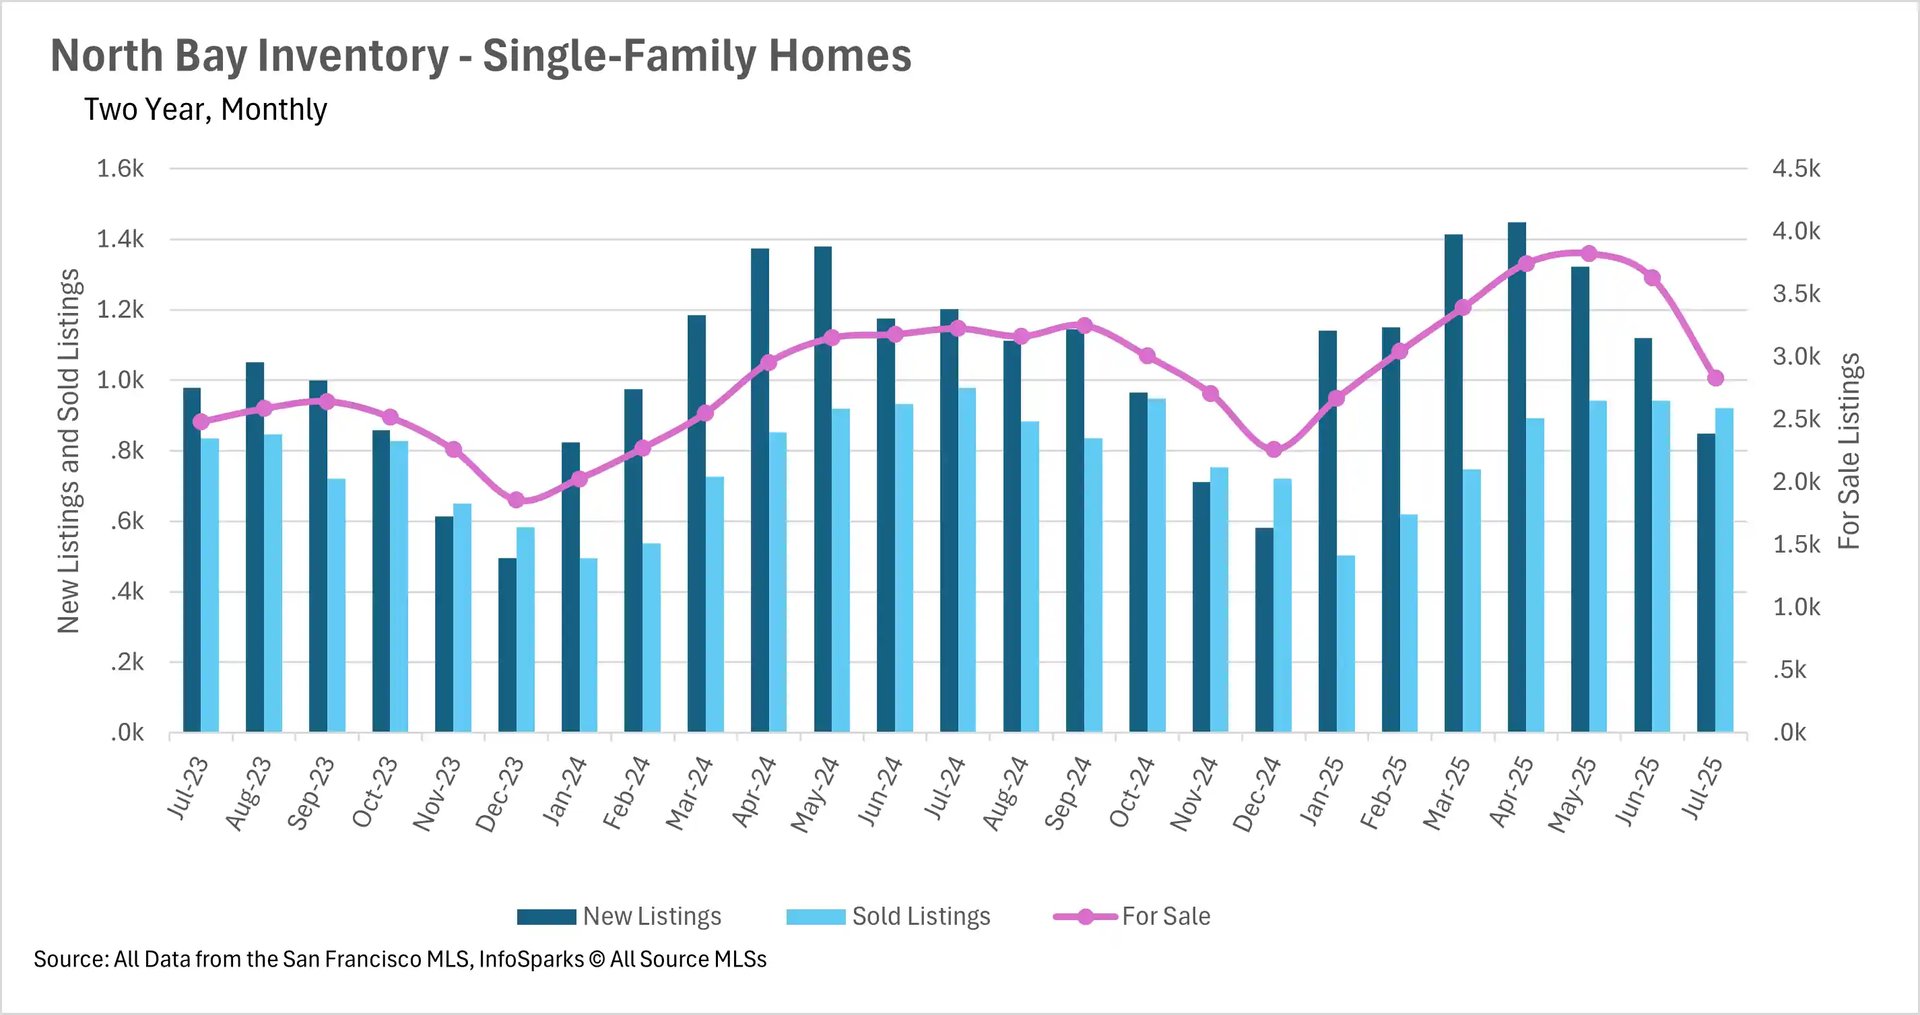
Inventories have dropped dramatically, with substantially fewer new listings hitting the market
Inventories took a nosedive throughout the North Bay last month. In the single-family home market, we saw a 21.98% decrease in inventory month-over-month, representing a 12.24% decrease when compared to last year. Likewise, the condo market saw a 17.60% month-over-month decrease, and an 8.17% year-over-year decrease in inventories. This can largely be attributed to the fact that we saw borderline record-low levels of new listings hitting the market in July. For reference, there were 850 new single-family home listings added in the month of July, representing a year-over-year decrease of 29.28%. This is a level that we typically don’t see until the holidays!
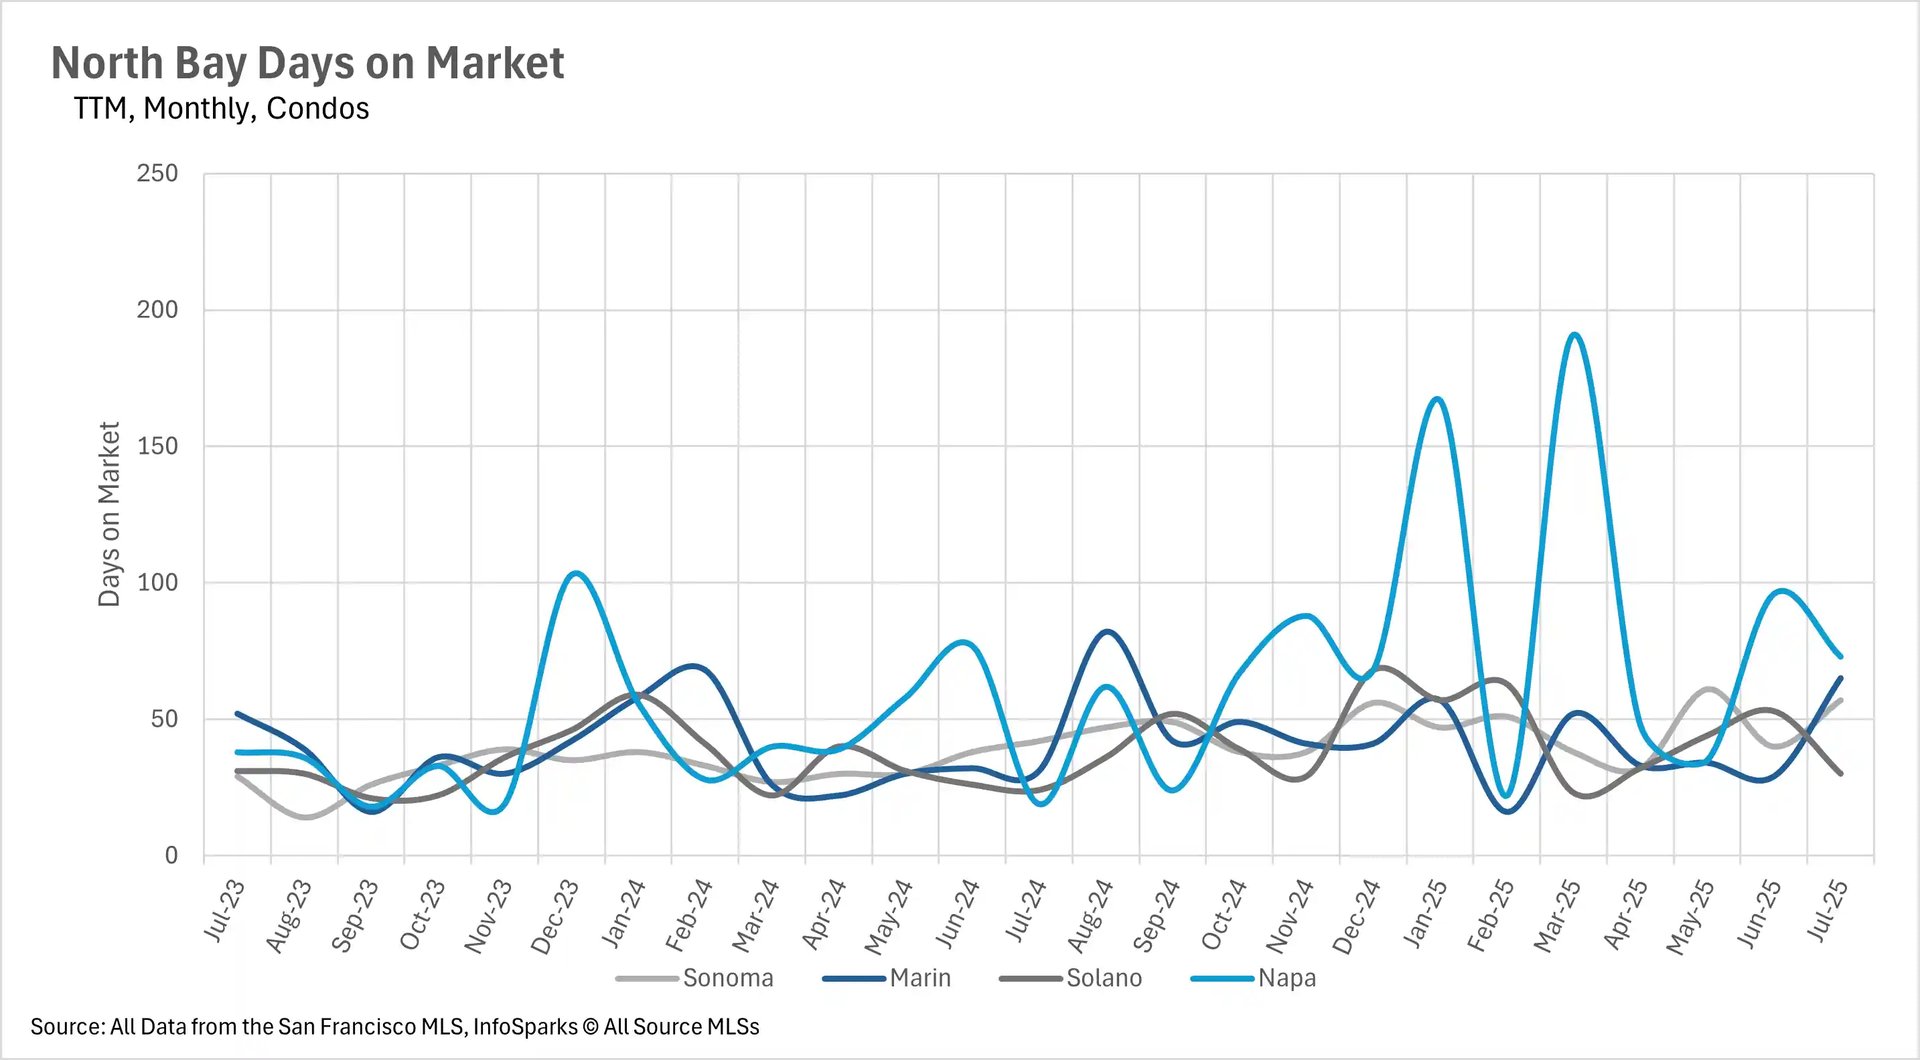
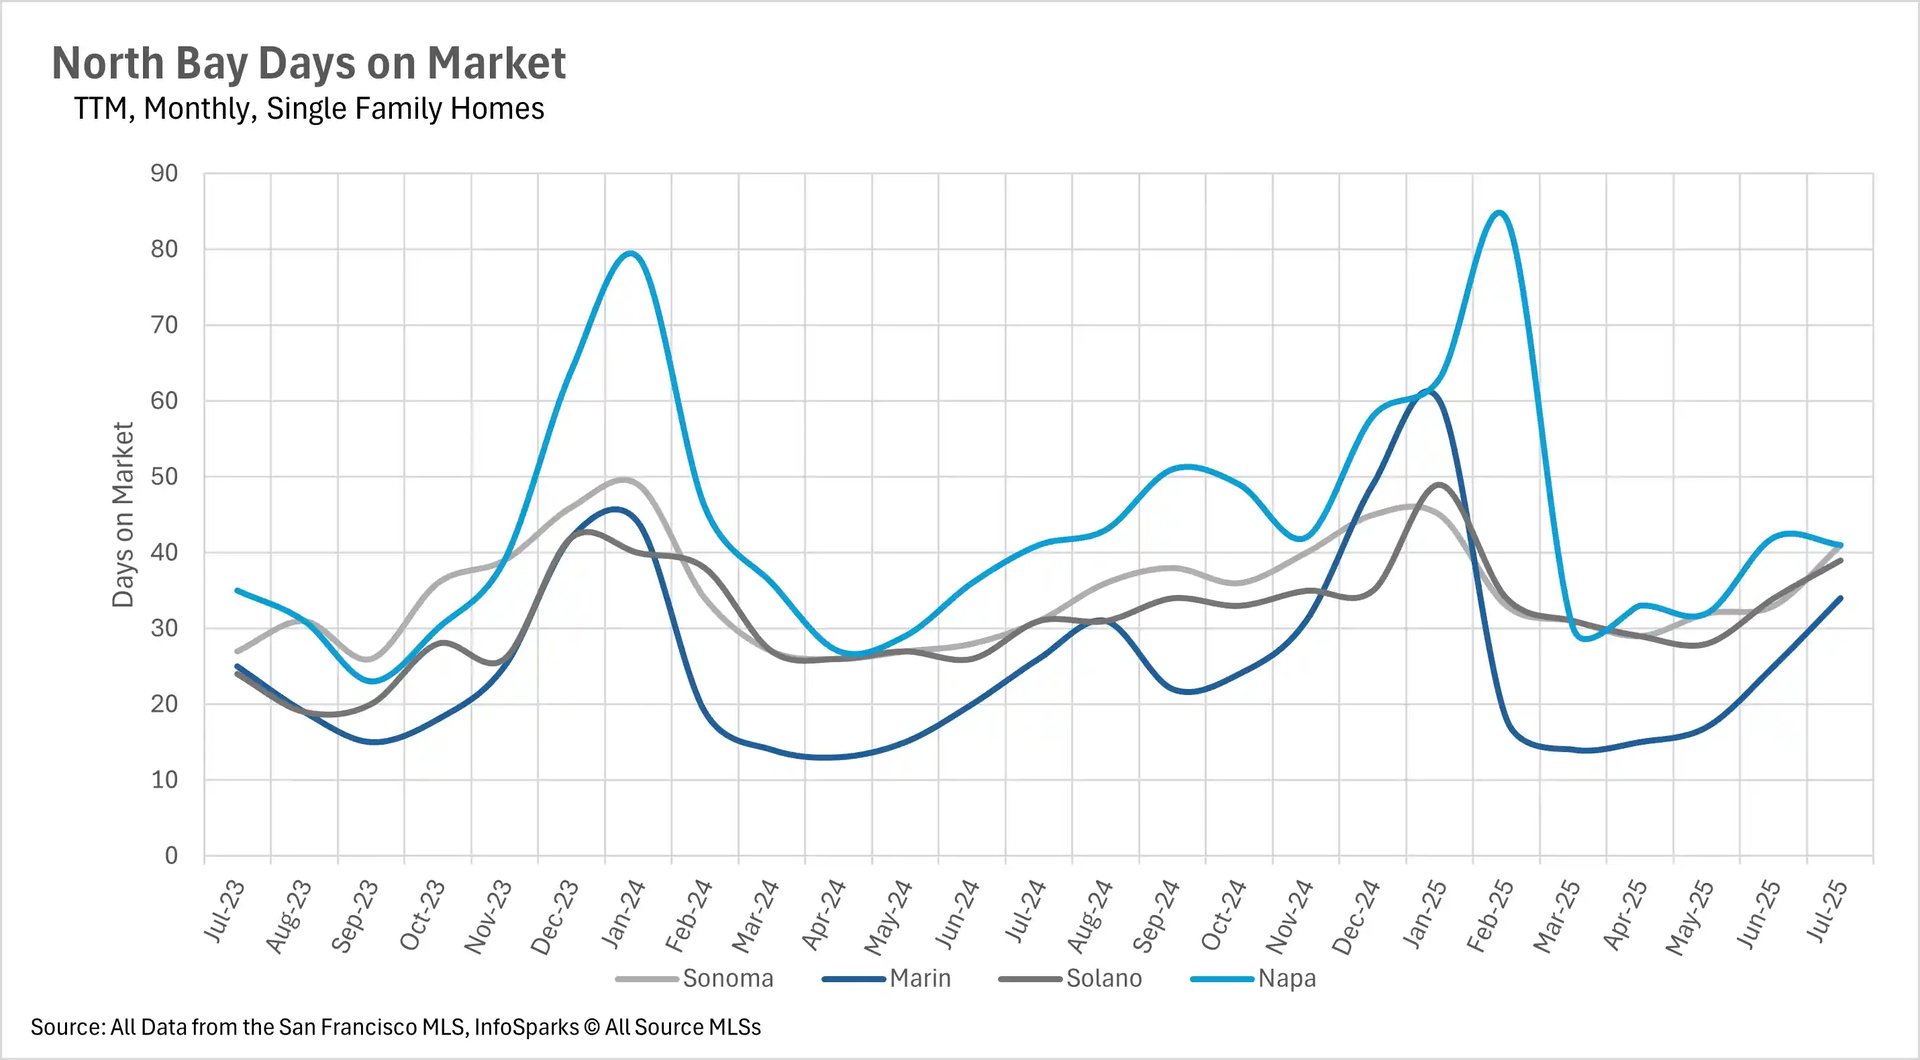
Although inventory levels have fallen, the average listing is still spending 20-30%+ more time on the market
When you see inventories and new listings dropping, you might expect to see listings getting bought up much more quickly. However, that isn’t the case in the North Bay (at least, not yet). In both the single-family home and condo markets, we largely saw listings sitting on the market for considerably longer than they were last year. Most markets saw listings sitting on the market for 20-30% longer on a year-over-year basis, representing an absolute increase of 7-10 days. Some markets bucked this trend though, with condos in Marin and Napa Counties spending 109.68% and 284.21% more time on the market, when compared on a year-over-year basis. On the flip side, single-family homes in Napa County spent the exact same number of days on the market in July 2025 as they did in July 2024.
As inventories fall, competition has picked up in the North Bay
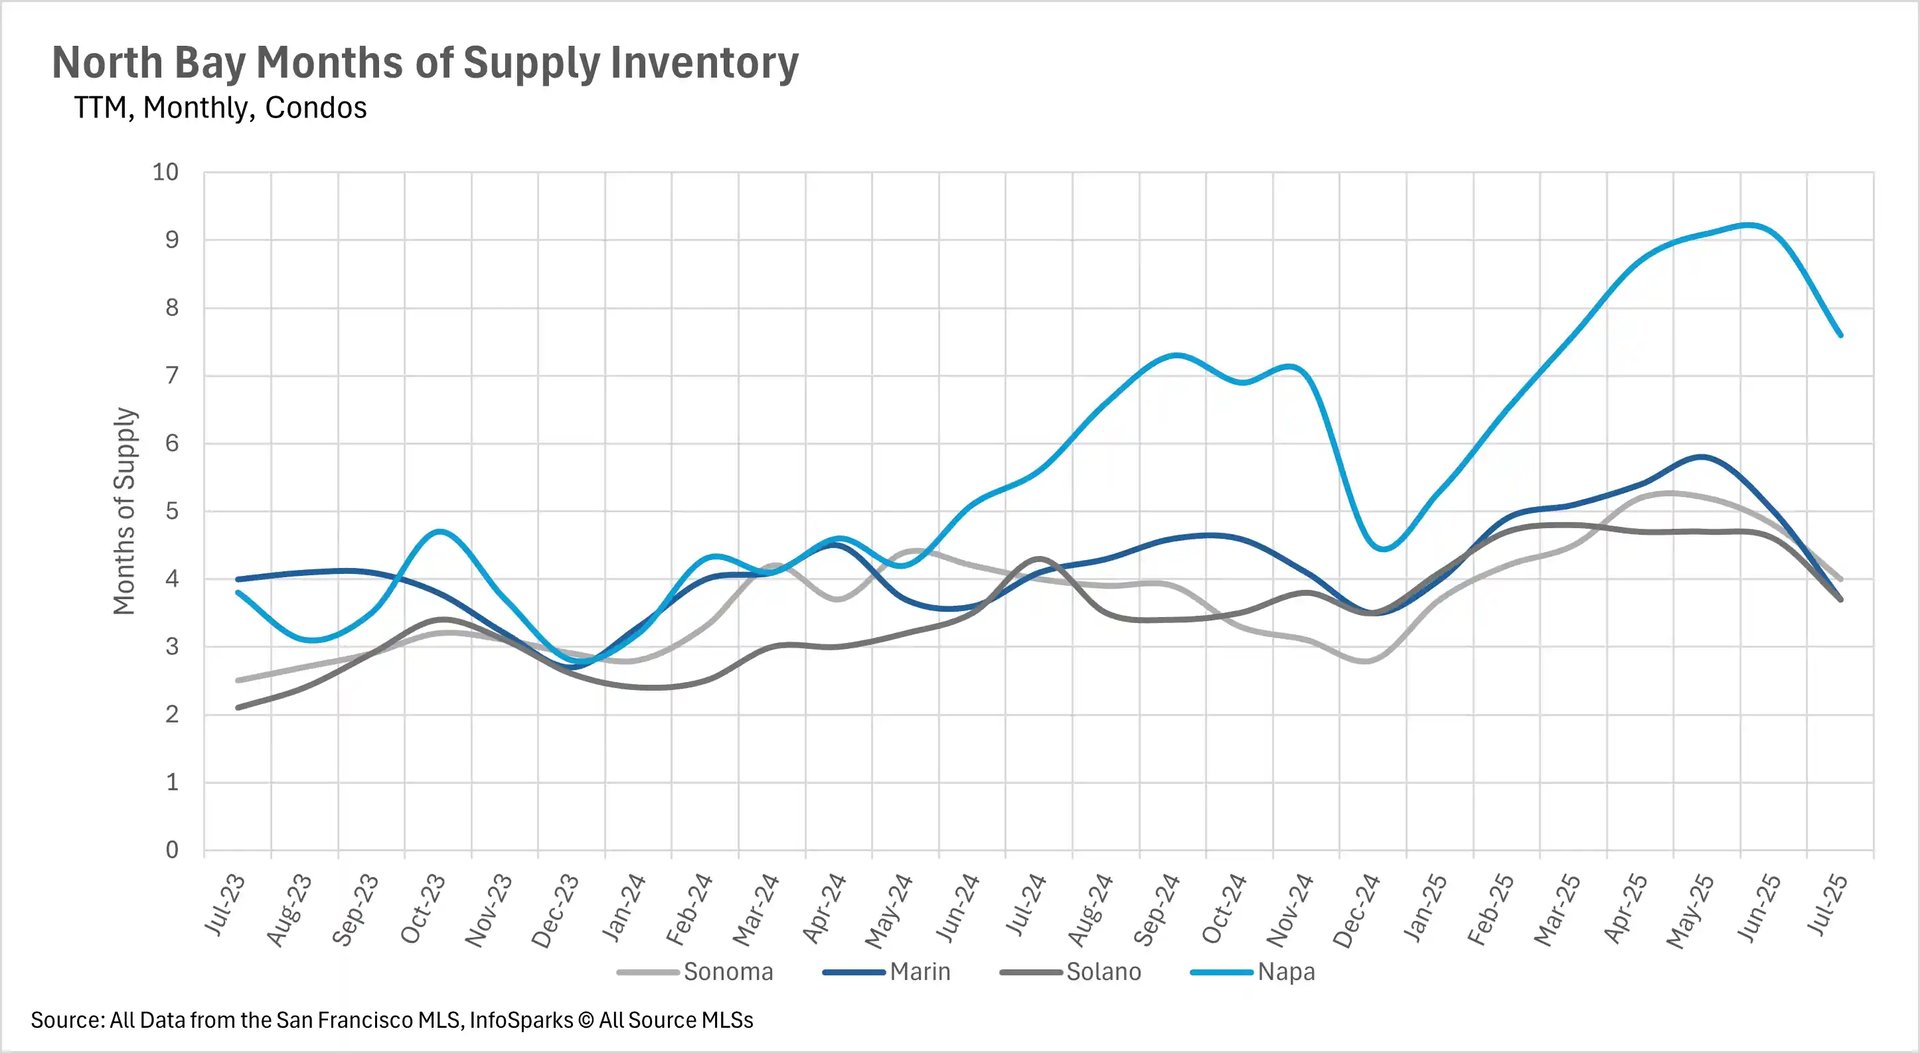
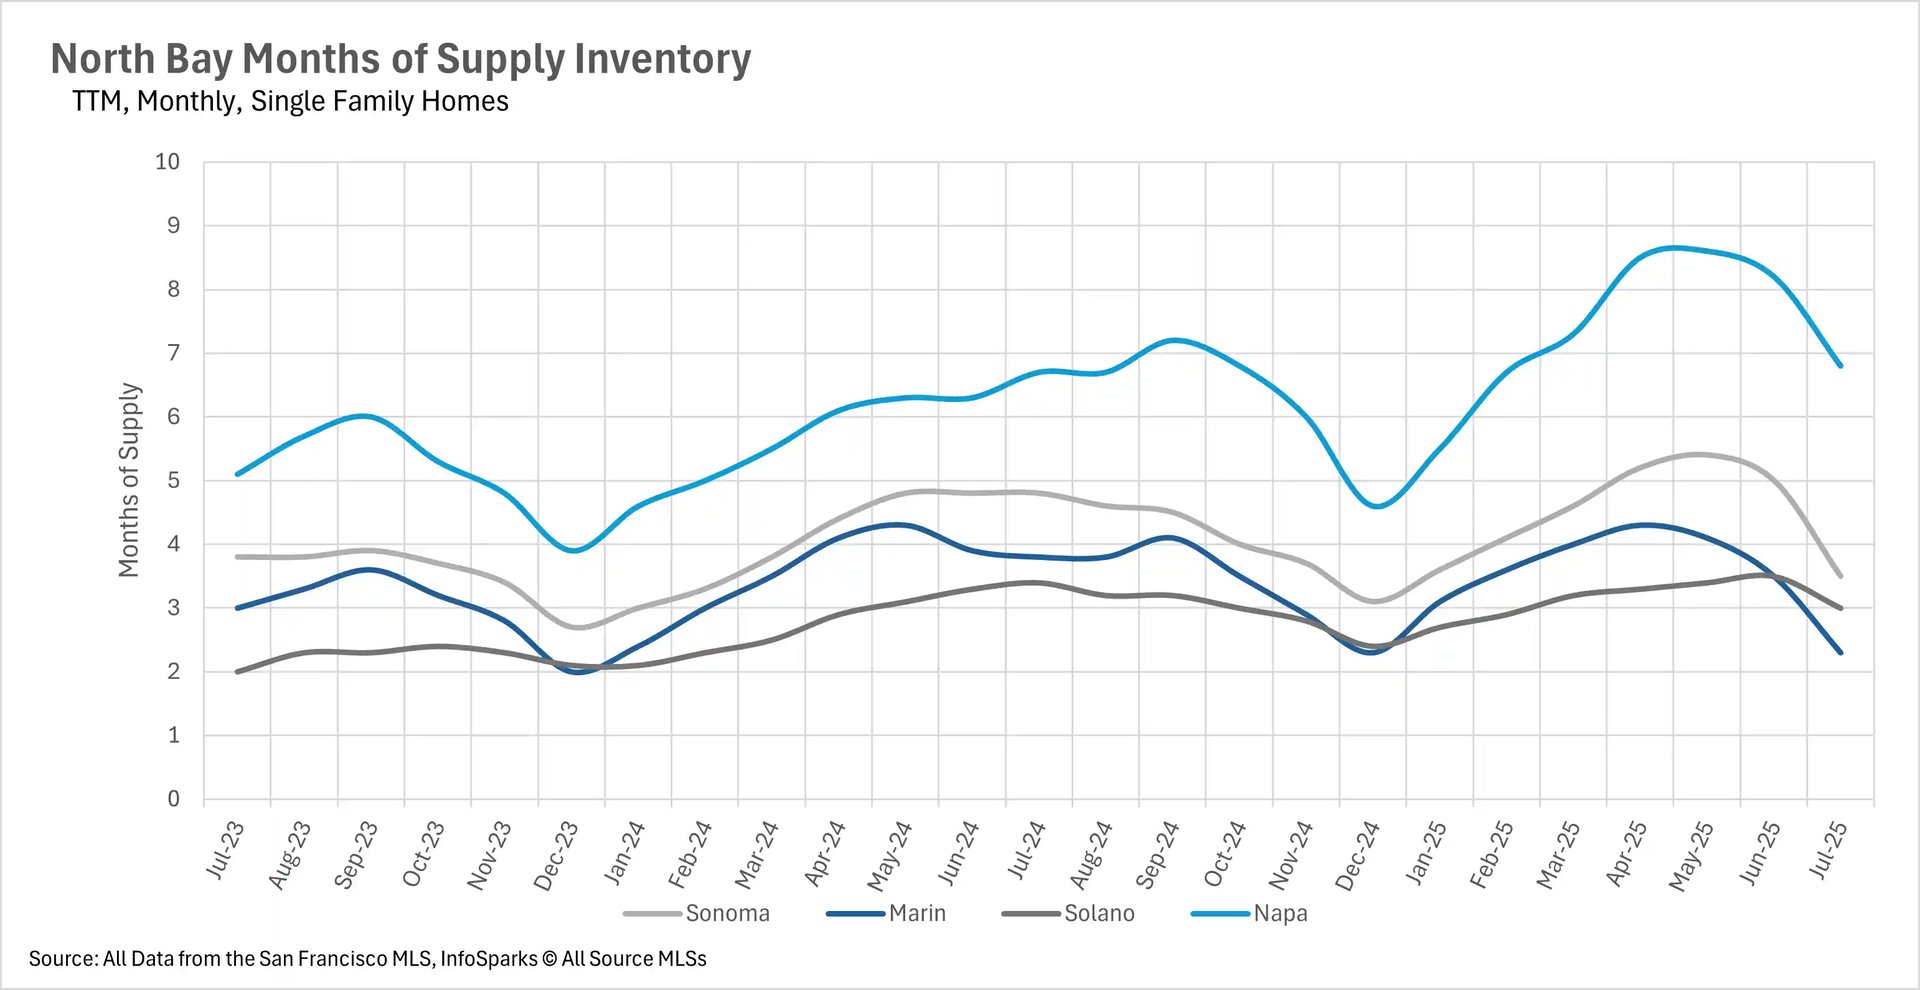
When determining whether a market is a buyers’ market or a sellers’ market, we look to the Months of Supply Inventory (MSI) metric. The state of California has historically averaged around three months of MSI, so any area with at or around three months of MSI is considered a balanced market. Any market that has lower than three months of MSI is considered a sellers’ market, whereas markets with more than three months of MSI are considered buyers’ markets.
Inventories are dropping in the North Bay, so naturally, that means competition is heating up. Sellers in every market gained a bit more bargaining power, as options for buyers became more constricted. The Marin County single-family home market flipped to a sellers market, with just 2.3 months worth of inventory available. The single-family home market in Solano County became a more balanced market, with exactly 3 months of inventory on the market. However, all other markets are buyer dominated markets, with the single-family home markets in Sonoma and Napa Counties having 3.5 and 6.8 months of inventory on the market, respectively. Additionally, the North Bay condo market as a whole remains a buyers market.