Select a Market Report to Read:
The Big Story
Quick Take:
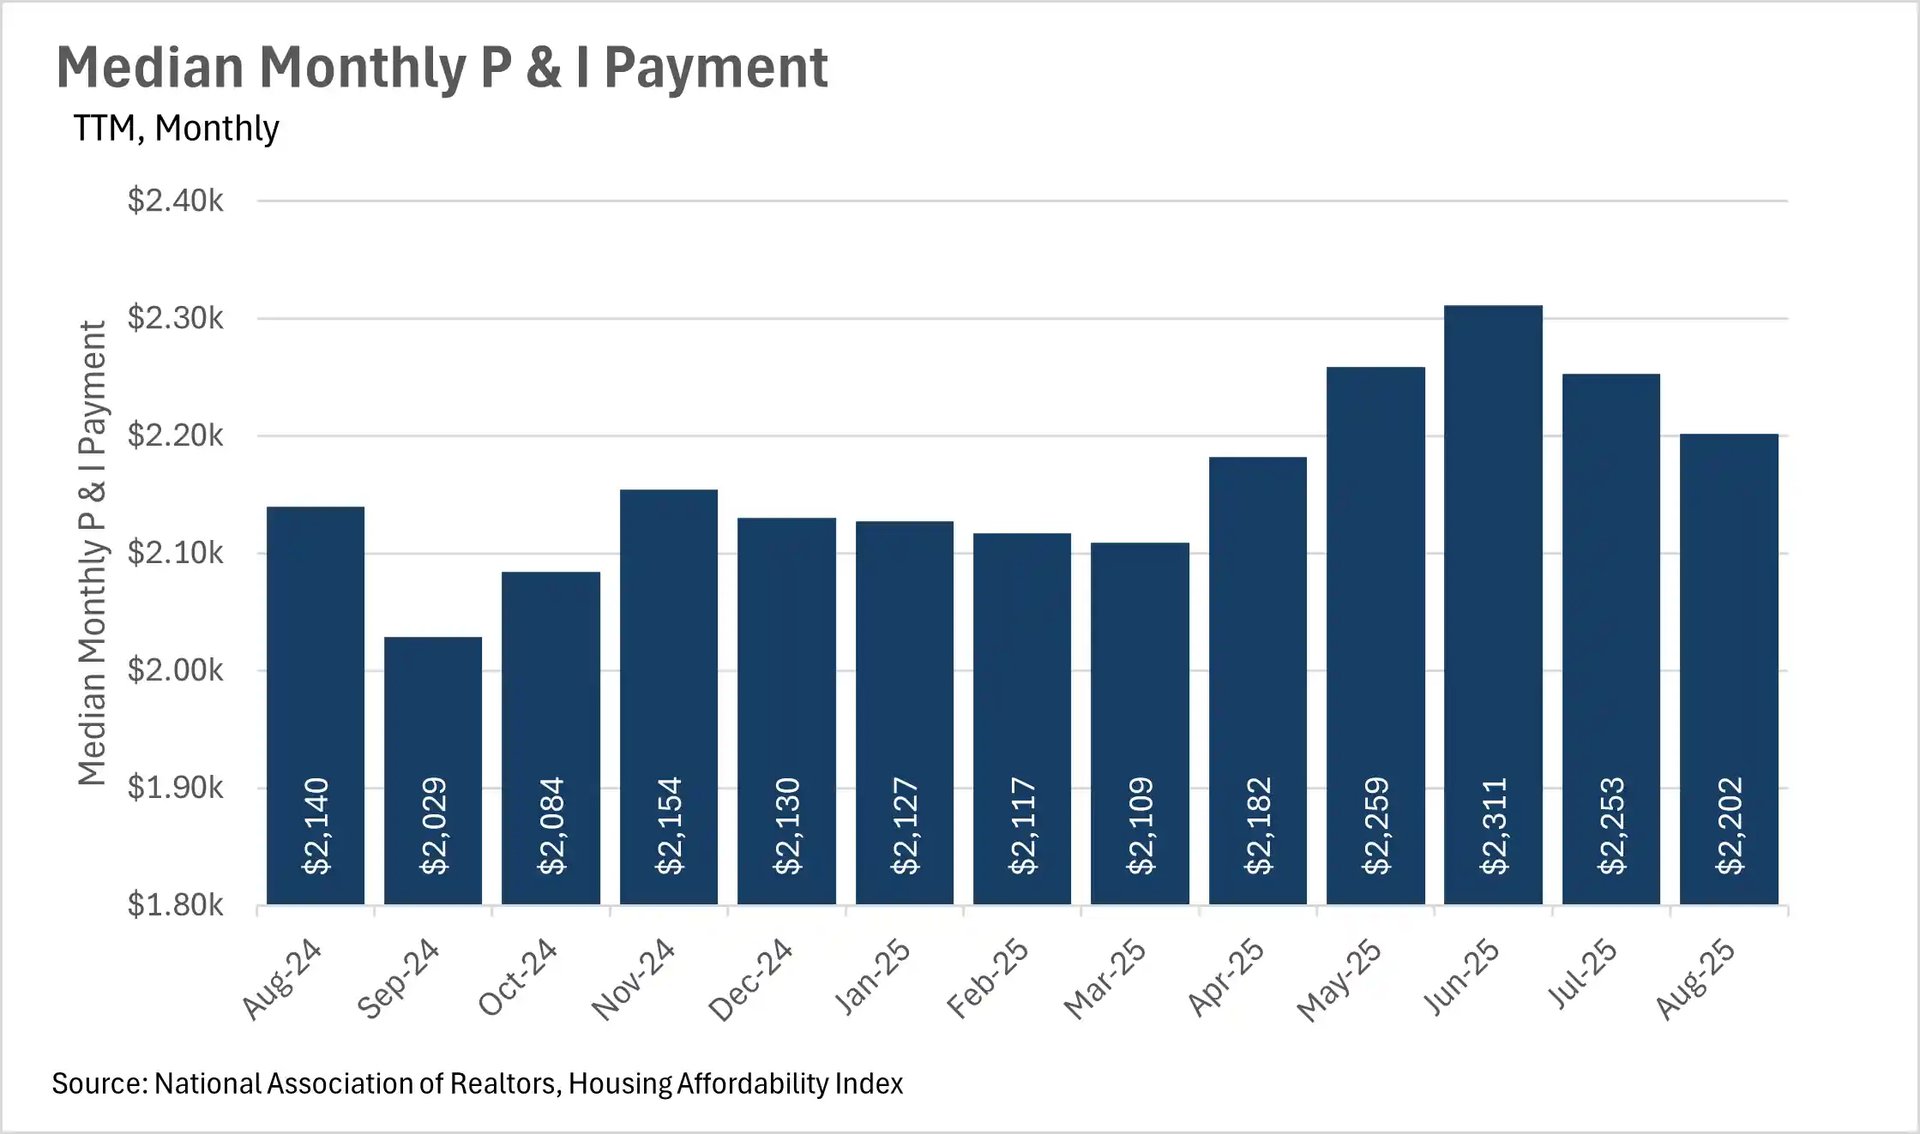
- Affordability remains an issue nationwide, as monthly P&I payments ticked up by 2.90% year-over-year.
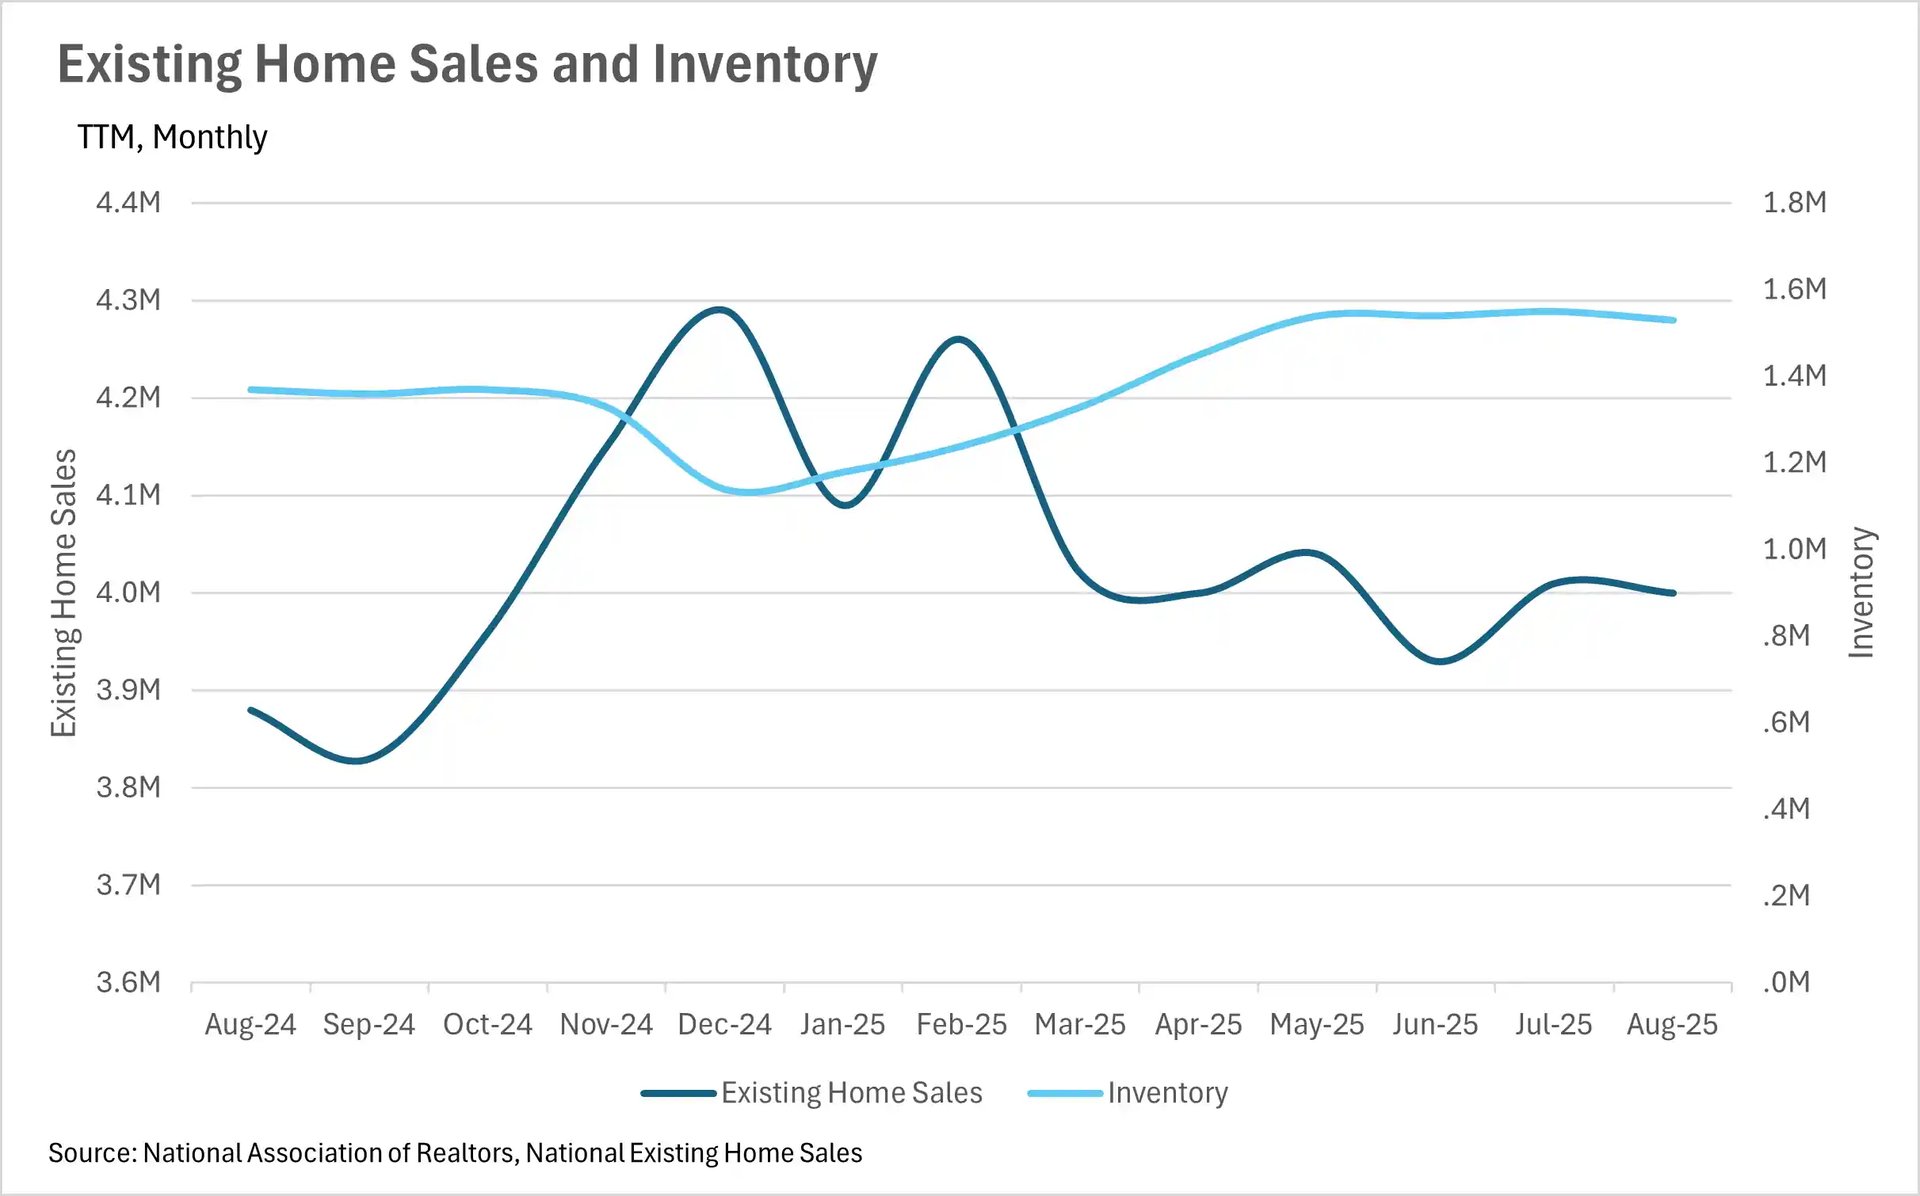
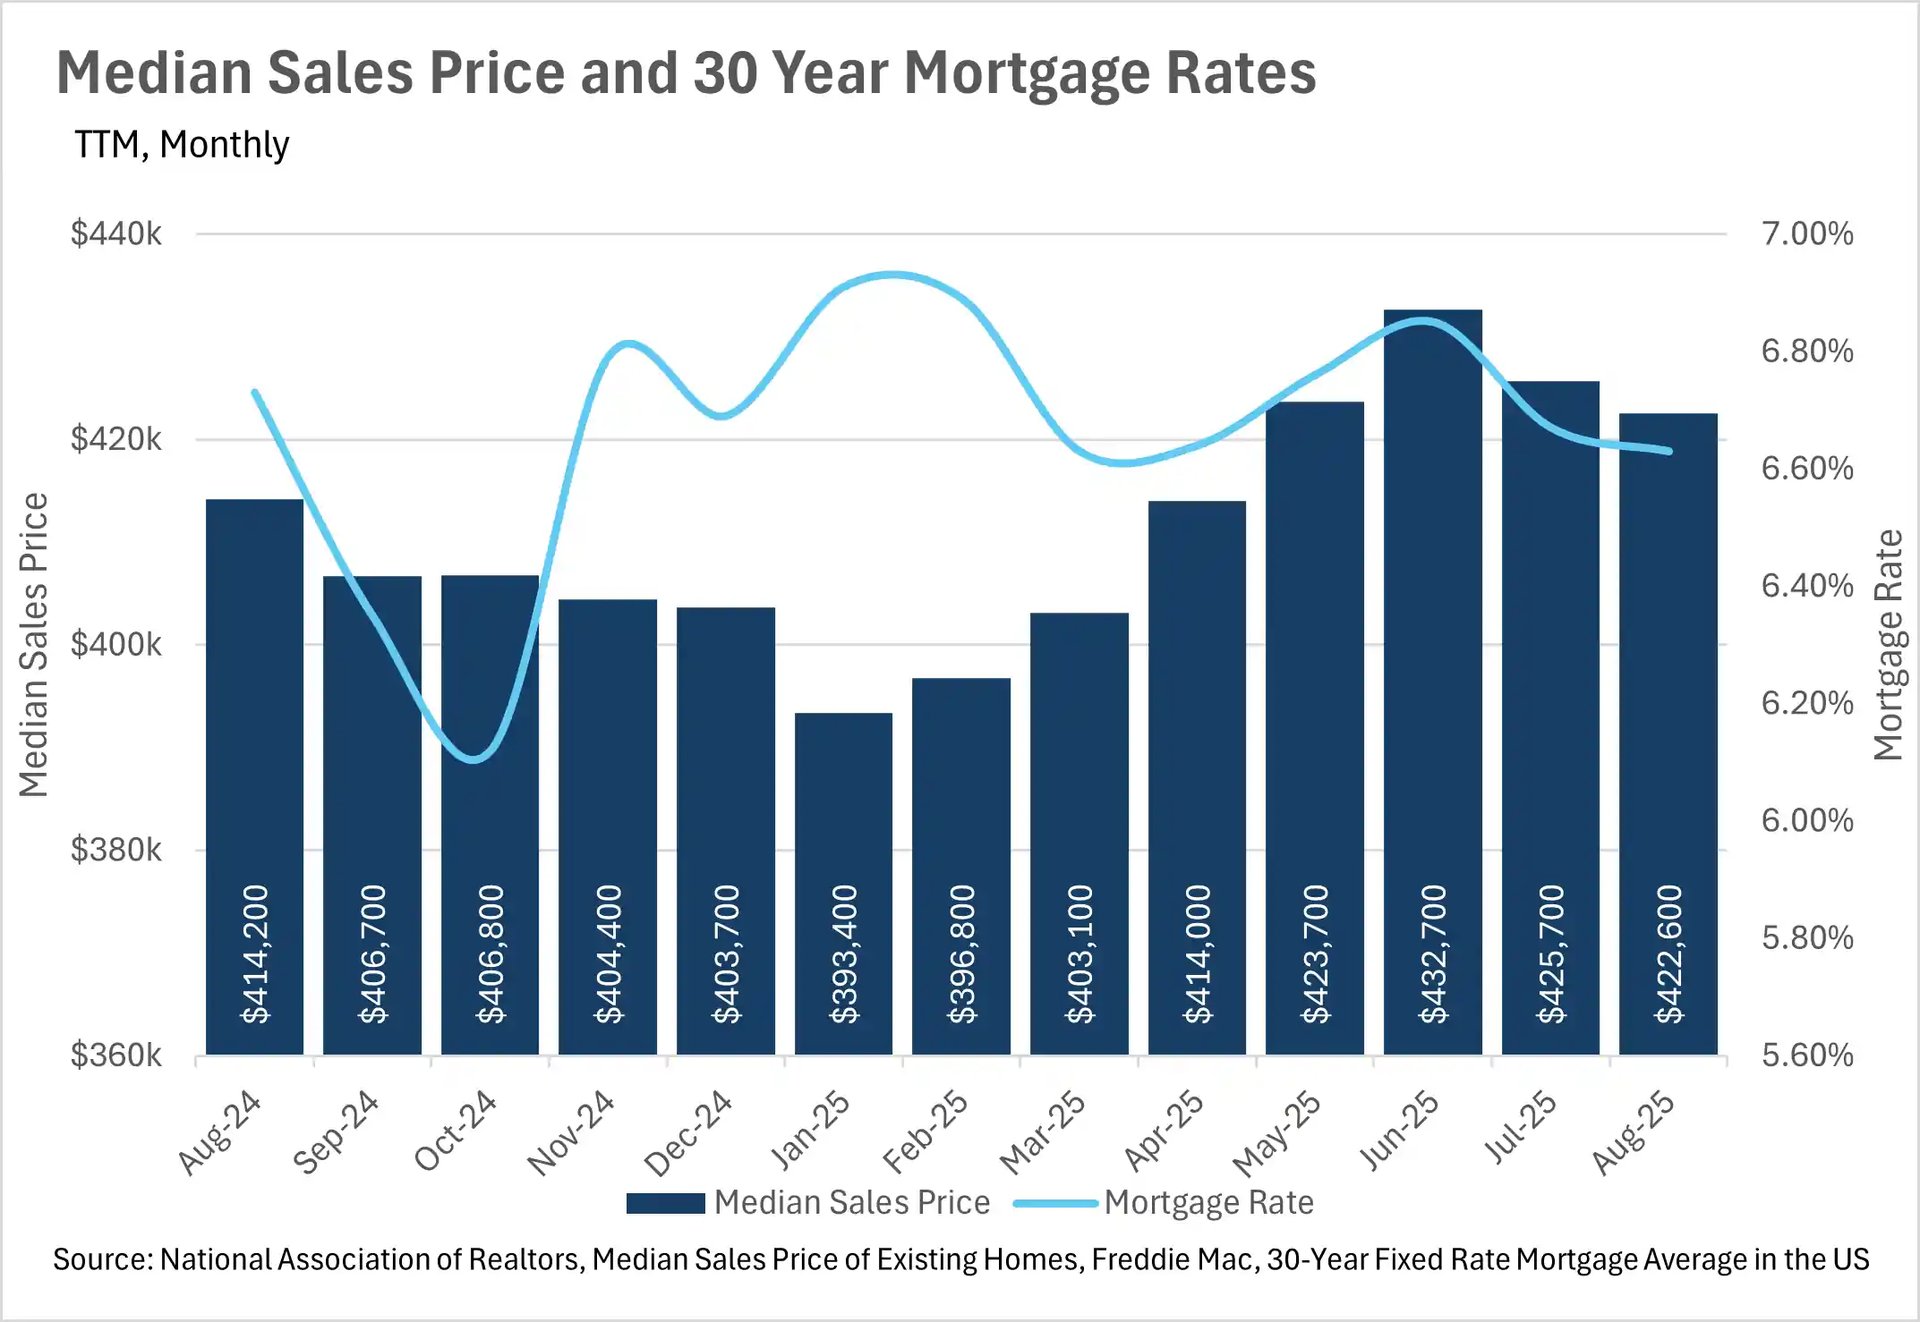
- Mortgage rates are finally starting to decline, as we enter a rate-cutting cycle.Inventories are still growing at a faster rate than existing home sales.
- Quick observation about Macroeconomics/The Broader Market
Note: You can find the charts & graphs for the Big Story at the end of the following section.
*National Association of REALTORS® data is released two months behind, so we estimate the most recent month's data when possible and appropriate.
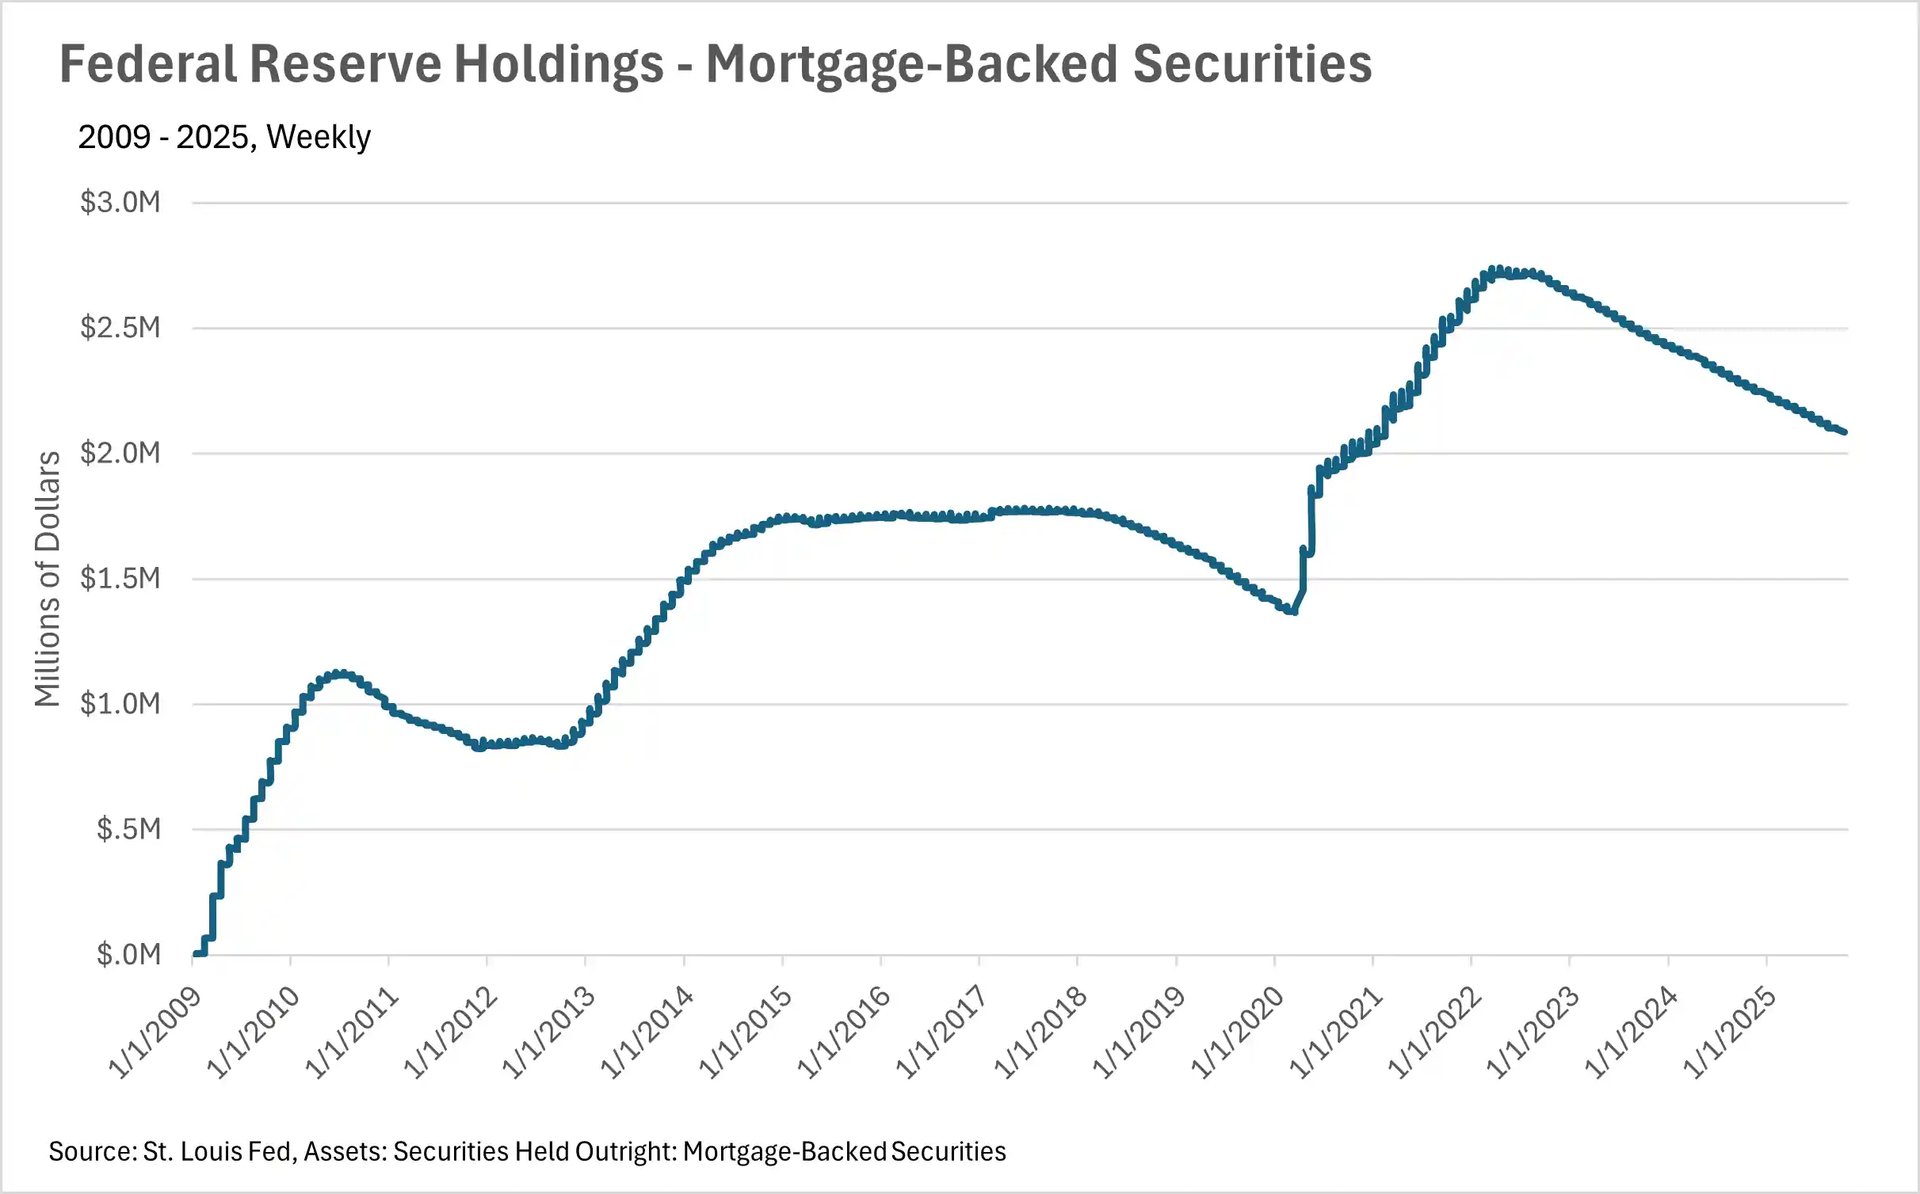
Mortgage rates have begun to decline thanks to the Fed
Recently, the Fed came out and announced a quarter-point cut to the federal funds rate, but that was not the most exciting news that they announced. Fed Chairman Jerome Powell announced that we should expect two more quarter-point cuts before the end of the year, signalling that we are in the beginning innings of a Fed cutting cycle. This, of course, is huge news for the housing market. Despite the fact that many markets have retained much of their post-pandemic gains in value, the housing market has been largely stagnant, with inventories building as home buyers decide to sit on the sidelines and wait.
Affordability remains a concern throughout the country
Housing affordability has been a huge problem facing the country ever since the onset of the COVID-19 pandemic. Although many thought that home prices would decrease as interest rates increased, many markets did not see a normalization of home prices. This, of course, has left many prospective home buyers worried about where the market will go as we enter a new rate-cutting cycle. Many fear that lower interest rates may bring a slew of new buyers to the market, pushing home prices up even further, and making home ownership even less attainable for first-time buyers. On the flip side, homeowners stand to benefit in a huge way if declining interest rates lead to a housing frenzy, as they’ll accumulate significant equity in a very small period of time, just like what we saw throughout 2020-2022.
Inventories continue to build nationwide
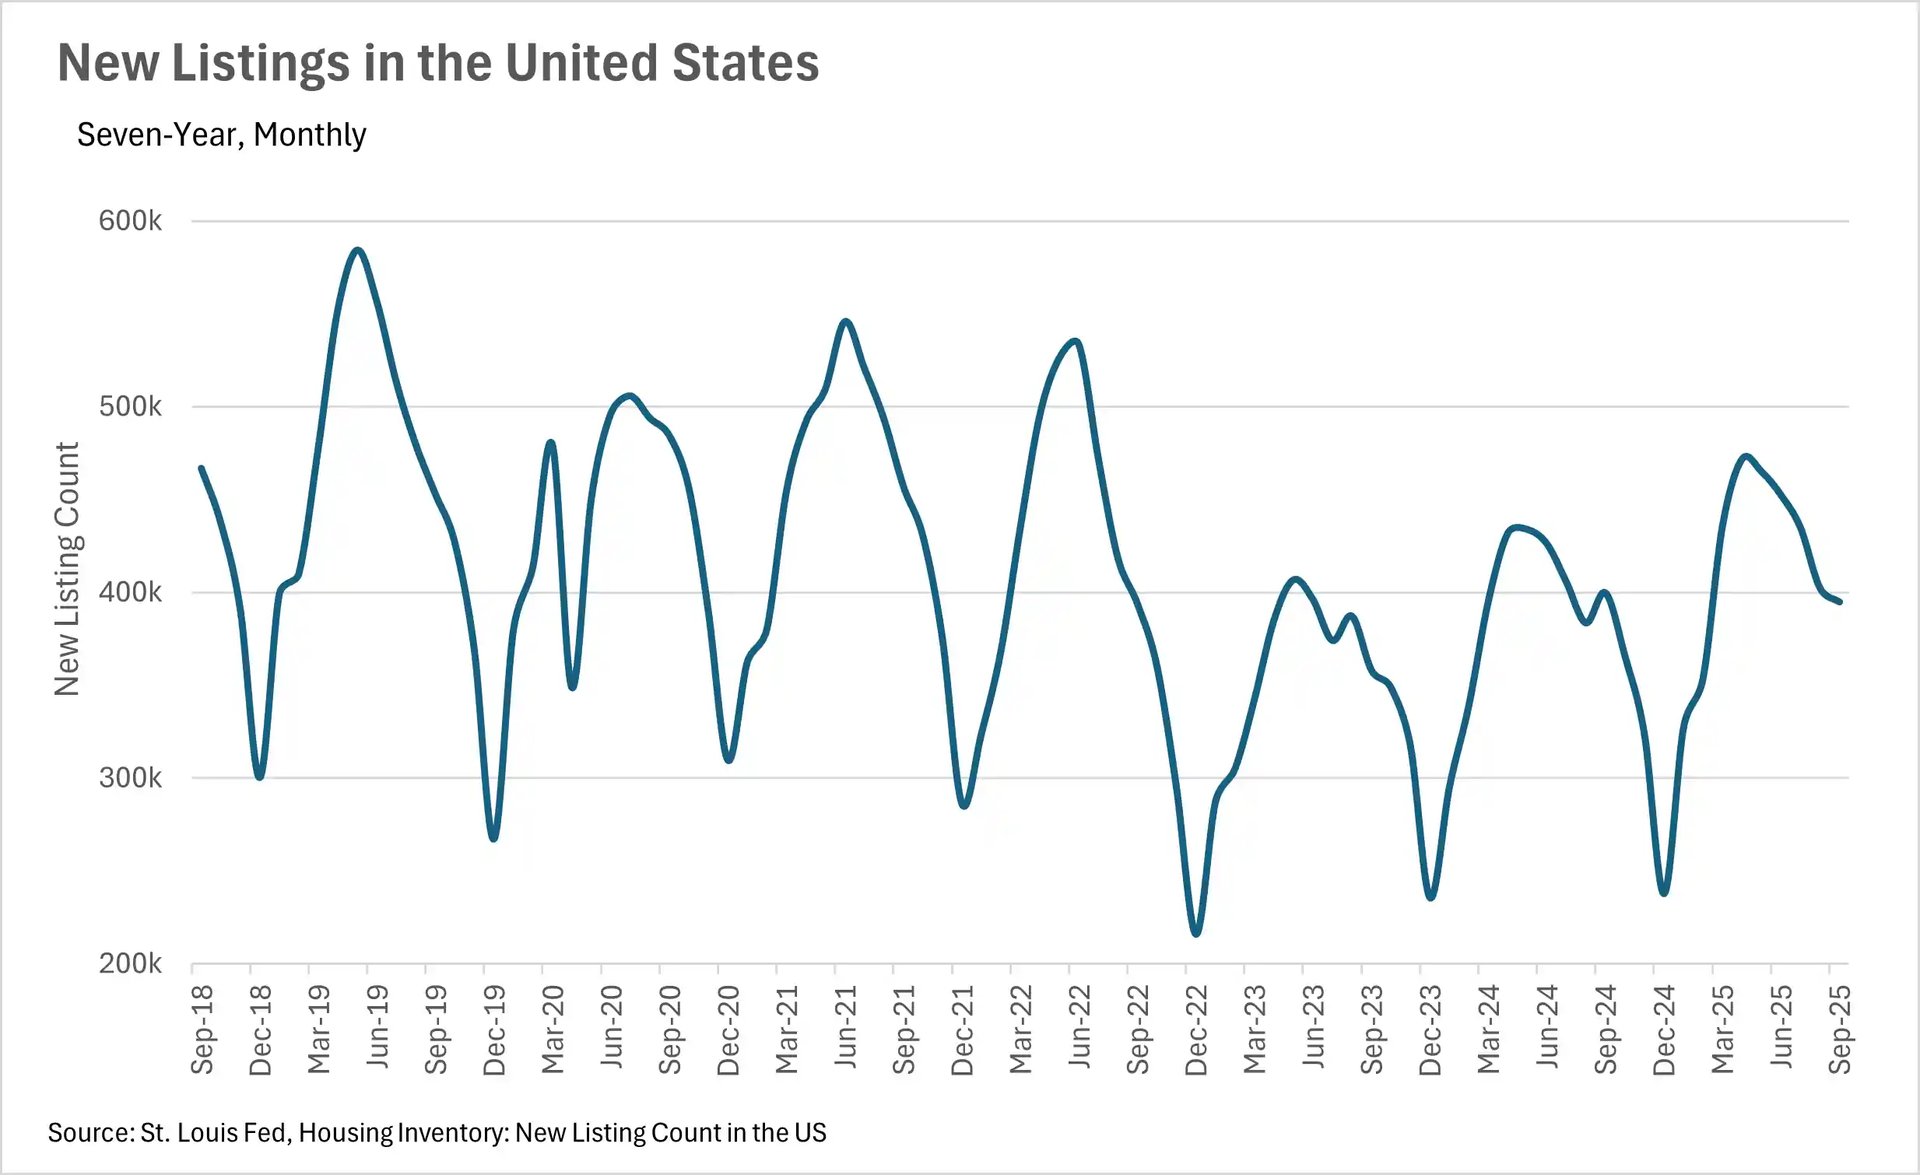
As we mentioned above, the national inventory is quite a bit higher than last year, with 11.68% more homes listed on the market. This really underscores the fact that buyers have decided mainly to throw in the towel and wait for a better chance to purchase a home. When you combine this with the fact that there were 4.88% more new homes hitting the market than this time last year, you have a recipe for growing inventory!
Current market dynamics have created an interesting setup for 2026
As we move into the seasonally slow months, the market environment that we’re in is setting up for what could be a very interesting 2026. Inventories are still growing (for now), and interest rates are falling, which could put us in a very interesting position when the spring frenzy begins next year. It’ll be important to keep a keen eye on both the market and broader macroeconomic conditions throughout the fall and winter, so that you and your clients are ready for whatever spring has to throw at you.
All of this is just what we’re seeing at a national level, though. To get a better idea of what’s going on in your local market, be sure to check out your local lowdown below: