Select a Market Report to Read:
The Local Lowdown
Quick Take:
- Median sale prices have remained roughly stagnant year-over-year
- Inventories declined on a year-over-year basis for the first time in months!
- The average listing is quite a bit more time on the market.
Note: You can find the charts/graphs for the Local Lowdown at the end of this section.
*National Association of REALTORS® data is released two months behind, so we estimate the most recent month's data when possible and appropriate.
Median sale prices remain stagnant as we move closer to winter
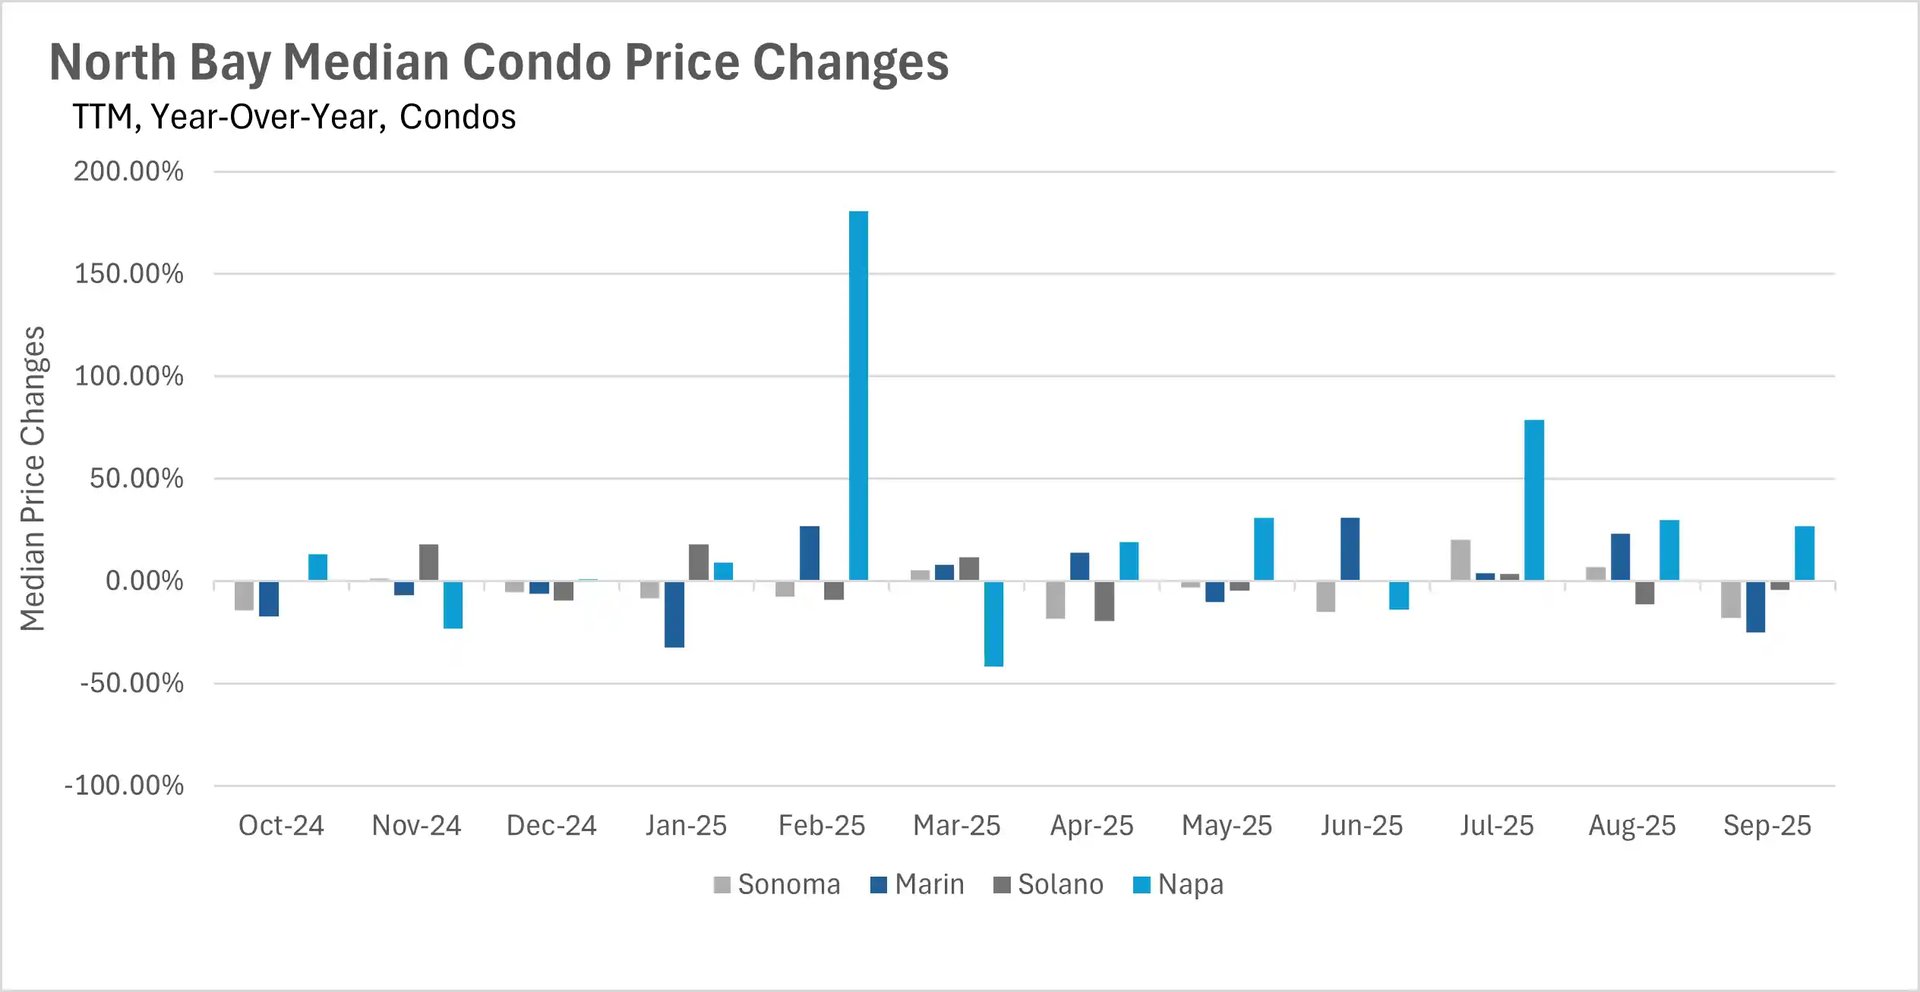
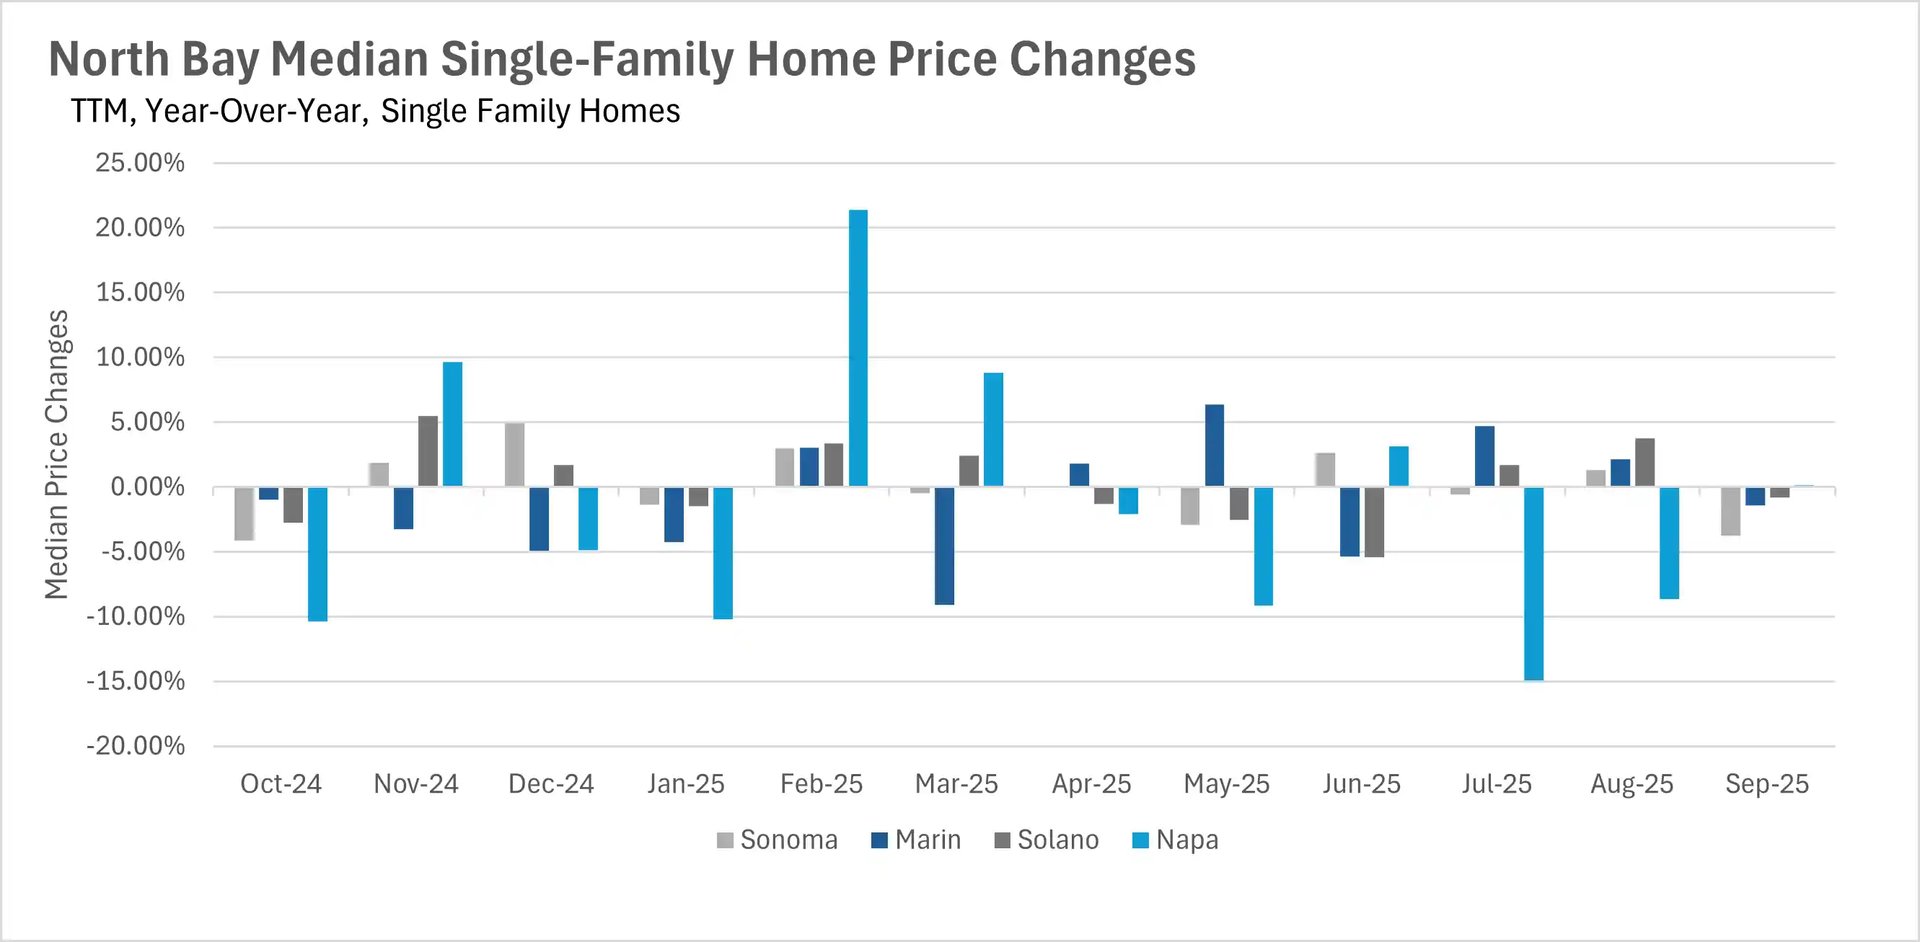
This past month, there wasn’t much movement in terms of median sale prices in the North Bay. Sold listing prices are generally staying within their pricing bands, despite the fact that we saw quite a bit of inventory accumulate over the past six months or so. This means that the market has remained tremendously strong. The median listing in Sonoma County is selling at a 3.47% discount to last year’s pricing, while Marin and Solano County listings sell for 1.43% and 0.81% discounts, respectively. The median Napa County listing is actually selling for a very small premium to last year, with the median sale price for homes in the area coming in at 0.17% more on a year-over-year basis.
Inventories are beginning to decline?
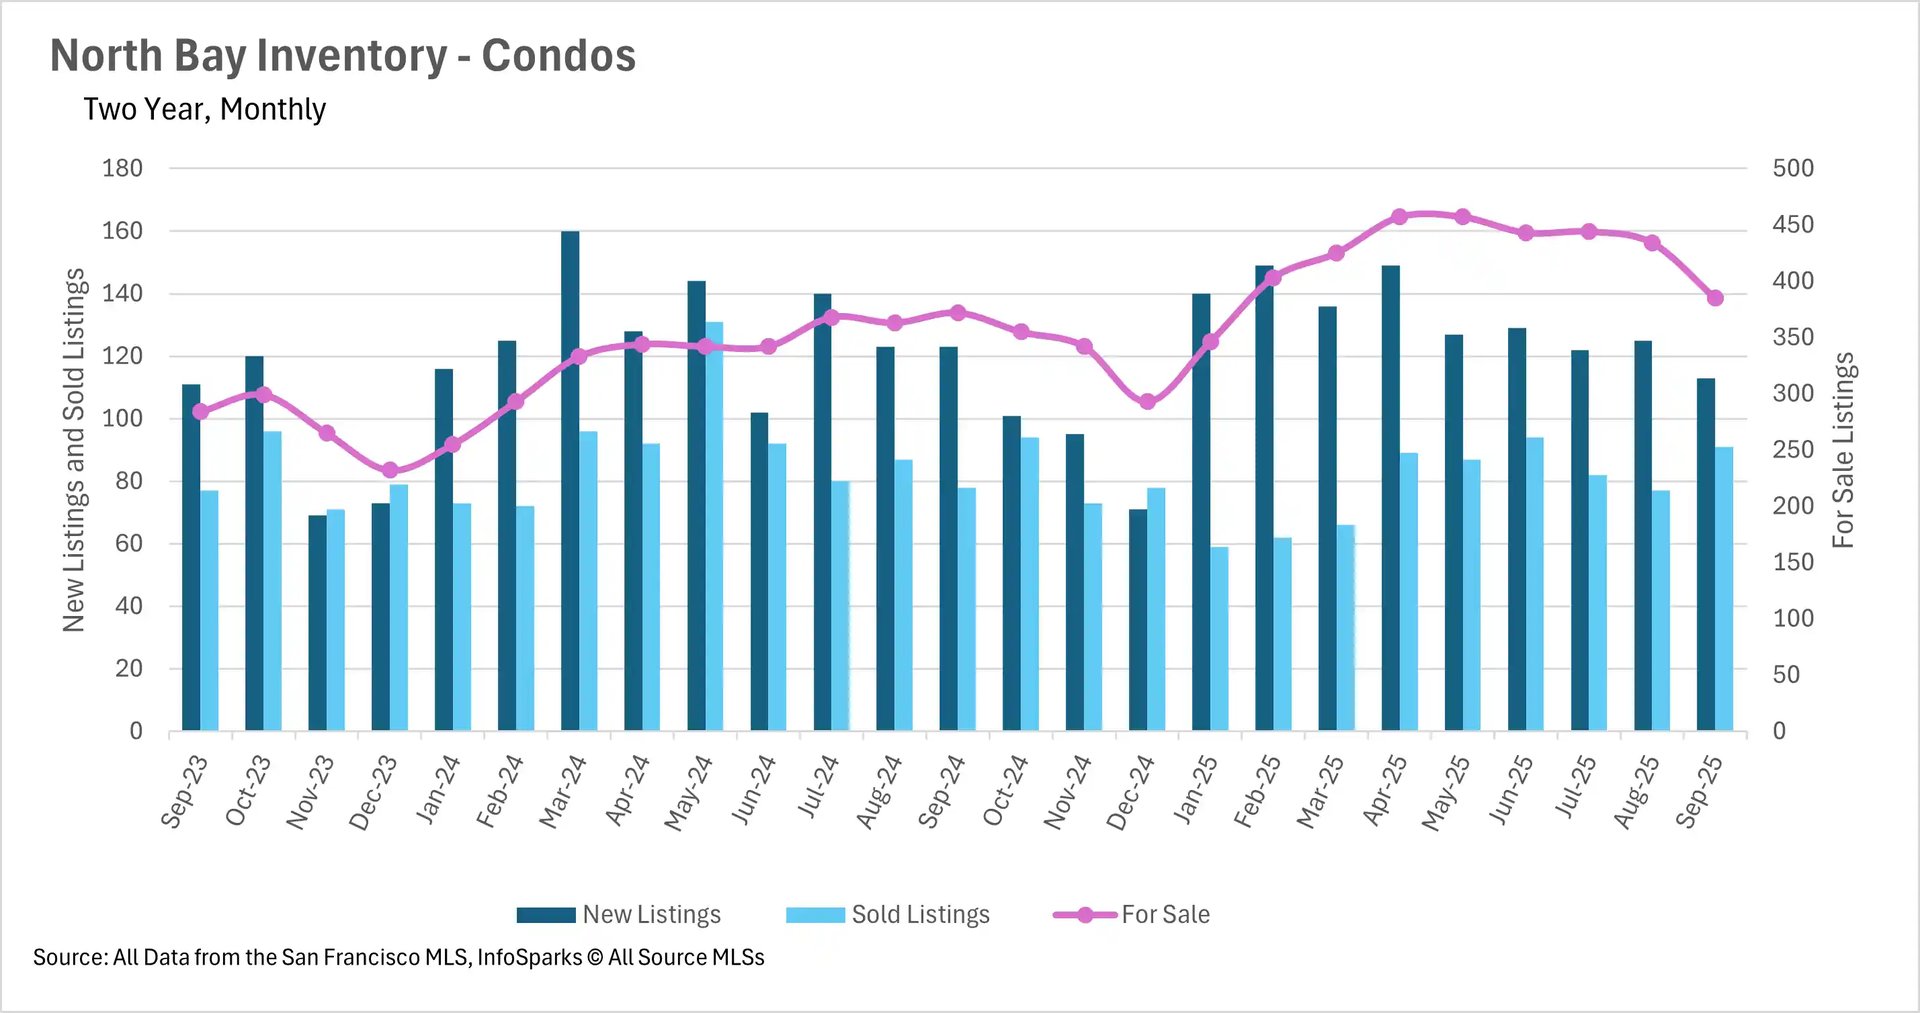
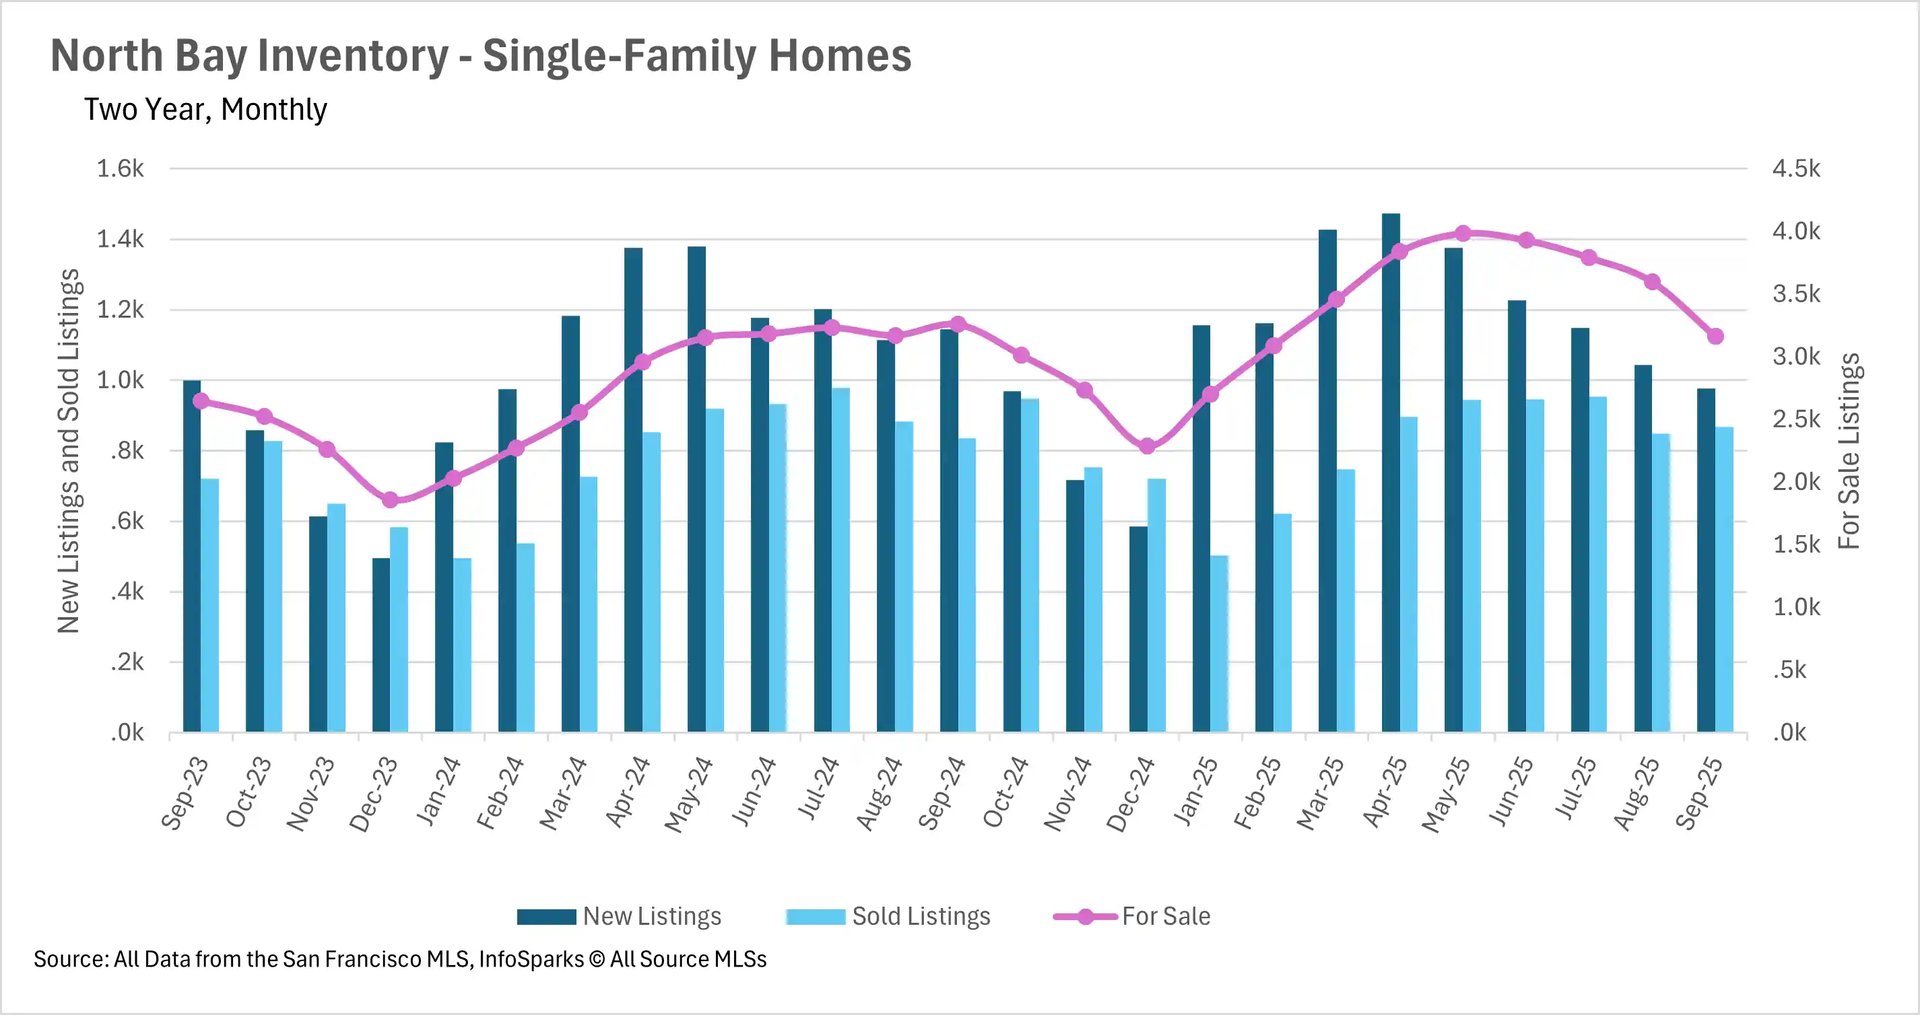
For the first time in several months, we actually saw year-over-year declines in the amount of active inventory in the single-family home market. The number of for-sale listings declined by 2.98%, which is huge considering the inventory levels we’ve seen throughout the summer. This decline in inventory was largely caused by a sharp 14.75% decline in the number of new listings hitting the market, and a slight 3.95% increase in the number of listings that were sold. This, of course, caused a drastic 12.14% drop in inventories on a month-over-month basis! However, when we look at the condo market, inventories are still at a slightly elevated level, with 3.49% more listings on the market right now, than there were last year.
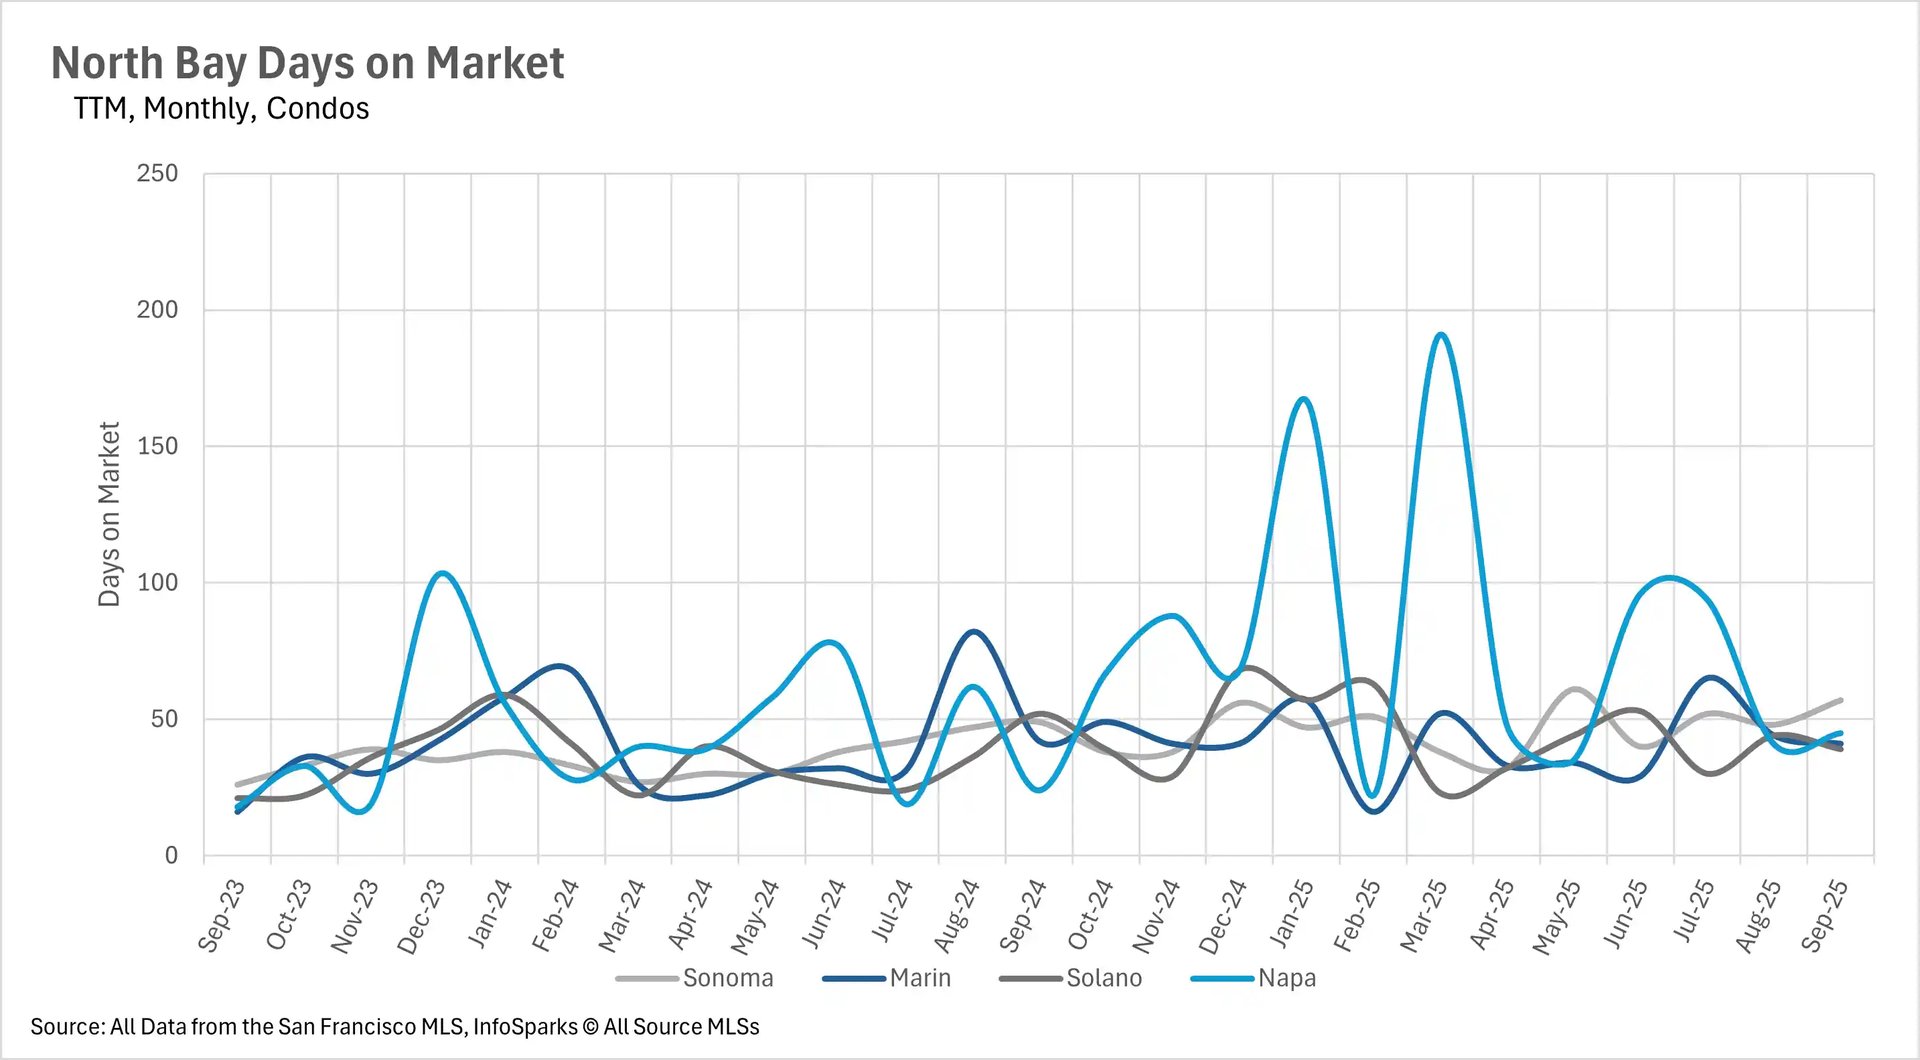
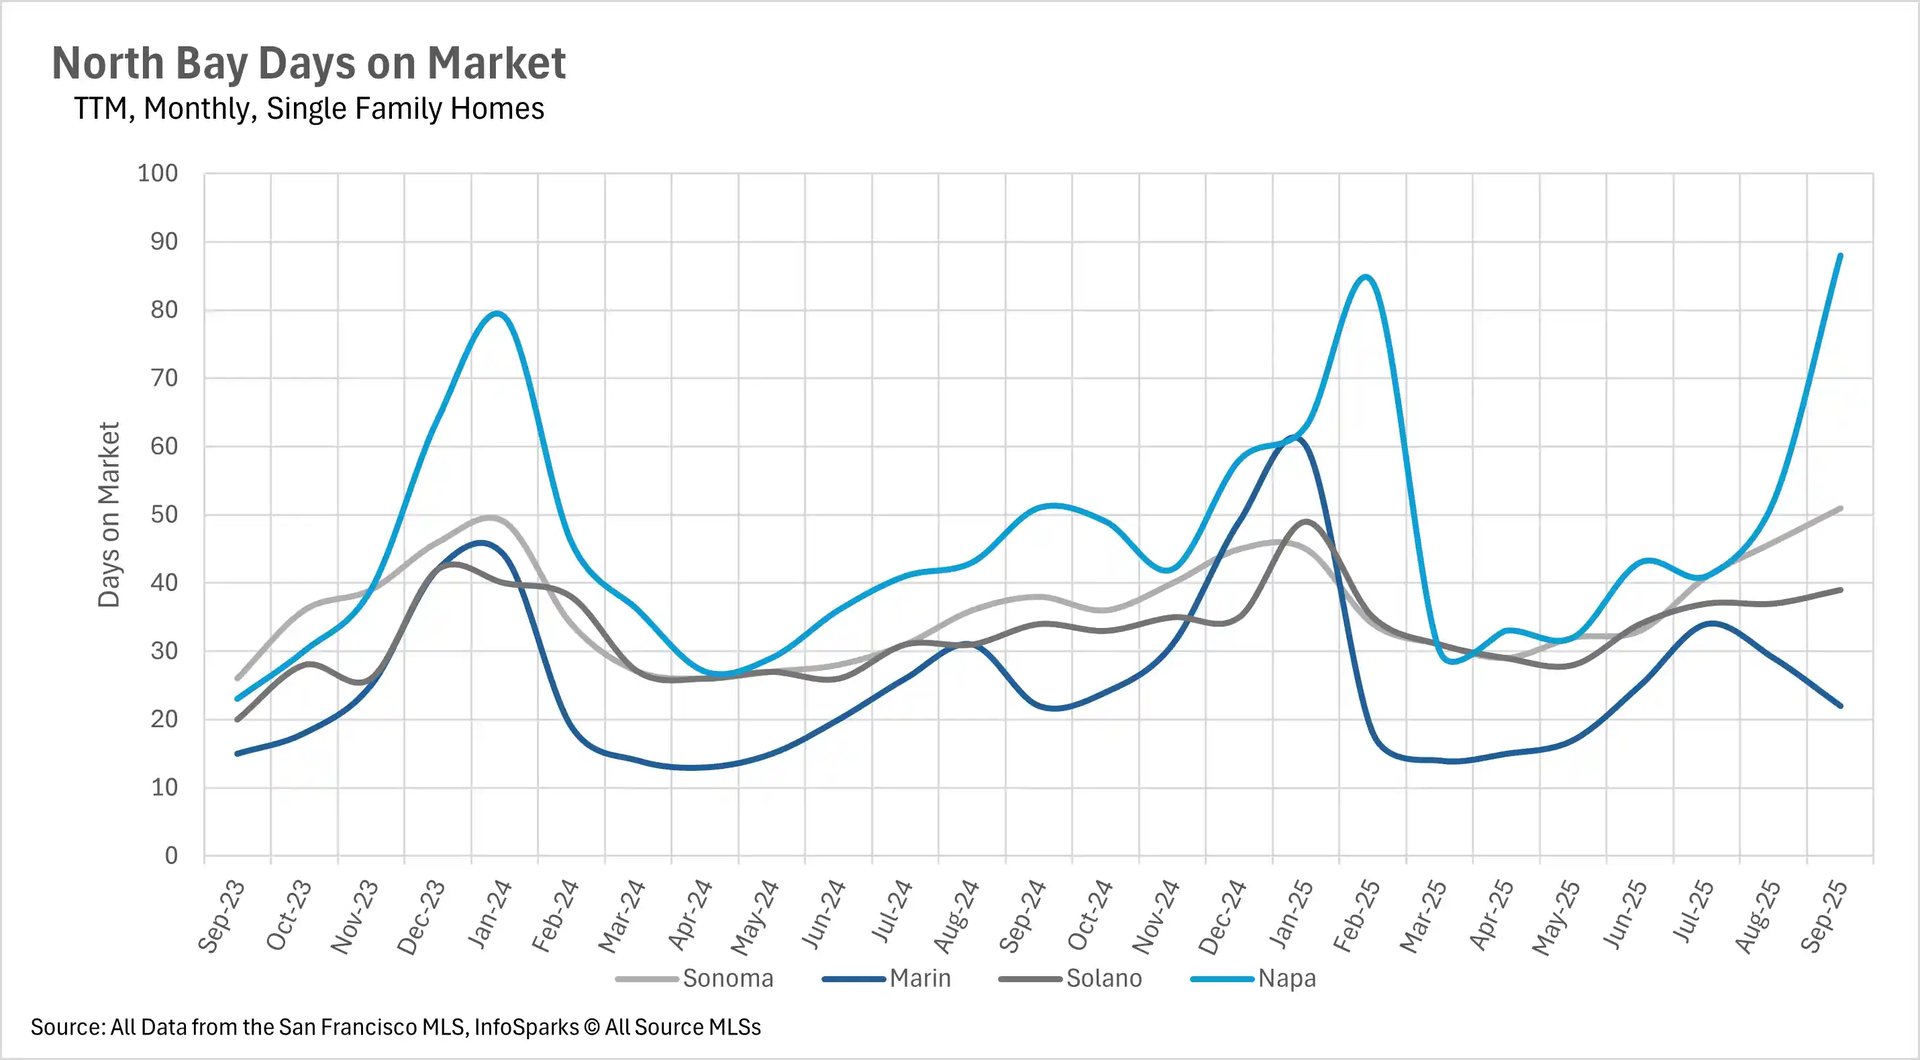
The average Napa County listing spends 88 days on the market
Although we saw an inventory decline last month, it may take a month or two to see a decline in the amount of time that listings are spending on the market. As of right now, listings in Napa and Sonoma Counties are spending more time on the market in September than they were throughout the holiday season last year! The average single-family home listing in Napa County is spending a whopping 88 days on the market, marking a 72.55% year-over-year increase and a 69.23% month-over-month increase! Single-family homes in Solano and Sonoma Counties are also spending a good bit longer on the market, with average listings on the market for 14.71% and 34.21% longer, respectively. Surprisingly, Marin County listings are spending the exact same amount of time on the market as they were last year!
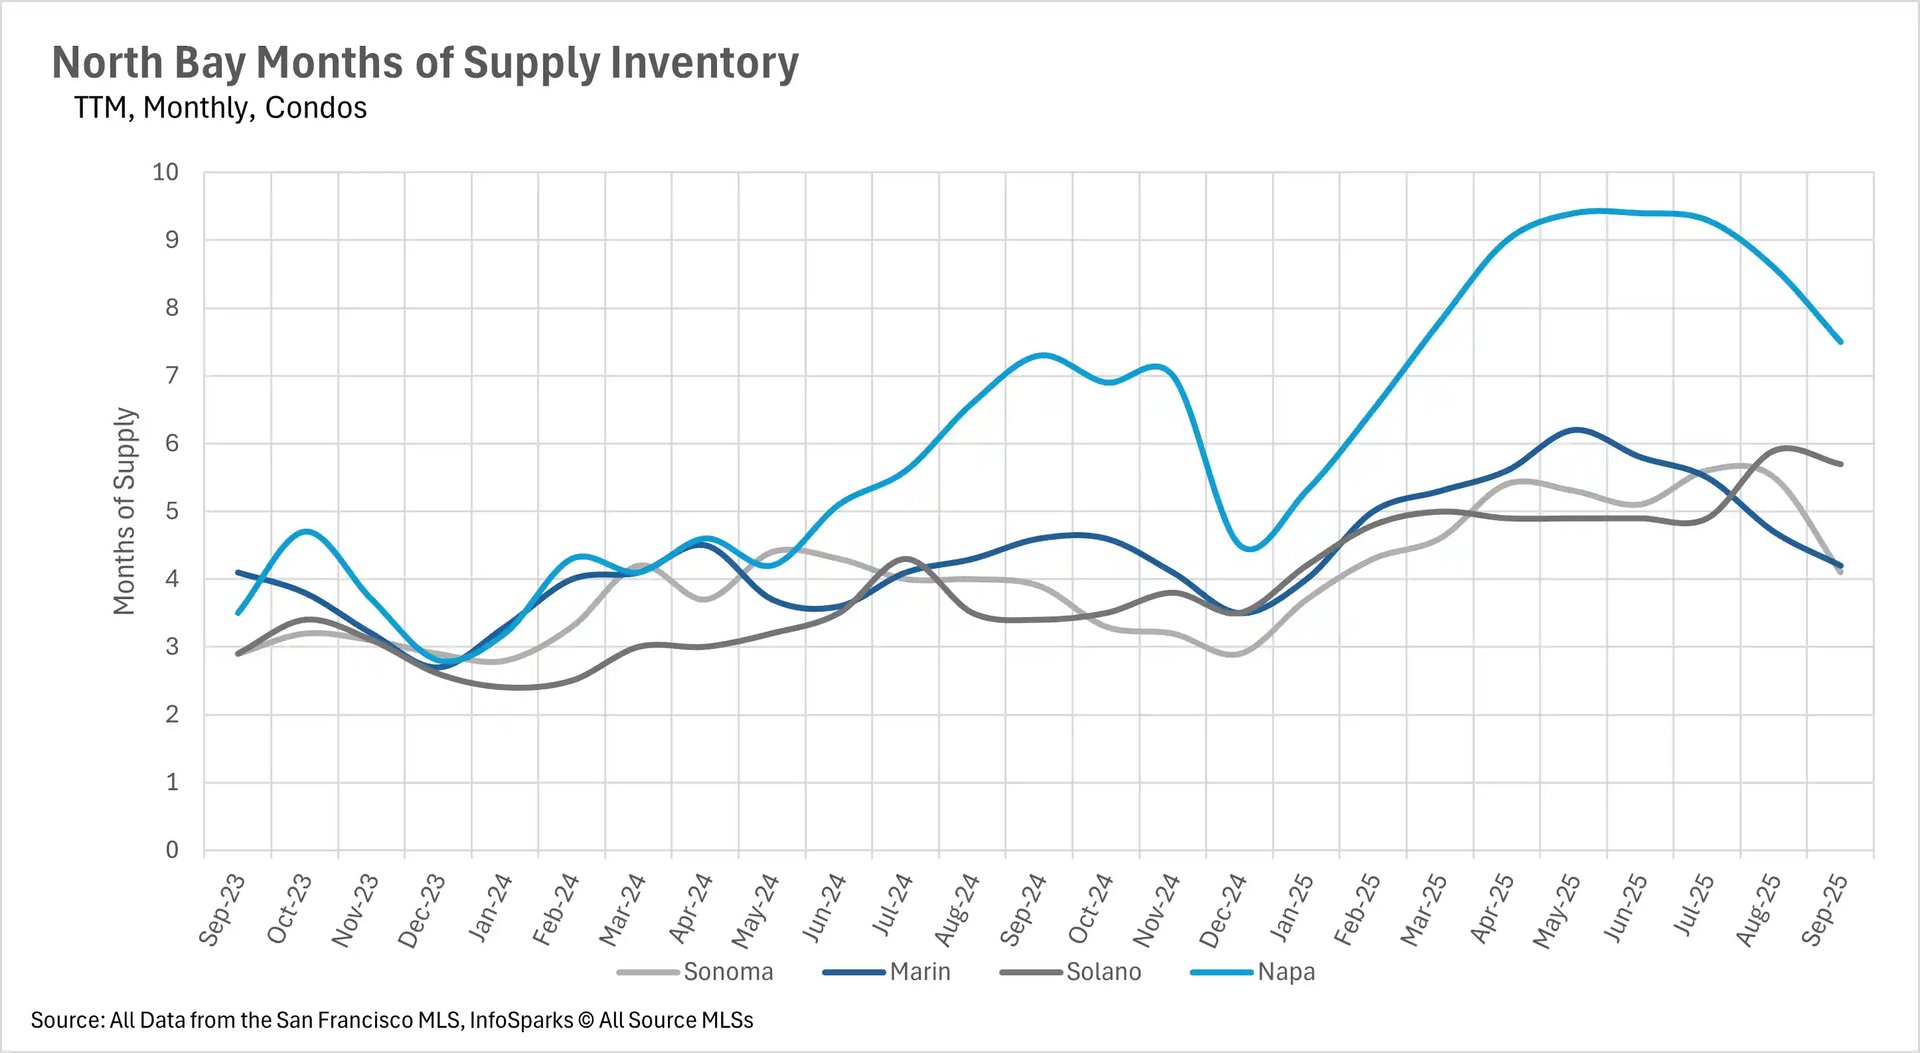
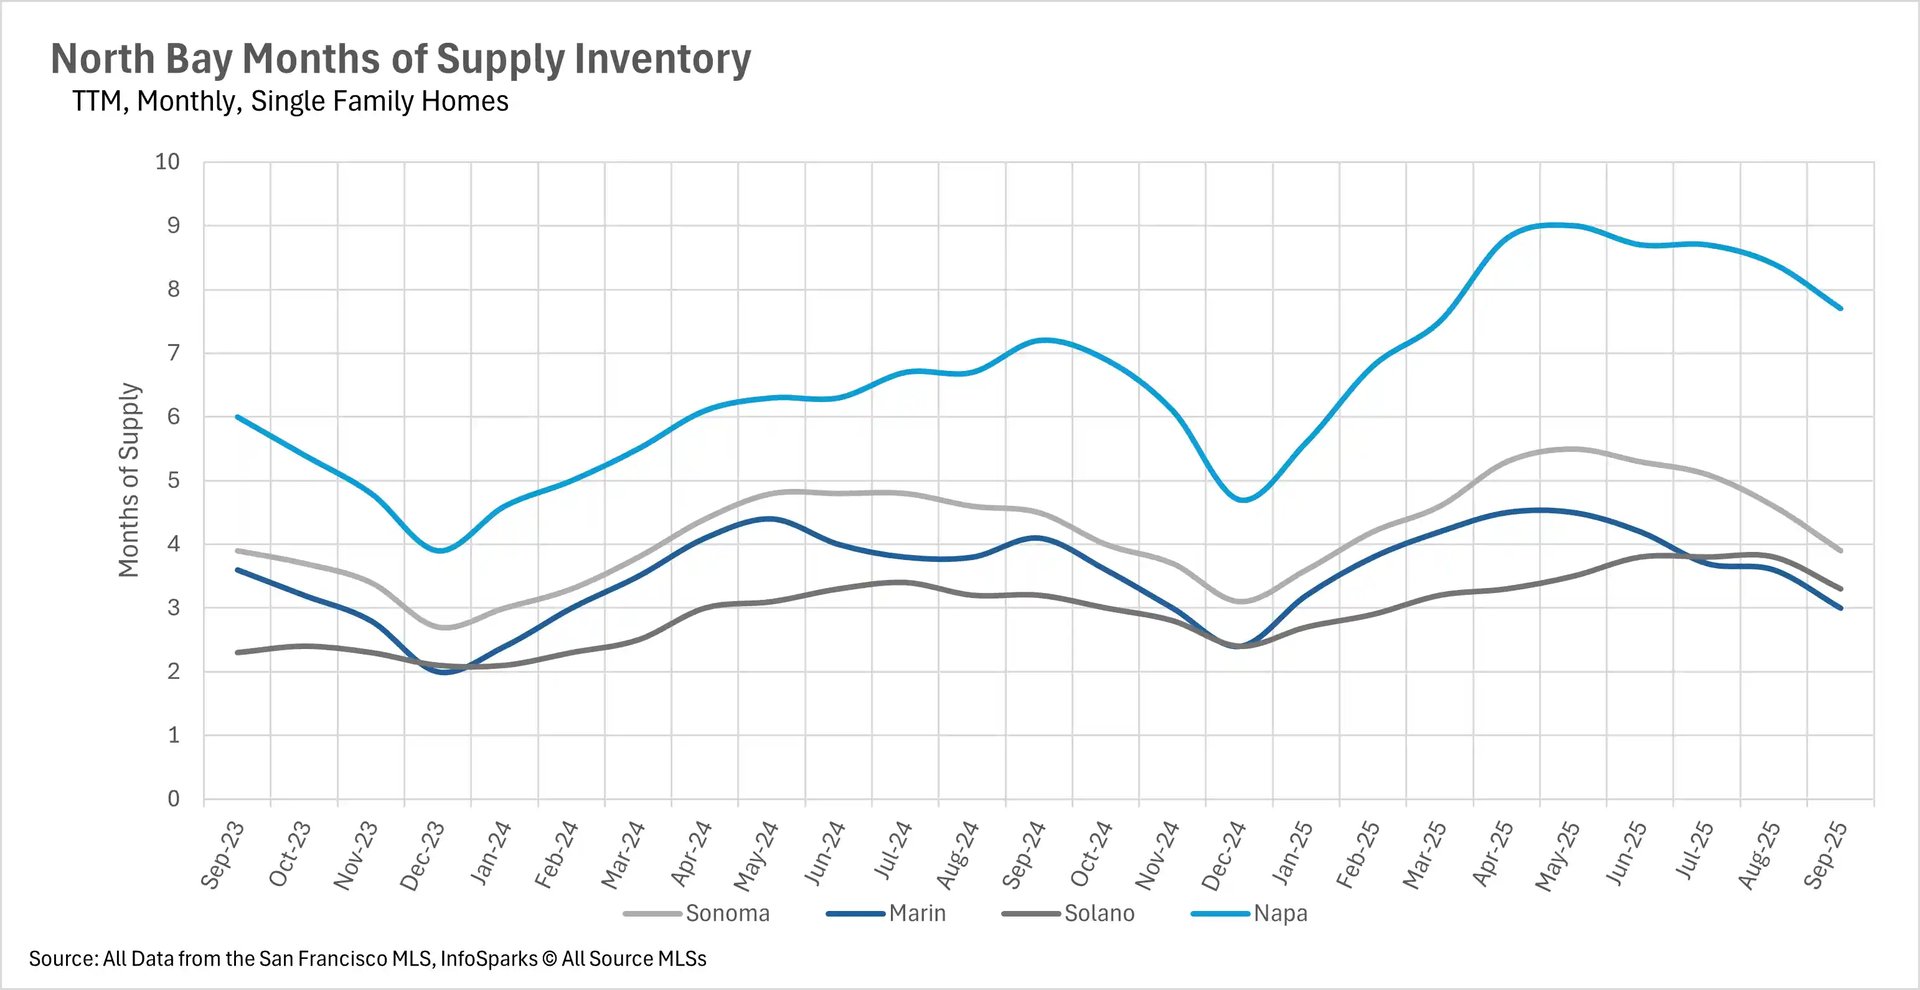
The continued shift in power towards sellers
When determining whether a market is a buyers’ market or a sellers’ market, we look to the Months of Supply Inventory (MSI) metric. The state of California has historically averaged around three months of MSI, so any area with at or around three months of MSI is considered a balanced market. Any market that has lower than three months of MSI is considered a seller’s market, whereas markets with more than three months of MSI are considered buyers’ markets.
As inventories decline, we’re seeing the broader market move back toward a seller's market. In the single-family home market, Marin County is a balanced market, with exactly 3 months' worth of inventory on the market, whereas Sonoma, Solano, and Napa County are slowly creeping back toward a balanced market, with 3.9, 3.3, and 7.7 months' worth of inventory on the market. Turning to the condo market, the entire market is a buyer's market that’s slowly drifting toward a balanced market as well, with 4.1 months of inventory on the market in Sonoma County, 4.2 months in Marin County, 5.7 months in Solano County, and 7.5 months in Napa County.