Select a Market Report to Read:
The Local Lowdown
Quick Take:
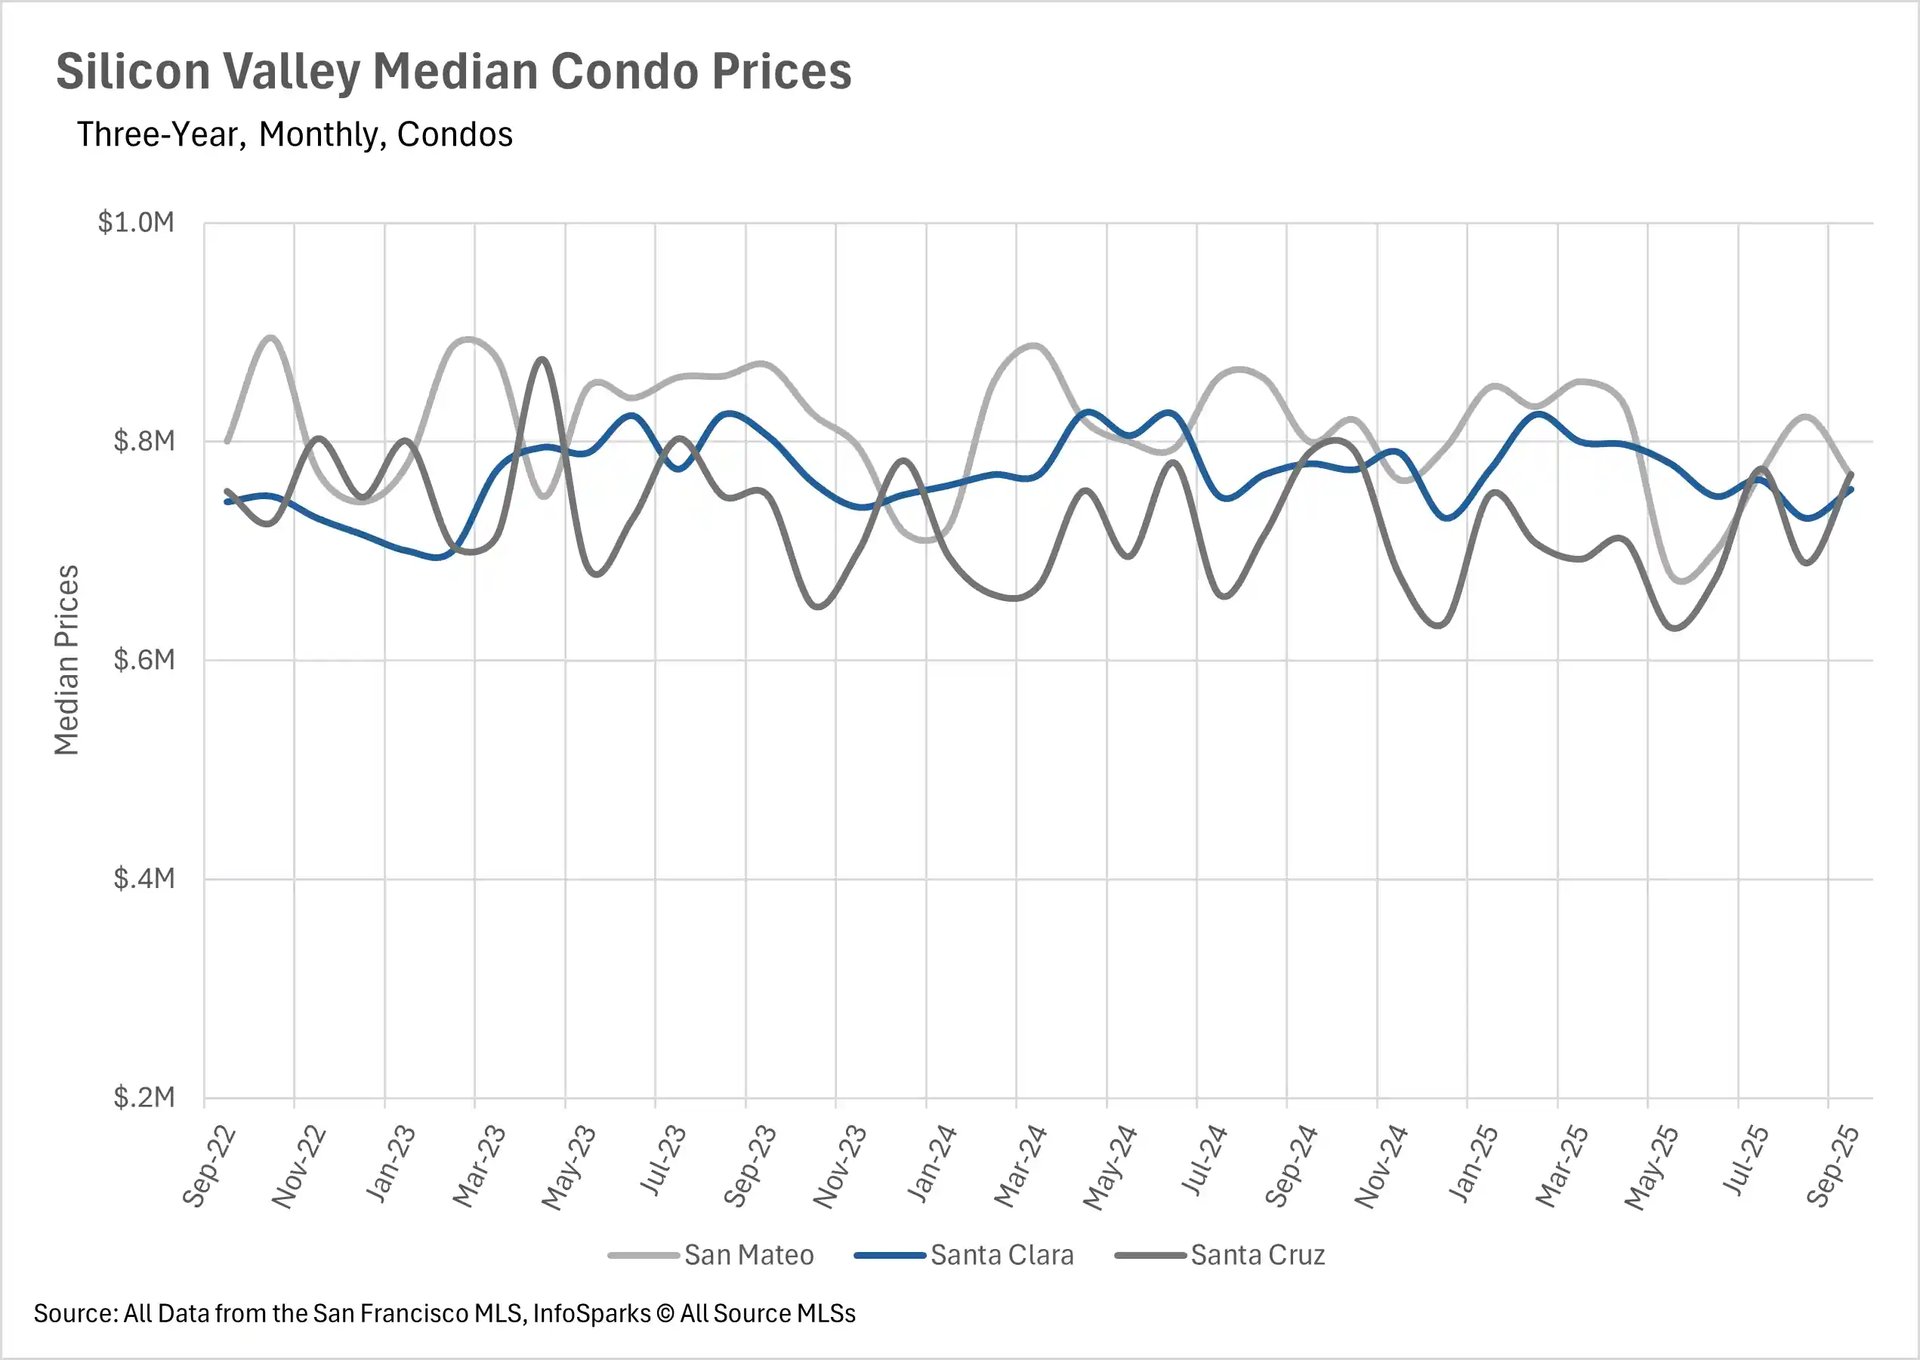
- Median sale prices for condos declined across the board for the second month in a row.
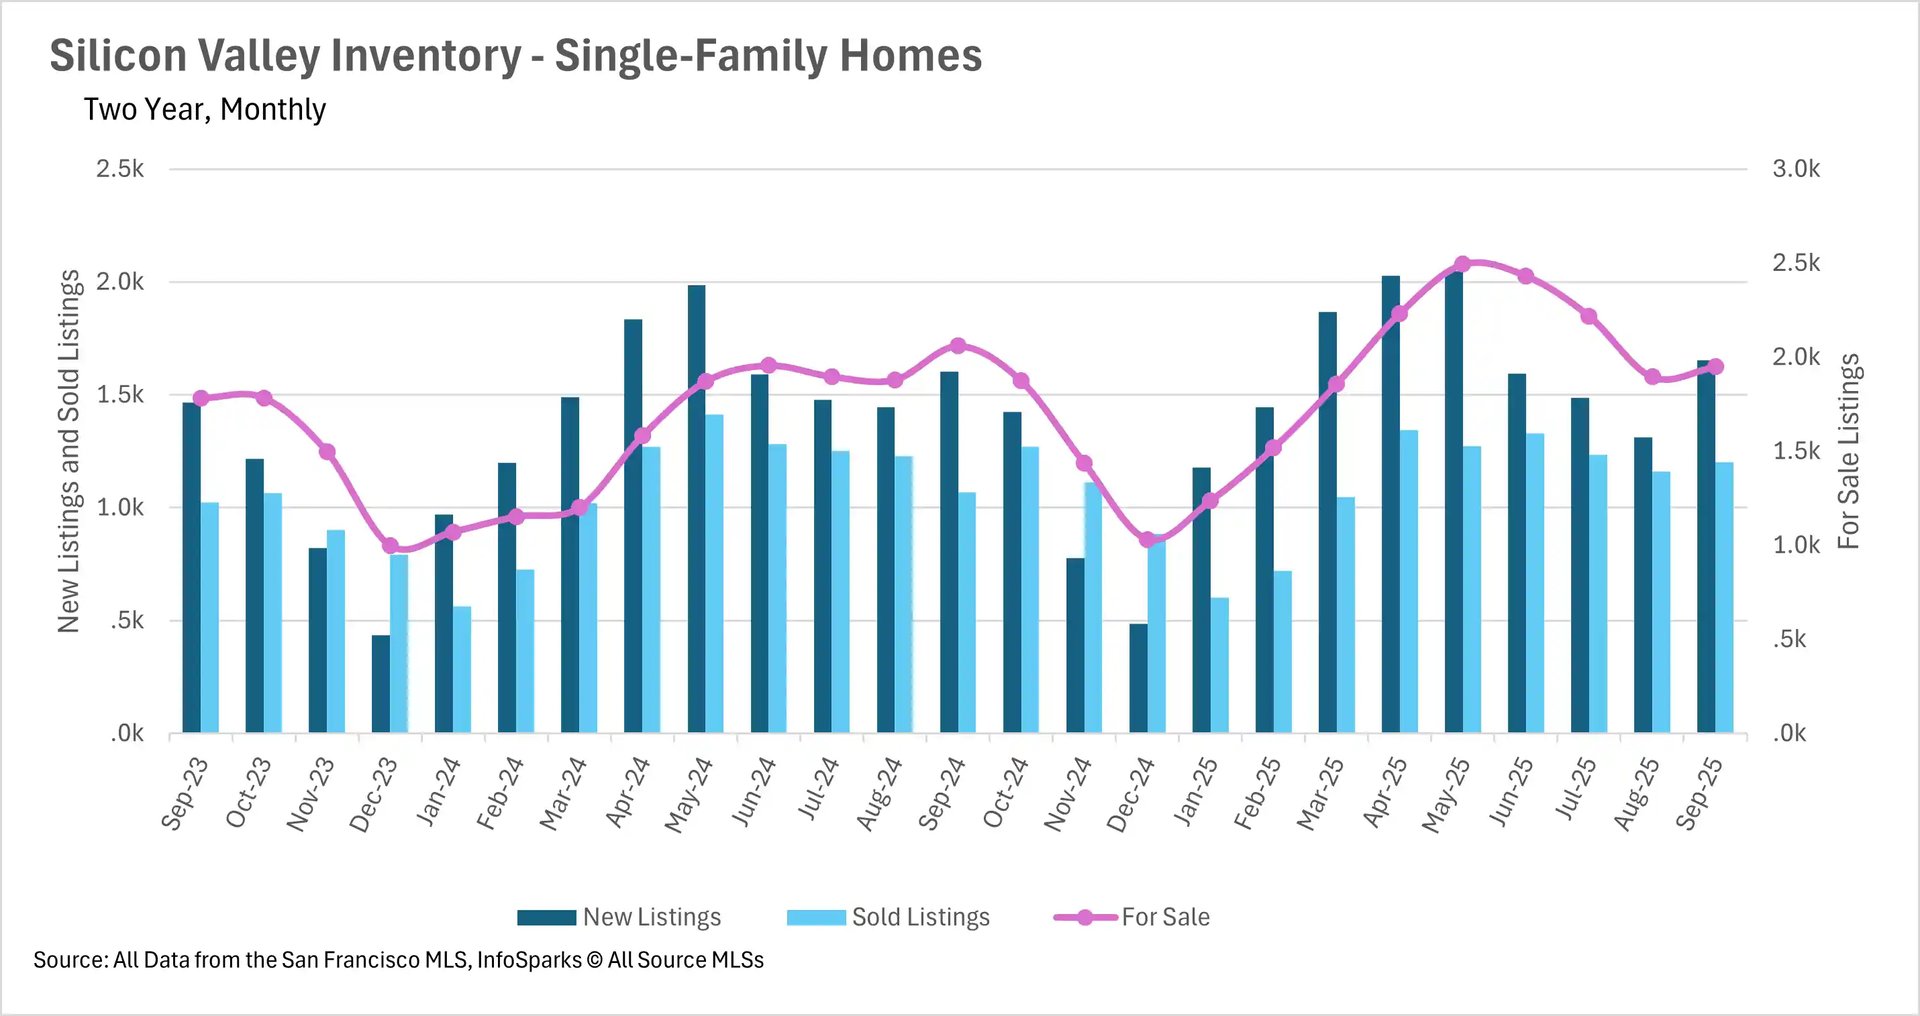
- Single-family home inventories declined year-over-year for the first time in months.
- As inventories fall, listings are being bought up at breakneck pace!
Note: You can find the charts/graphs for the Local Lowdown at the end of this section.
*National Association of REALTORS® data is released two months behind, so we estimate the most recent month's data when possible and appropriate.
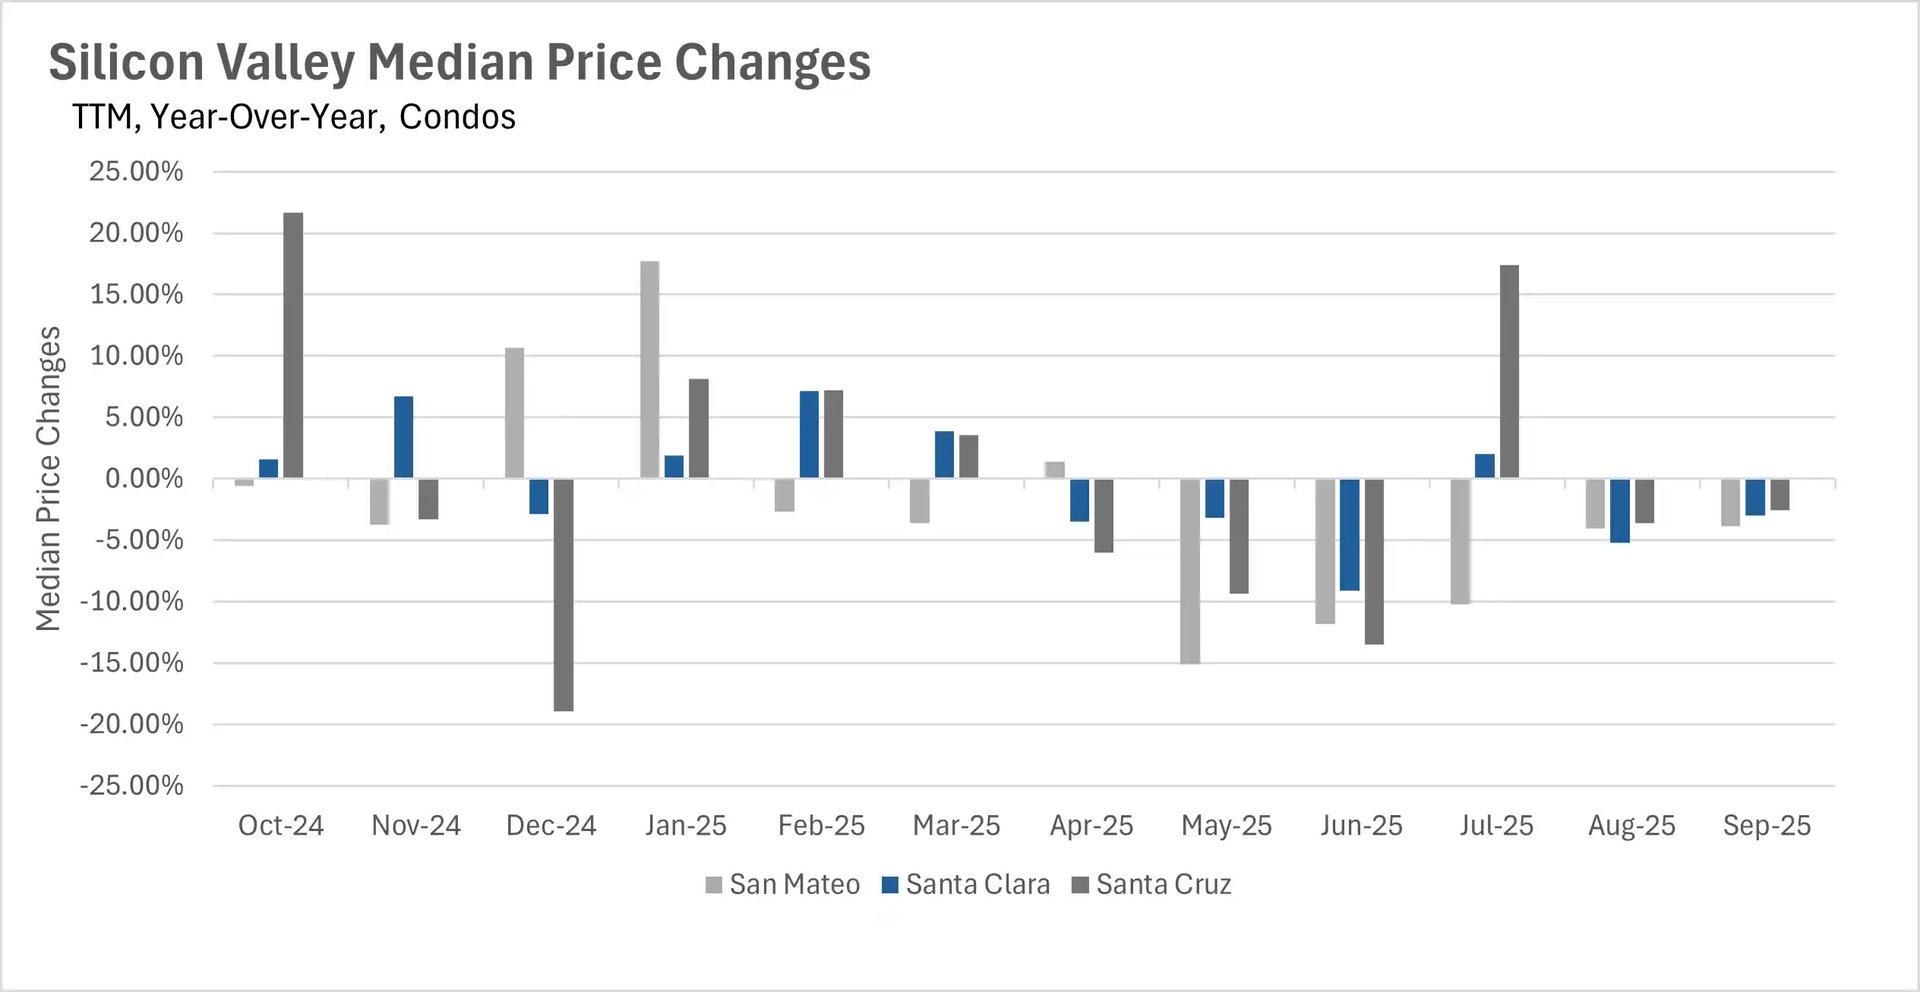
Median sale prices remain within their historical “band”
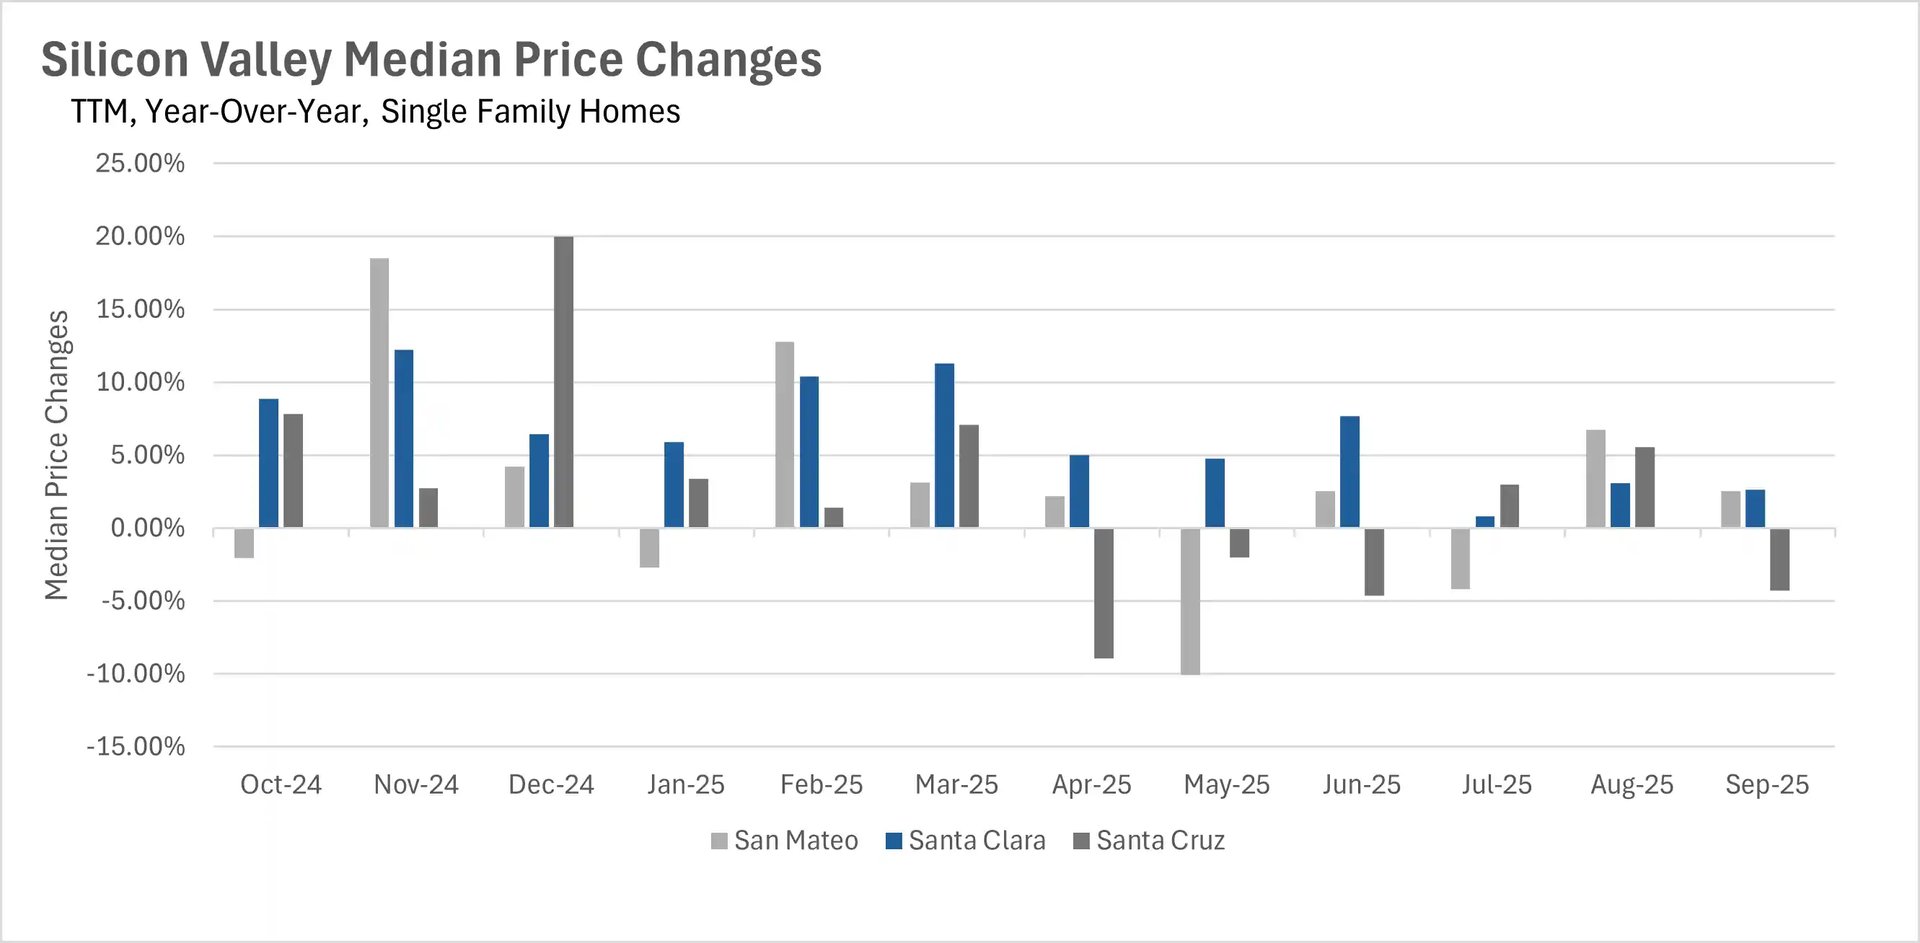
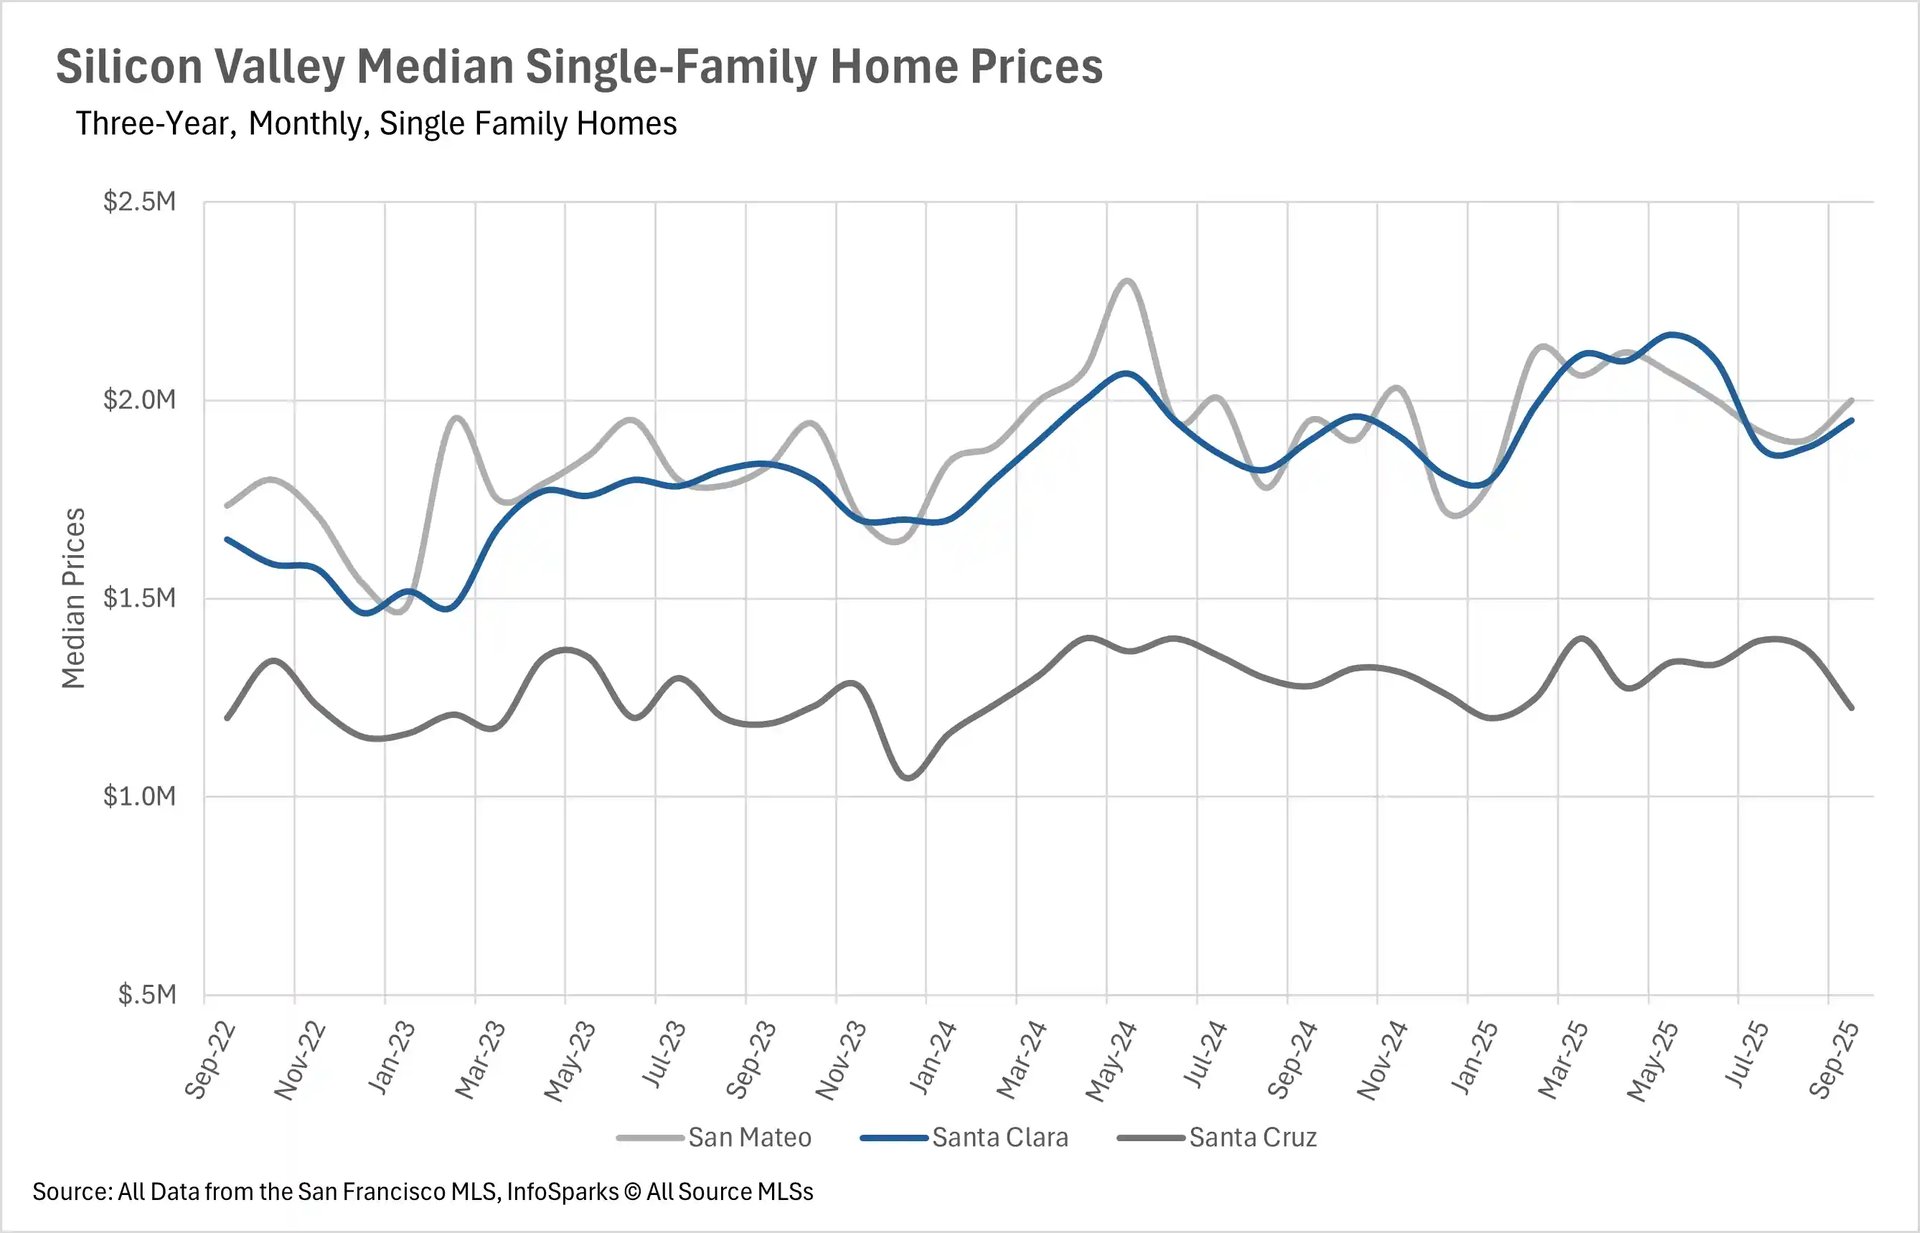
The past month in Silicon Valley was not much more notable than the past few months in terms of median sale prices. We saw some slight movement in both the single-family and condo markets, with the median sale price for single-family homes increasing by 2.56% in San Mateo County and 2.63% in Santa Clara County on a year-over-year basis, while prices declined by 4.30% in Santa Cruz County. When we turn to the condo market, we see median sale prices downtrend across the board on a year-over-year basis, with San Mateo County experiencing a 3.88% decrease, Santa Clara County experiencing a 3.01% decrease, and Santa Cruz County experiencing a 2.53% decrease.
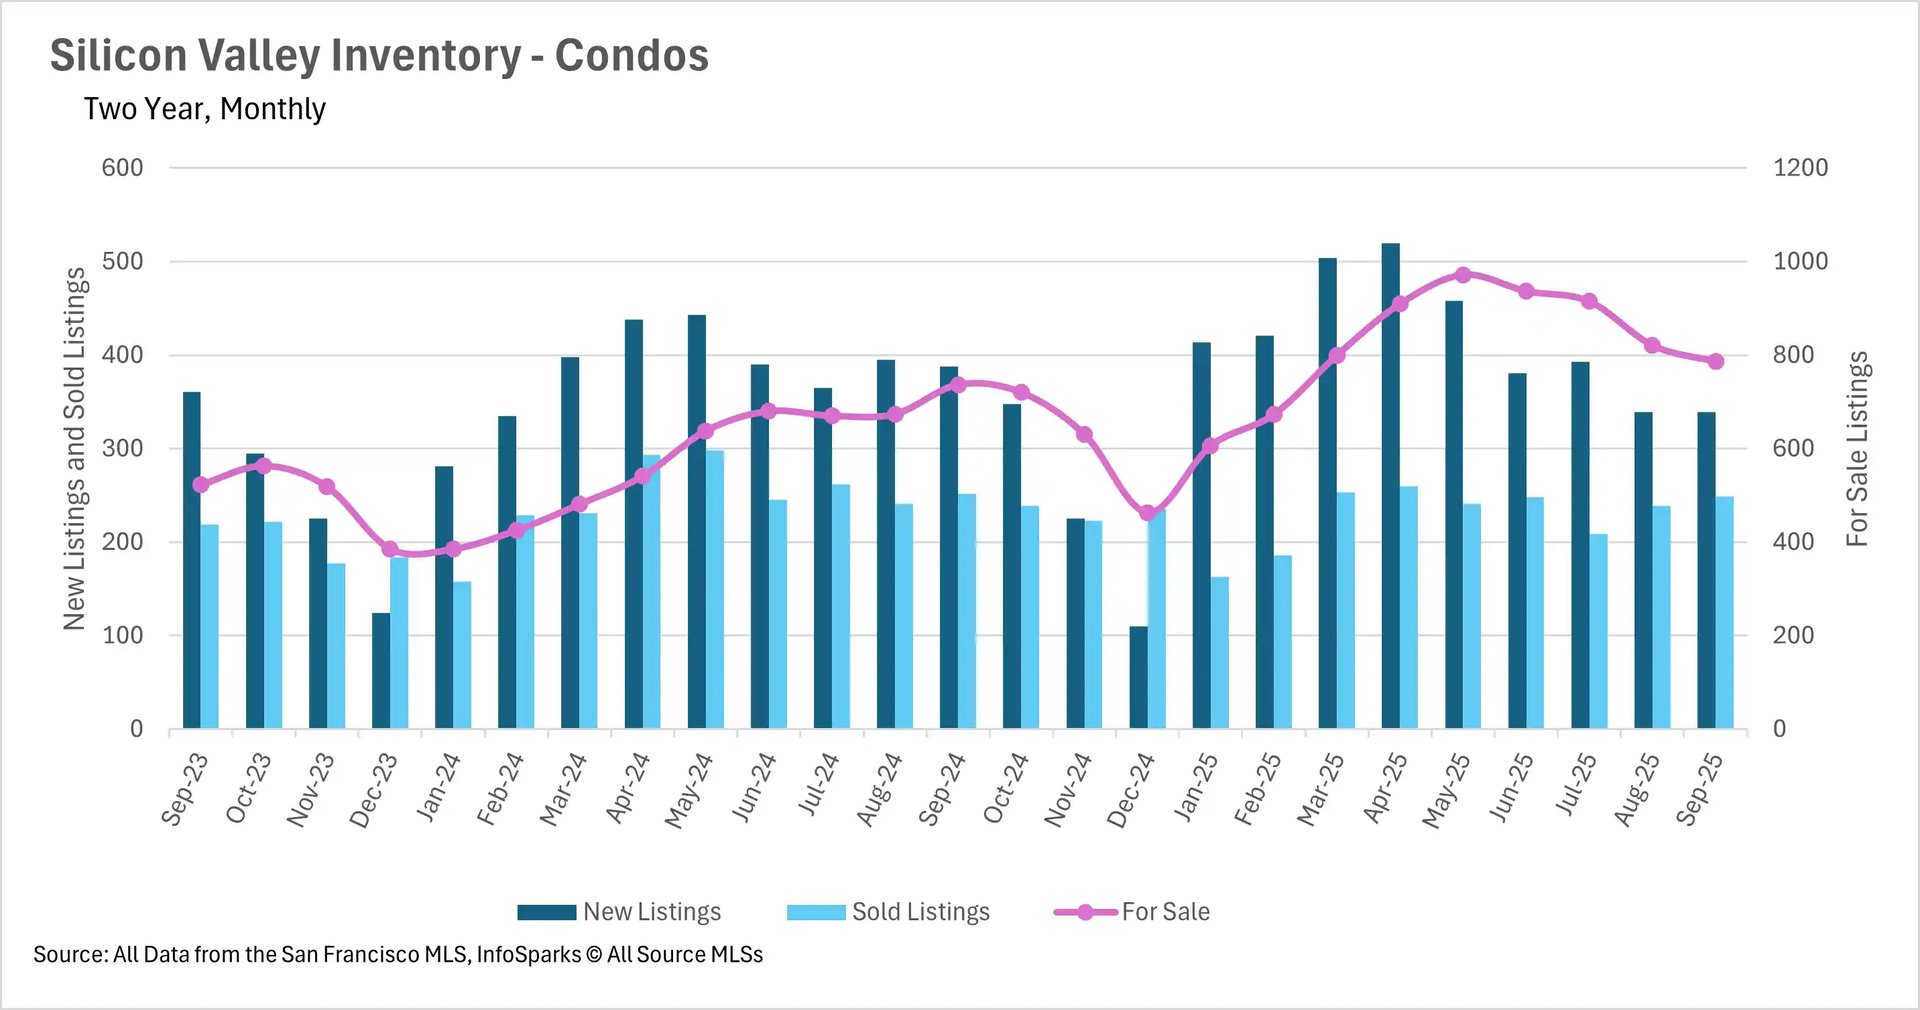
Single-family home inventory levels declined precipitously
While inventory levels are still a bit higher than they were last year in the condo market, with 6.65% more active listings when compared to last year, we saw a substantial decline year-over-year in the single-family home market. The SFH market bucked the trend of higher inventory levels that we’ve seen over the past few months, when they reported 5.34% fewer active listings on a year-over-year basis in September. This is largely due to the fact that there were 12.56% more homes sold when compared to last year! This underscores the fact that since there is a bit more economic certainty, homebuyers are back in the market!
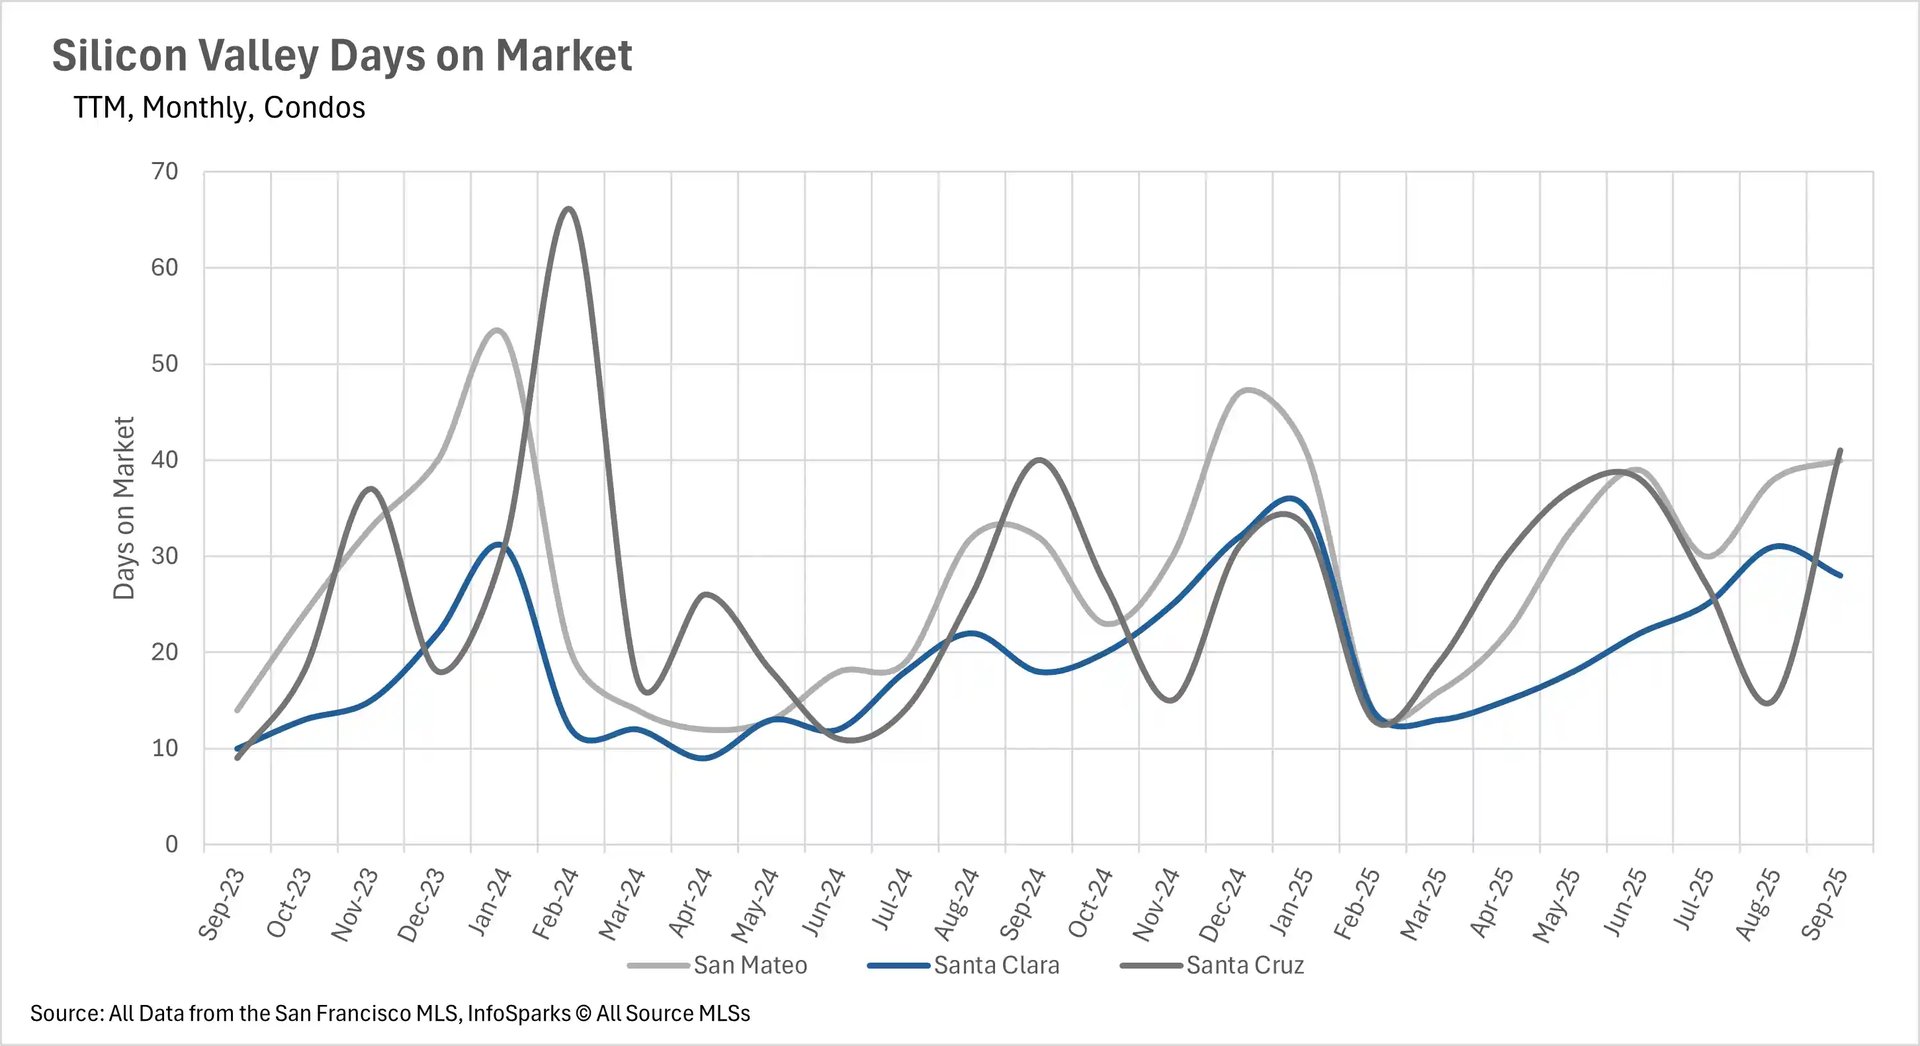
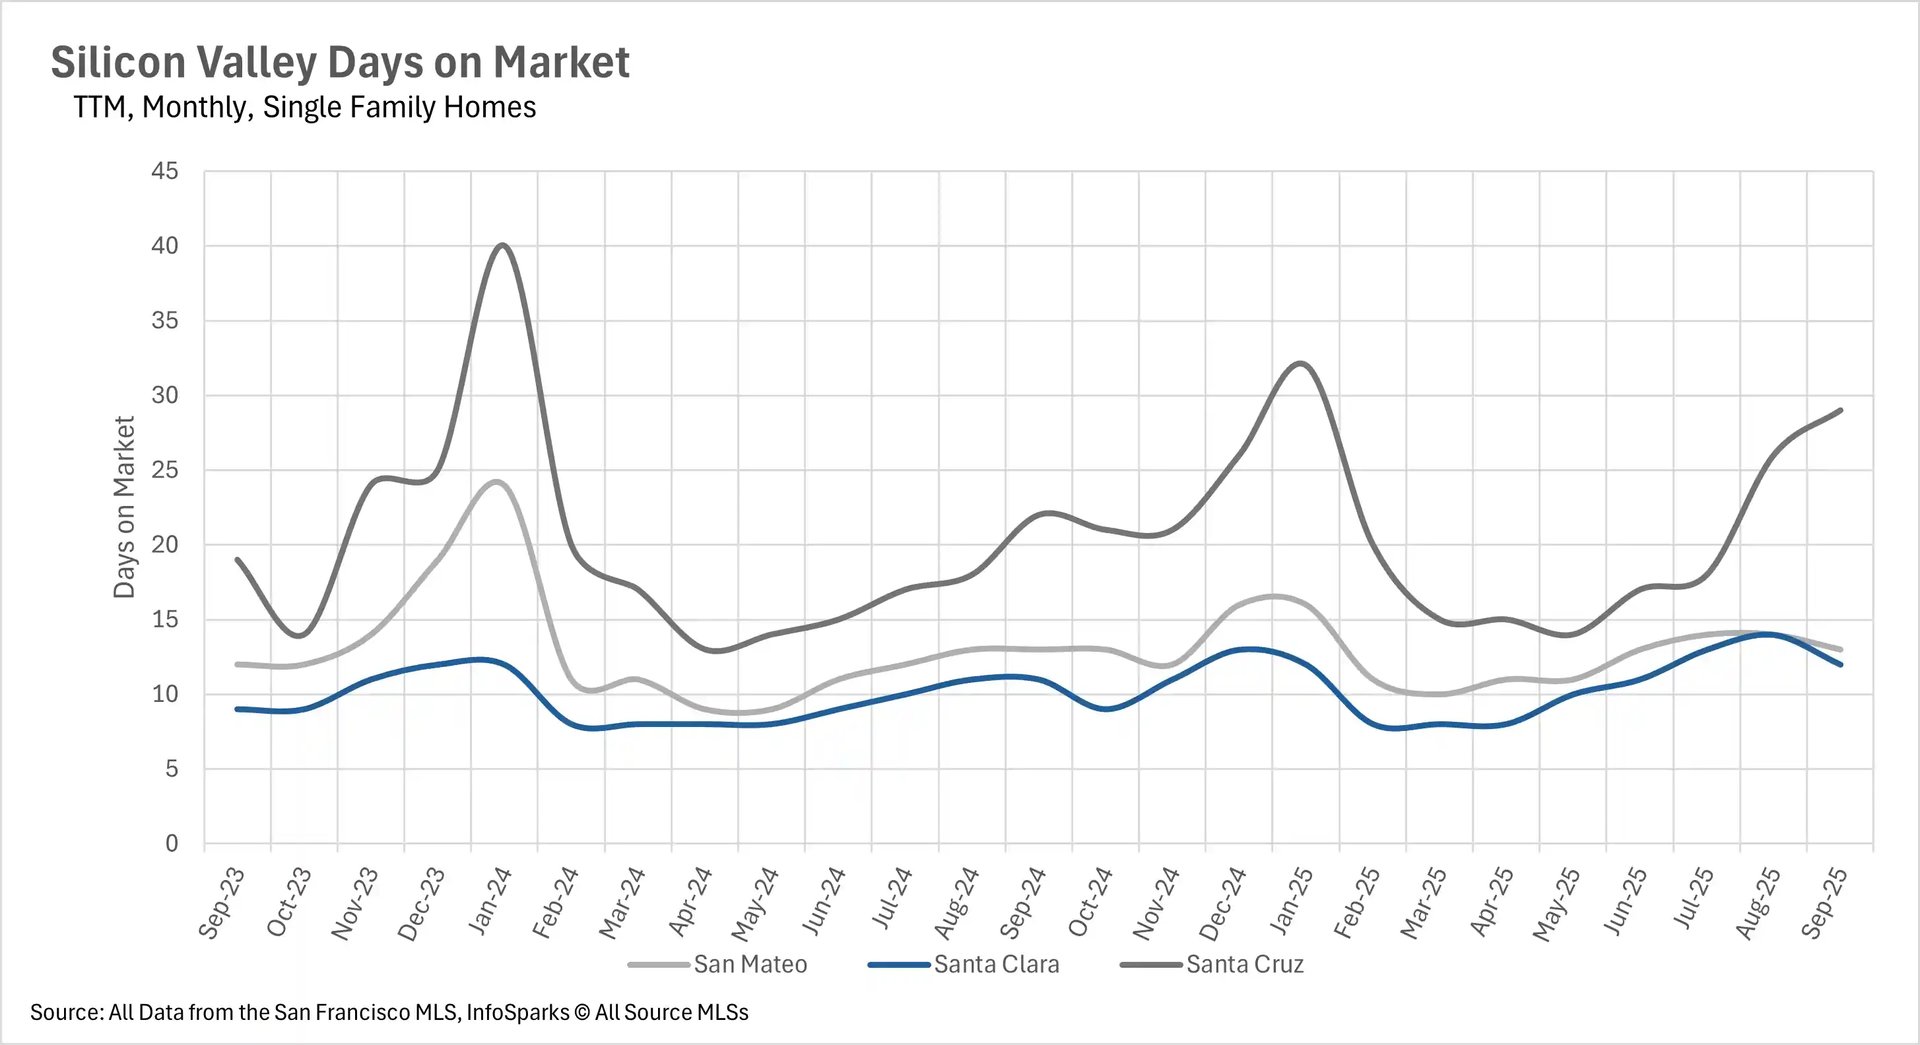
Condos are spending considerably more time on the market than they did last year
Unfortunately, this exuberance has not translated well into the condo market, as condo listings are spending quite a bit of time on the market. The average condo listing is spending 40 days on the market in San Mateo County (+25% YOY), 28 days on the market in Santa Clara County (+55.56% YOY), and 41 days on the market in Santa Cruz County (+2.5% YOY). The single-family home market tells a much different story, though, as listings in San Mateo and Santa Clara County are scooped up in under 2 weeks, and the average listing in Santa Cruz County spends just 29 days on the market.
It’s business as usual in Silicon Valley
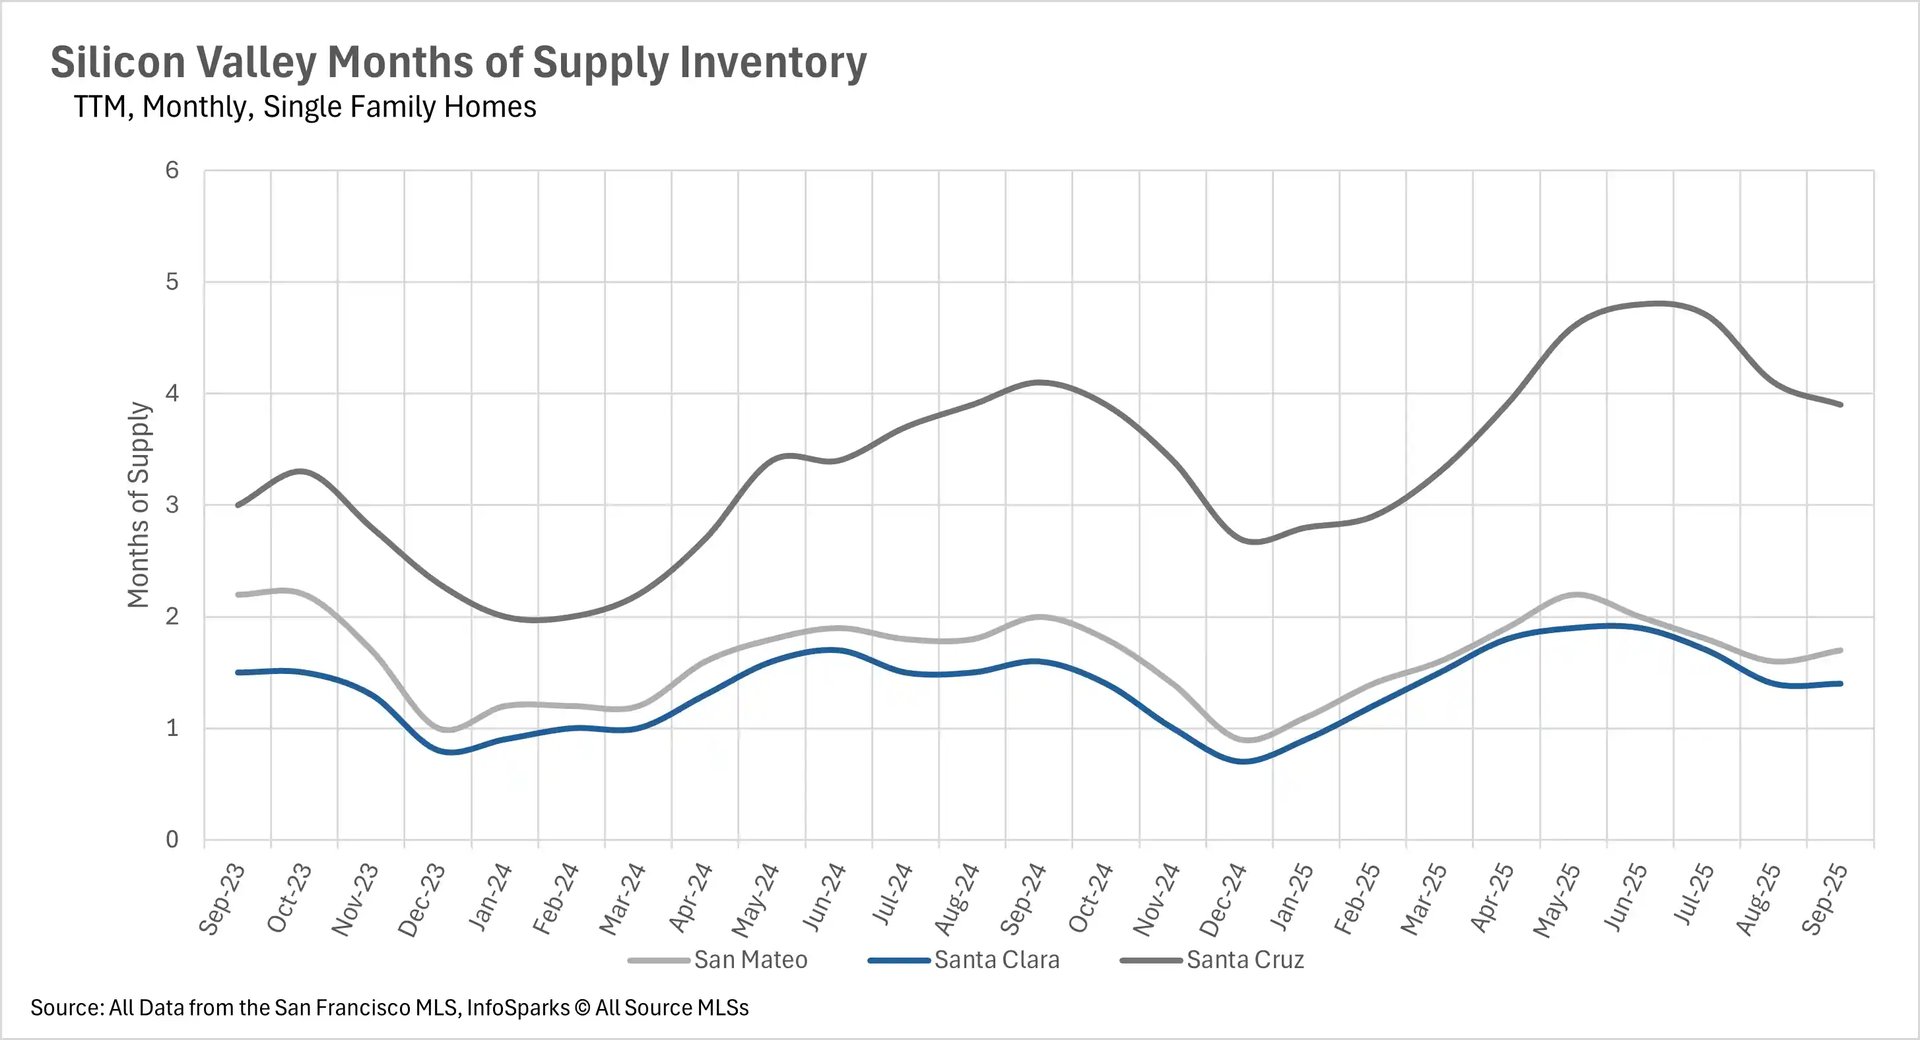
When determining whether a market is a buyers’ market or a sellers’ market, we look to the Months of Supply Inventory (MSI) metric. The state of California has historically averaged around three months of MSI, so any area with at or around three months of MSI is considered a balanced market. Any market that has lower than three months of MSI is considered a seller’s market, whereas markets with more than three months of MSI are considered buyers’ markets.
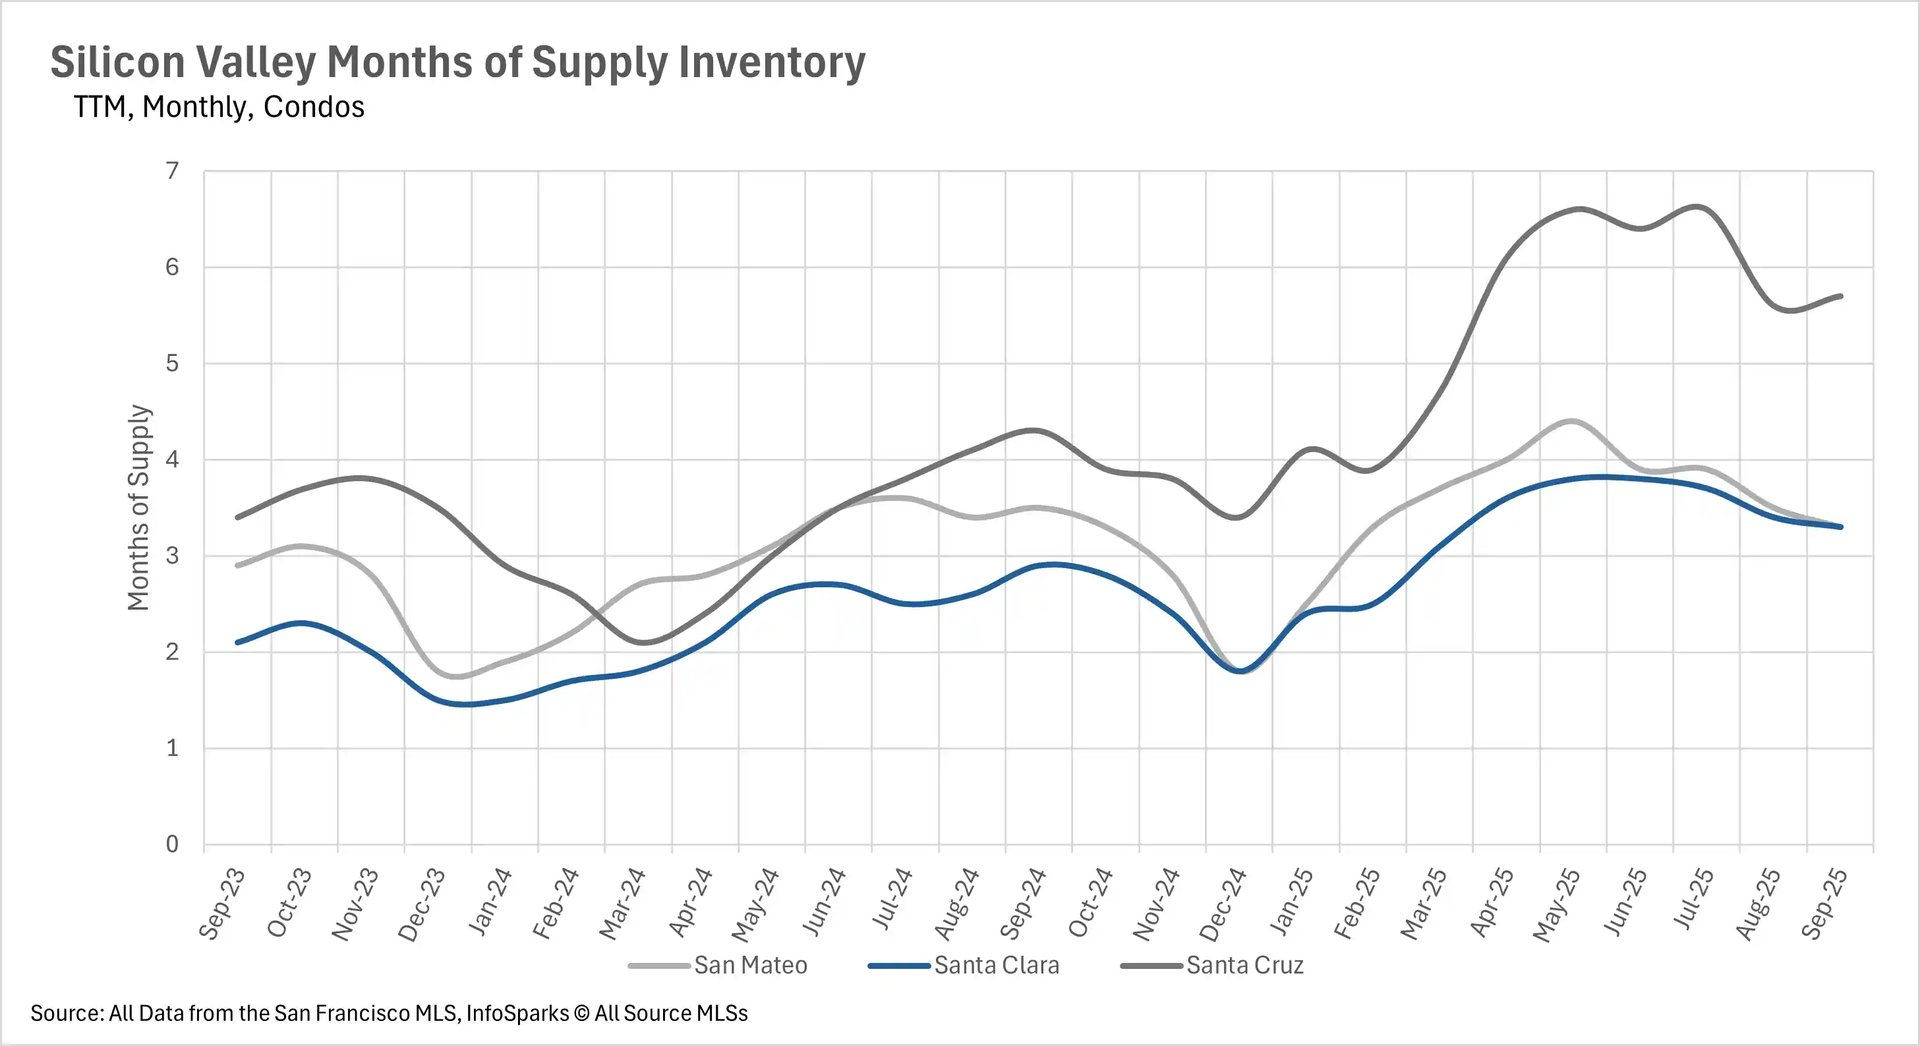
As always, there is a very low supply of single-family homes in San Mateo and Santa Clara Counties, with just 1.7 and 1.4 months' worth of inventory on the market, respectively. This, of course, makes them buyer-dominated markets. On the flip side, there are 3.9 months' worth of single-family inventory on the market in Santa Cruz County, making it a buyer's market. When we turn to the condo market, the entire market is a buyer's market, with 3.3 months' worth of inventory on the market in San Mateo and Santa Clara Counties and 5.7 months of inventory on the market in Santa Cruz County.