Select a Market Report to Read:
The Local Lowdown
Quick Take:
- Single-family home median sale prices declined slightly on a year-over-year basis.
- Inventories remain at a level that’s slightly higher than this time last year.
- Listings are spending a lot more time on the market than they were last year, with single-family listings spending more than 20% longer on the market.
Note: You can find the charts/graphs for the Local Lowdown at the end of this section.
*National Association of REALTORS® data is released two months behind, so we estimate the most recent month's data when possible and appropriate.
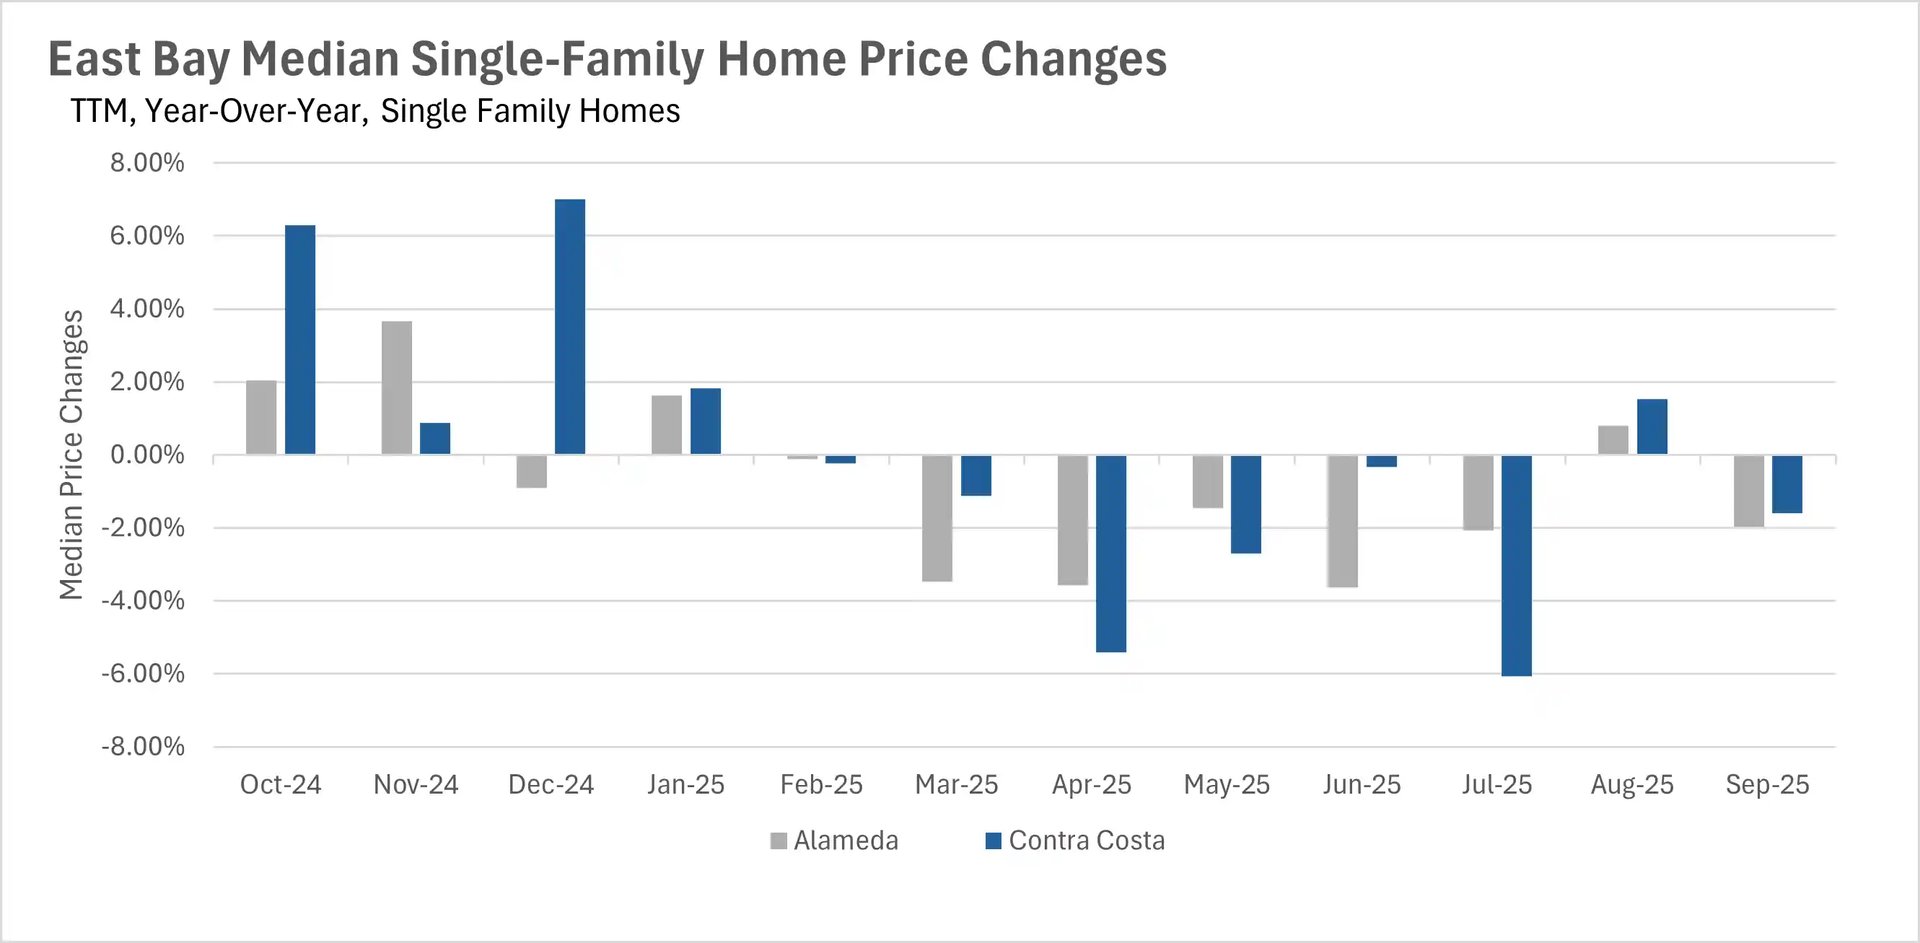
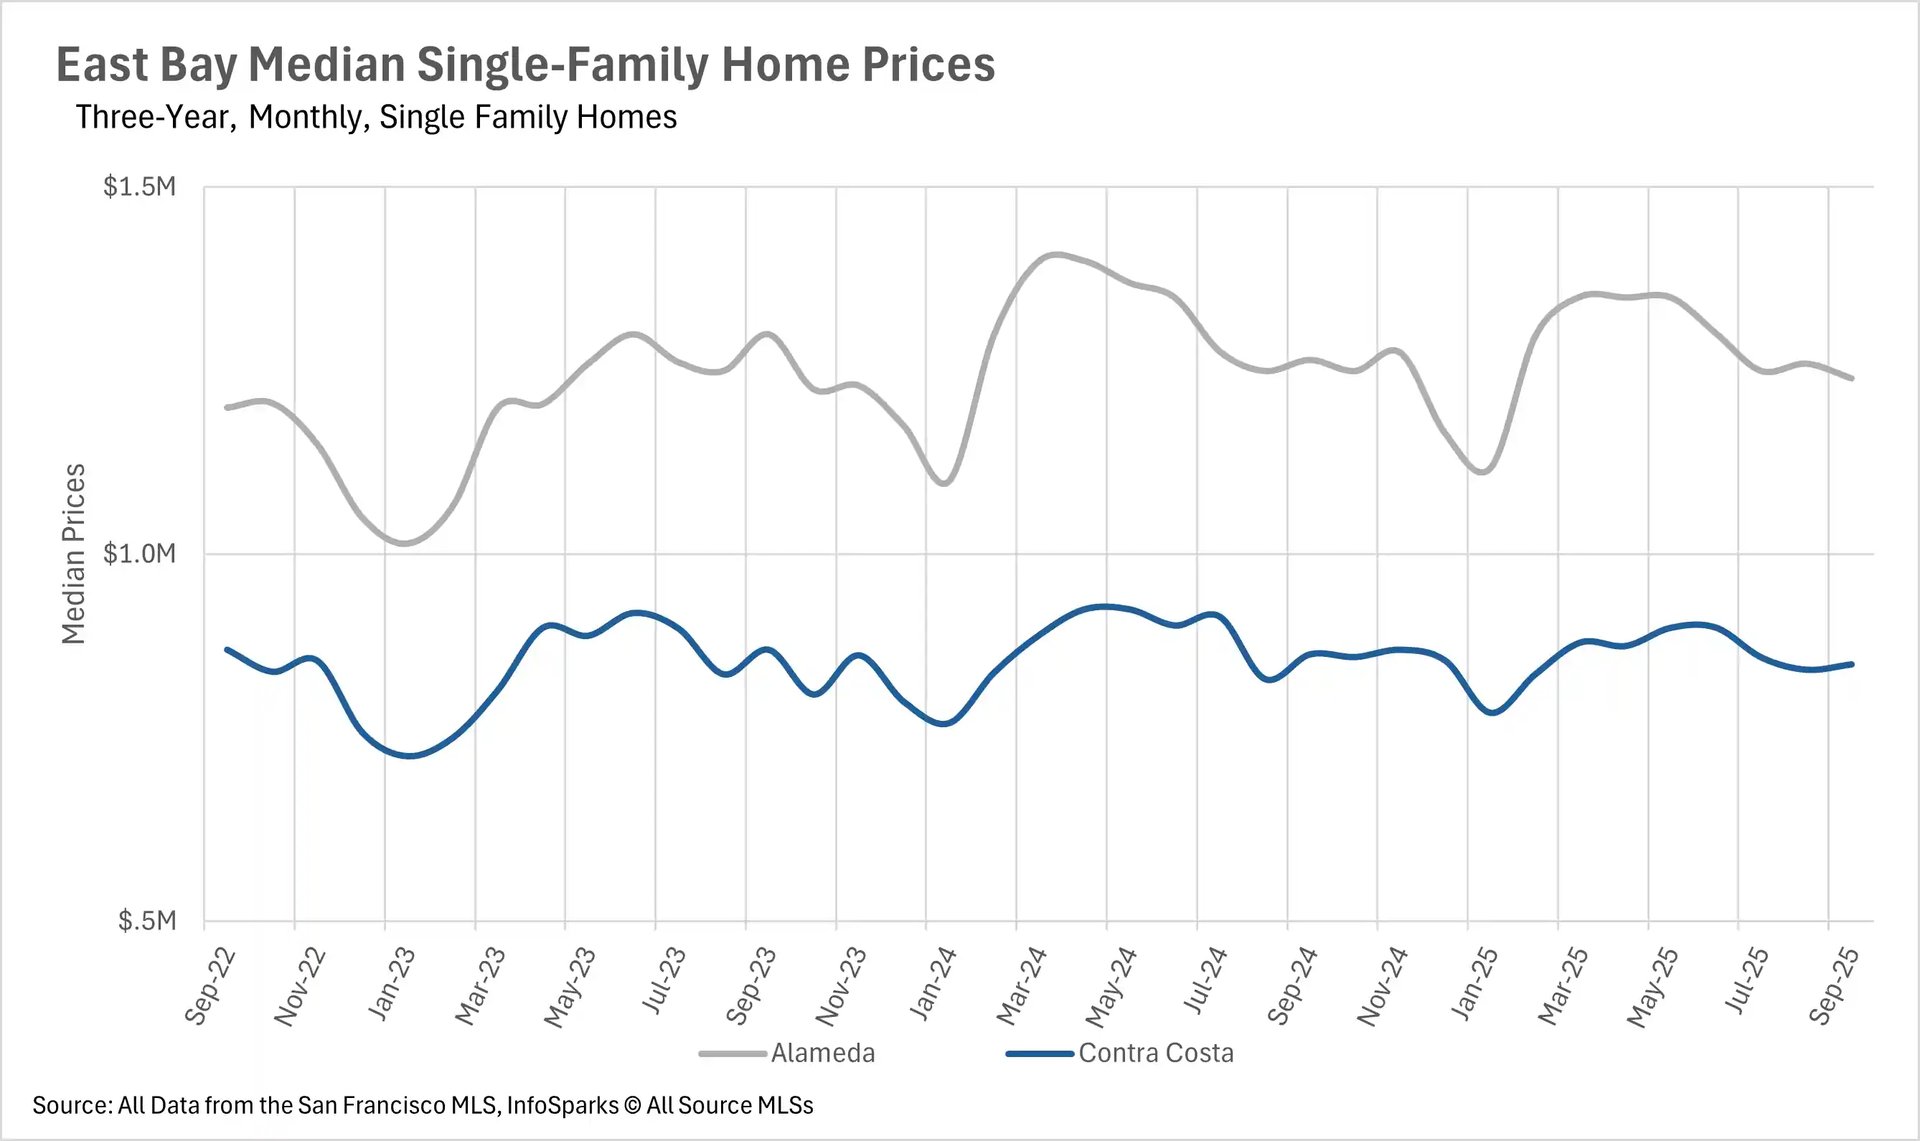
The East Bay returns to its year-over-year declines in median sale price
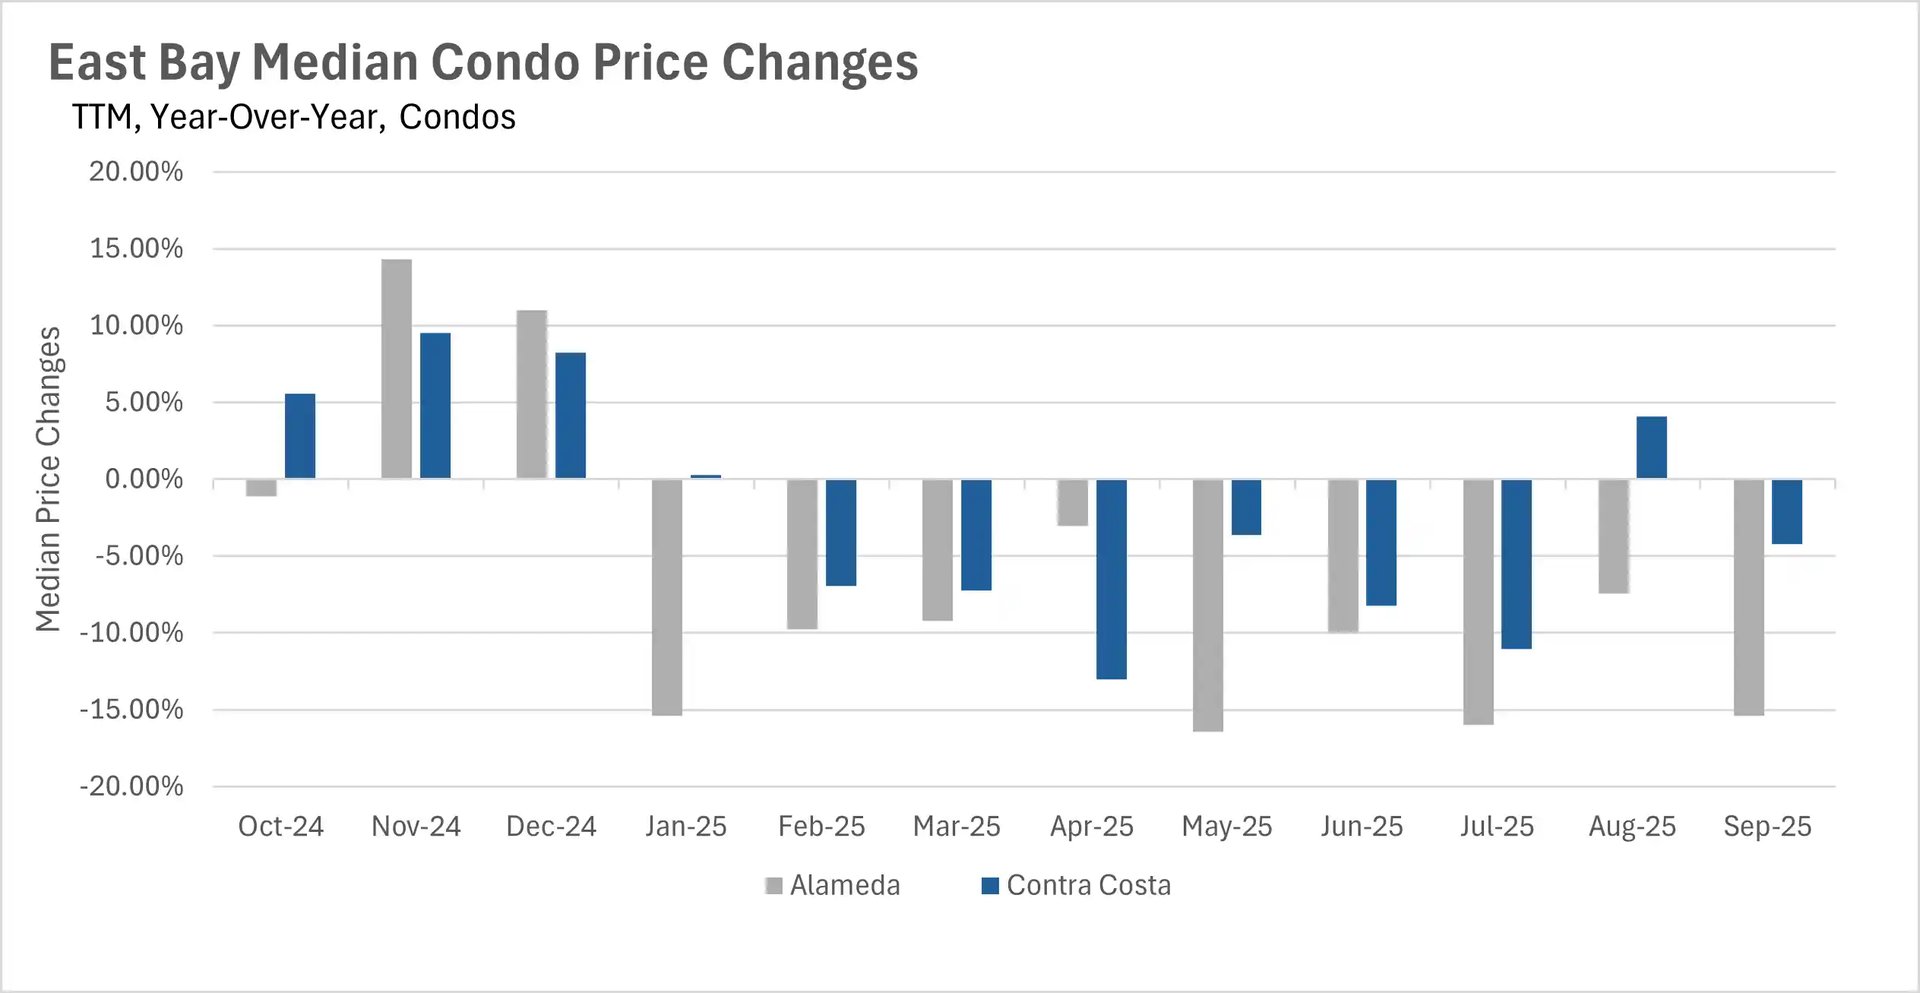
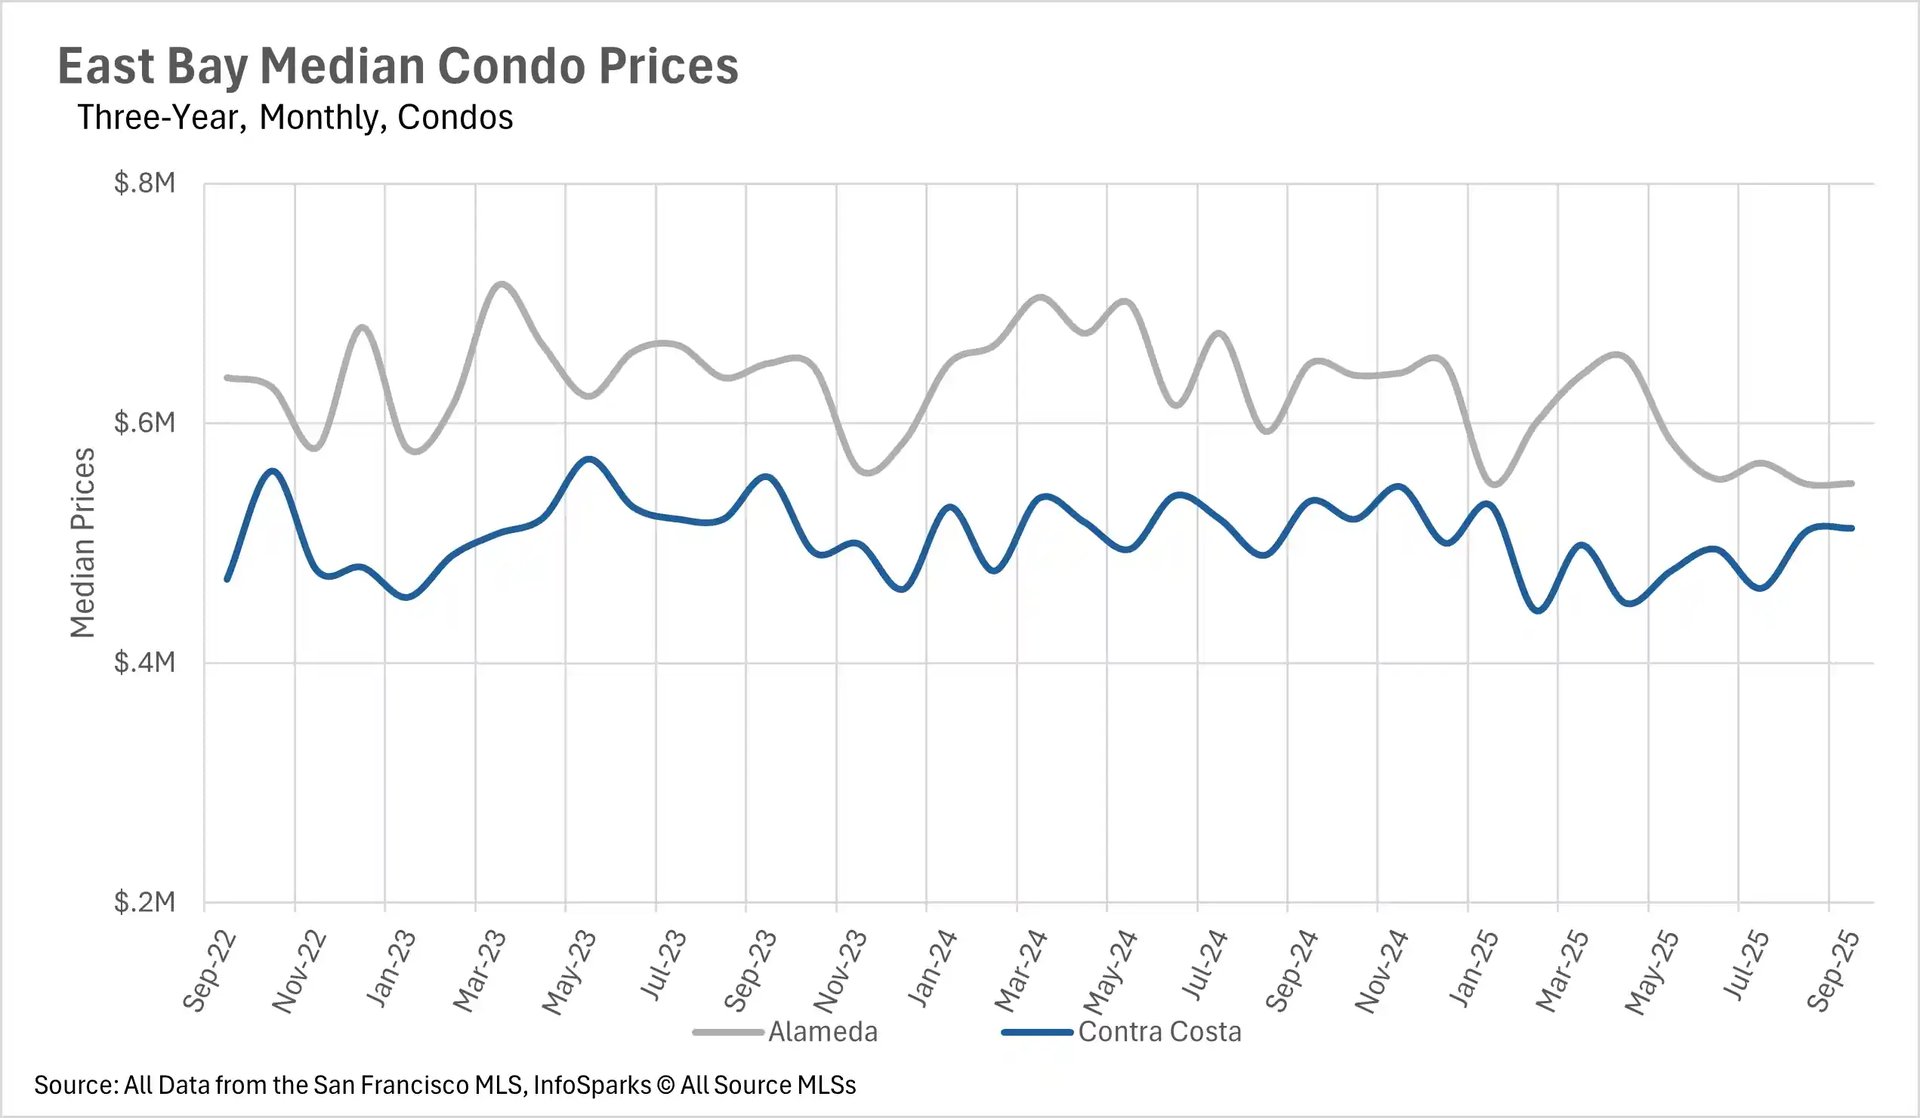
In the month of August, the East Bay bucked the trend of continual year-over-year declines in price. However, in September, this trend returned, as single-family median sale prices dipped by 1.59% in Contra Costa County and 1.98% in Alameda County. However, it’s important to note that listings in both of these areas look to be selling within the “band” of prices that they have historically sold at over the course of the past few years, so there’s no cause for concern yet! In the condo market, we did see some larger downward swings, with the median sale price for a condo in Contra Costa County declining by 4.21% on a year-over-year basis
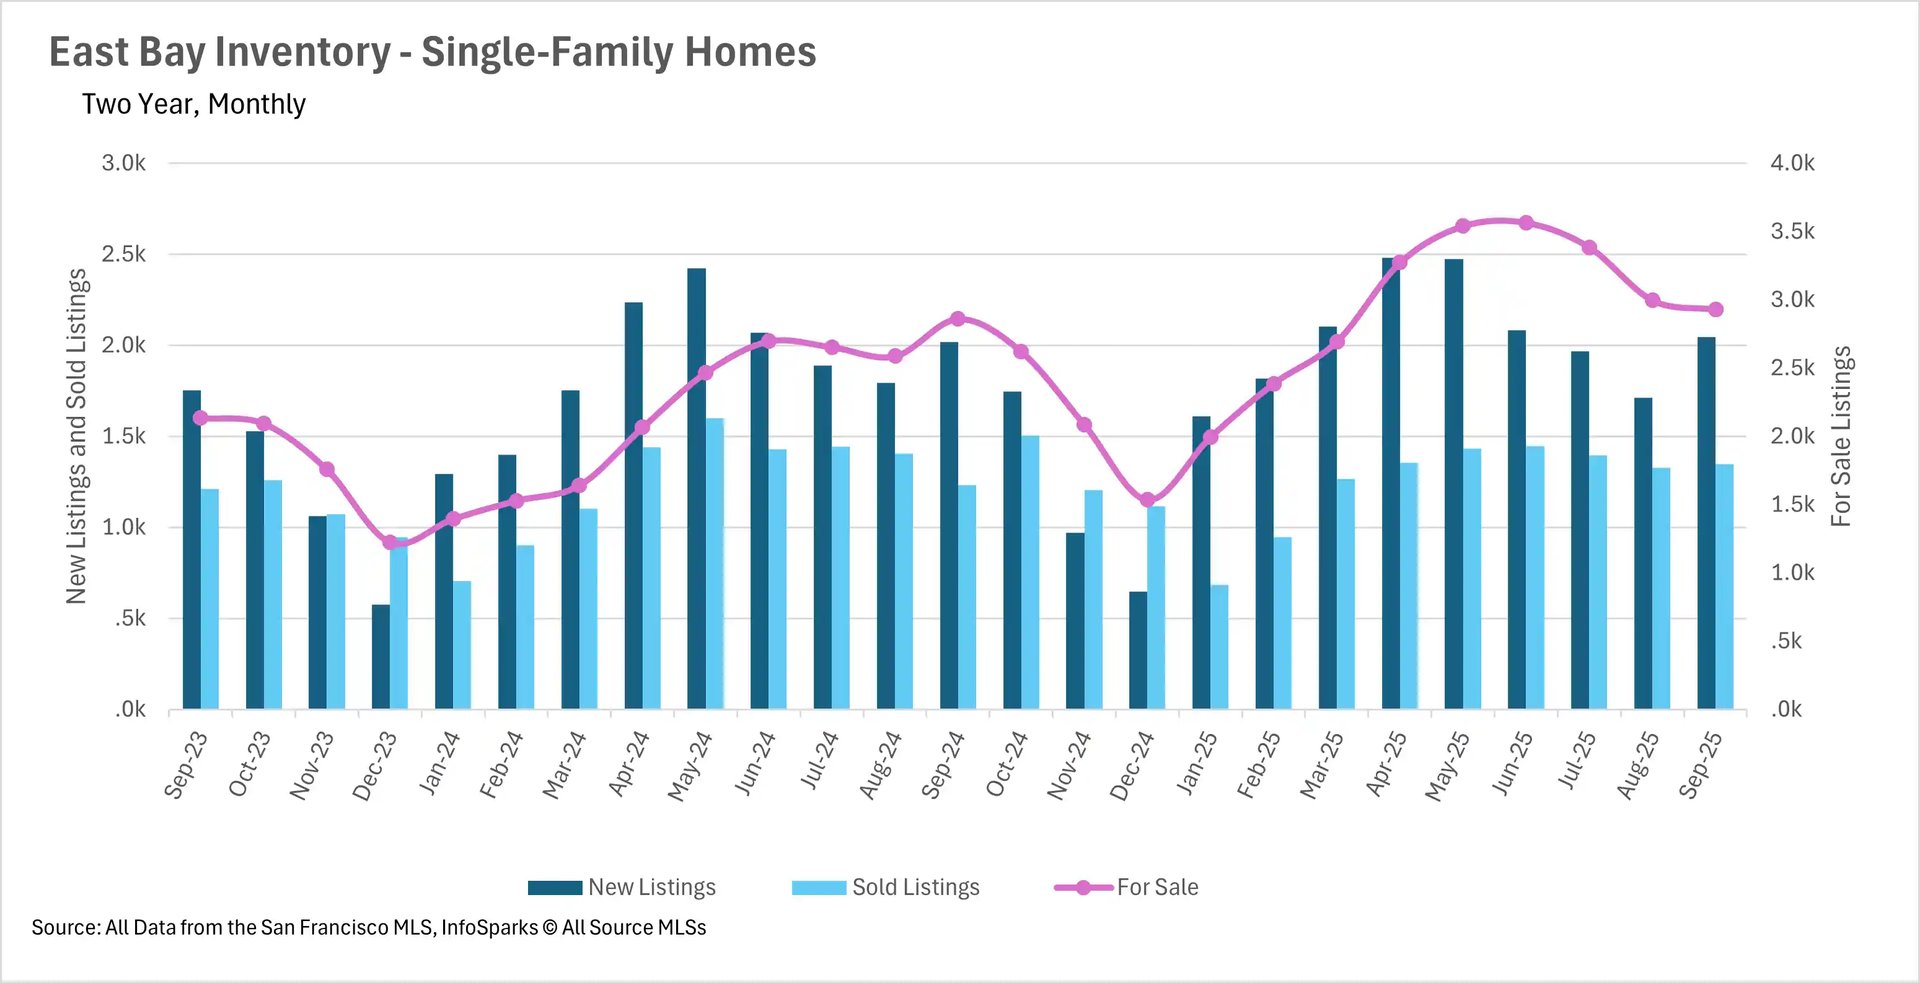
Inventories have begun to normalize, as summer buildup is sold off
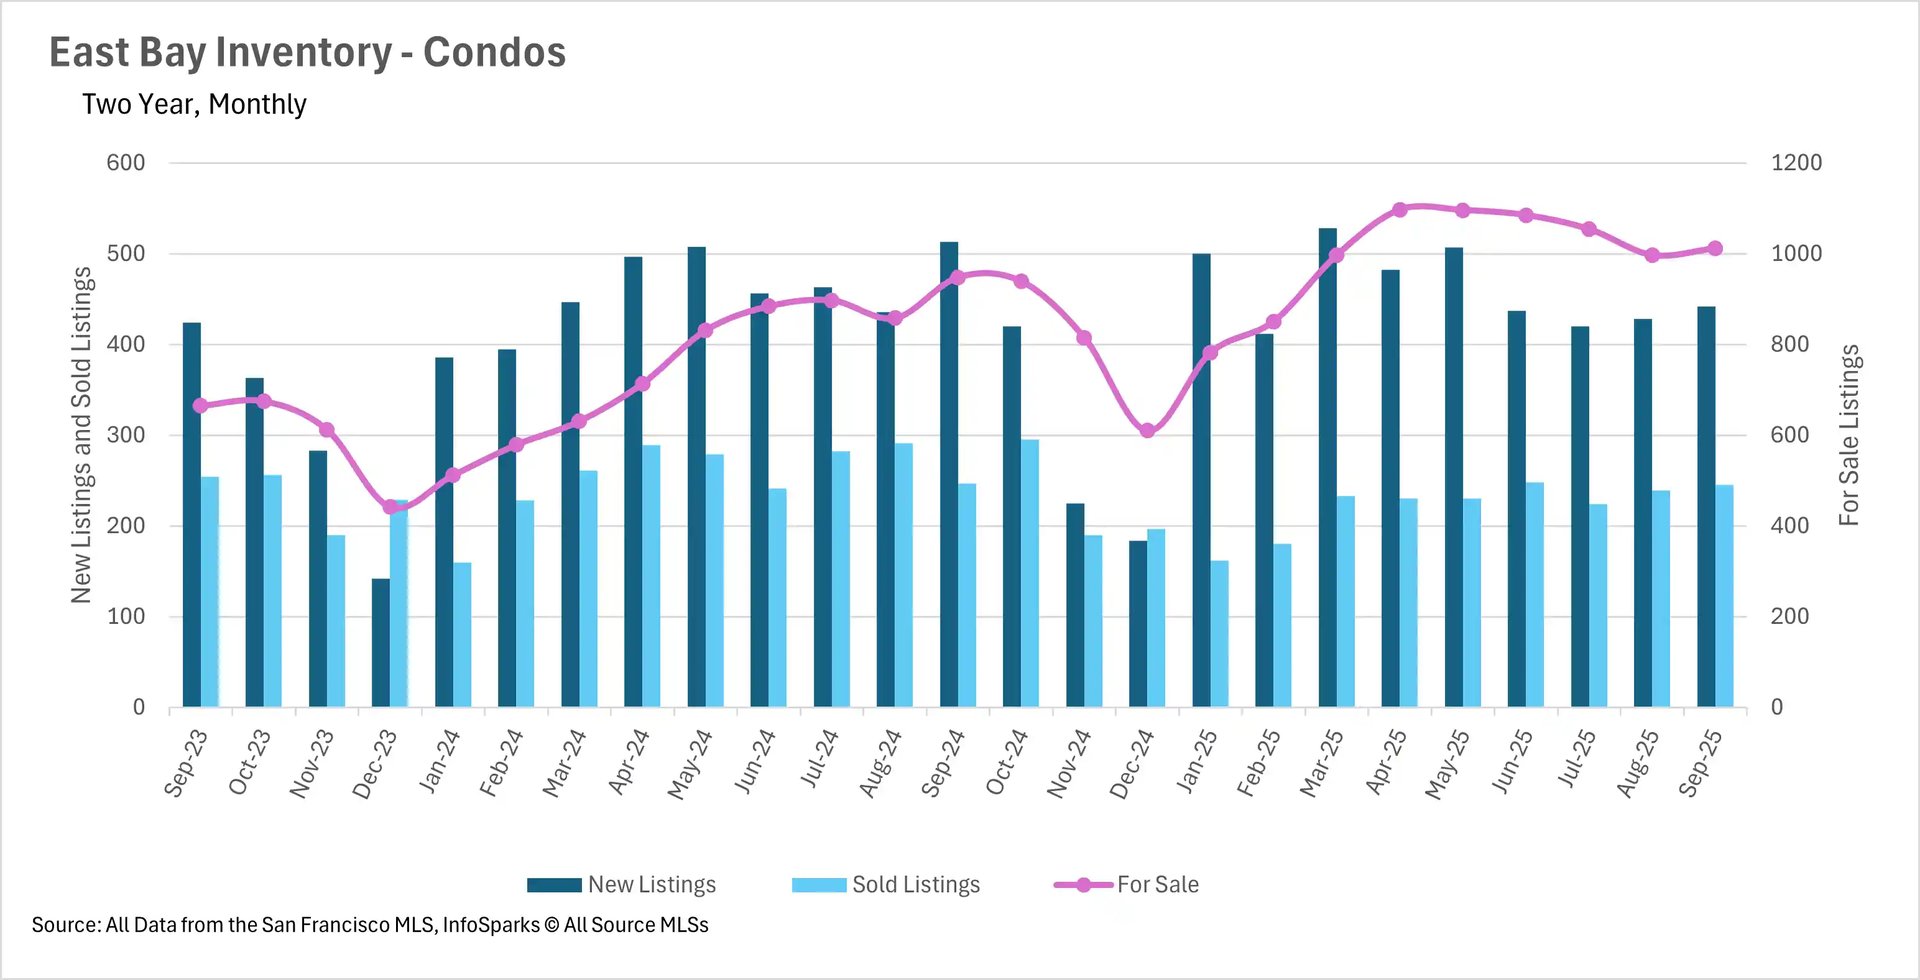
As we all know, throughout the summer, we saw a huge buildup of inventory, as homebuyers reeled from the economic uncertainty presented by tariffs and swings in the stock market. However, over the past couple of months, we’ve seen a lot of that buildup sell off, as inventories return to normal levels. This has left us with just 2.41% more inventory in the single-family home market and 6.75% more inventory in the condo market on a year-over-year basis. The normalization in the single-family home market can largely be attributed to the fact that we saw nearly 10% more homes sold in September than we did just a year ago!
Despite spending more time on the market, listings are still moving relatively quickly
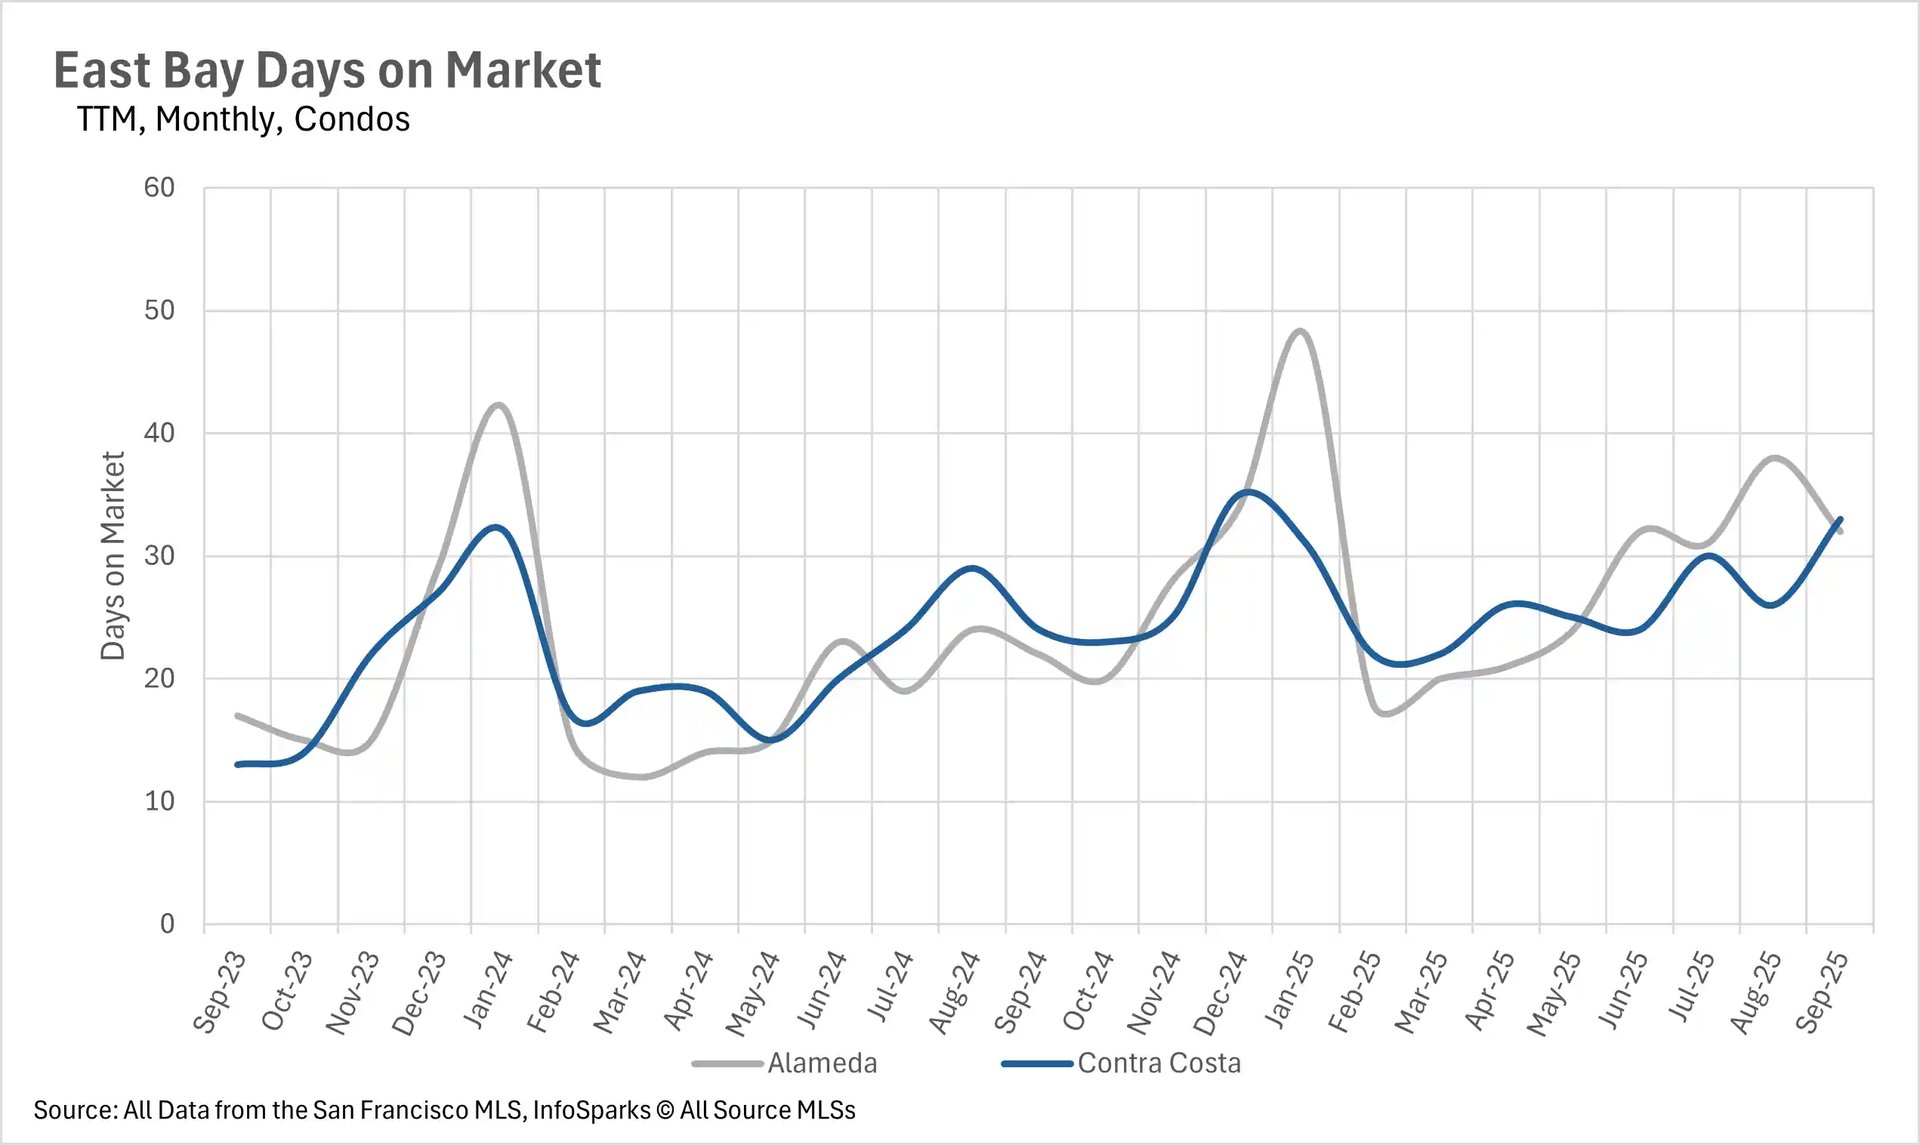
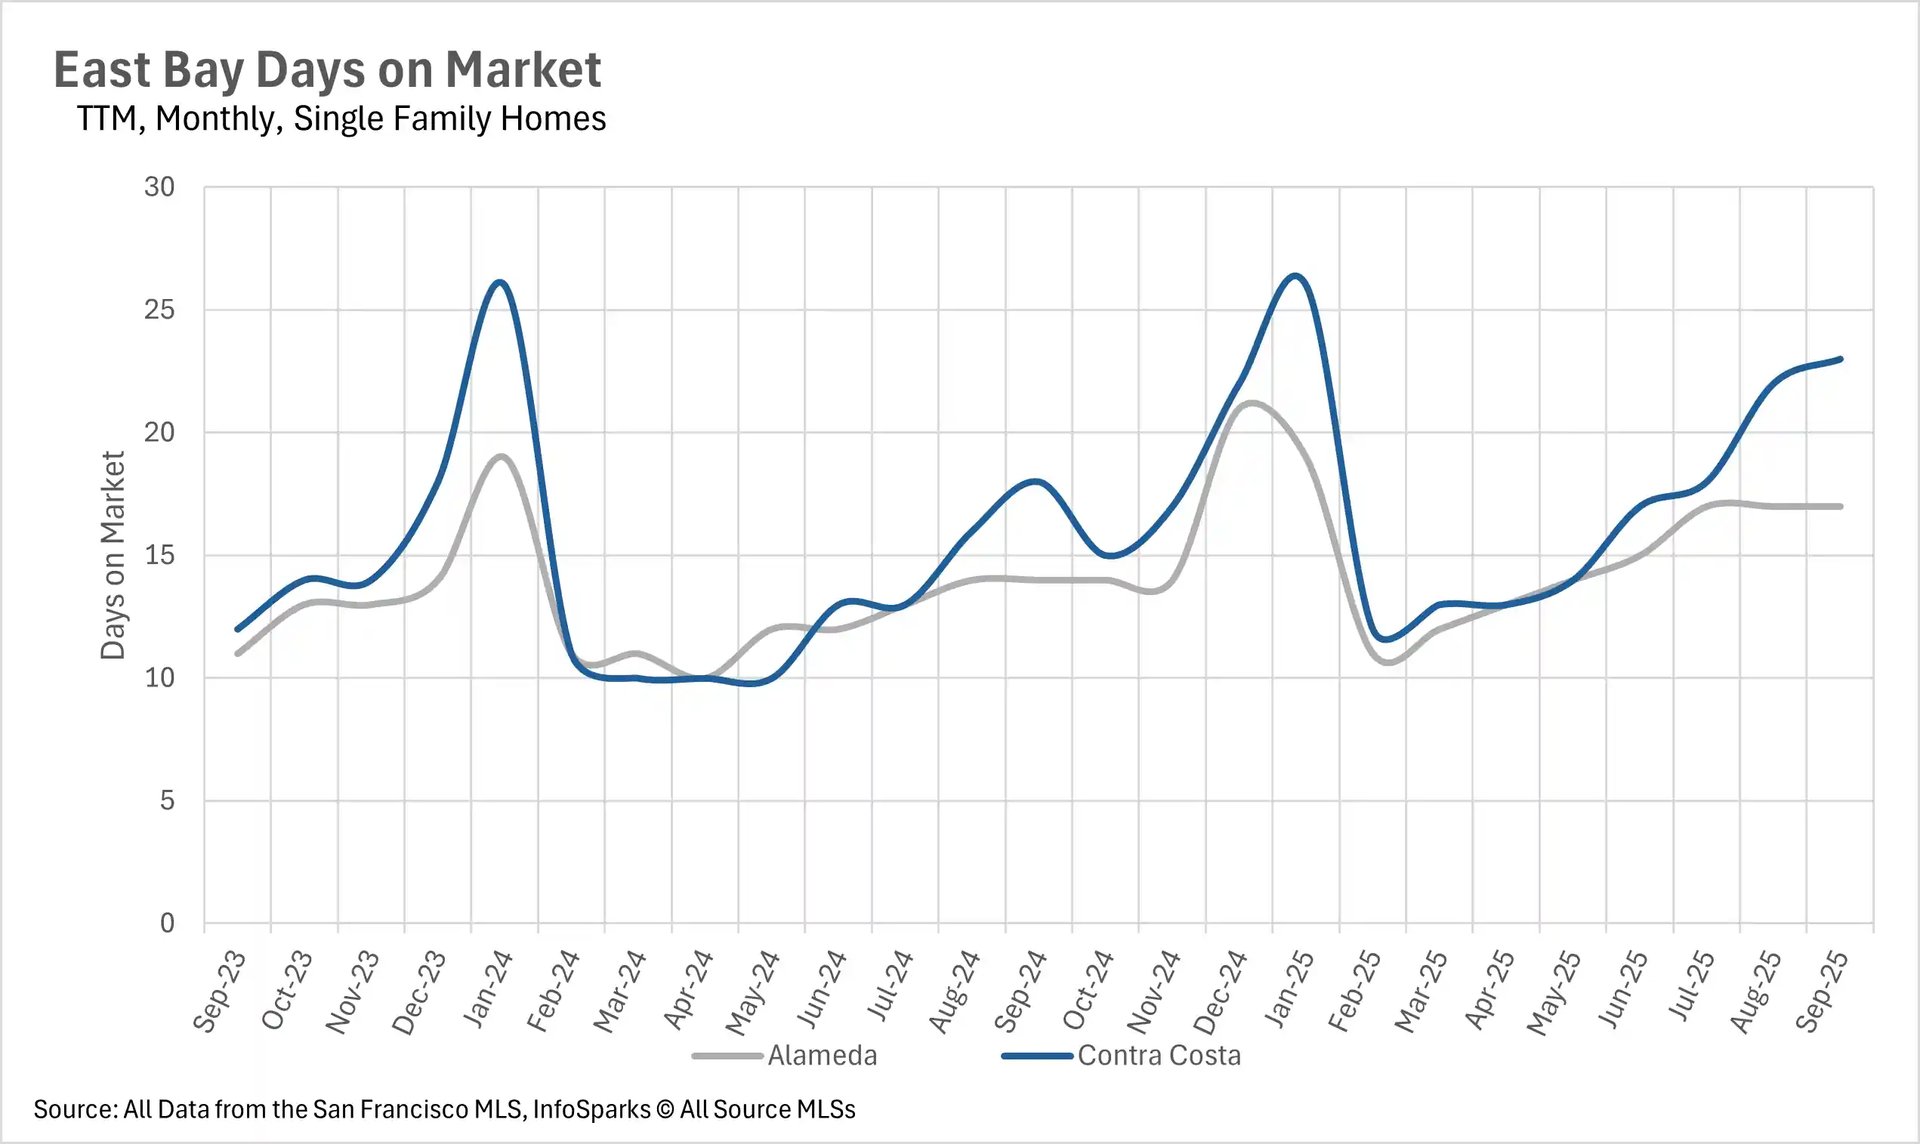
Although inventories are slowly normalizing, listings are spending quite a bit more time on the market on a percentage basis. The average single-family home listing in Alameda County is spending 21.43% more time on the market than this time last year, and the average Contra Costa County listing is spending 27.78% more time on the market. However, when you look at the absolute number of days that these listings are spending on the market, we see that they’re still moving relatively fast, with Alameda and Contra Costa County single-family homes spending just 17 and 23 days on the market, respectively. We see a similar phenomenon in the condo market with 45.45% and 37.50% year-over-year increases in Alameda and Contra Costa counties. However, average listings are spending 32 and 33 days on the market, respectively.
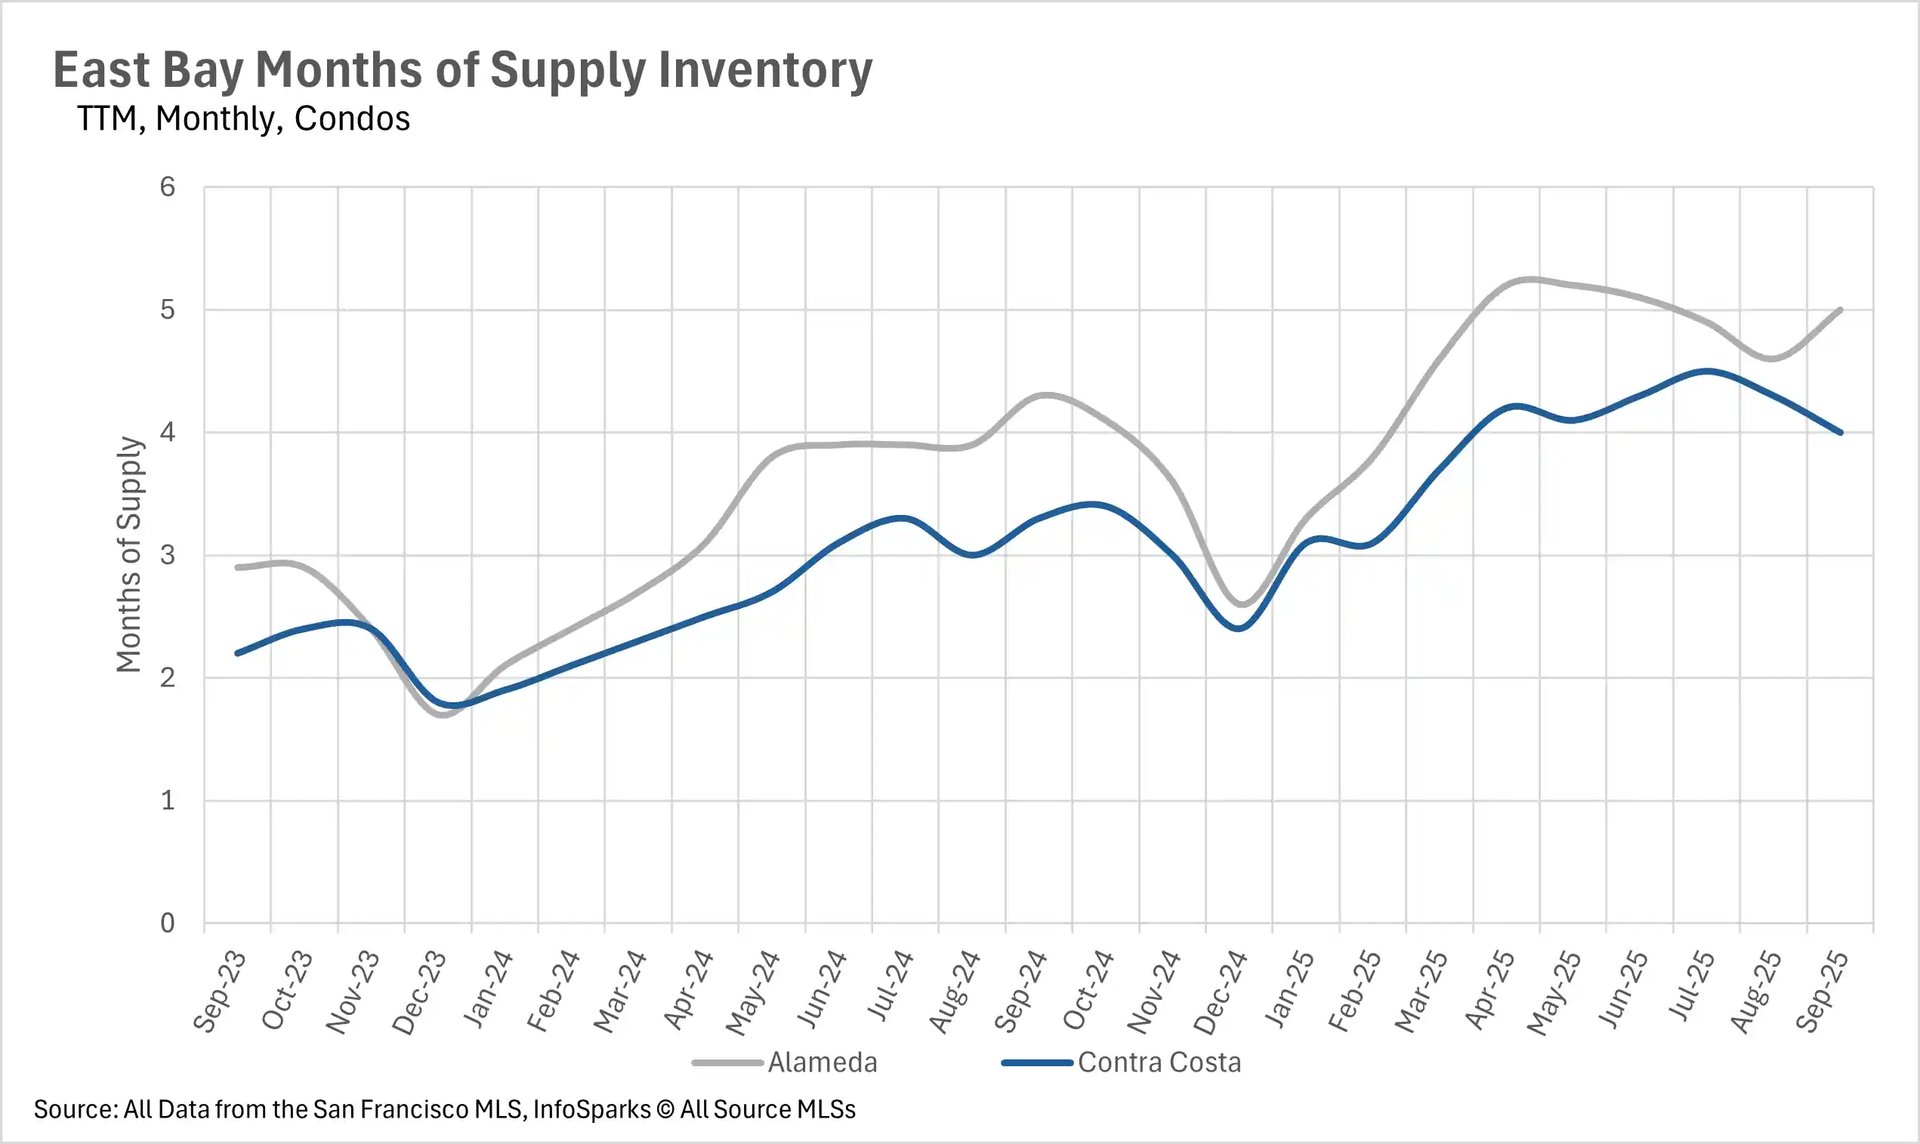
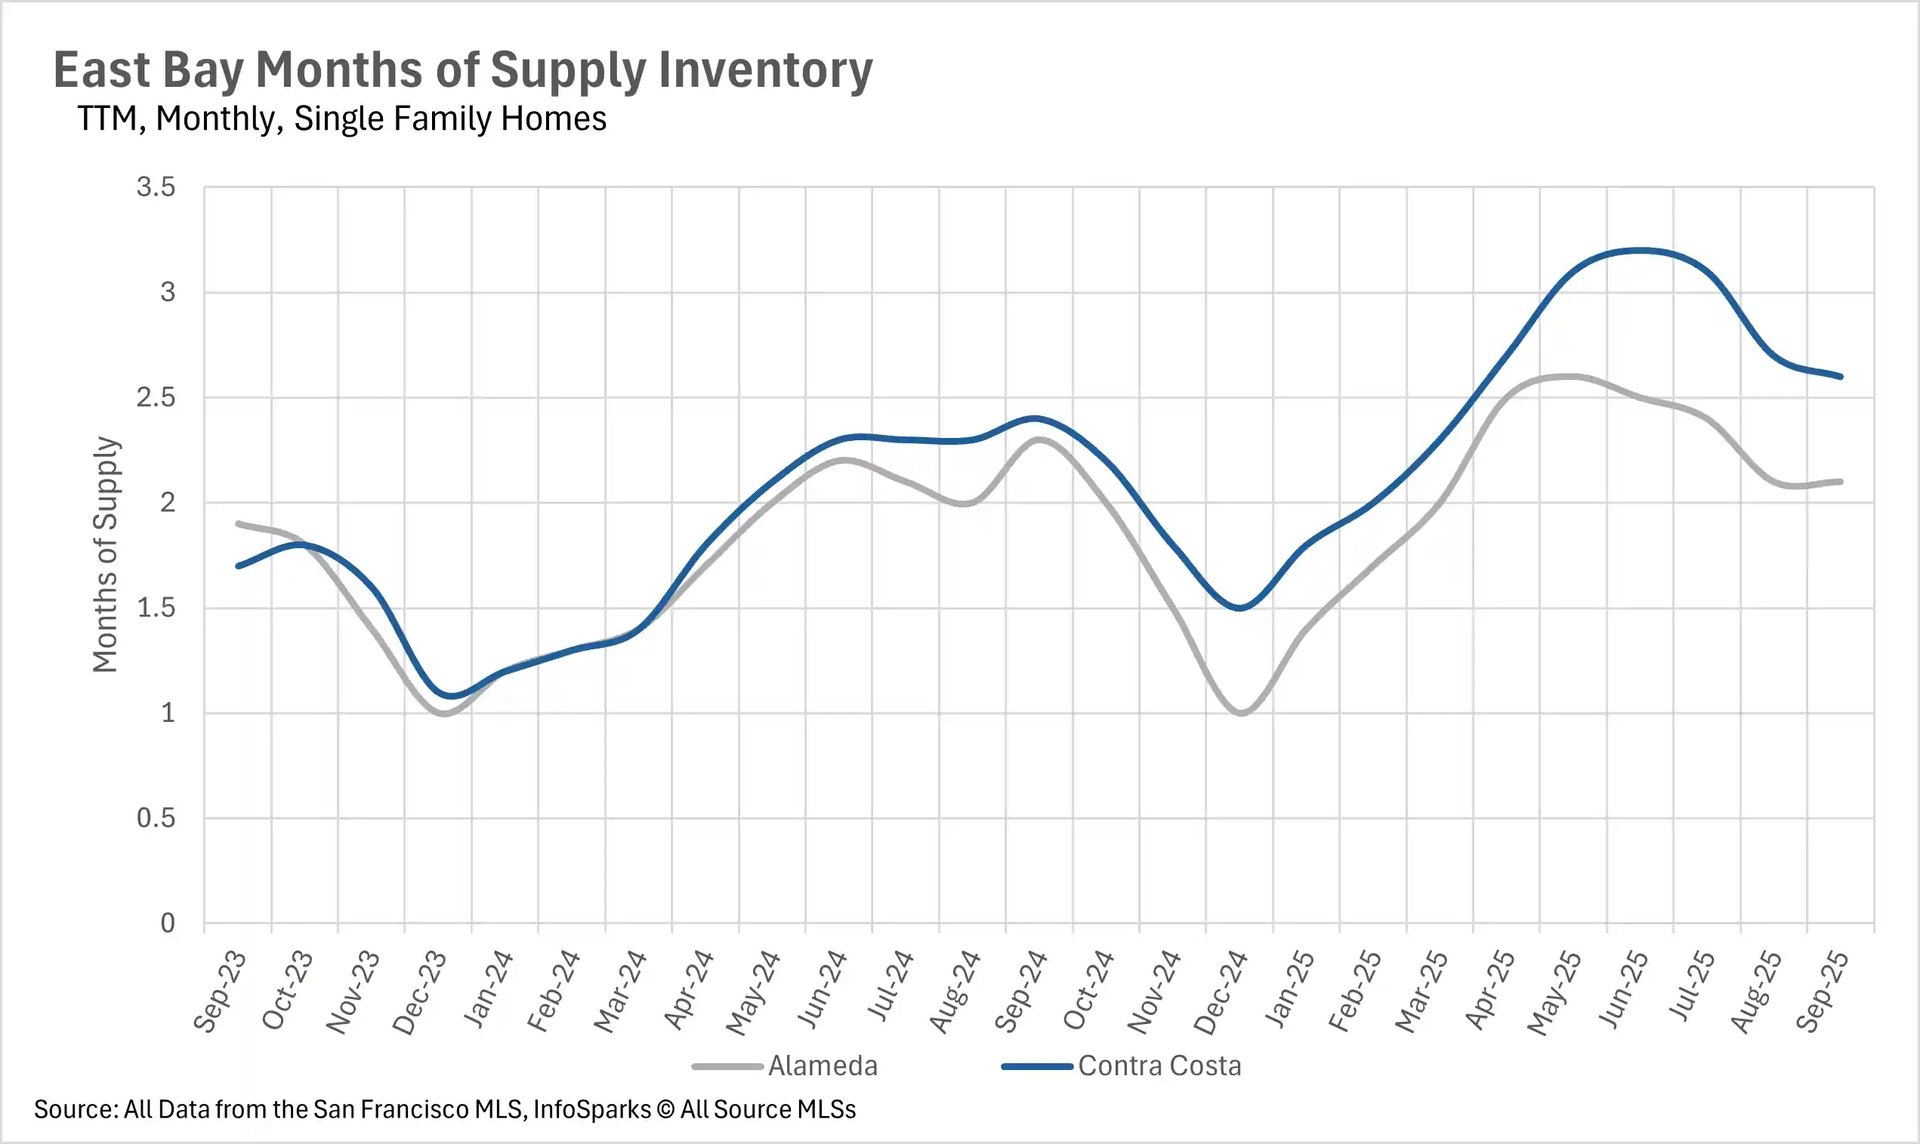
The single-family home market remains a seller's market, and the condo market remains a buyer's market
When determining whether a market is a buyers’ market or a sellers’ market, we look to the Months of Supply Inventory (MSI) metric. The state of California has historically averaged around three months of MSI, so any area with at or around three months of MSI is considered a balanced market. Any market that has lower than three months of MSI is considered a seller’s market, whereas markets with more than three months of MSI are considered buyers’ markets.
Over the course of the past month, there hasn’t been much of a change in terms of the state of the overall markets in the East Bay. Single-family home markets remain heavily within sellers' territory, with just 2.1 months of inventory on the market in Alameda County and 2.6 months in Contra Costa County. Whereas the condo market tells a much different story, with 5 months of inventory on the market in Alameda County and 4 months in Contra Costa County, making the condo market a buyer-dominated market.