Select a Market Report to Read:
The Local Lowdown
Quick Take:
- September marked a significant shift in Bay Area inventory dynamics, with most regions experiencing year-over-year declines for the first time in months, driven by increased sales velocity rather than new listing growth.
- San Francisco stands out with dramatic inventory declines of over 30% and surging single-family home prices, while other regions show more modest price movements within historical bands.
- Market velocity continues to accelerate across most Bay Areas regions, with listings selling faster despite percentage increases in days on market, as absolute numbers remain remarkably low.
- The region-wide trend toward seller's markets intensifies as inventory normalization continues, with San Francisco's condo market approaching seller's territory and other regions showing steady movement in that direction.
Note: You can find the charts/graphs for the Local Lowdown at the end of this section.
*National Association of REALTORS® data is released two months behind, so we estimate the most recent month's data when possible and appropriate.
Price stability dominates most regions while San Francisco surges
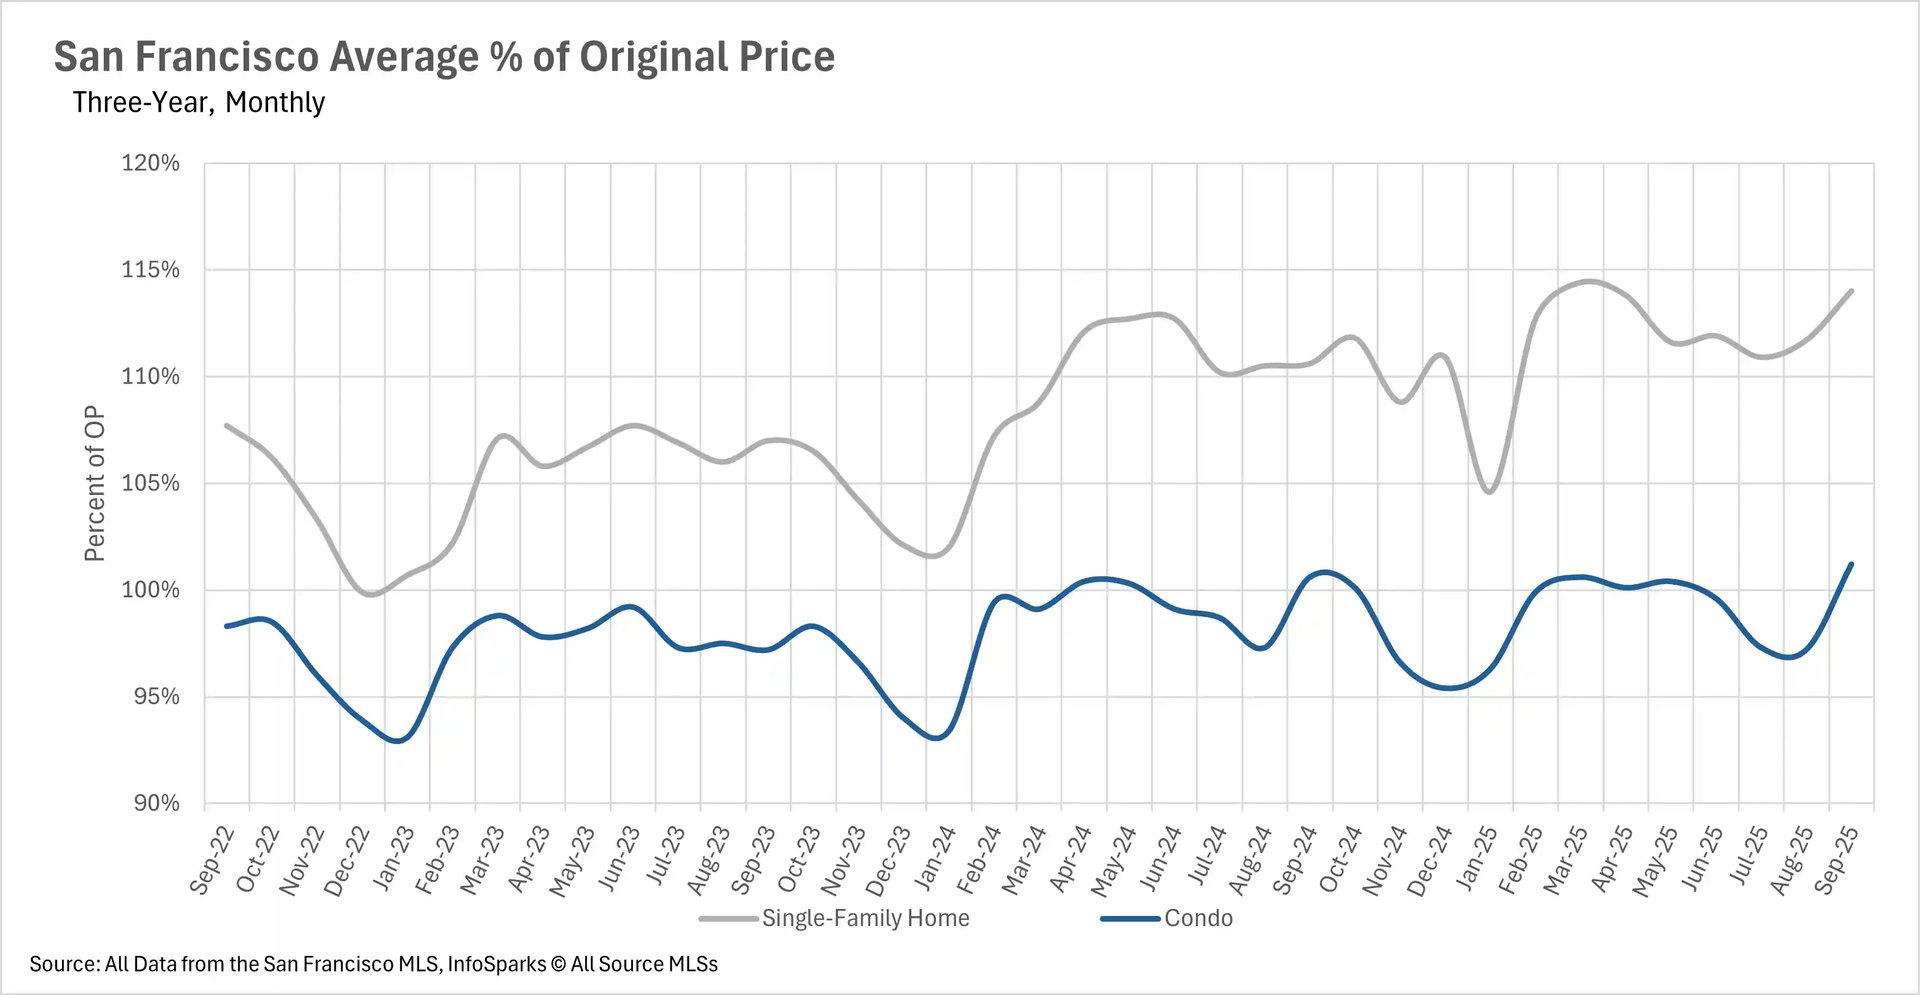
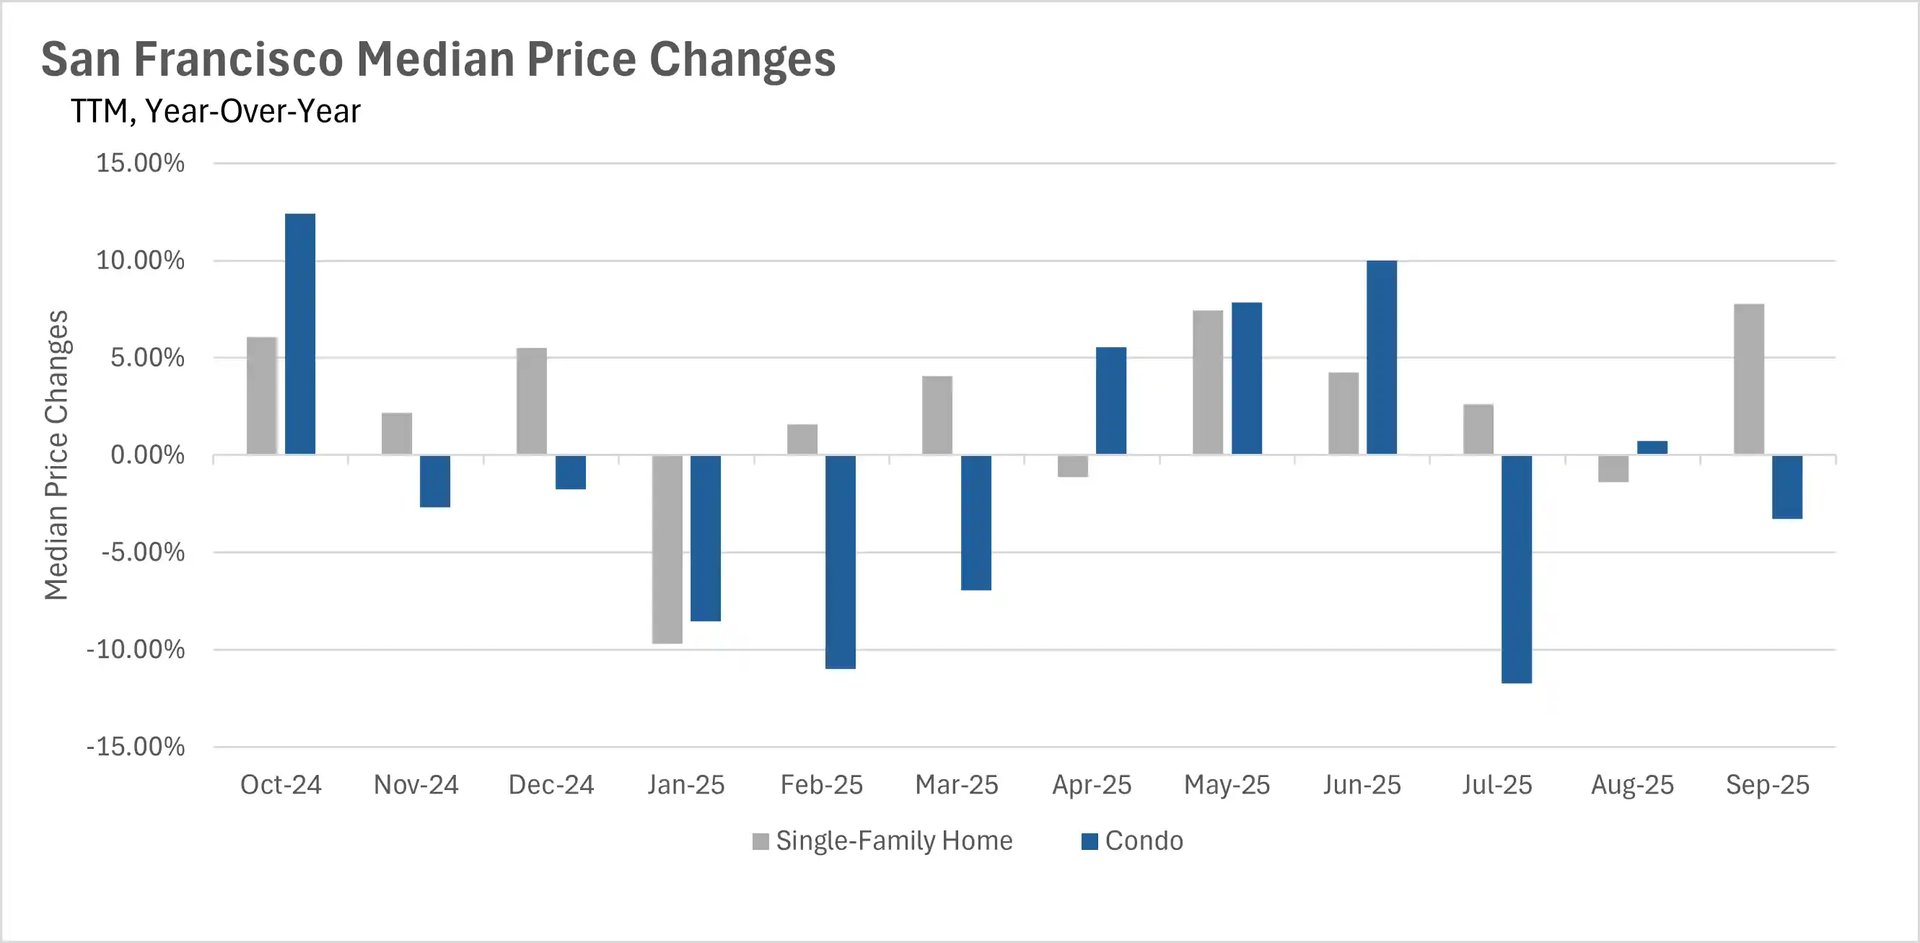
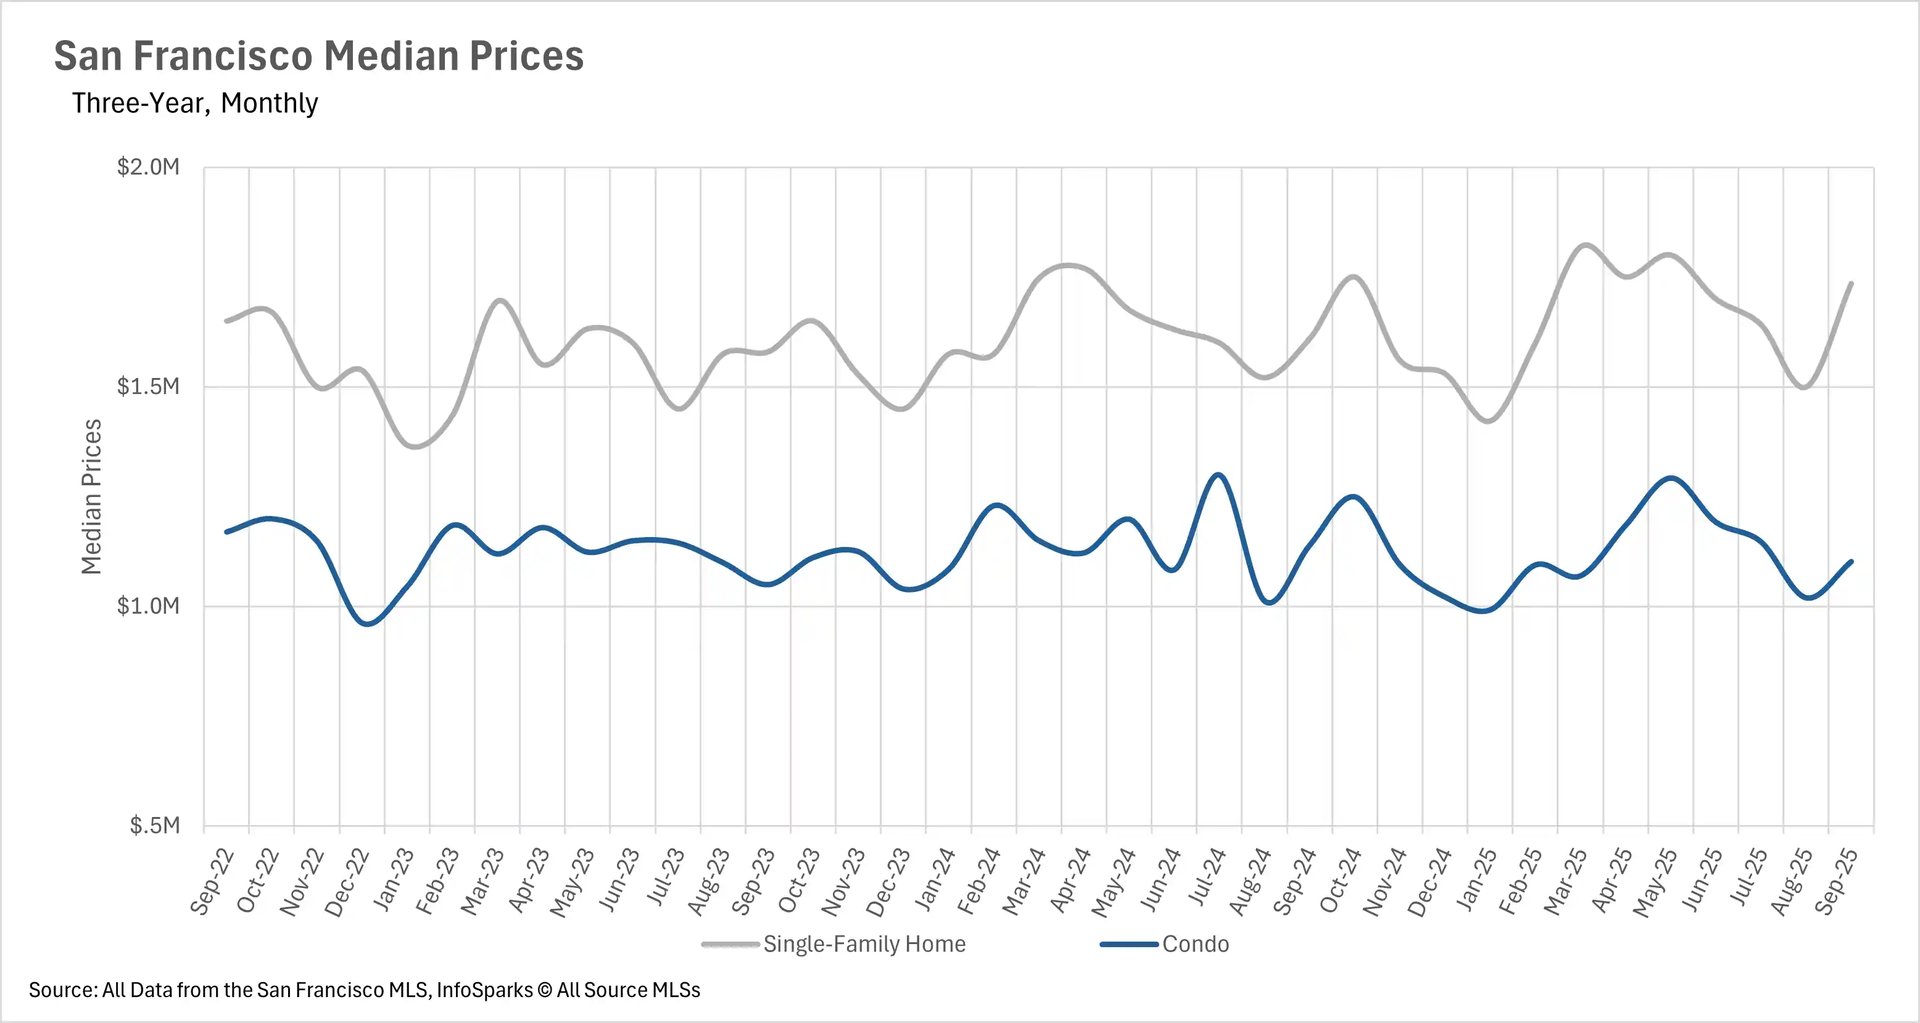
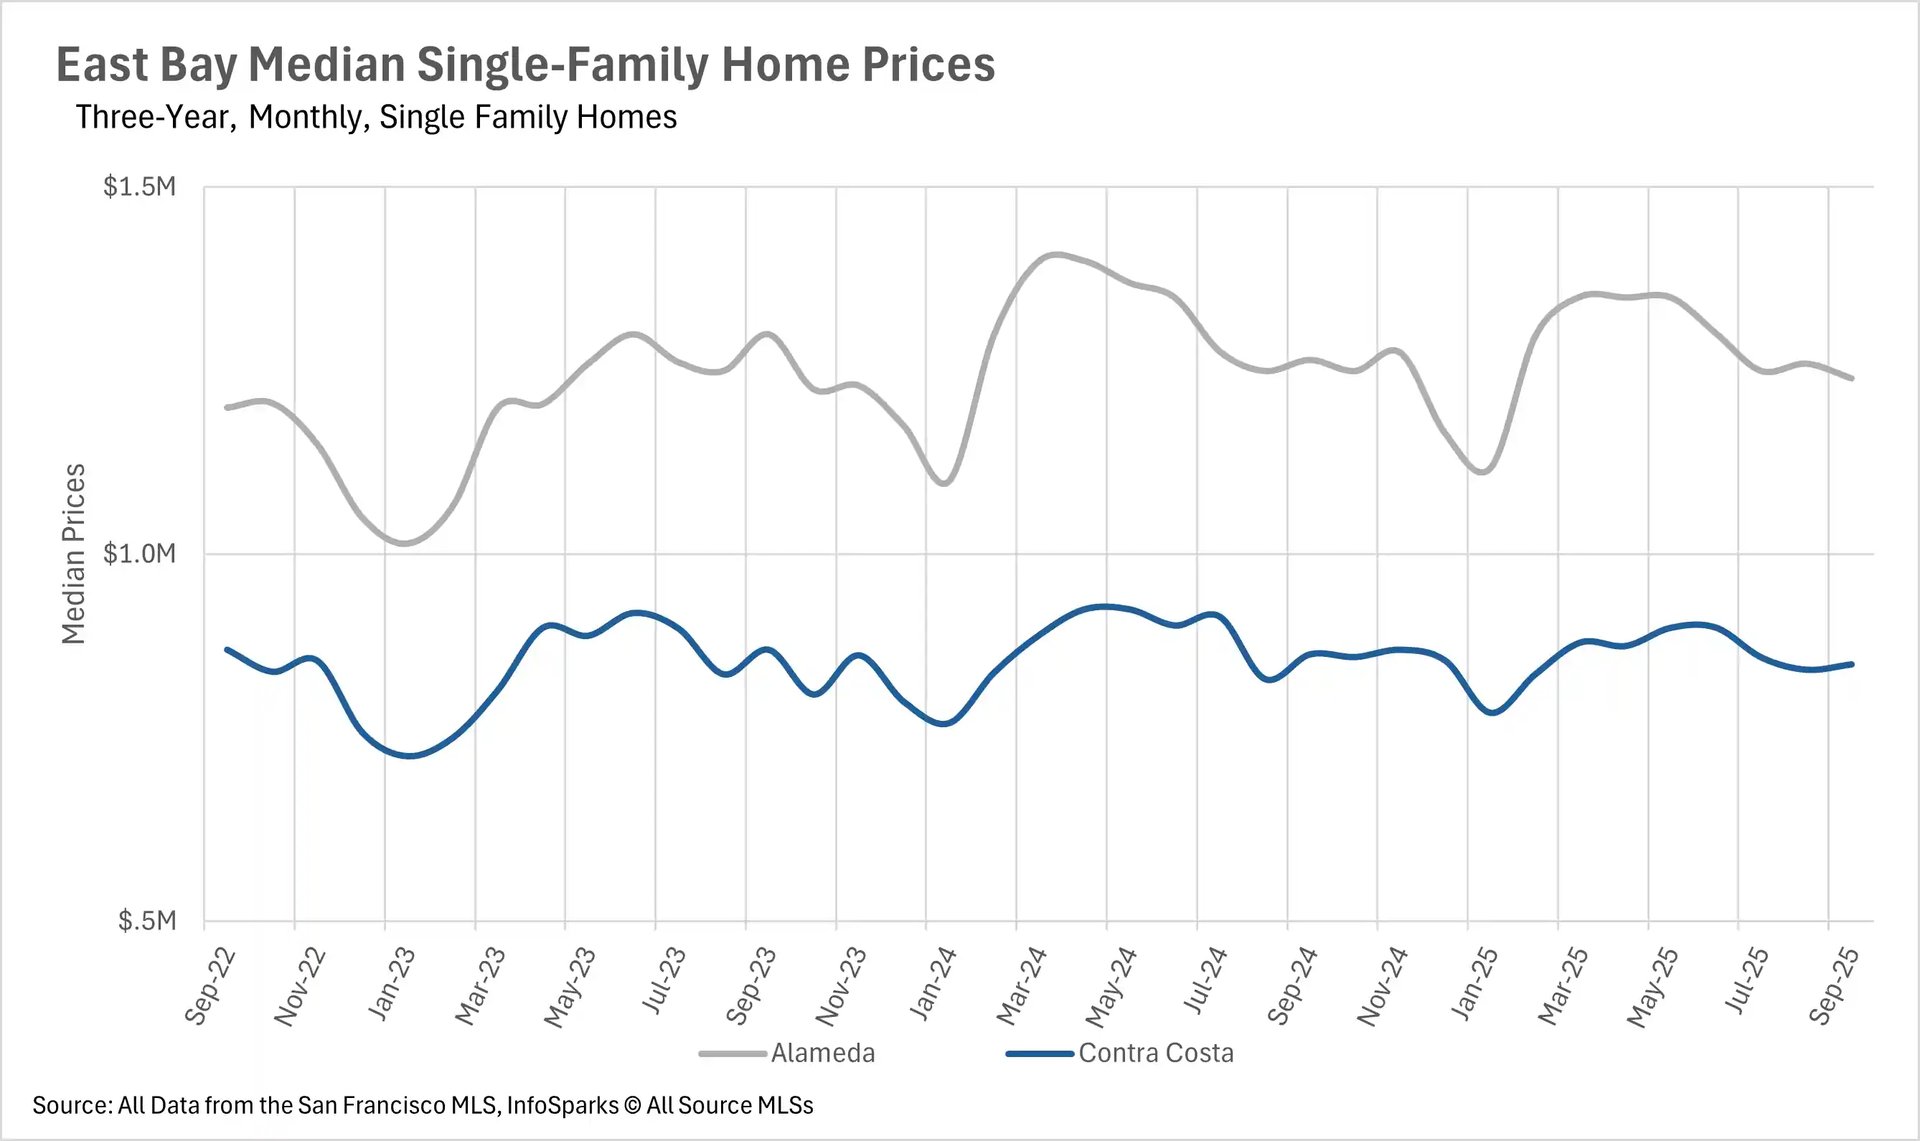
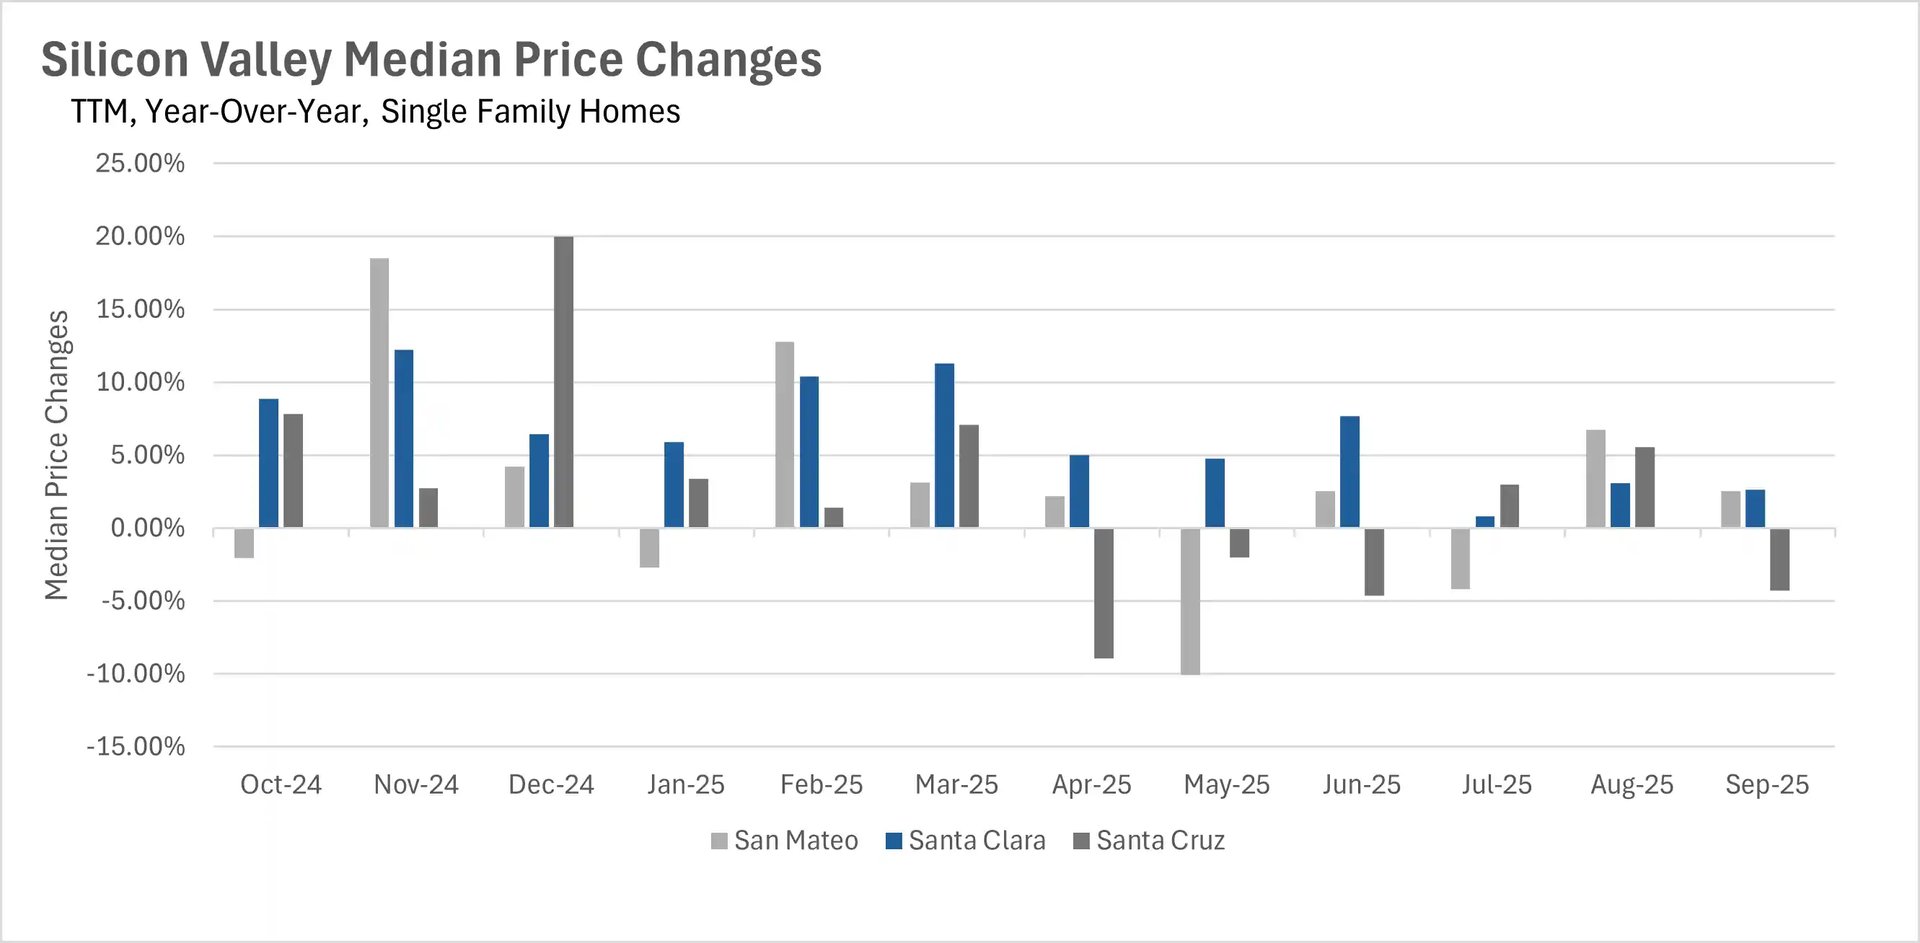
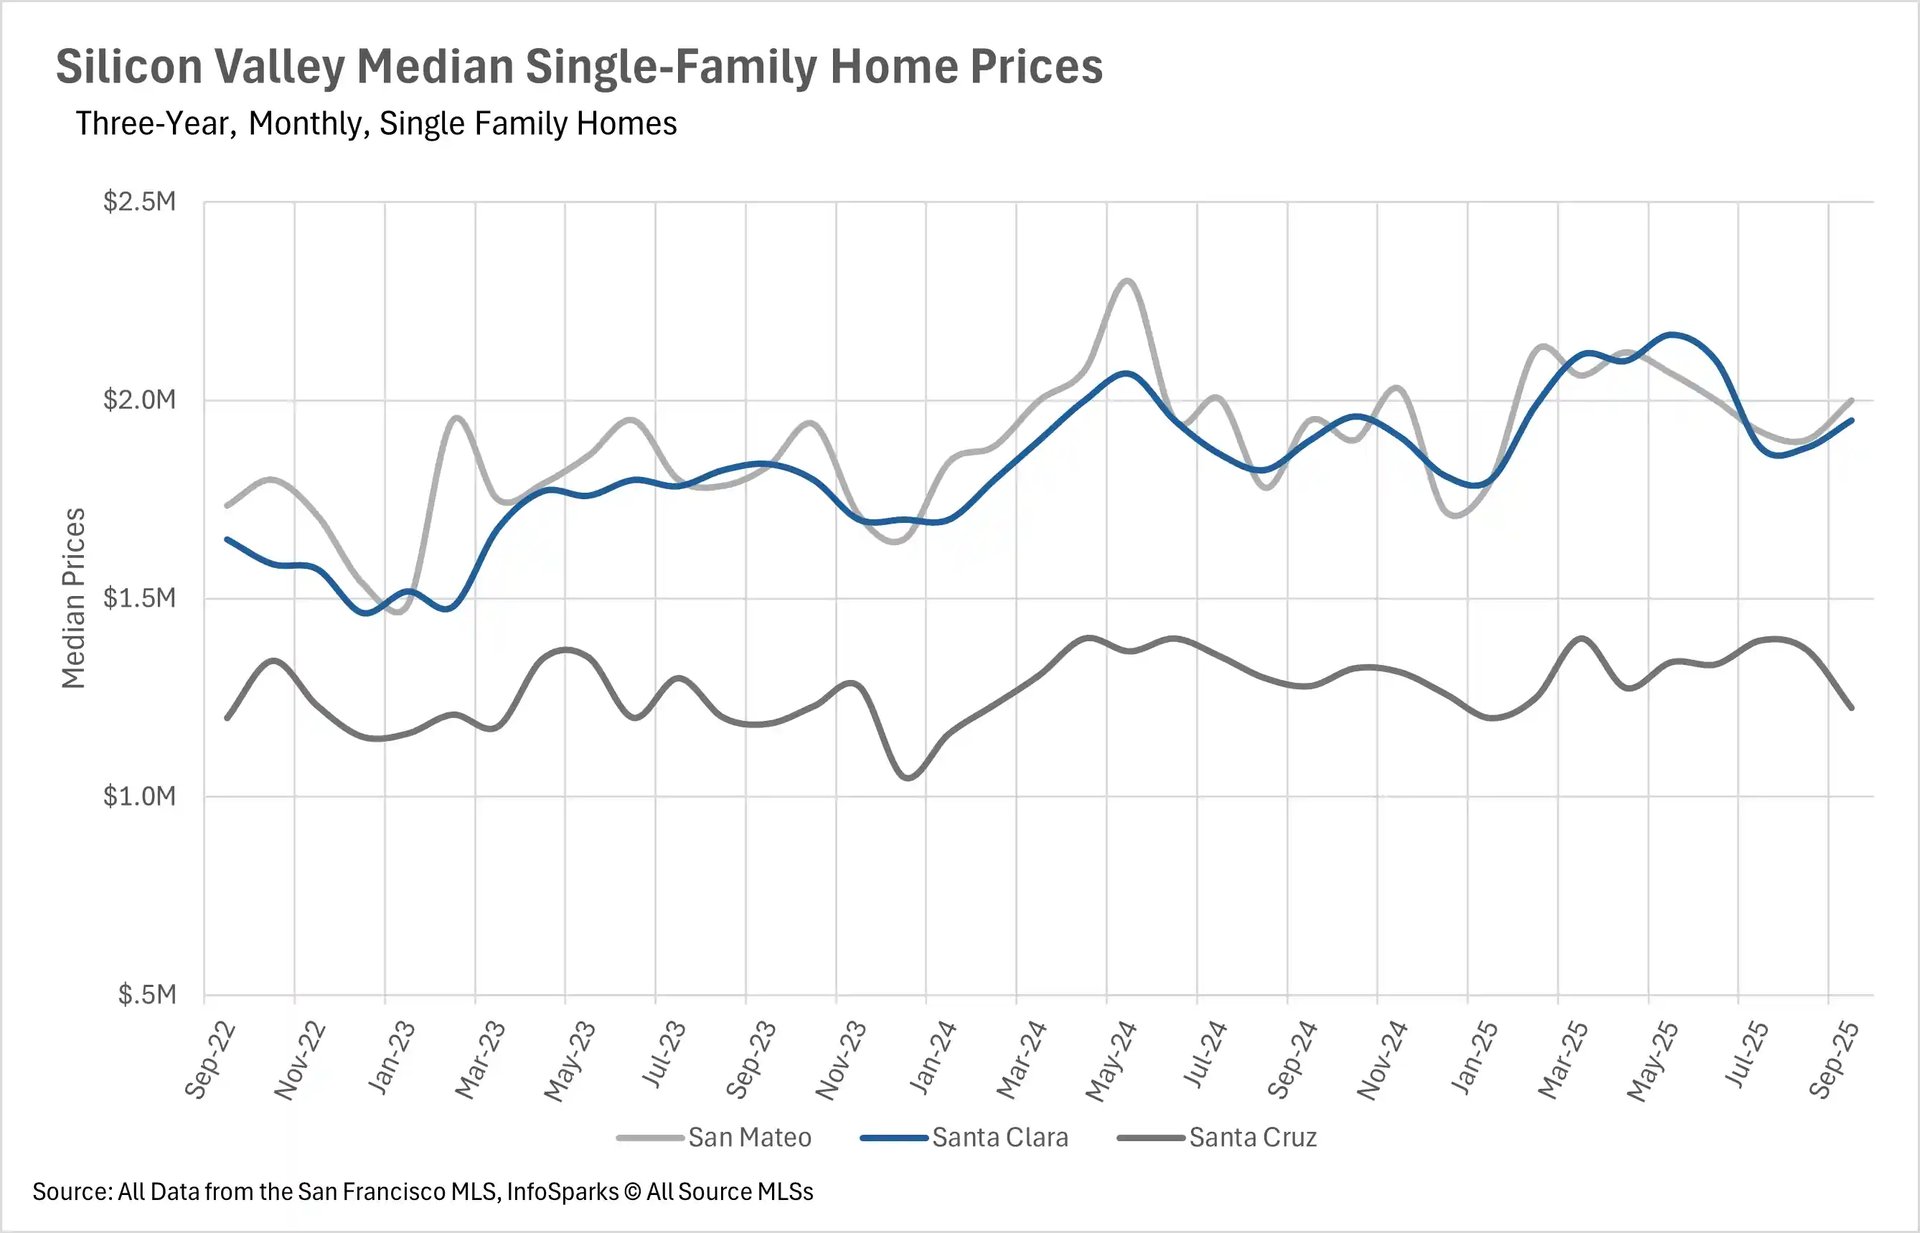
September showcased divergent price trends across the Bay Area, with San Francisco experiencing a dramatic surge while other regions maintained relative stability. San Francisco's single-family home market jumped 7.76% year-over-year, marking the largest increase the market has seen all year, though condos declined 3.29%. Notably, the average San Francisco condo is now selling at a slight premium to listing price for the first time since May. Silicon Valley demonstrated remarkable stability with single-family homes remaining within their historical pricing bands - San Mateo and Santa Clara Counties posted modest gains of 2.56% and 2.63% respectively, while Santa Cruz County declined 4.30%.
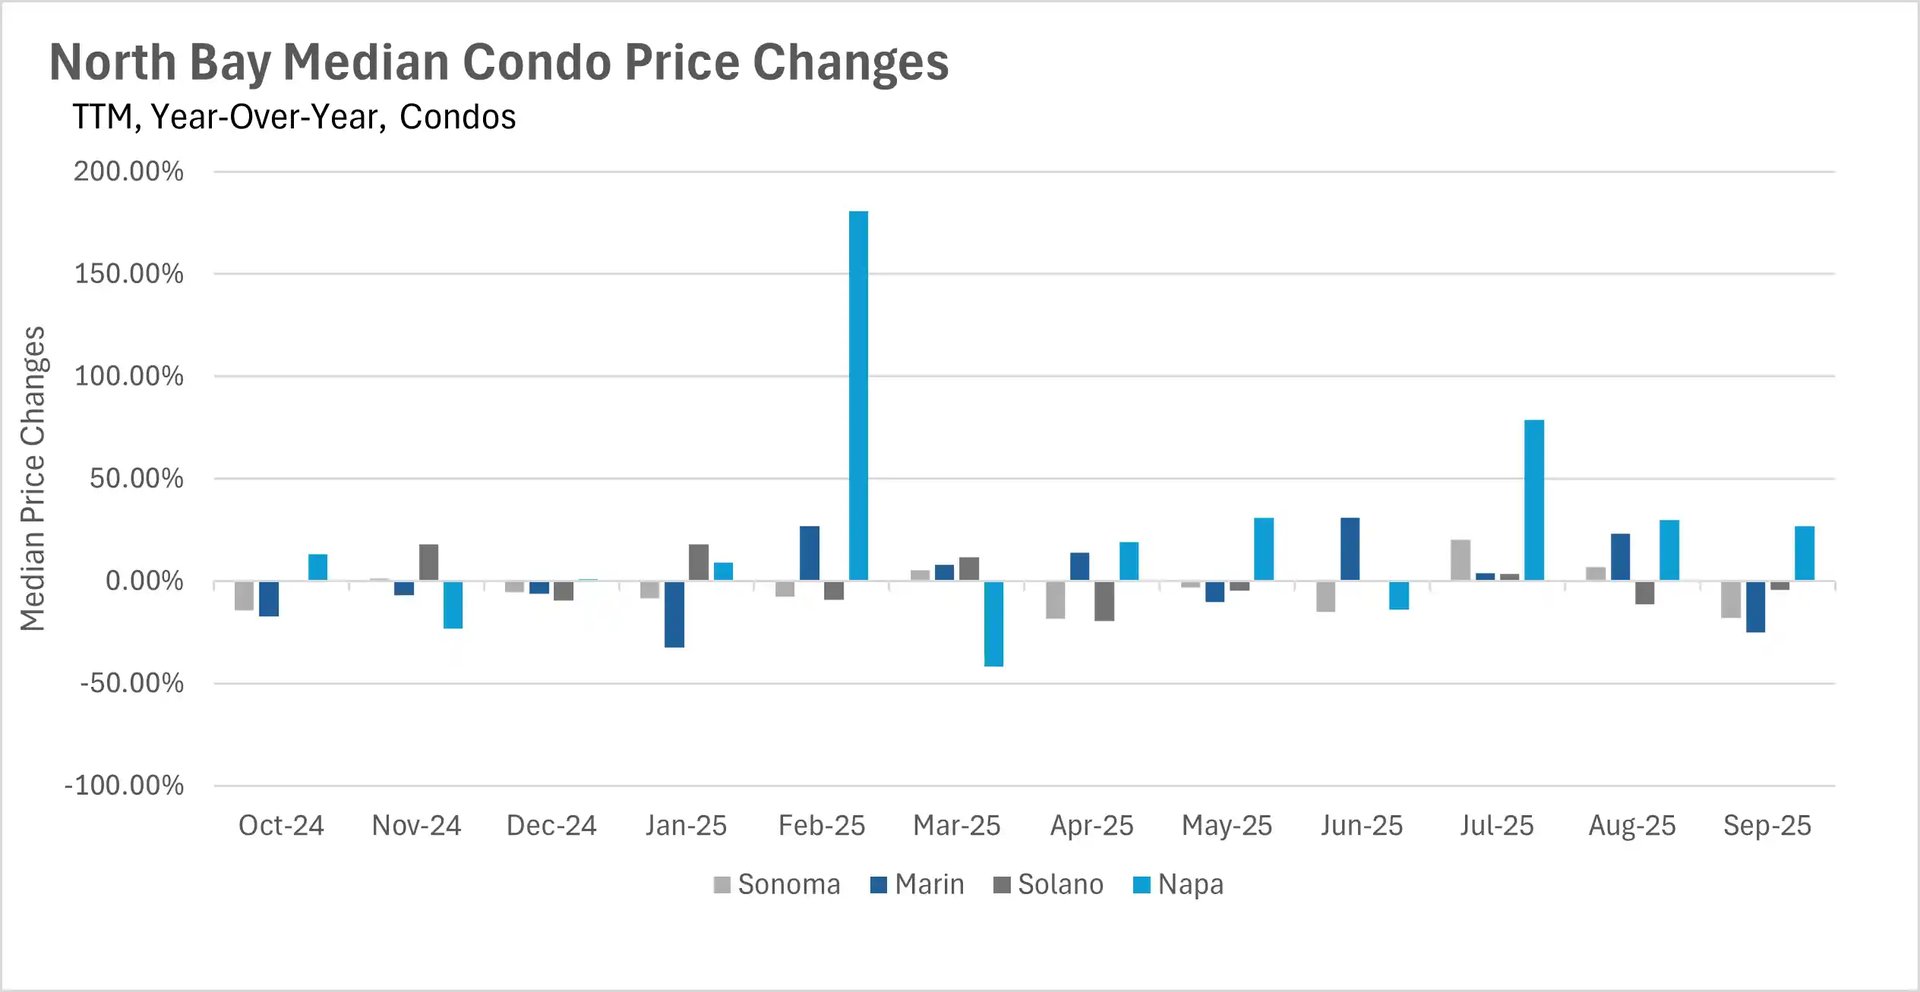
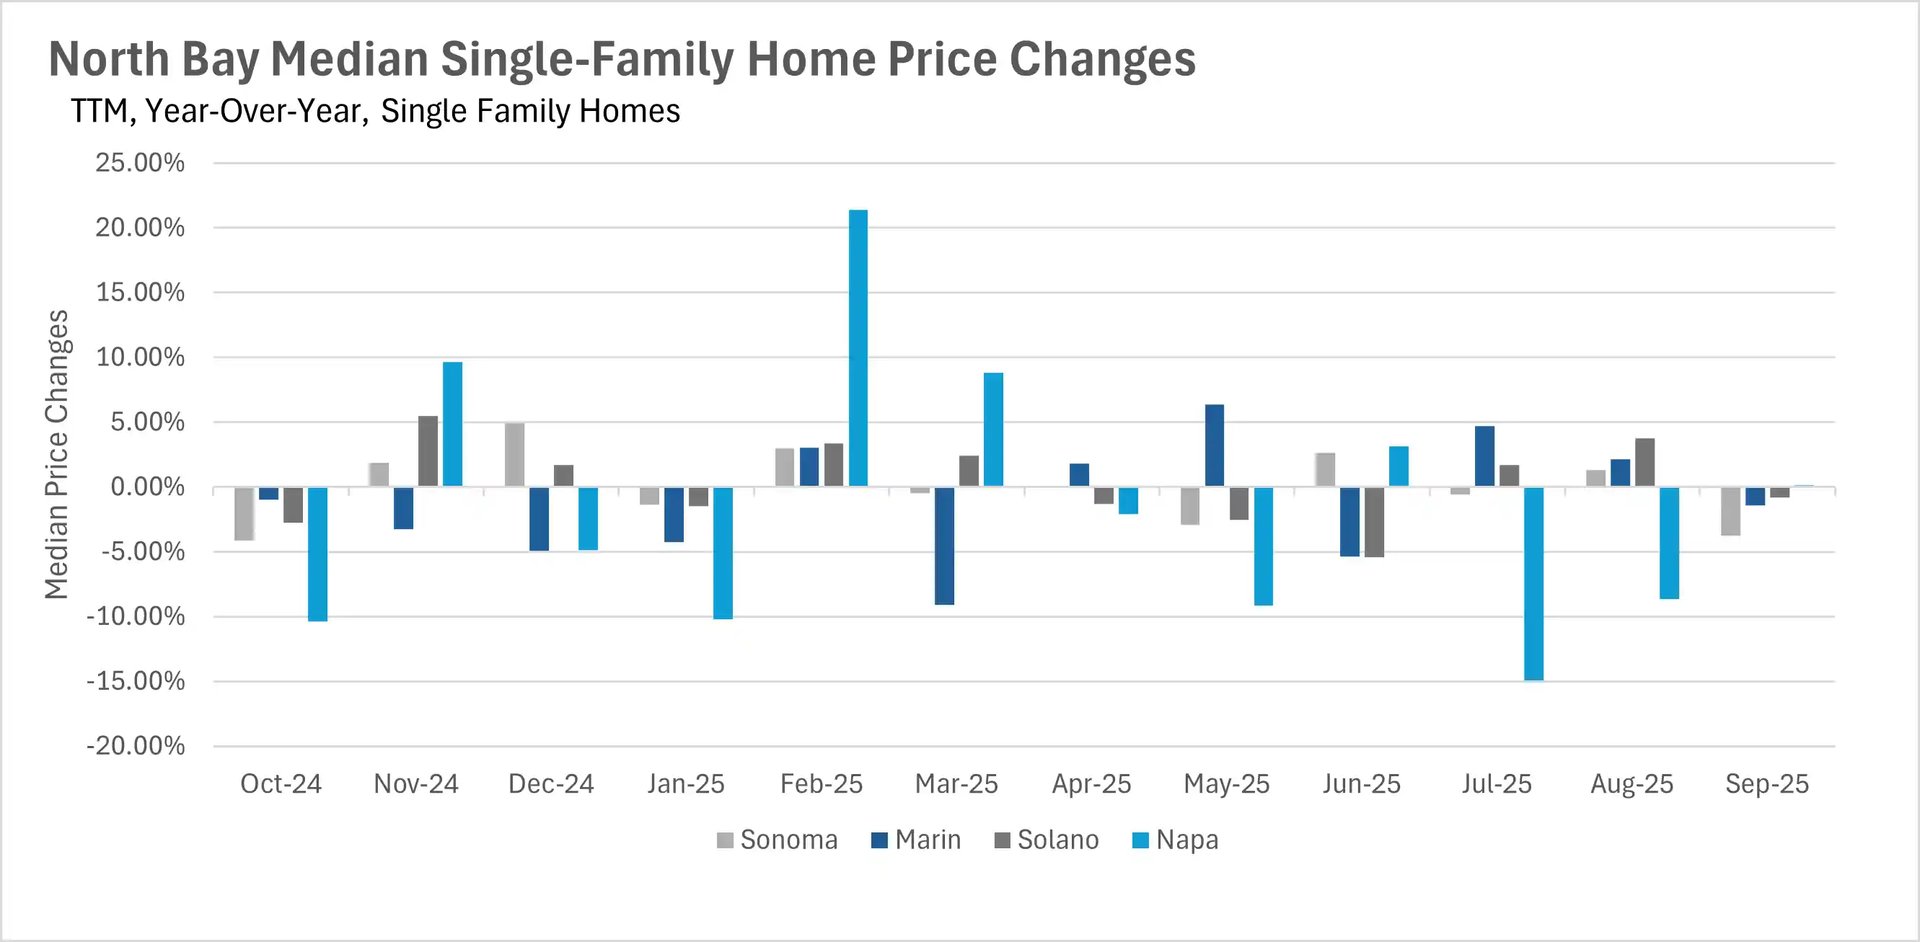
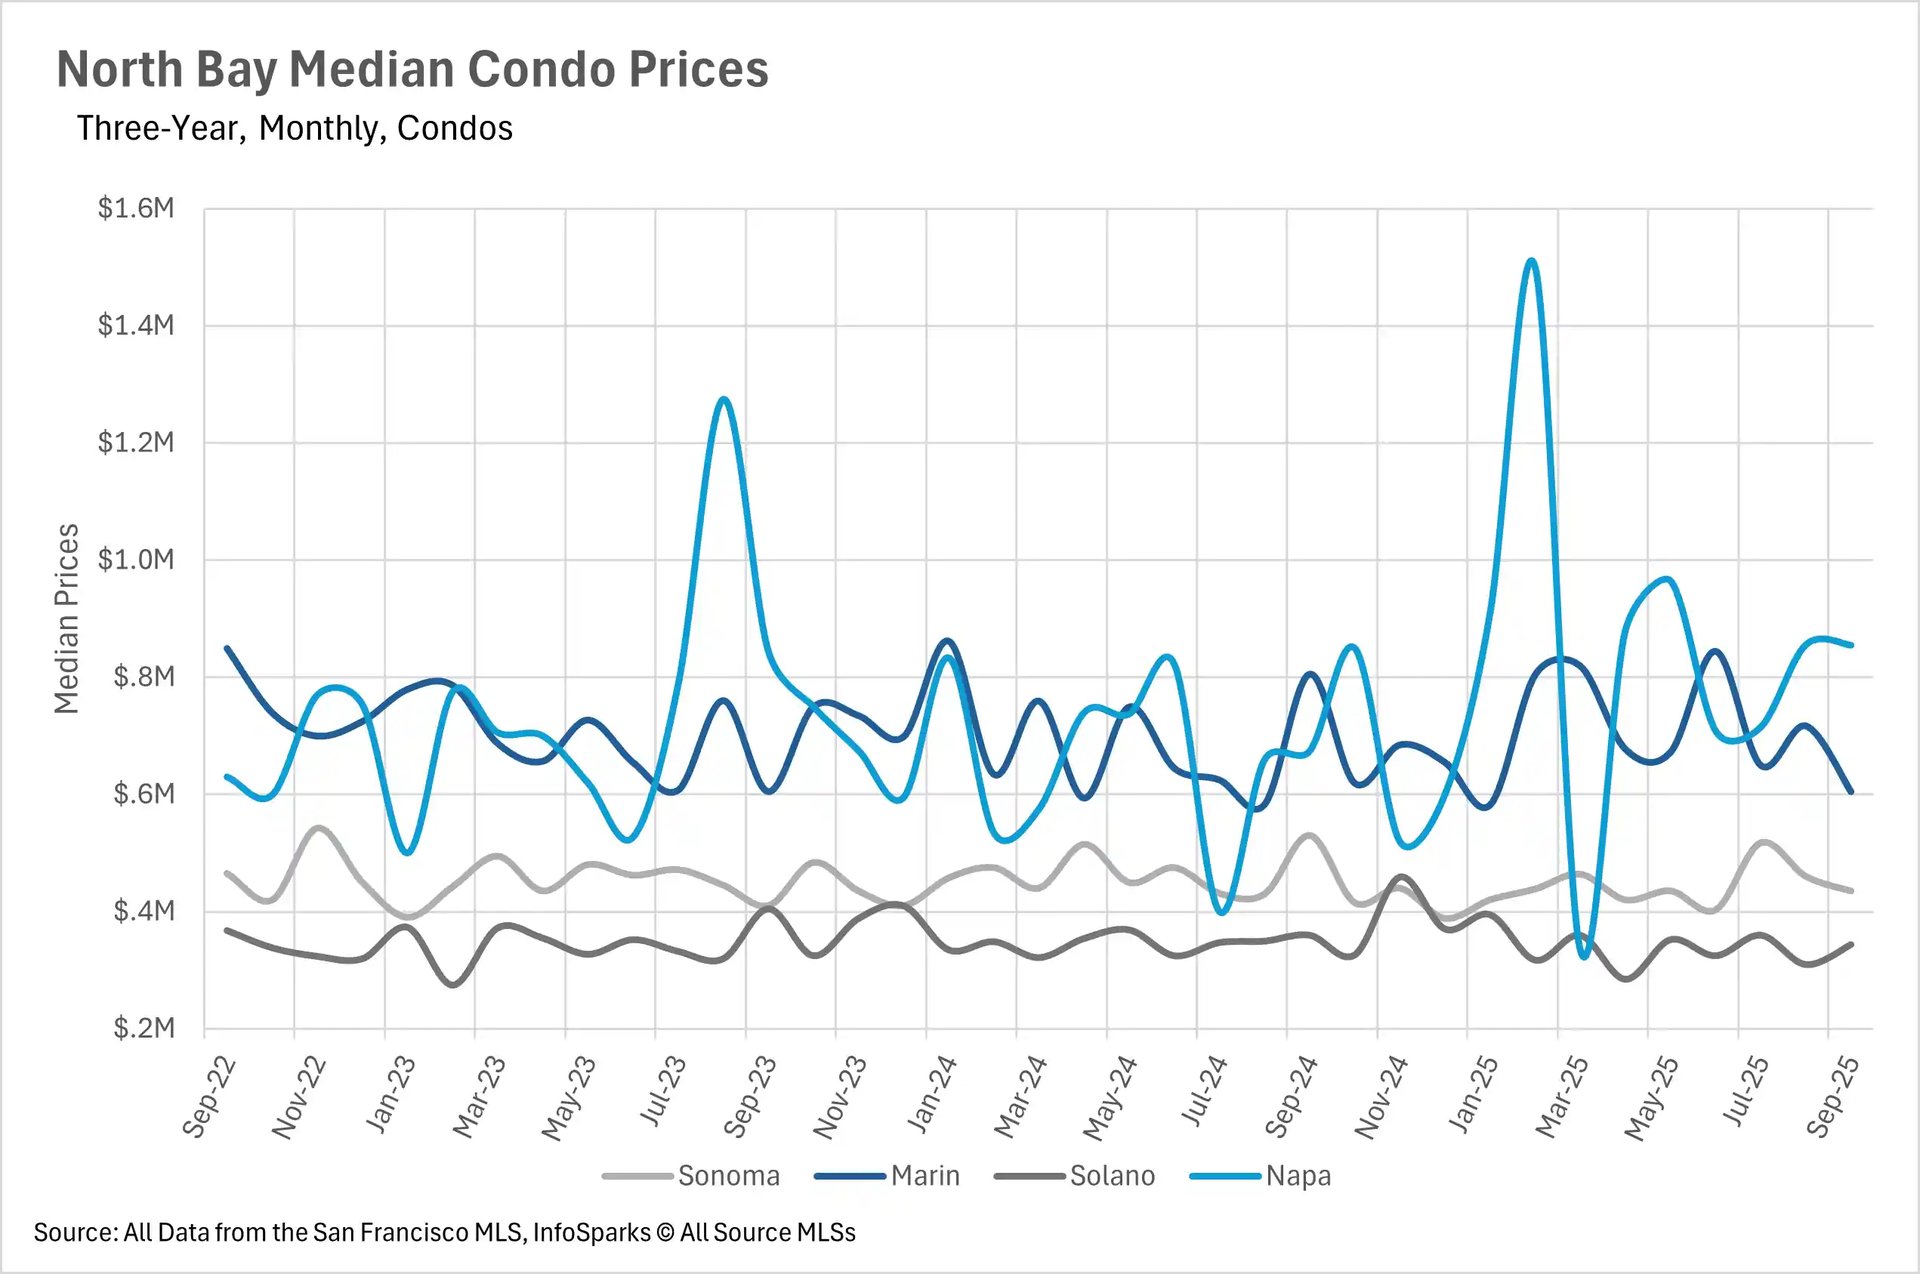
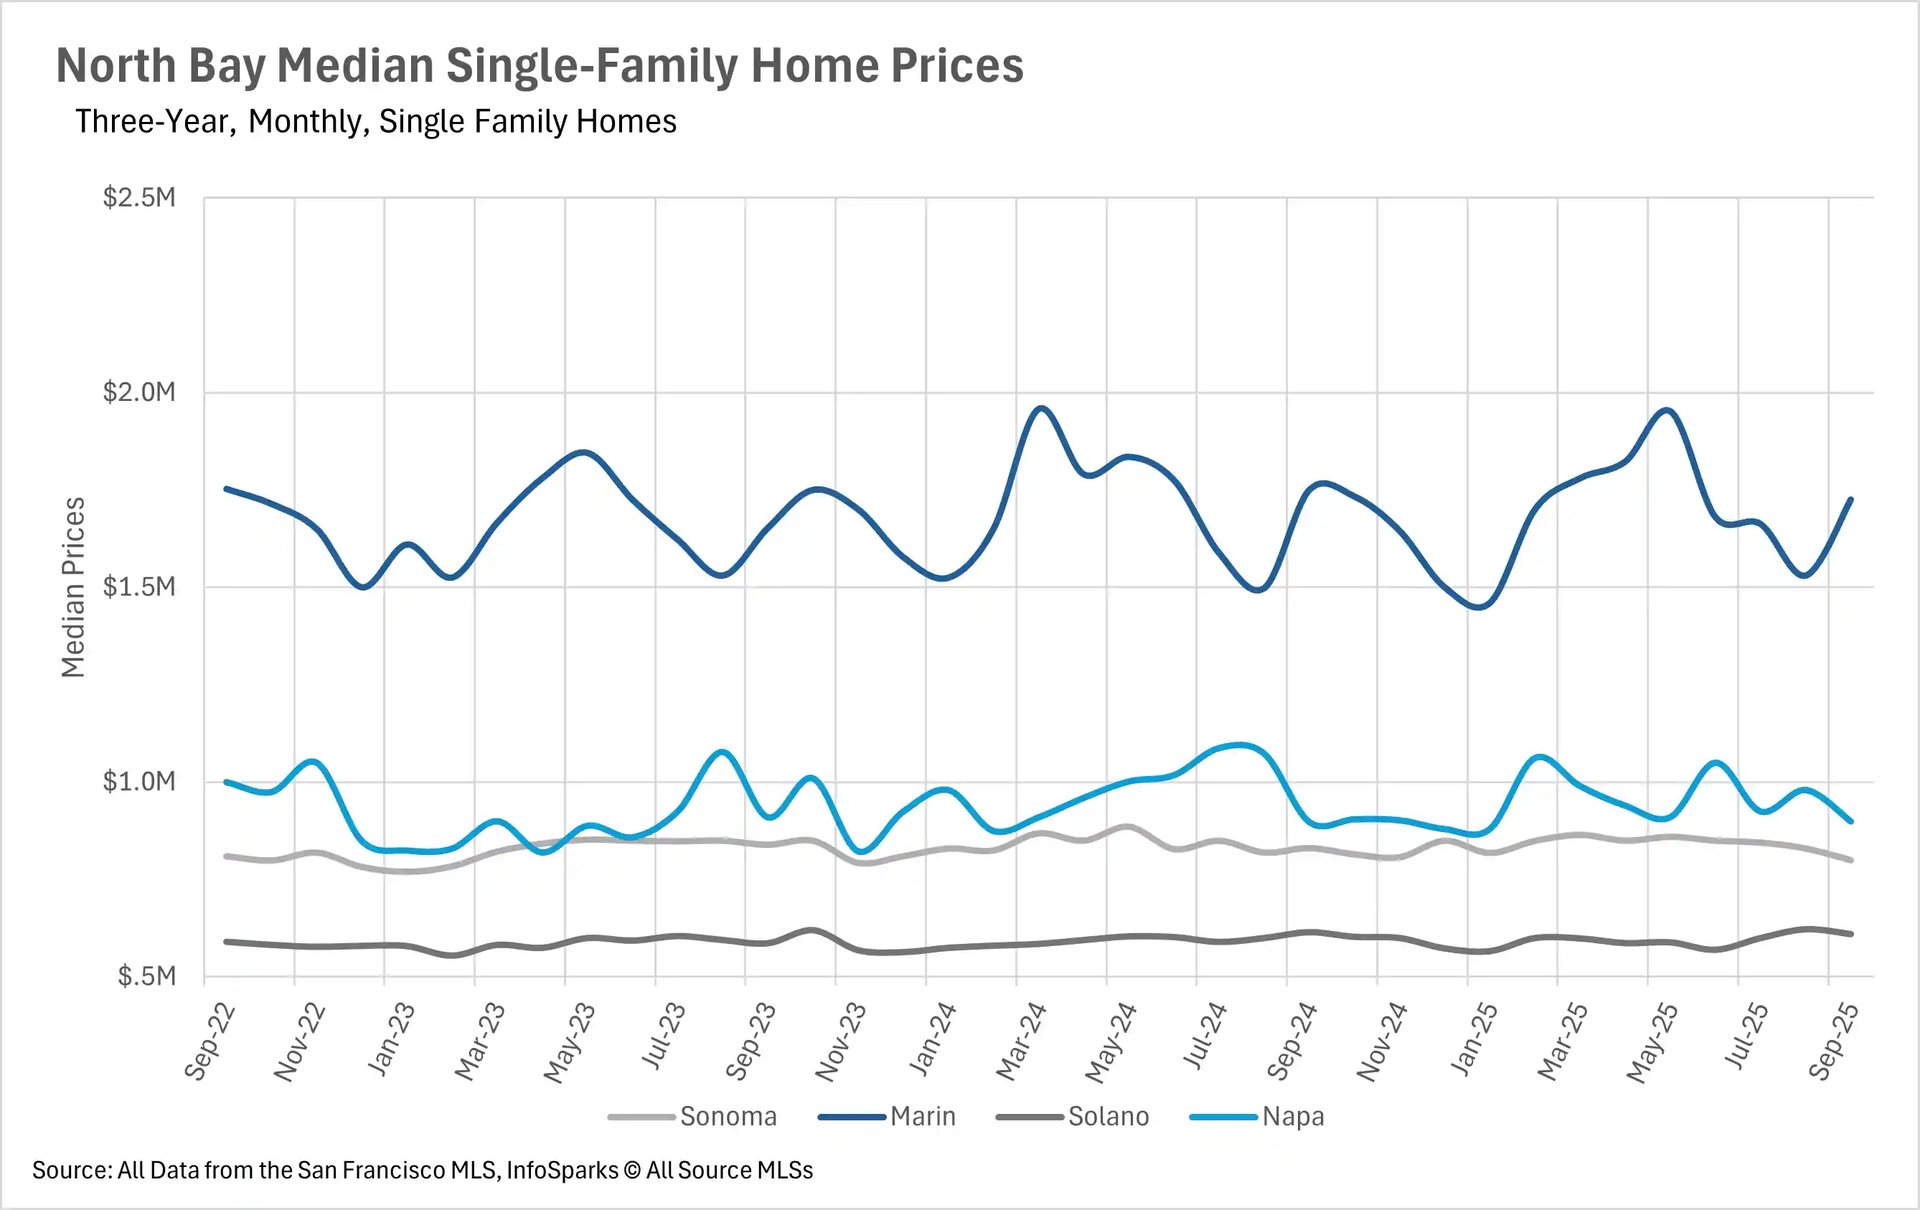
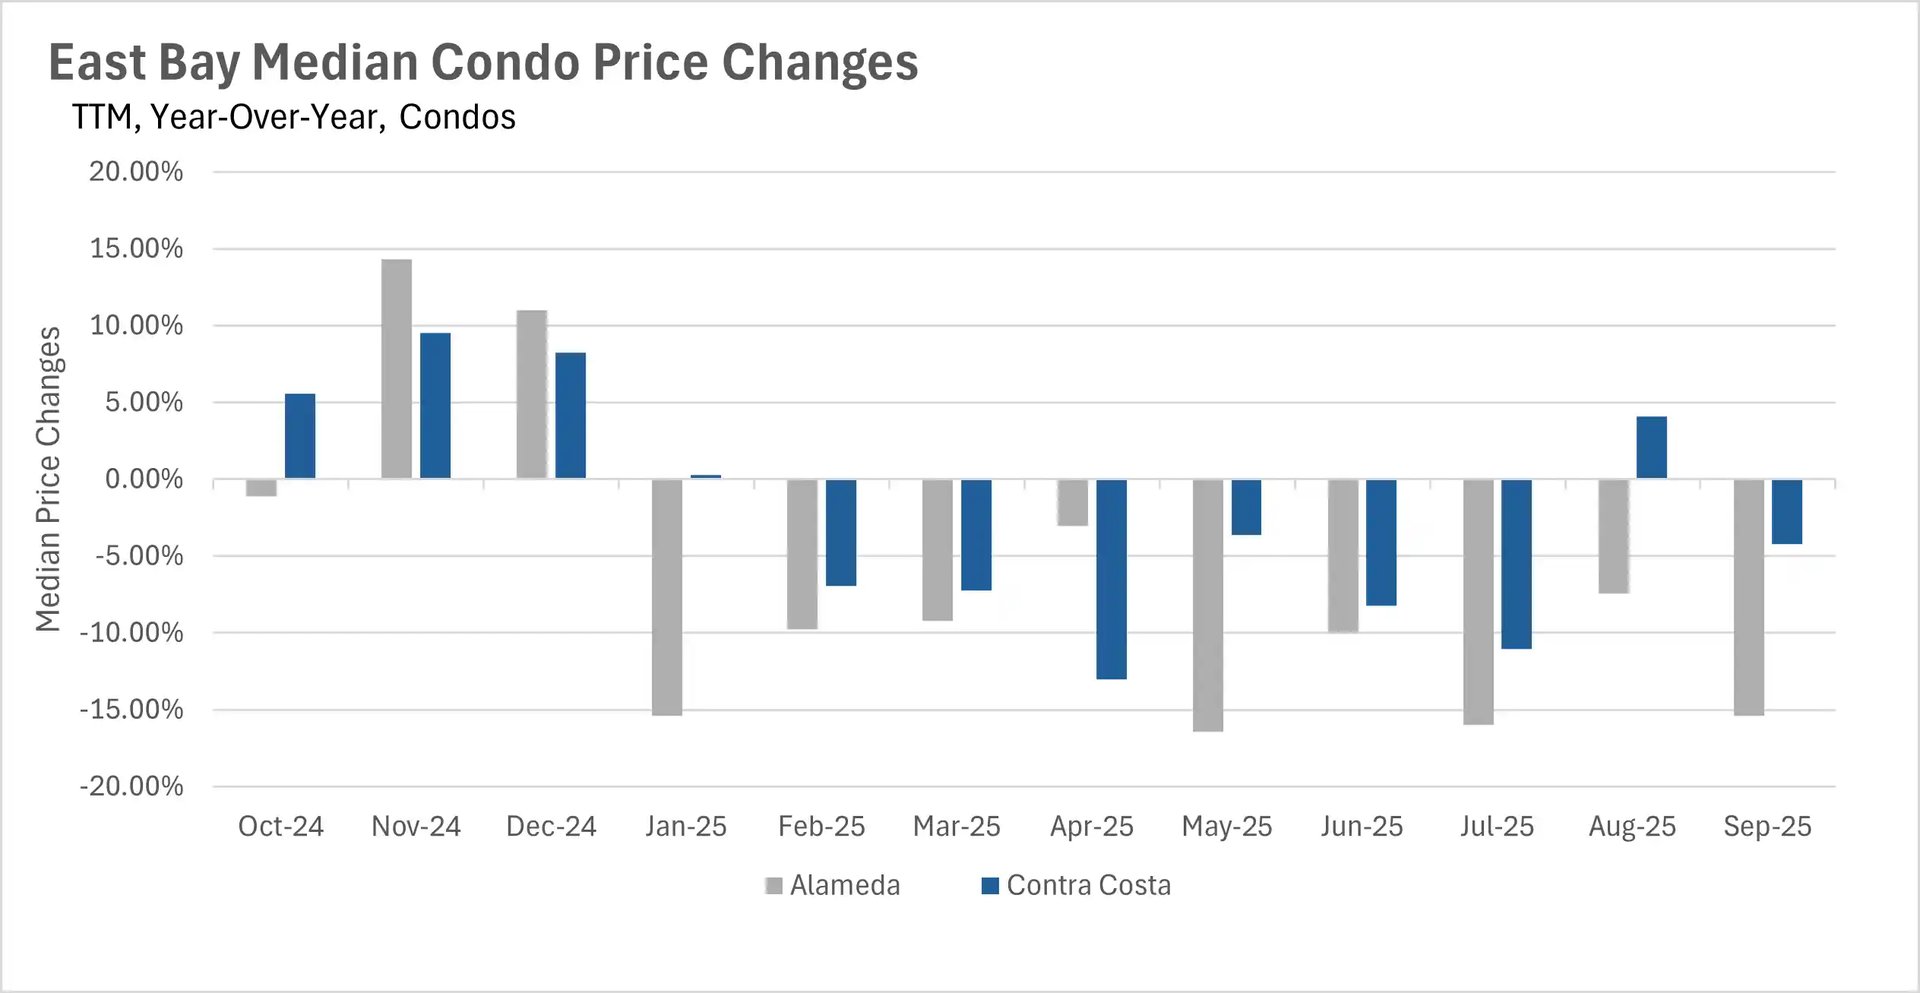
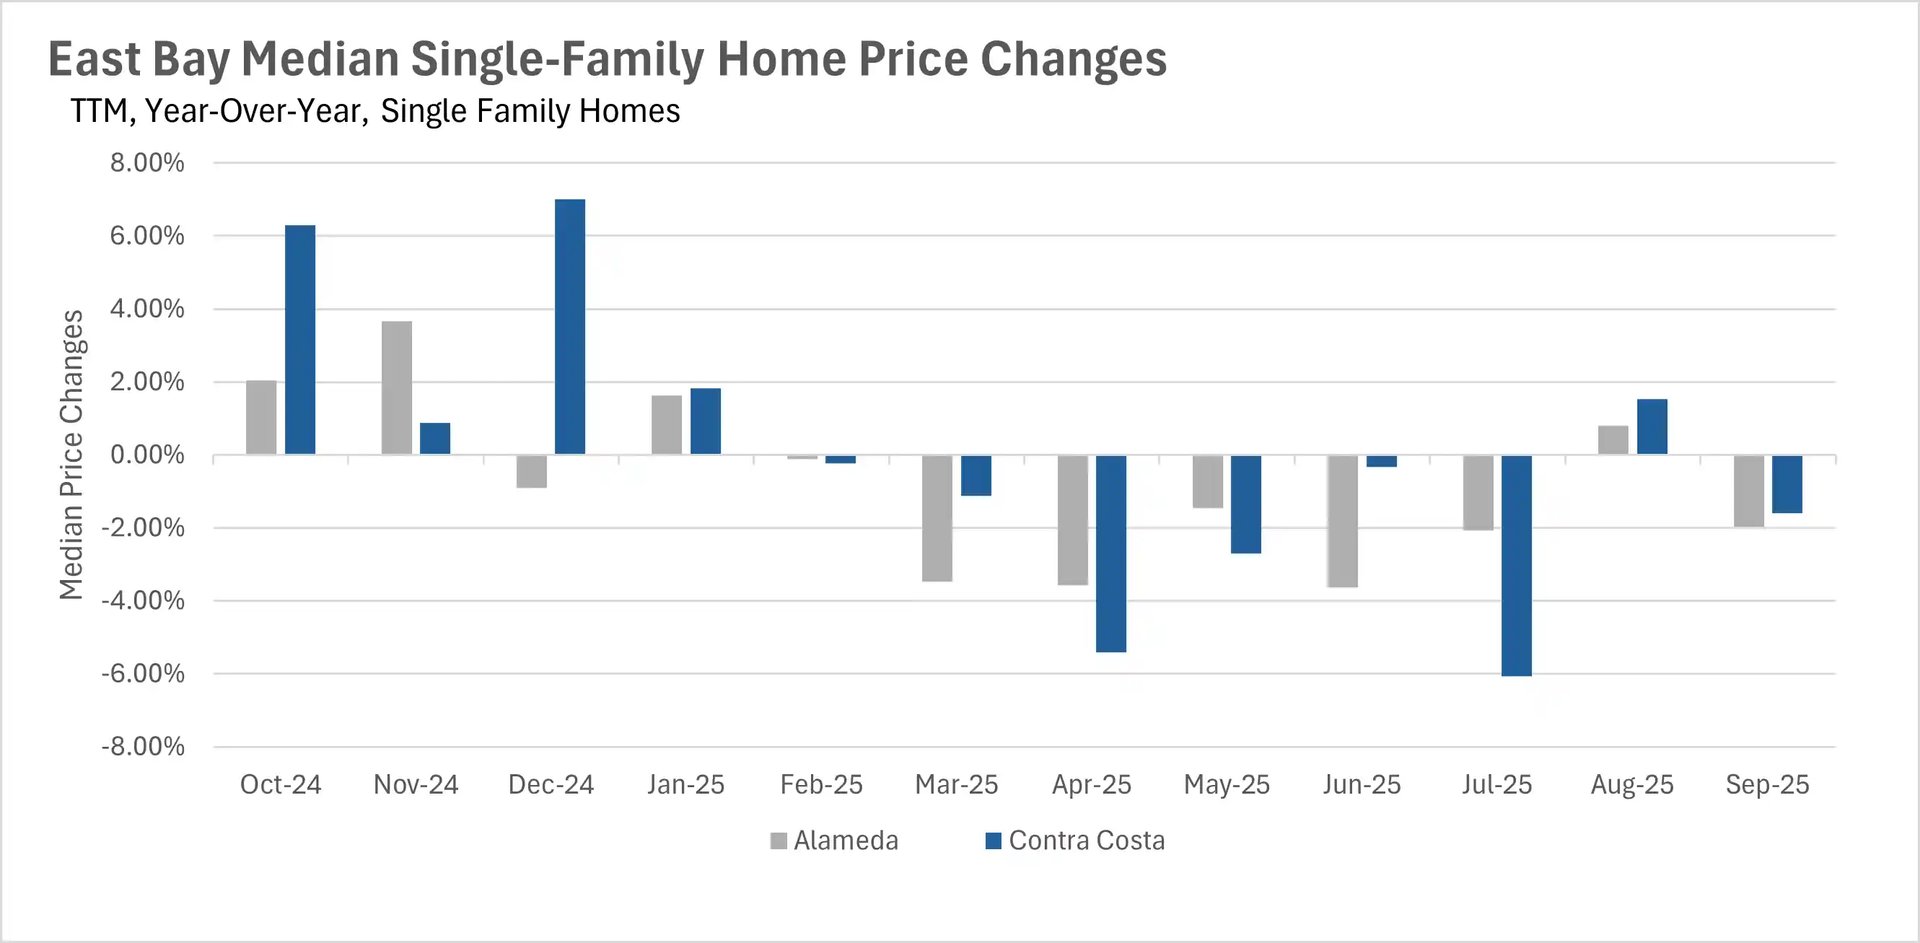
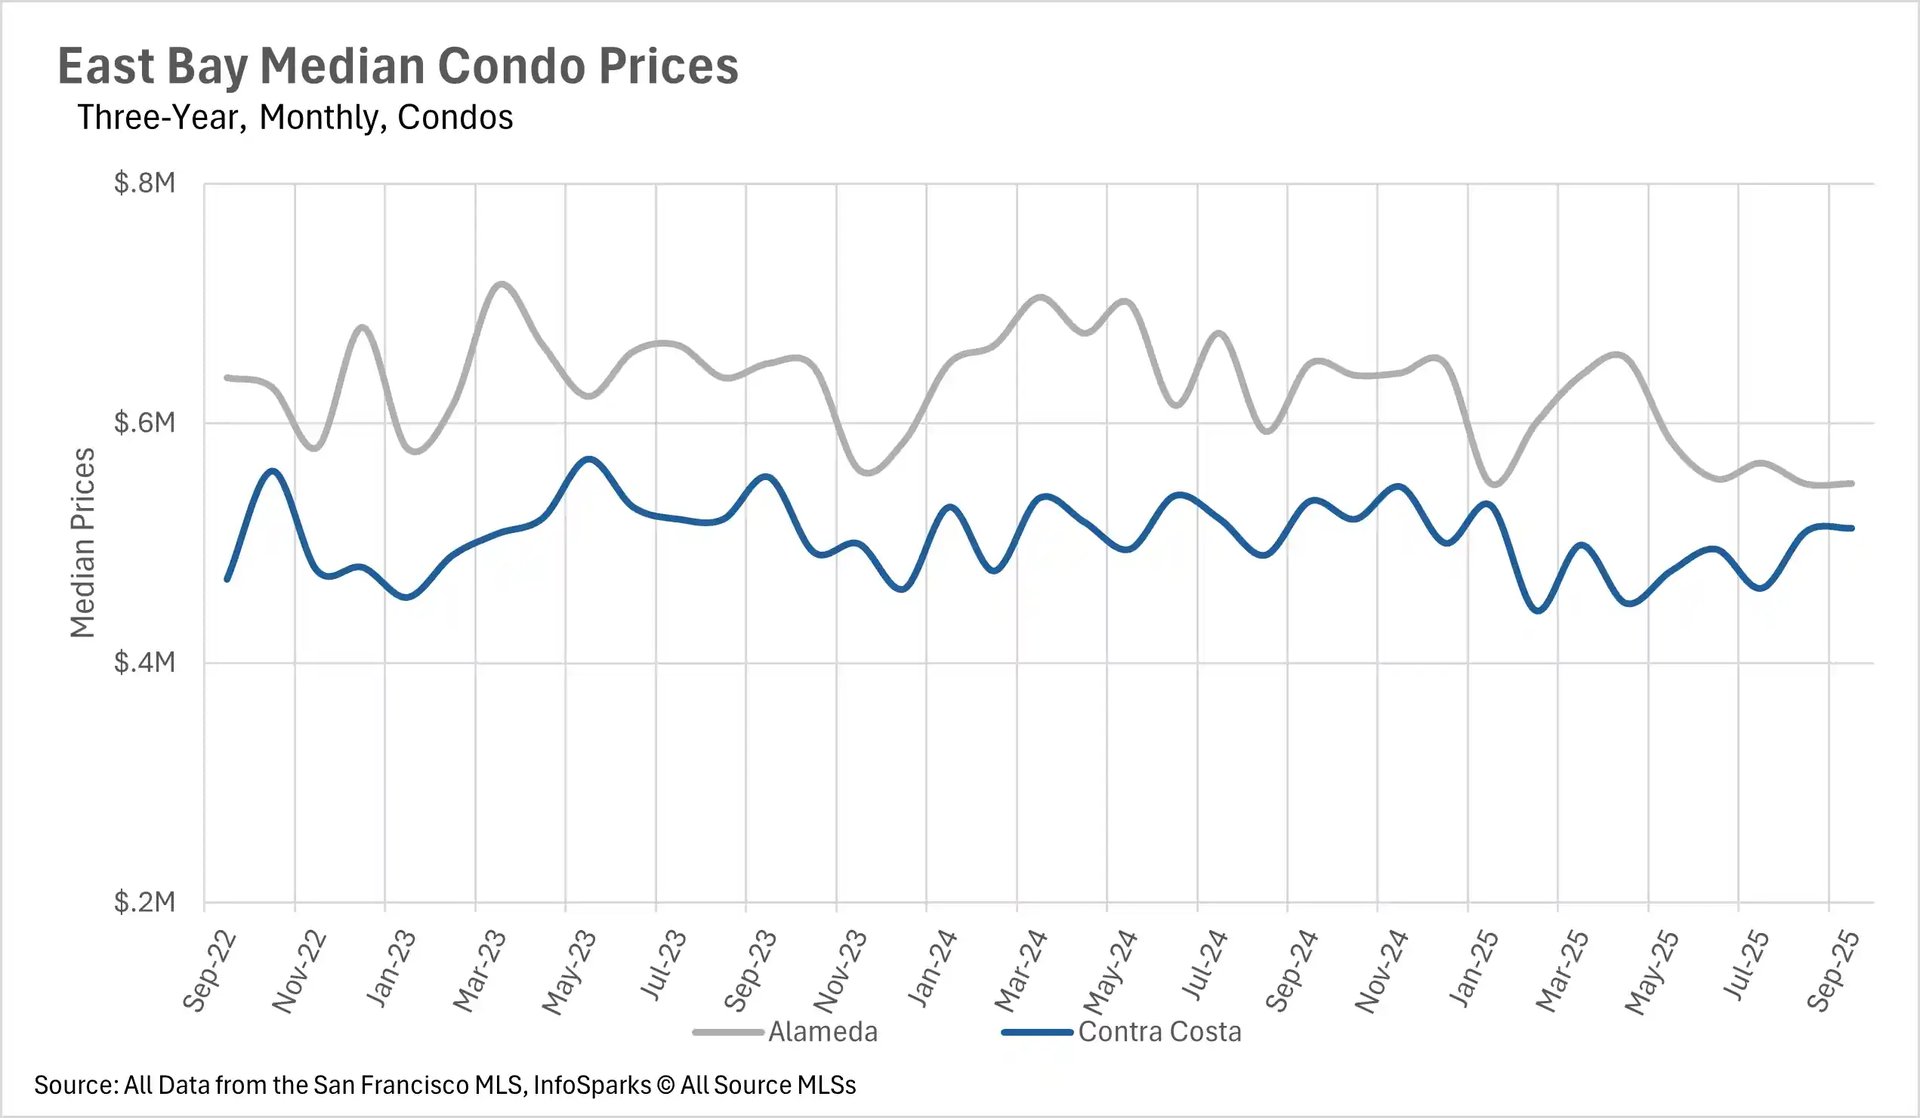
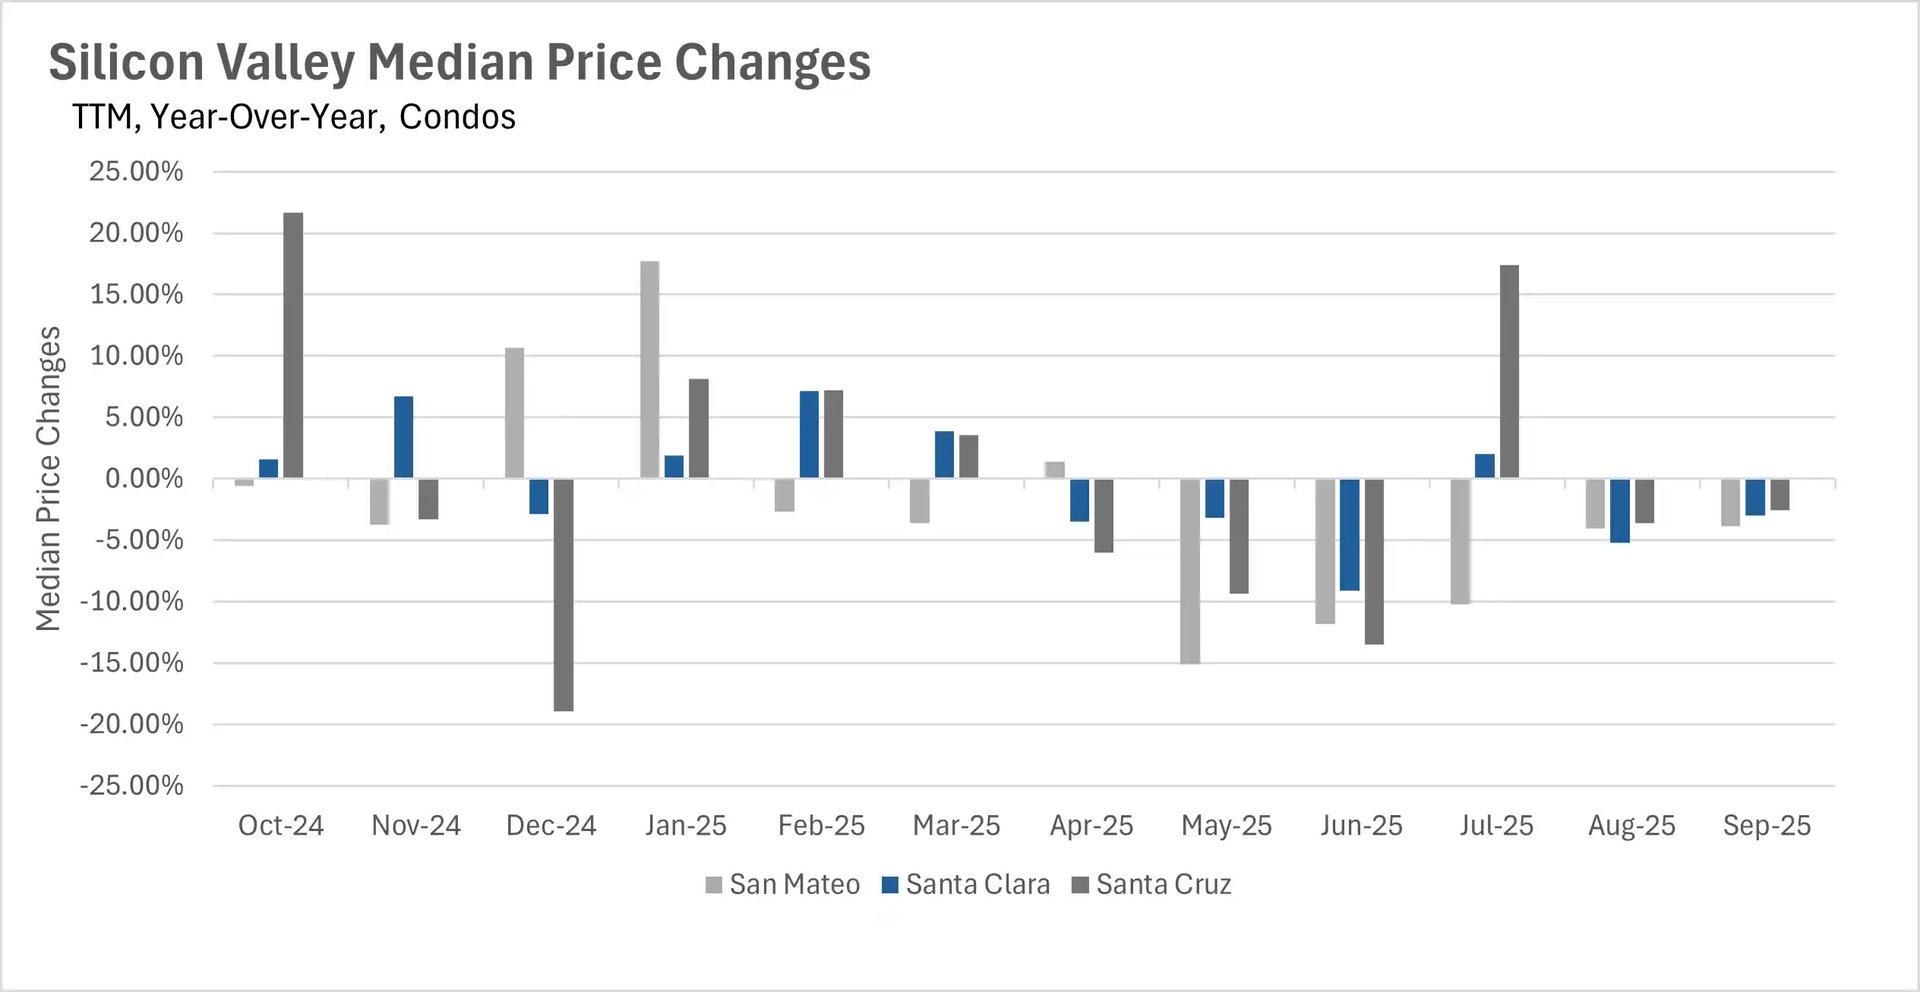
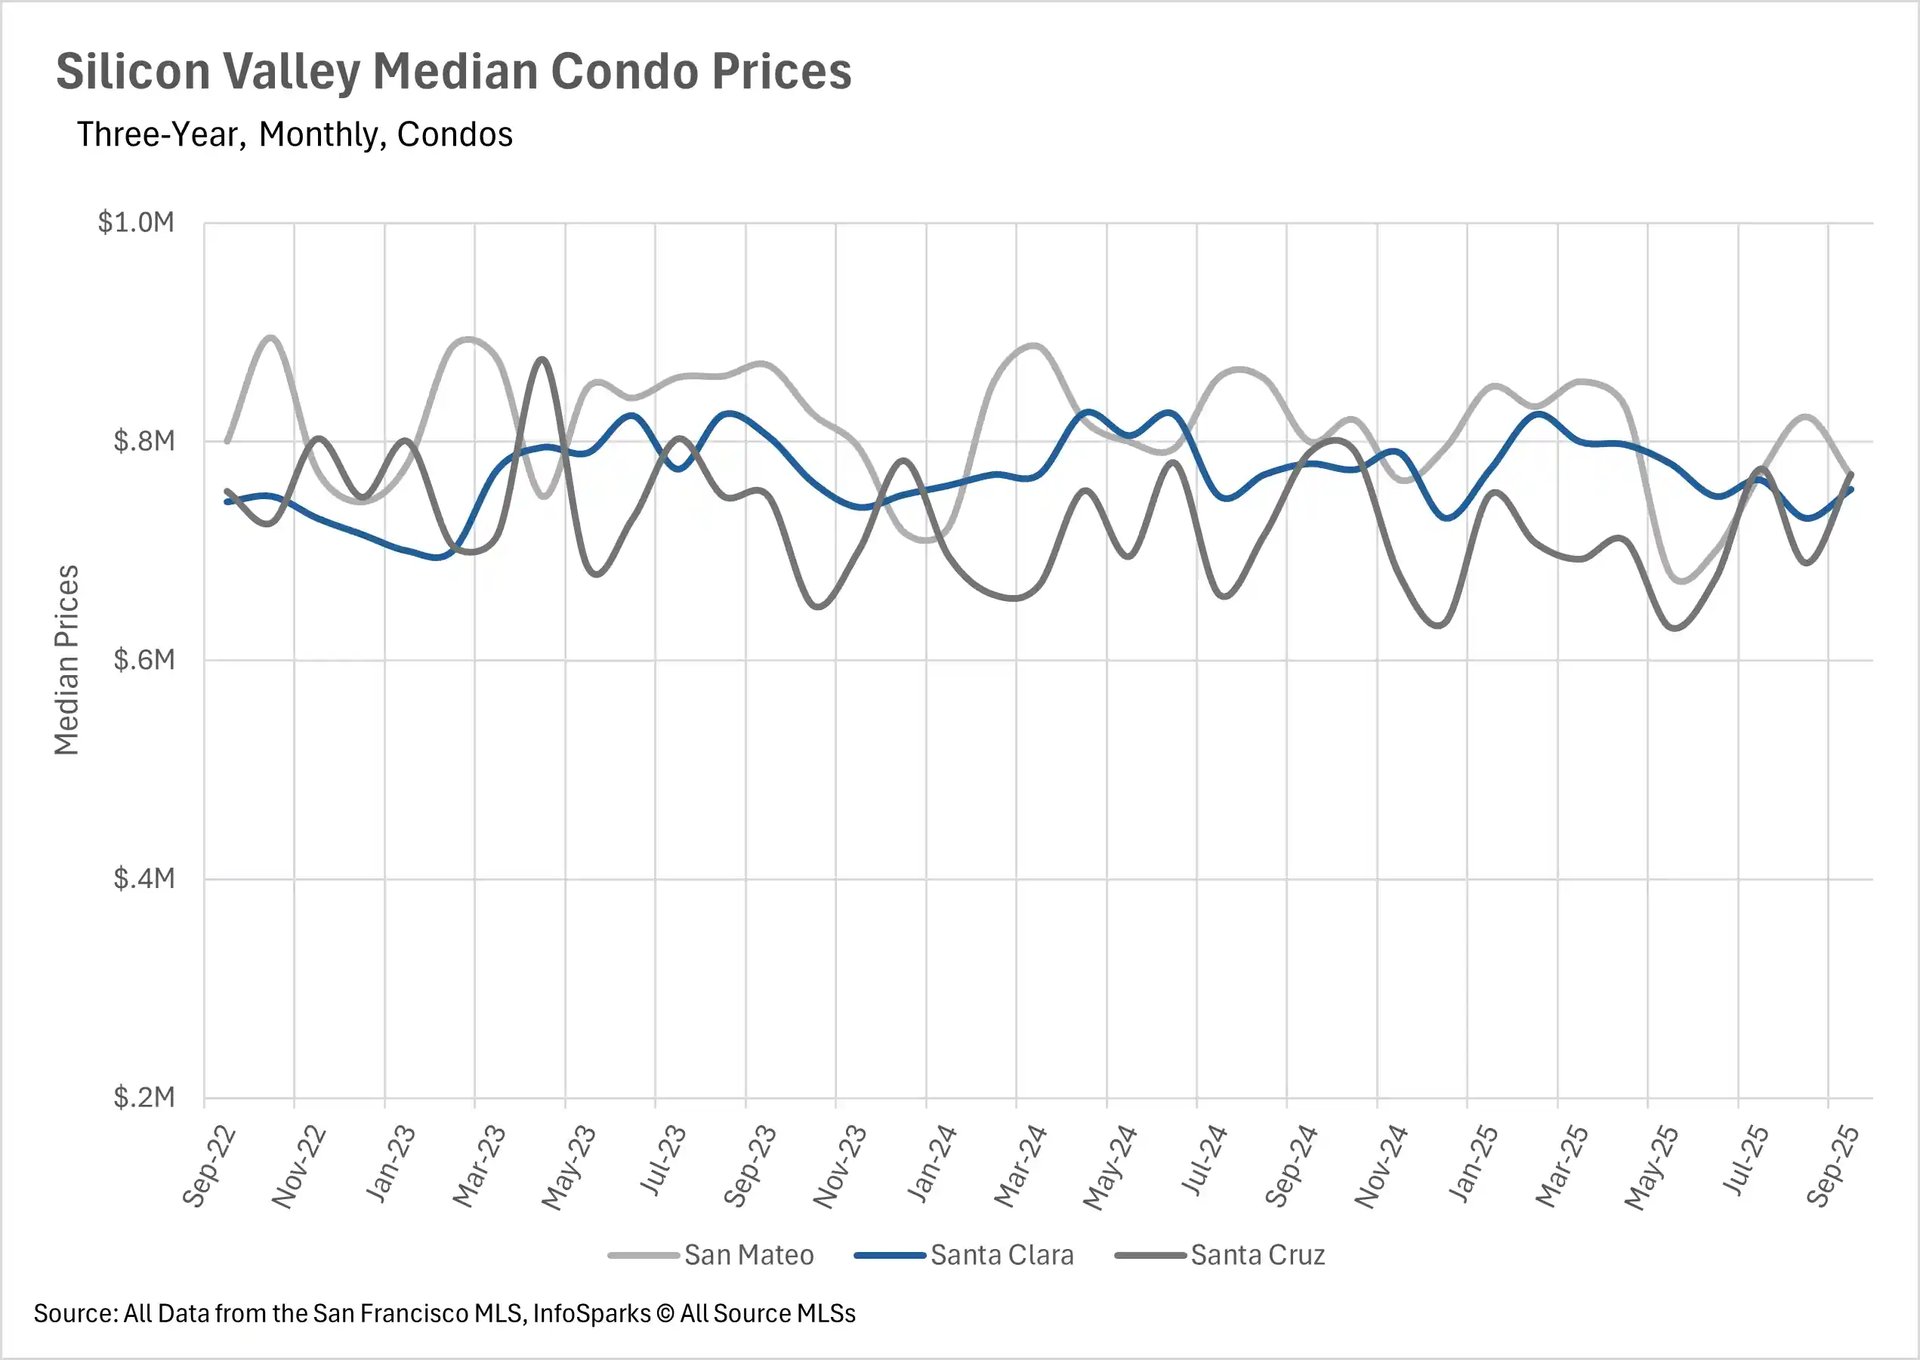
The condo market continued its downward trend for the second consecutive month with declines of 3.88% in San Mateo, 3.01% in Santa Clara, and 2.53% in Santa Cruz. The East Bay returned to year-over-year declines after August's brief respite, with single-family homes down 1.98% in Alameda County and 1.59% in Contra Costa, though prices remain well within their historical bands. Condos in Contra Costa County declined 4.21% year-over-year. The North Bay showed the most uniform pattern with near-stagnant pricing across the board - Sonoma, Marin, and Solano Counties all posted small declines of 3.47%, 1.43%, and 0.81% respectively, while Napa County managed a tiny 0.17% premium to last year's prices.
Inventory normalization accelerates with dramatic year-over-year declines
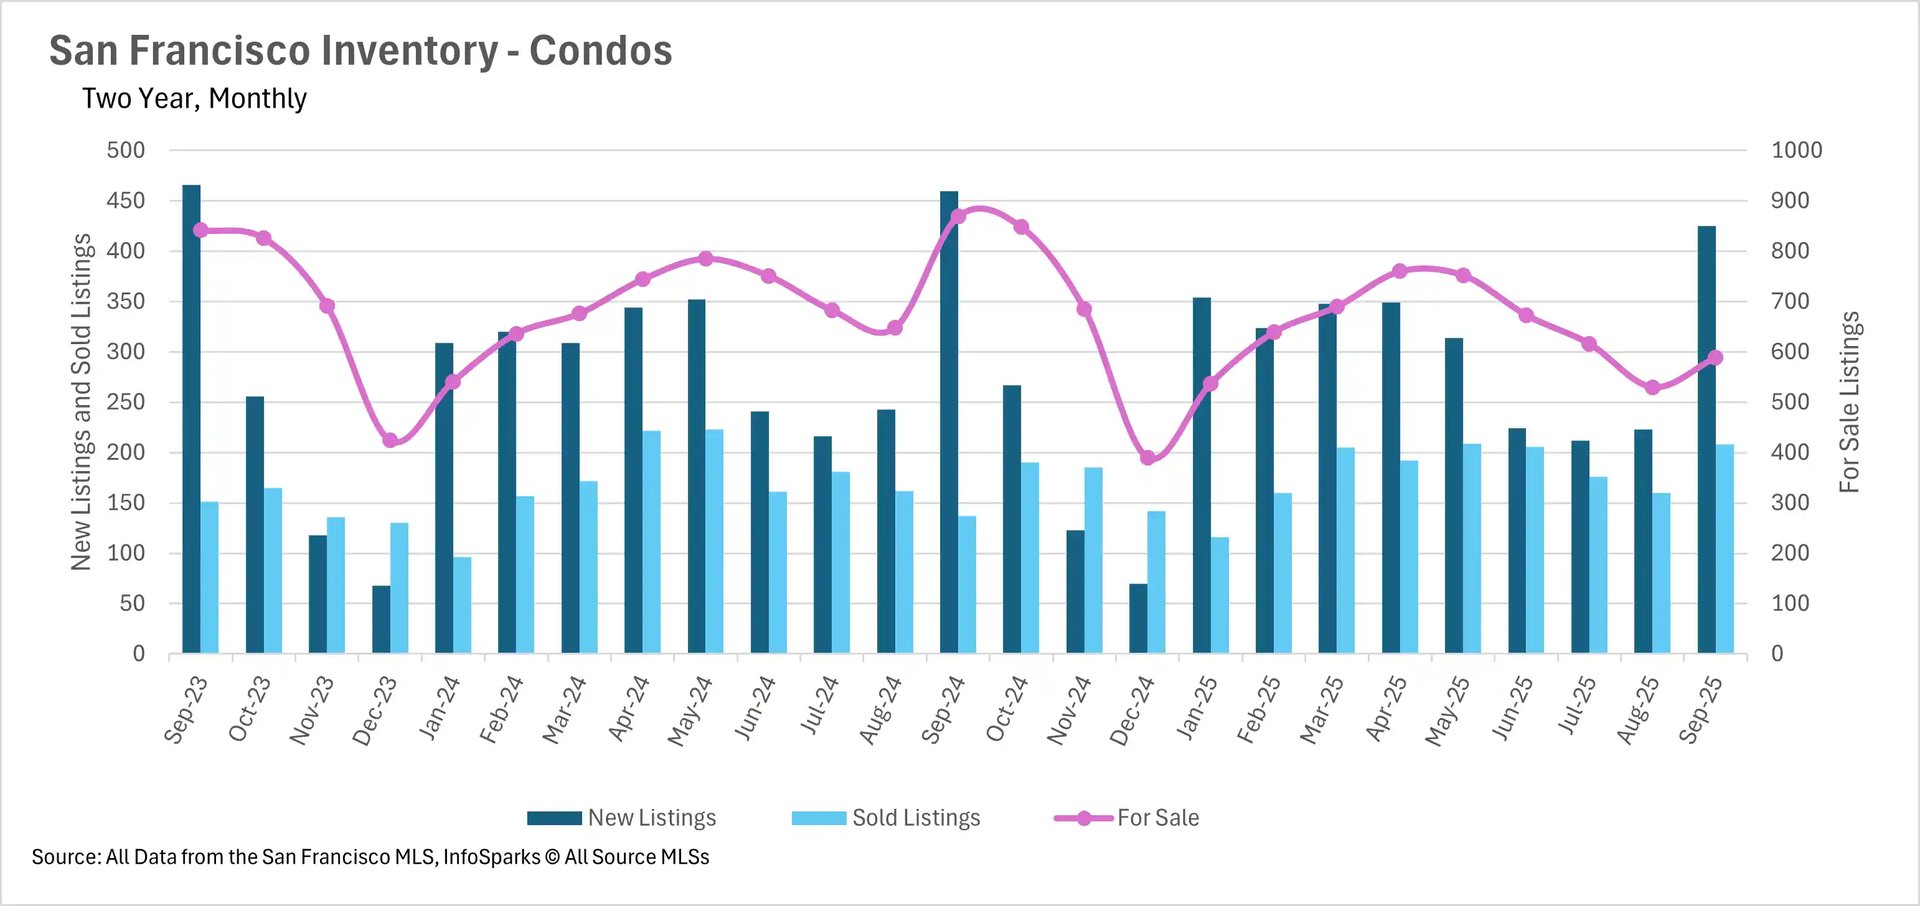
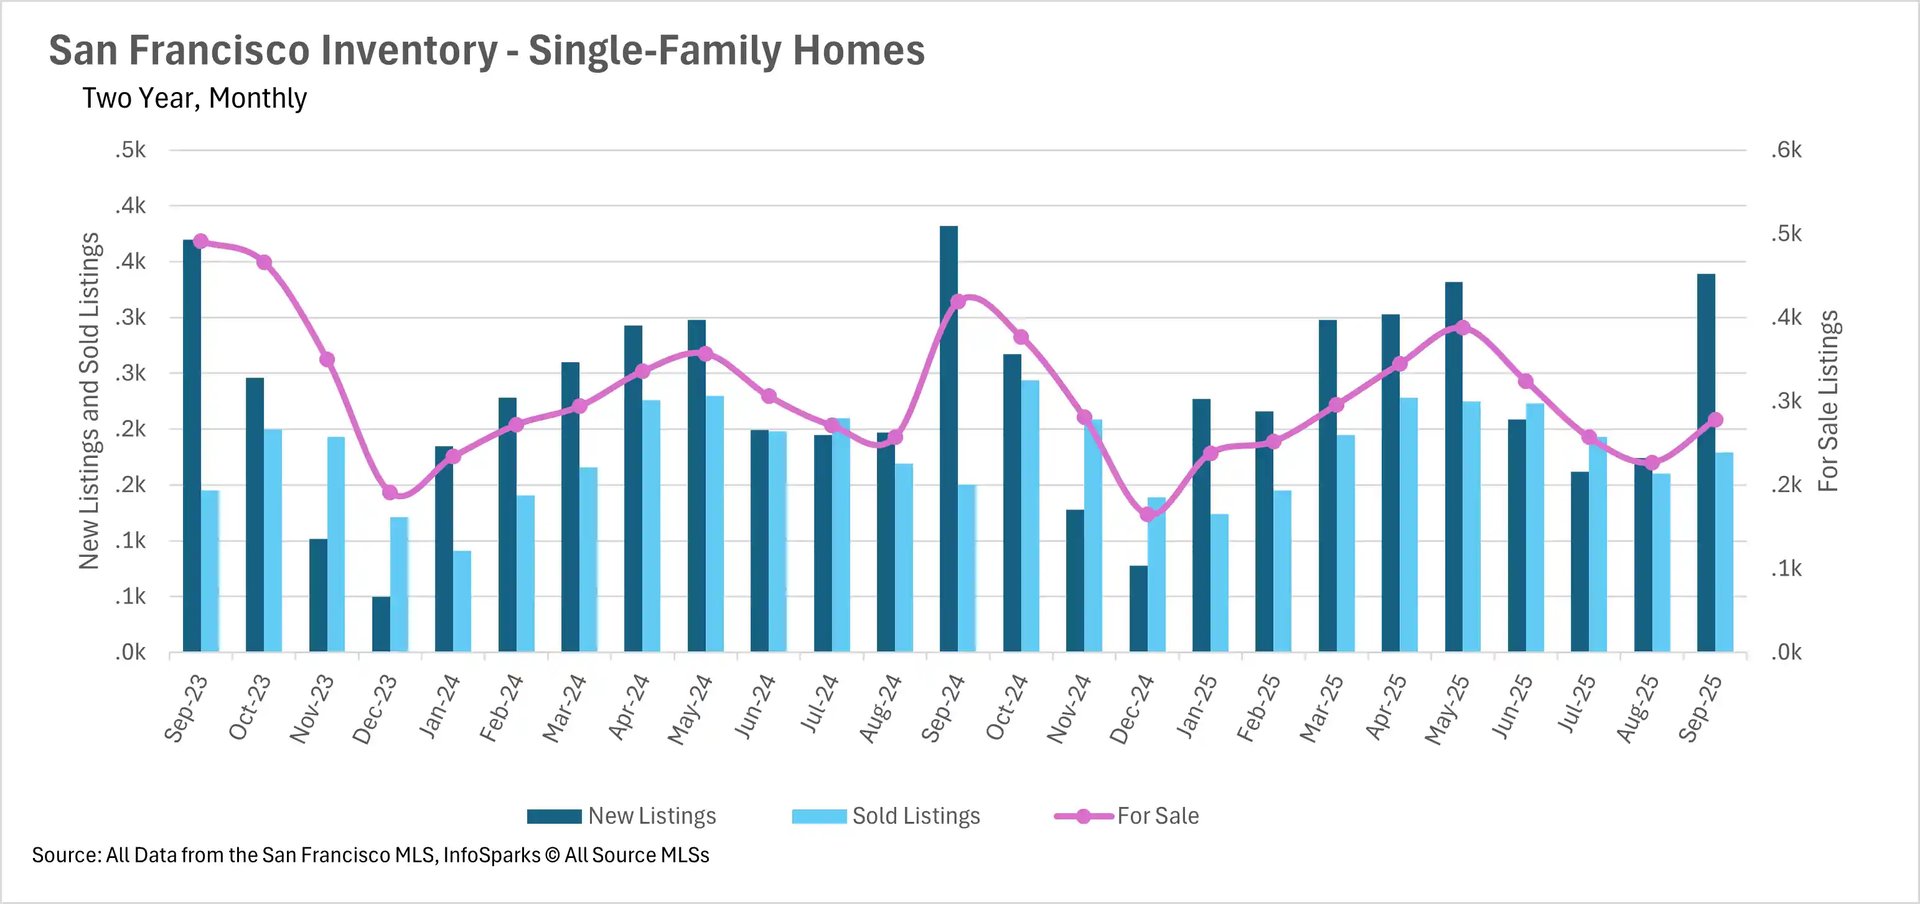
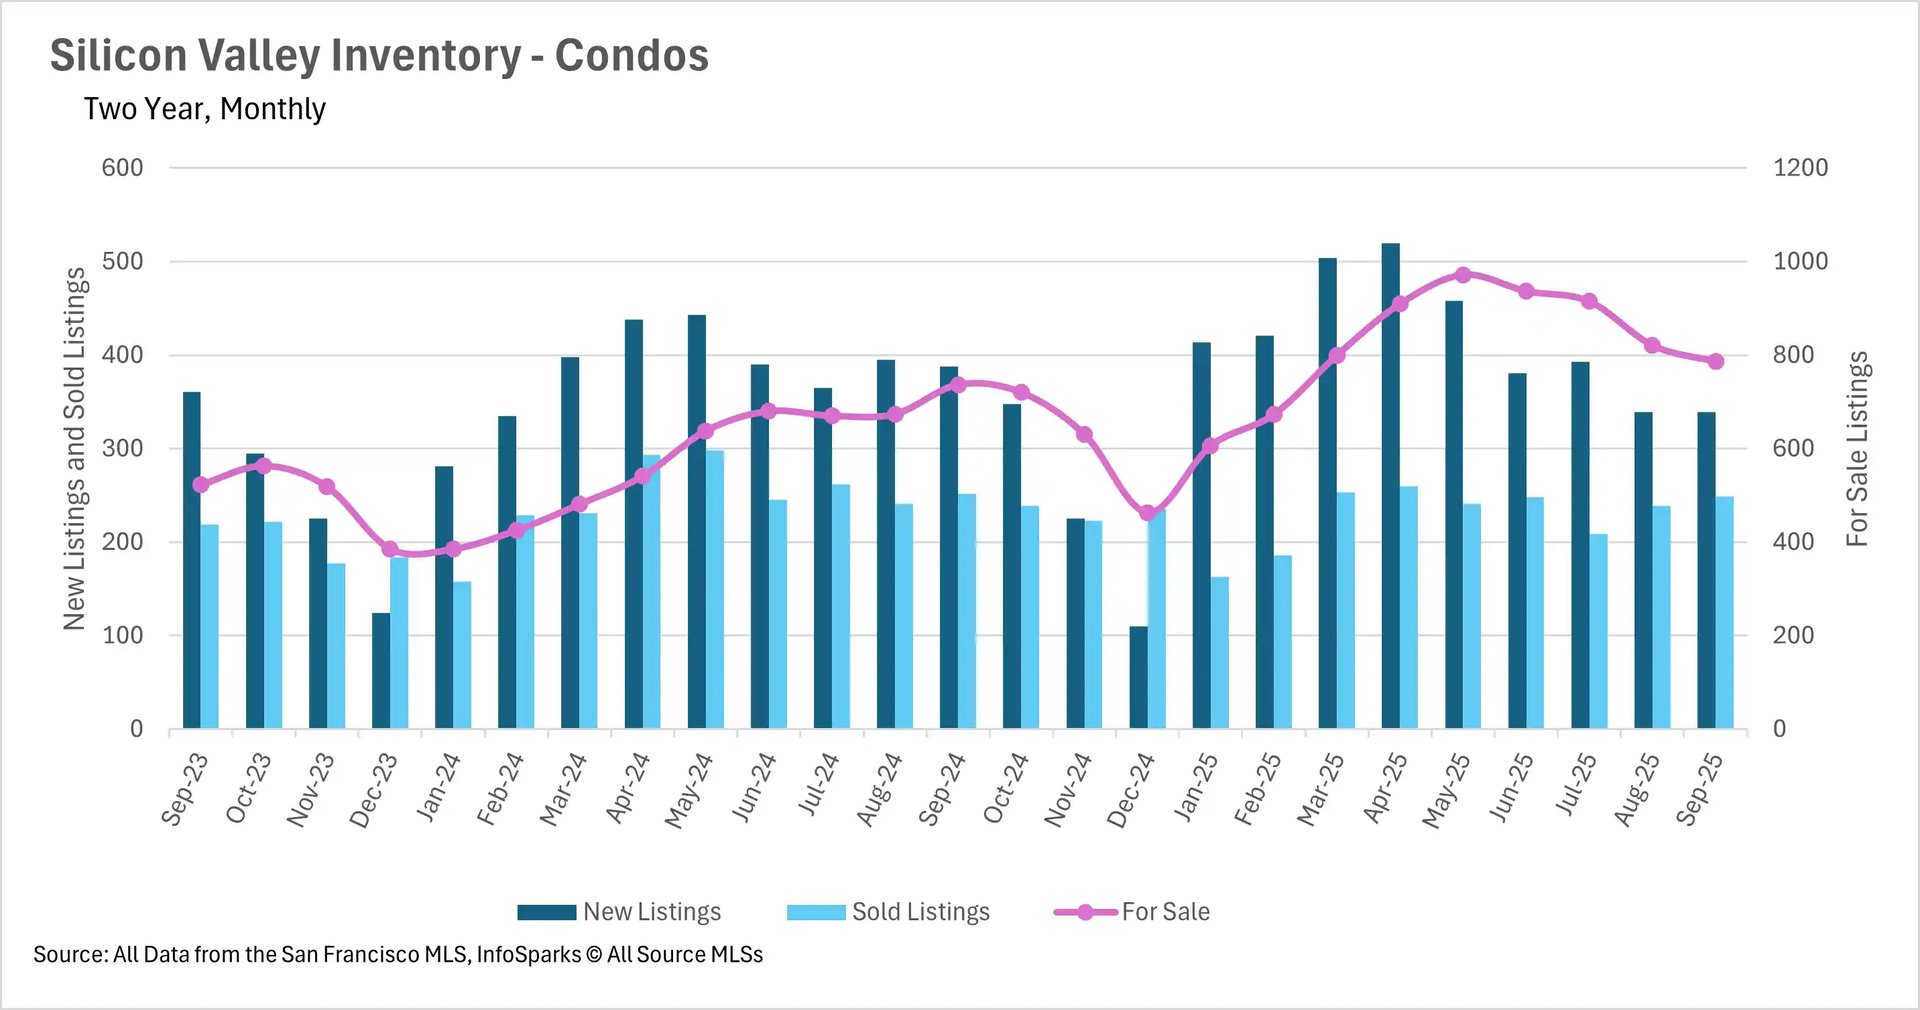
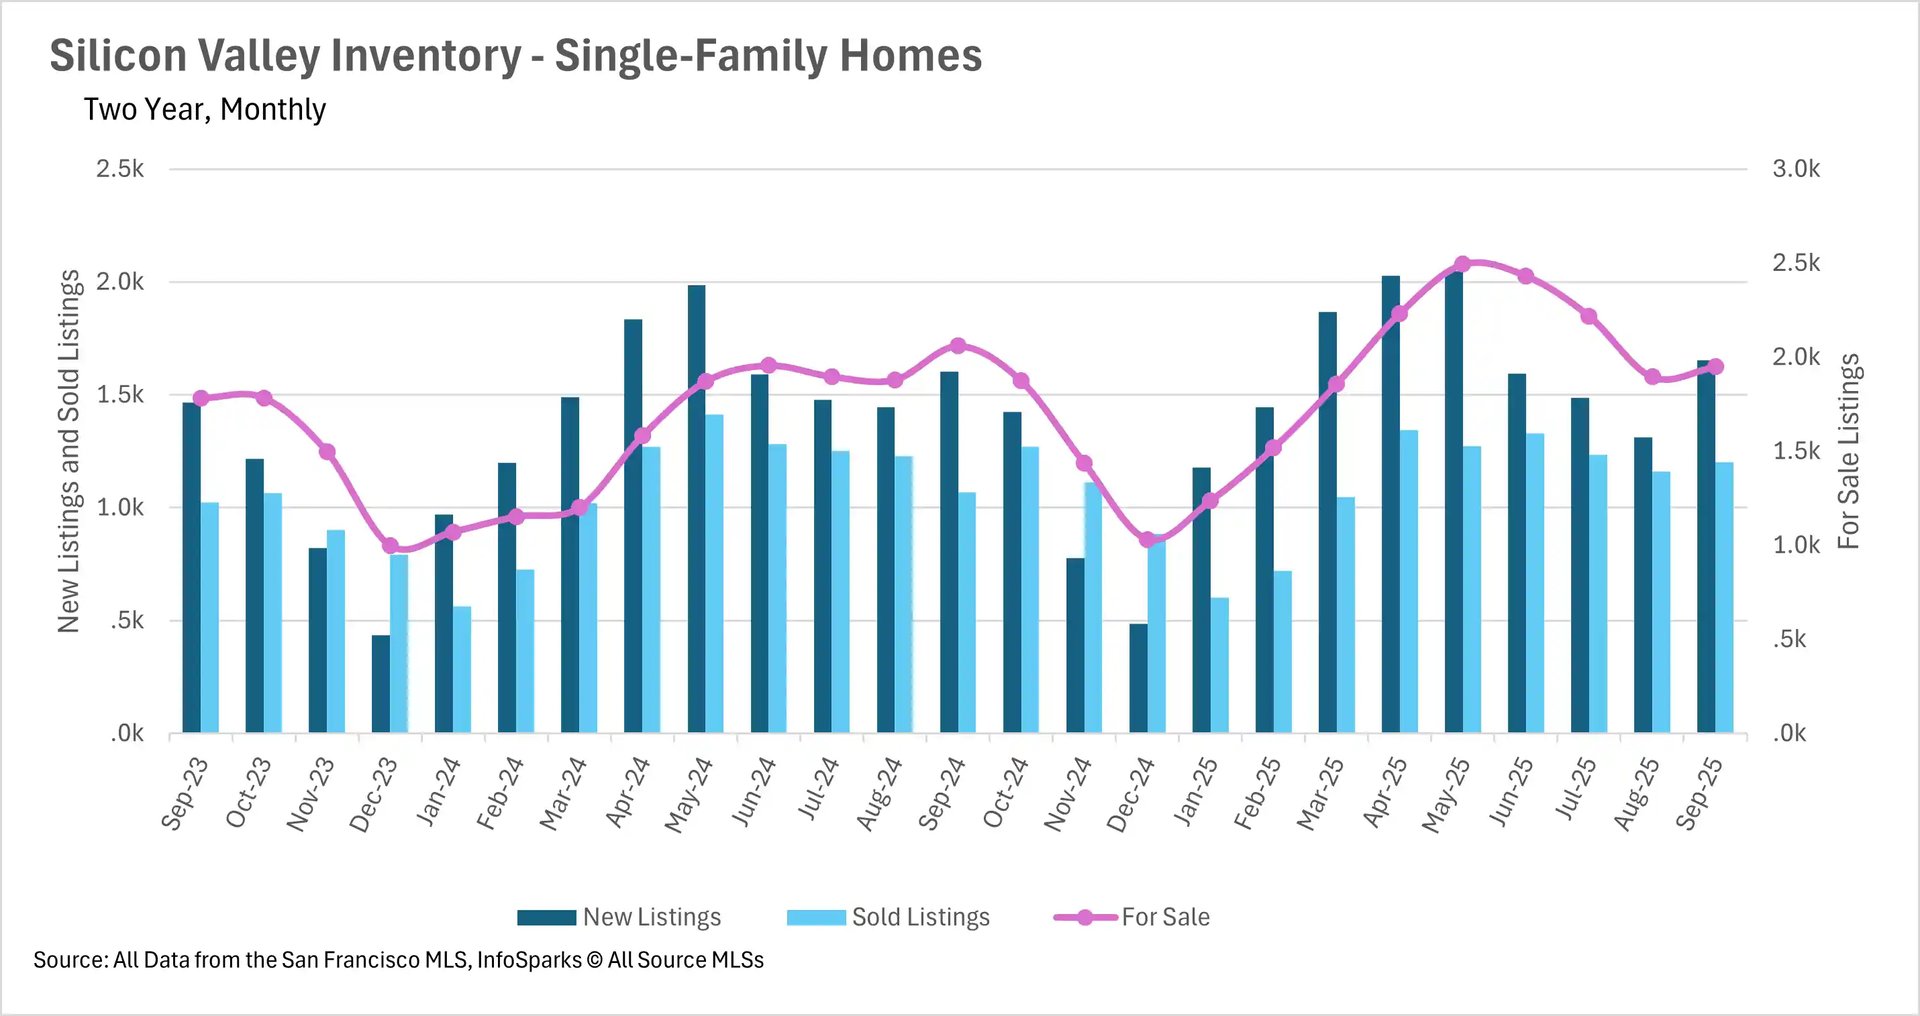
September marked a watershed moment for Bay Area inventory levels, with most regions recording their first year-over-year declines in months. San Francisco led with the most dramatic inventory contraction, as single-family home listings plummeted 33.65% and condo inventory fell 32.22% year-over-year. This was driven by a combination of 11.26% fewer new single-family listings, 7.61% fewer new condo listings, and surging sales with 19.33% more single-family homes and an extraordinary 51.82% more condos sold. Silicon Valley's single-family market achieved a remarkable reversal, recording 5.34% fewer active listings than last year, largely due to 12.56% more homes sold. However, the condo market remained slightly elevated at 6.65% above last year's levels.
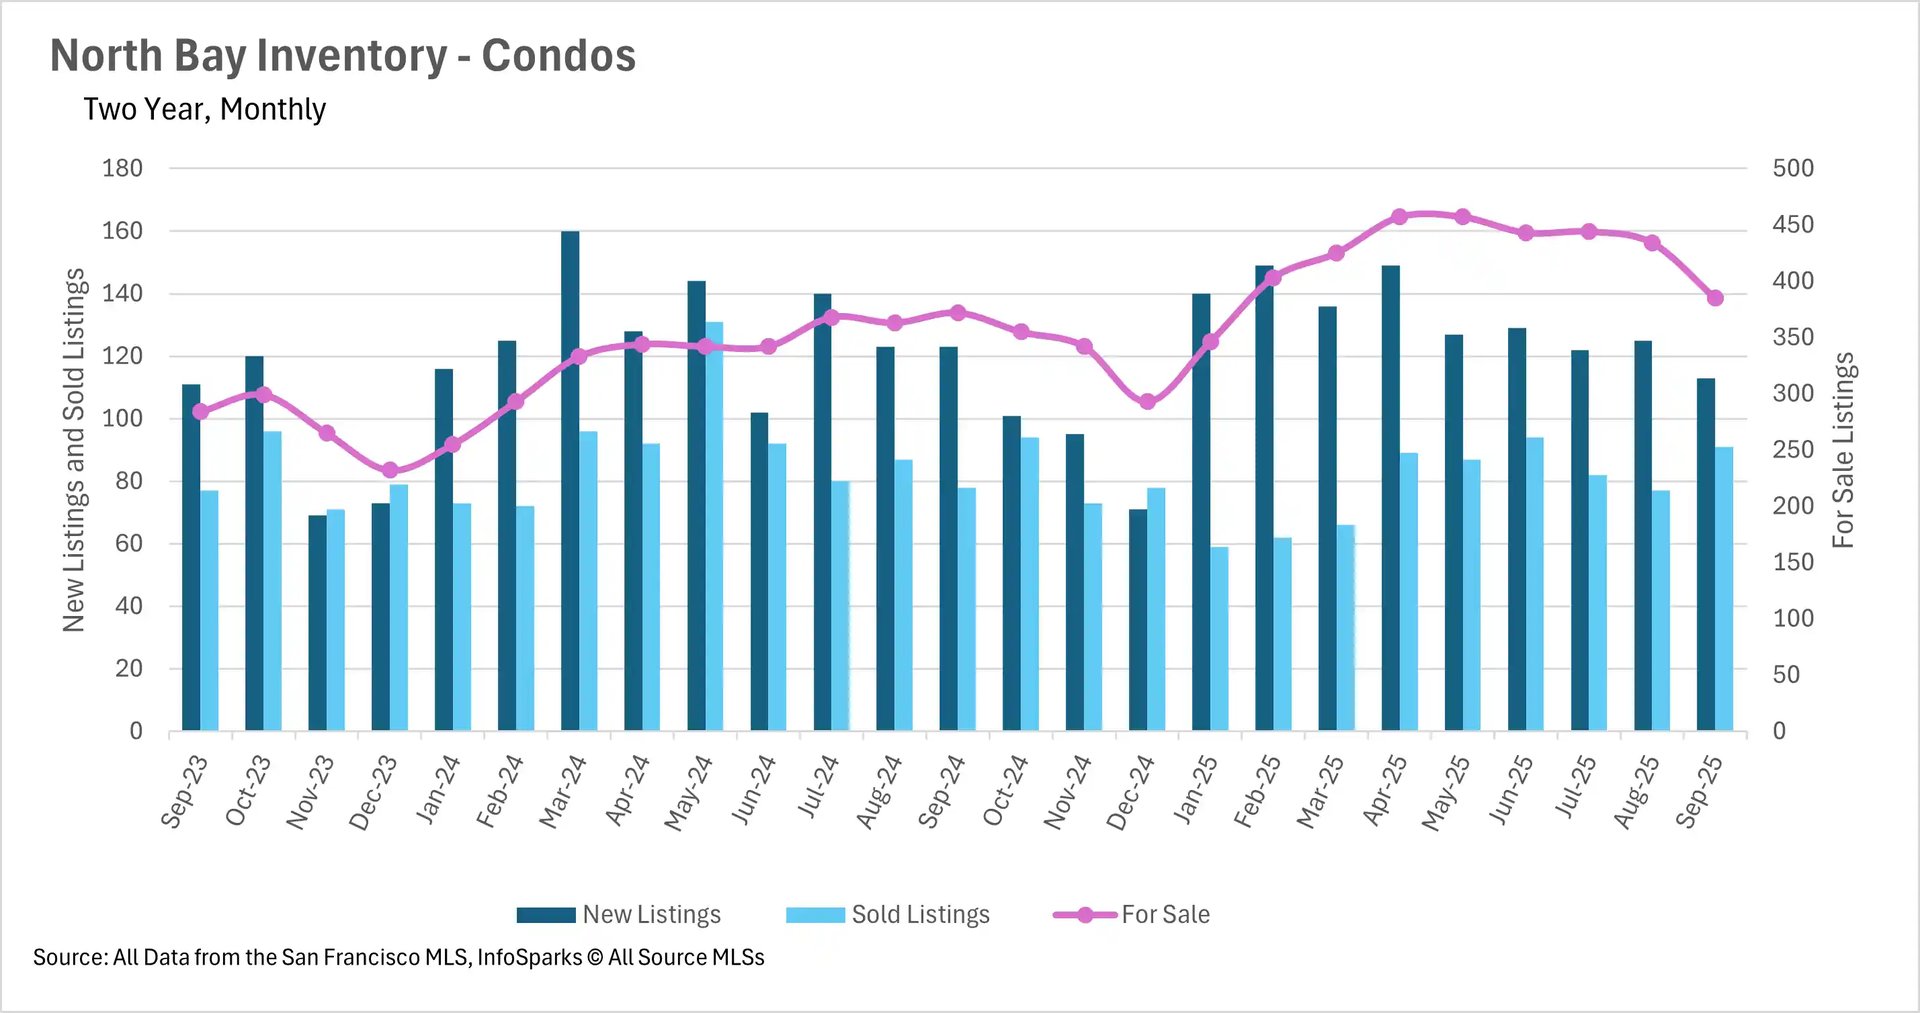
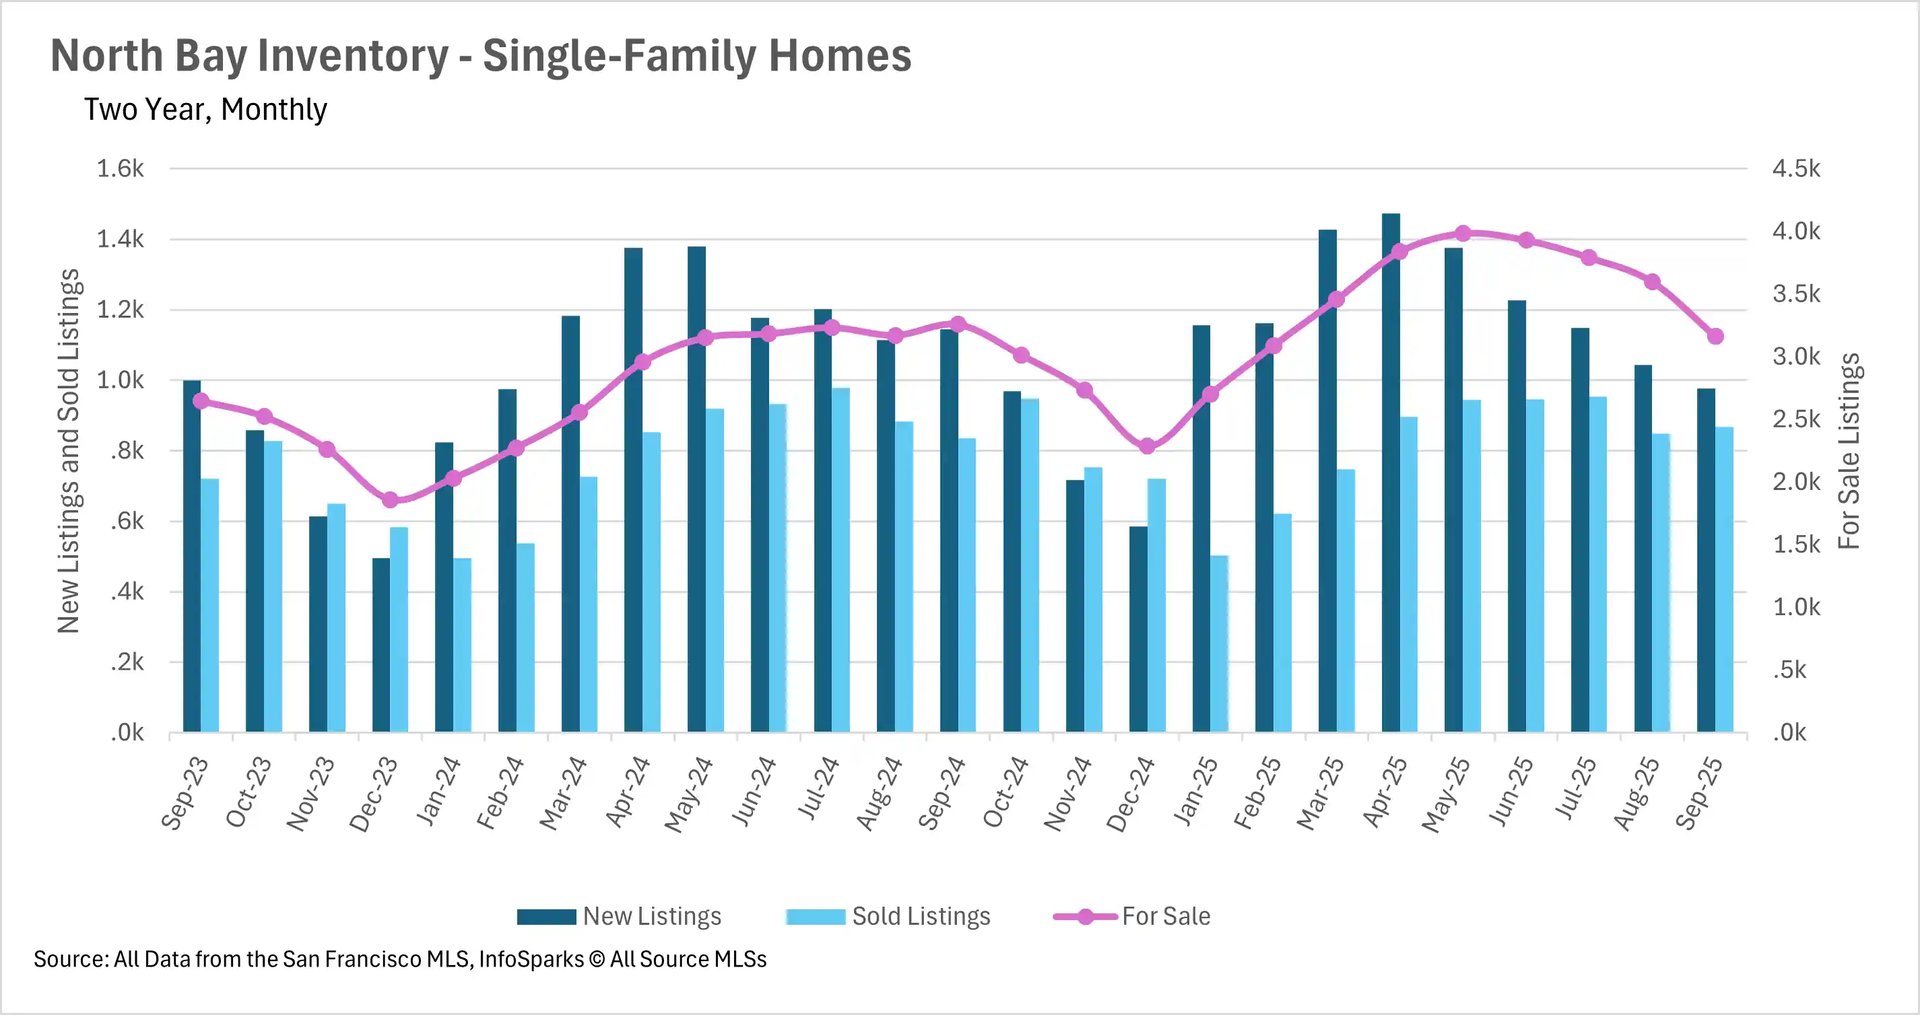
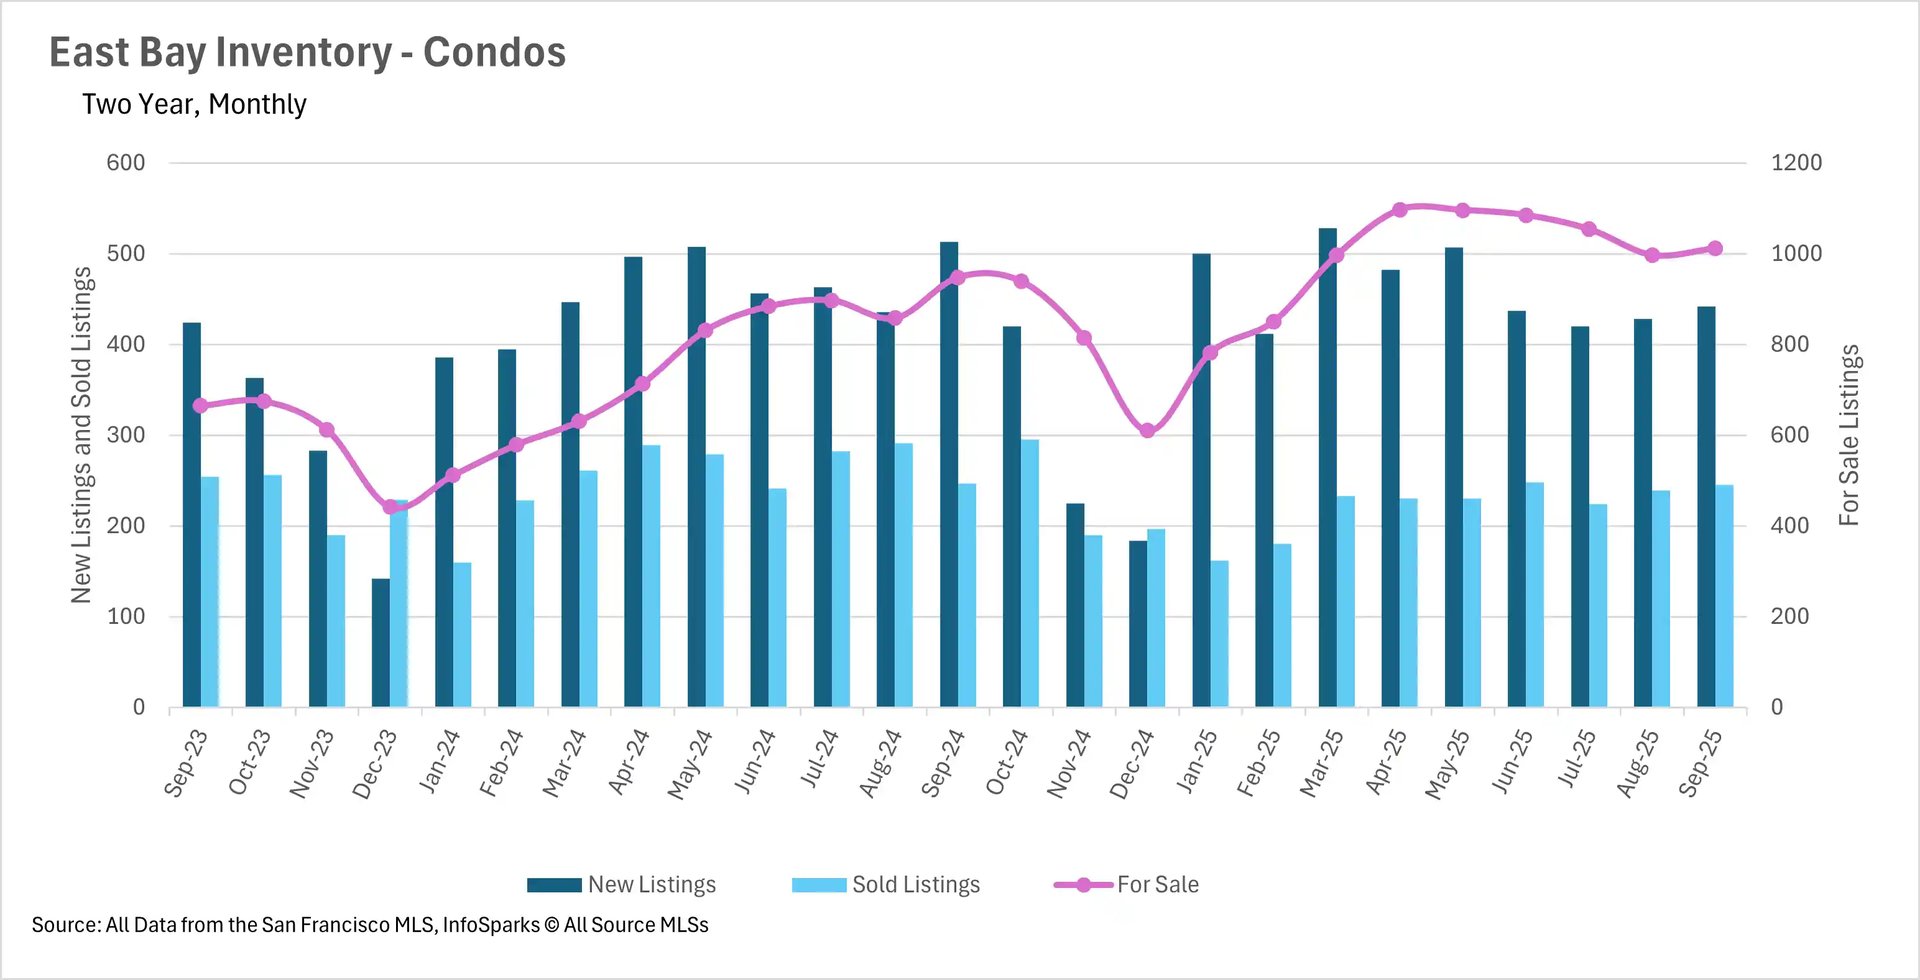
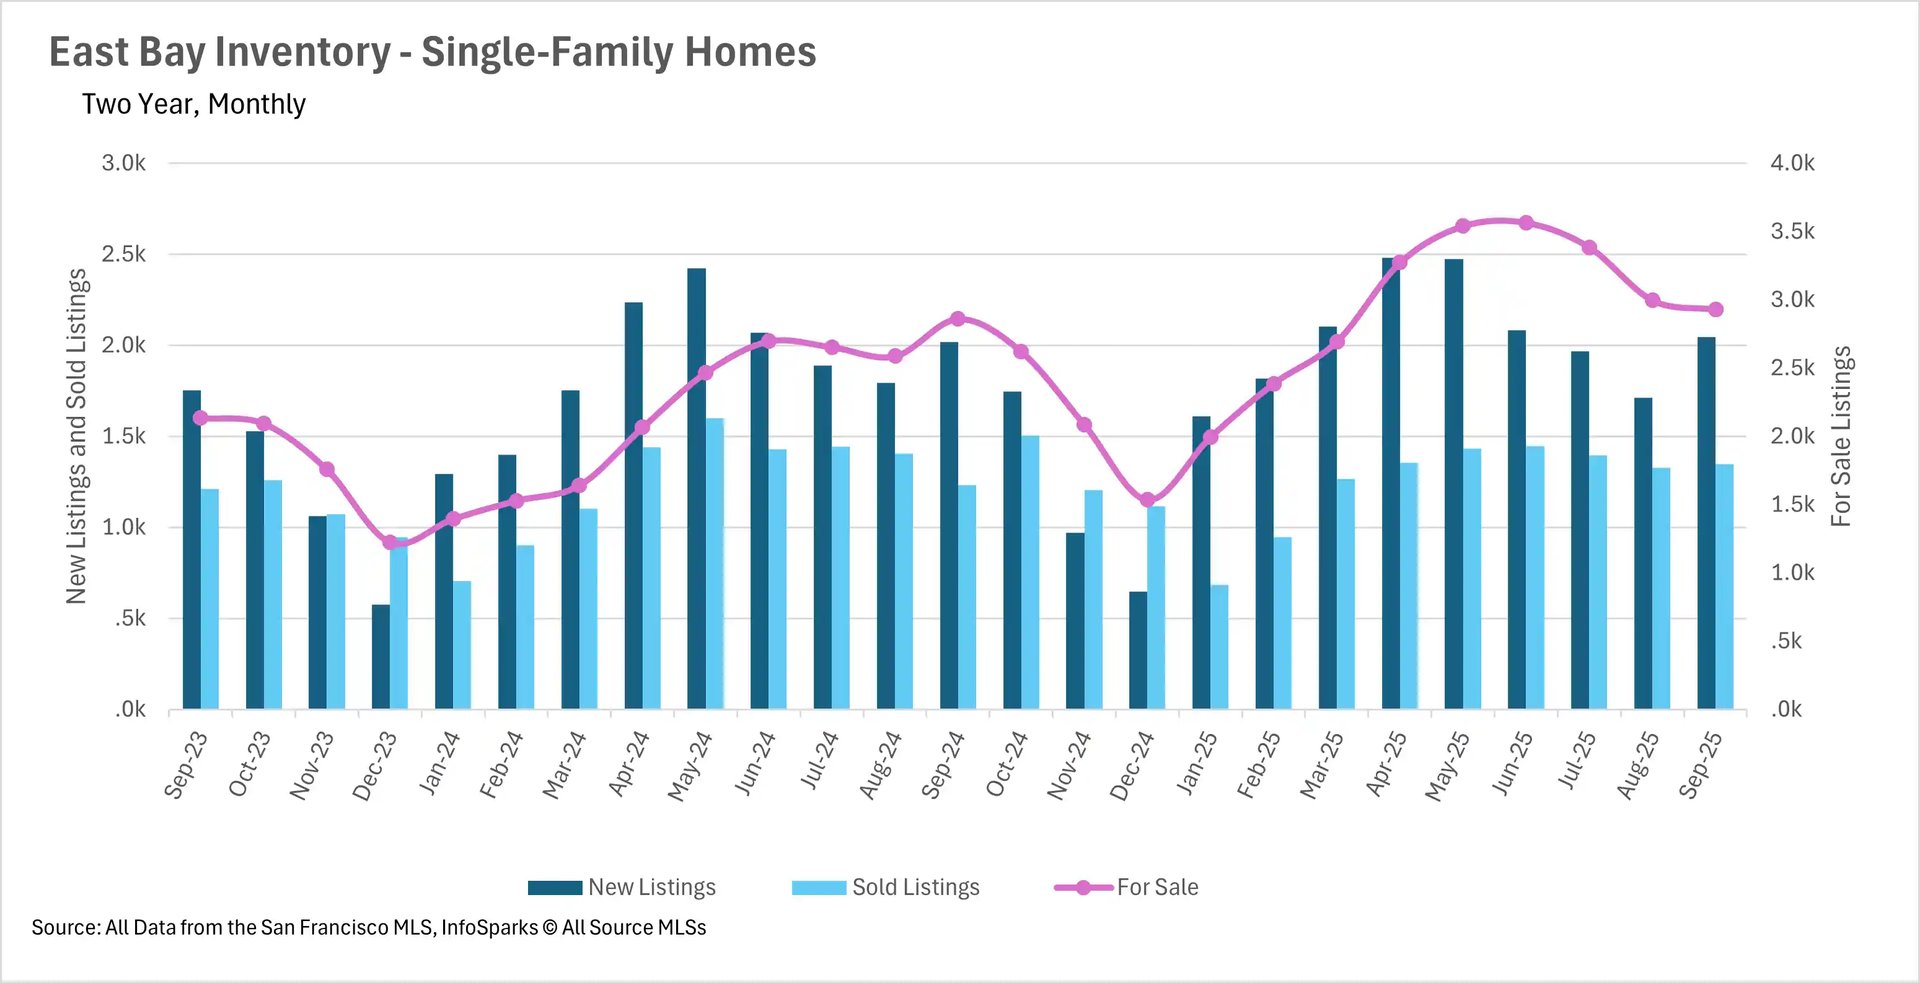
The North Bay experienced its first year-over-year inventory decline in several months, with single-family listings down 2.98%, driven by a sharp 14.75% drop in new listings and a 3.95% increase in sold listings, resulting in a dramatic 12.14% month-over-month inventory decline. Condo inventory remained slightly elevated at 3.49% above last year. The East Bay showed continued normalization with single-family inventory at just 2.41% above last year and condos at 6.75% above, both representing substantial improvements from summer peaks. The normalization was aided by nearly 10% more single-family homes sold in September compared to last year.
Market velocity accelerates despite percentage increases in days on market
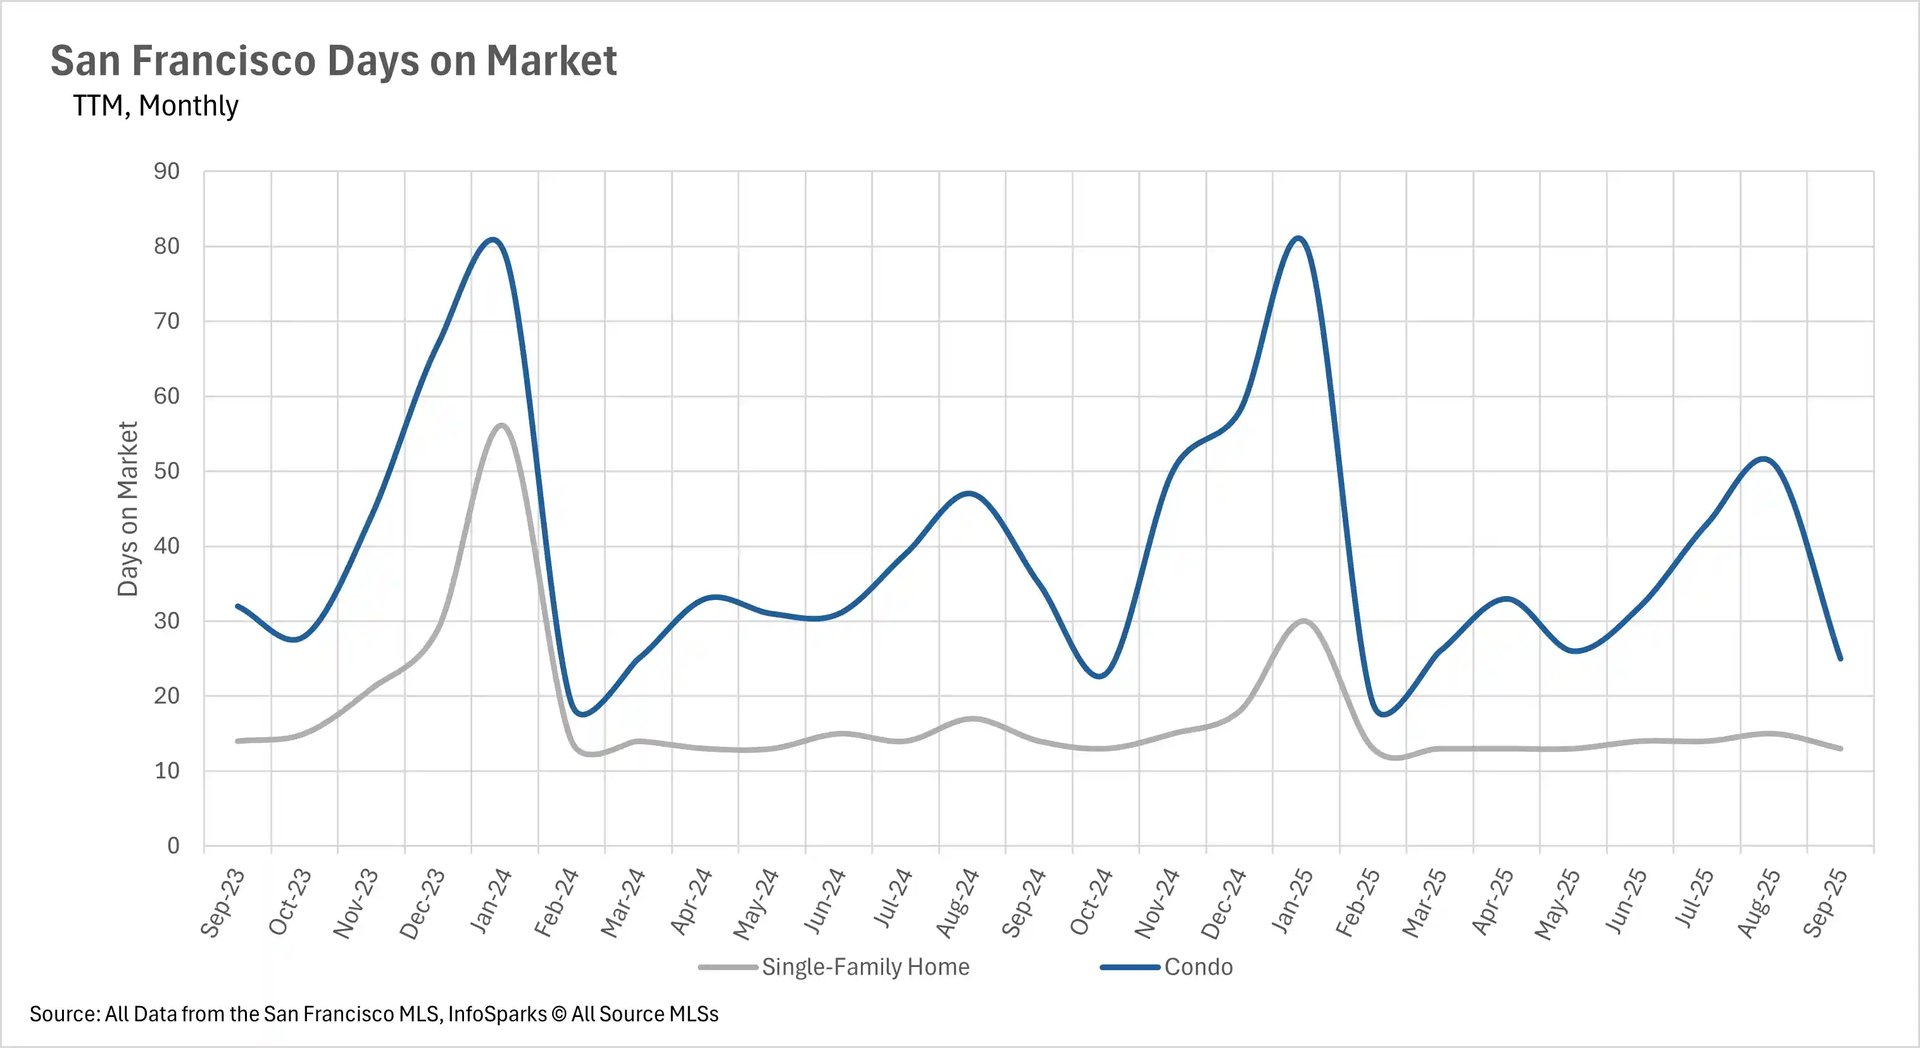
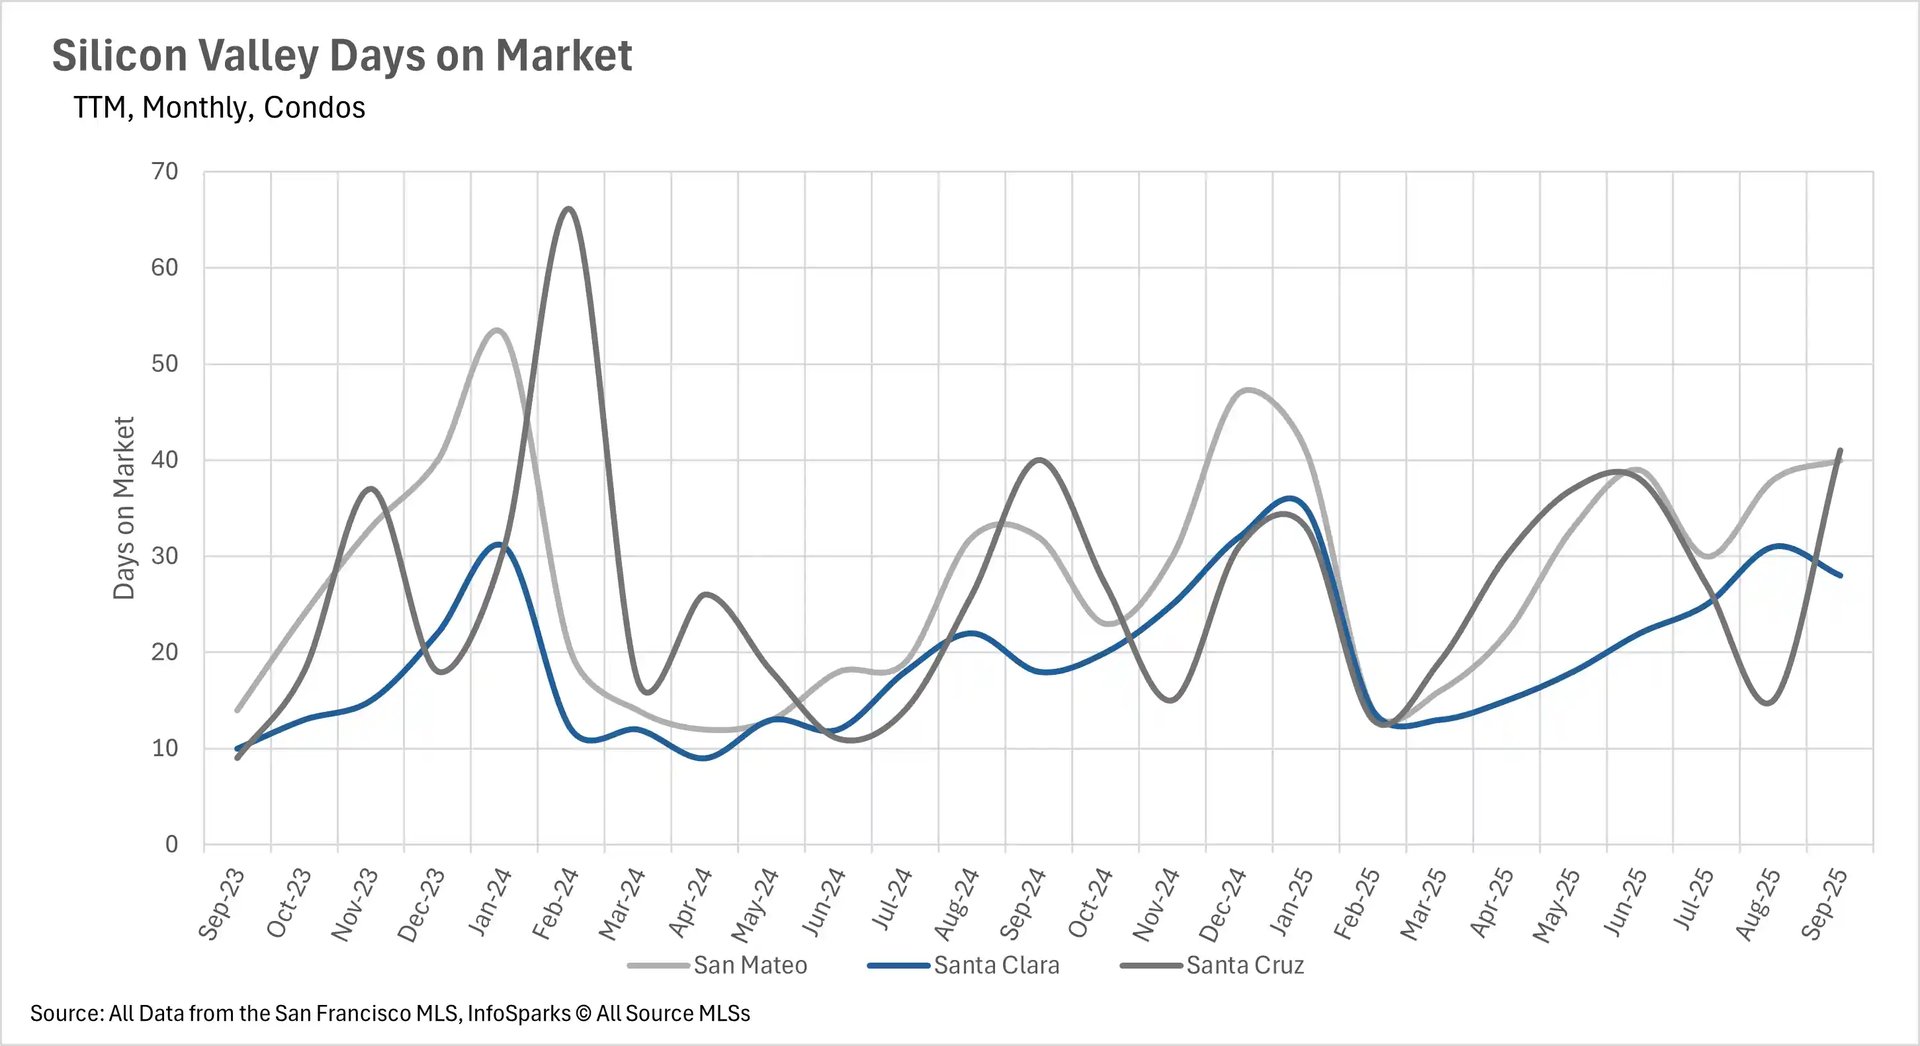
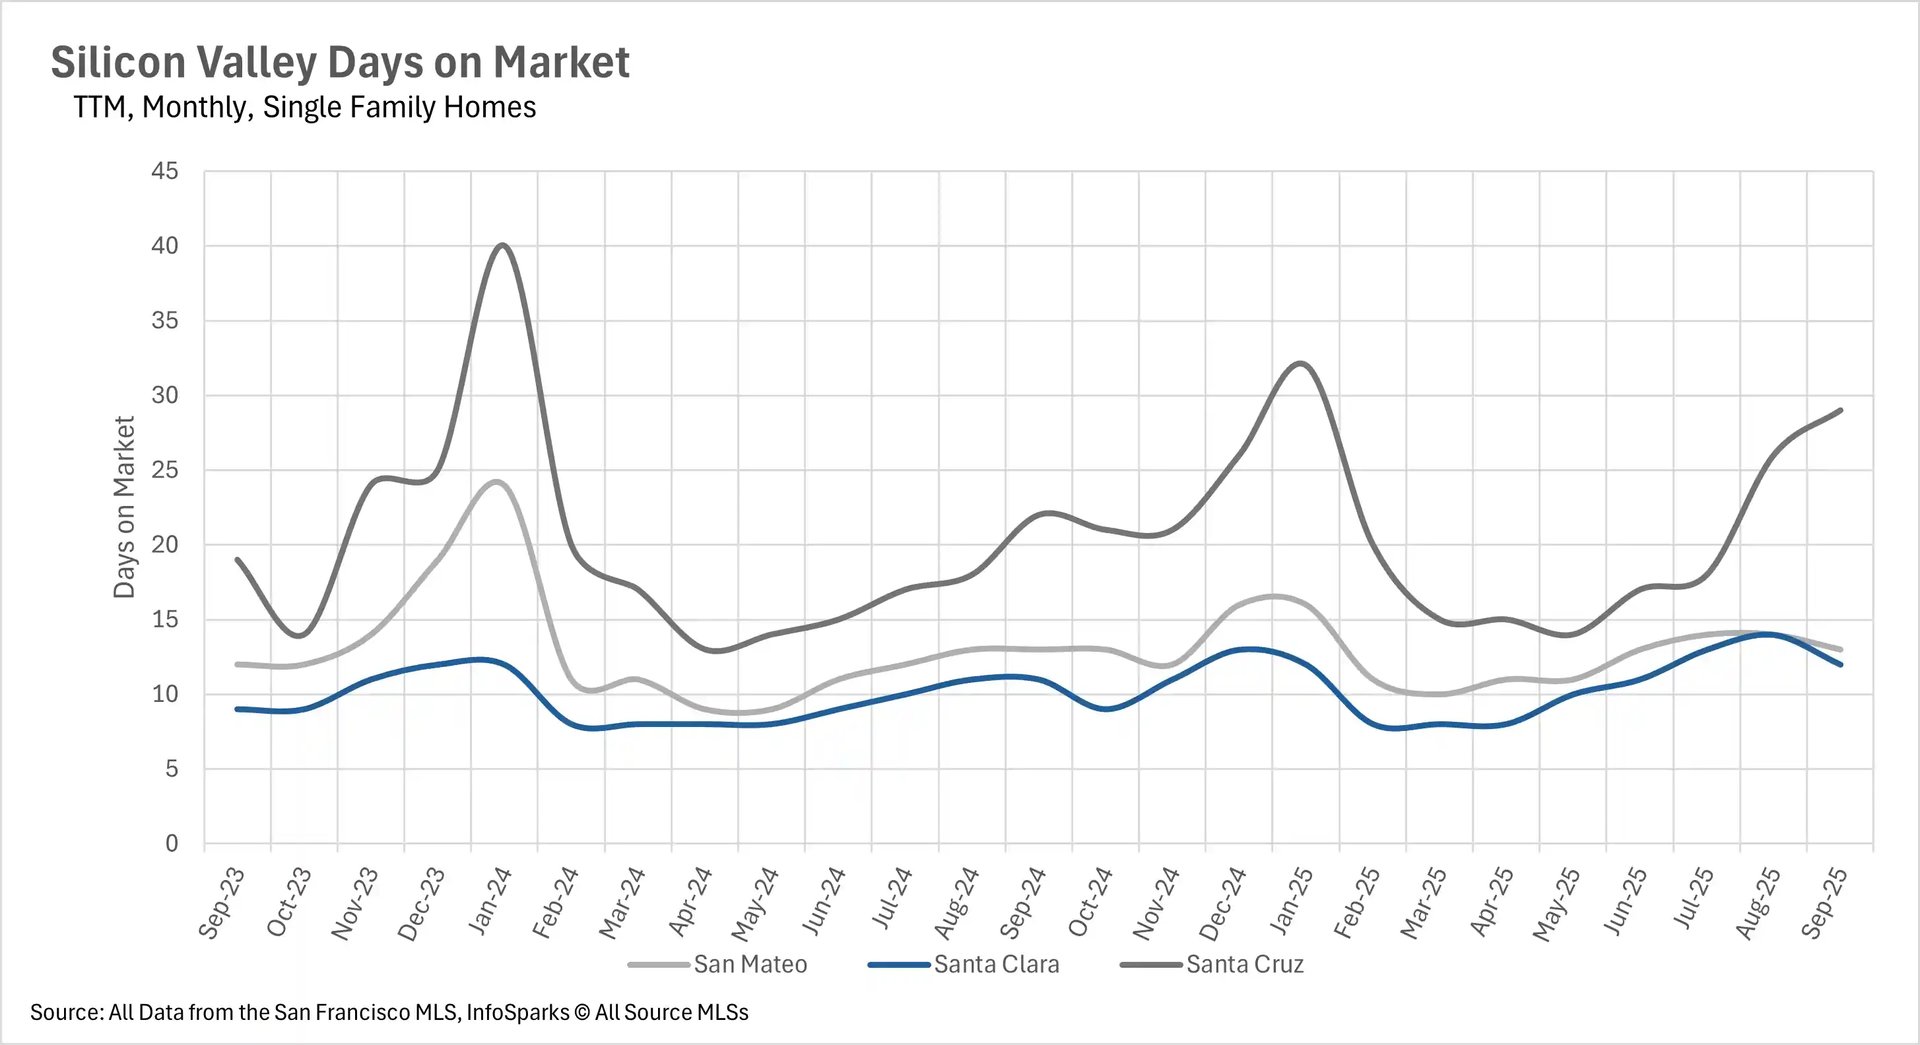
September revealed an interesting paradox across the Bay Area: while percentage increases in days on market appear significant, absolute numbers remain remarkably low, indicating strong underlying demand. San Francisco demonstrated accelerating velocity with single-family homes spending just 13 days on market (down 7.14% year-over-year) and condos dropping to 25 days (down 28.57% year-over-year and 50.98% month-over-month). Silicon Valley maintained breakneck pace for single-family homes, with San Mateo and Santa Clara County listings scooped up in under two weeks, and Santa Cruz County at just 29 days.
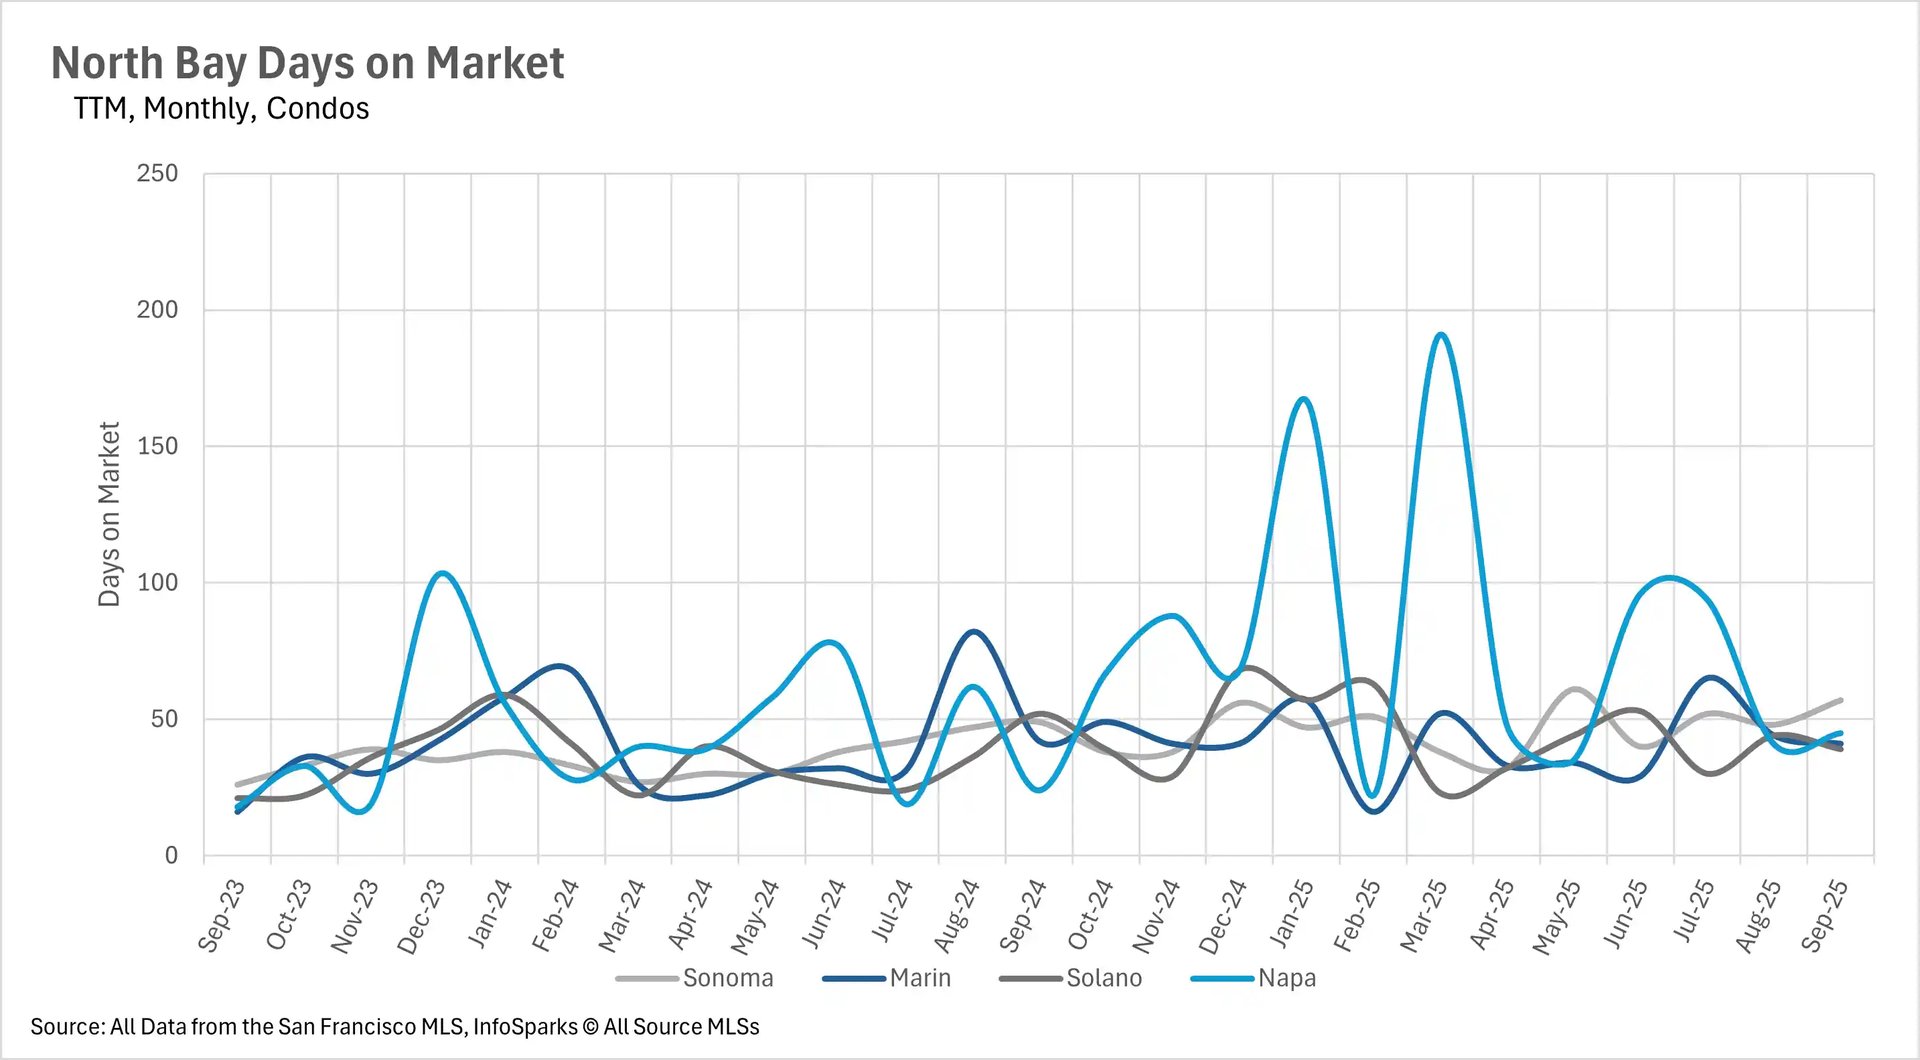
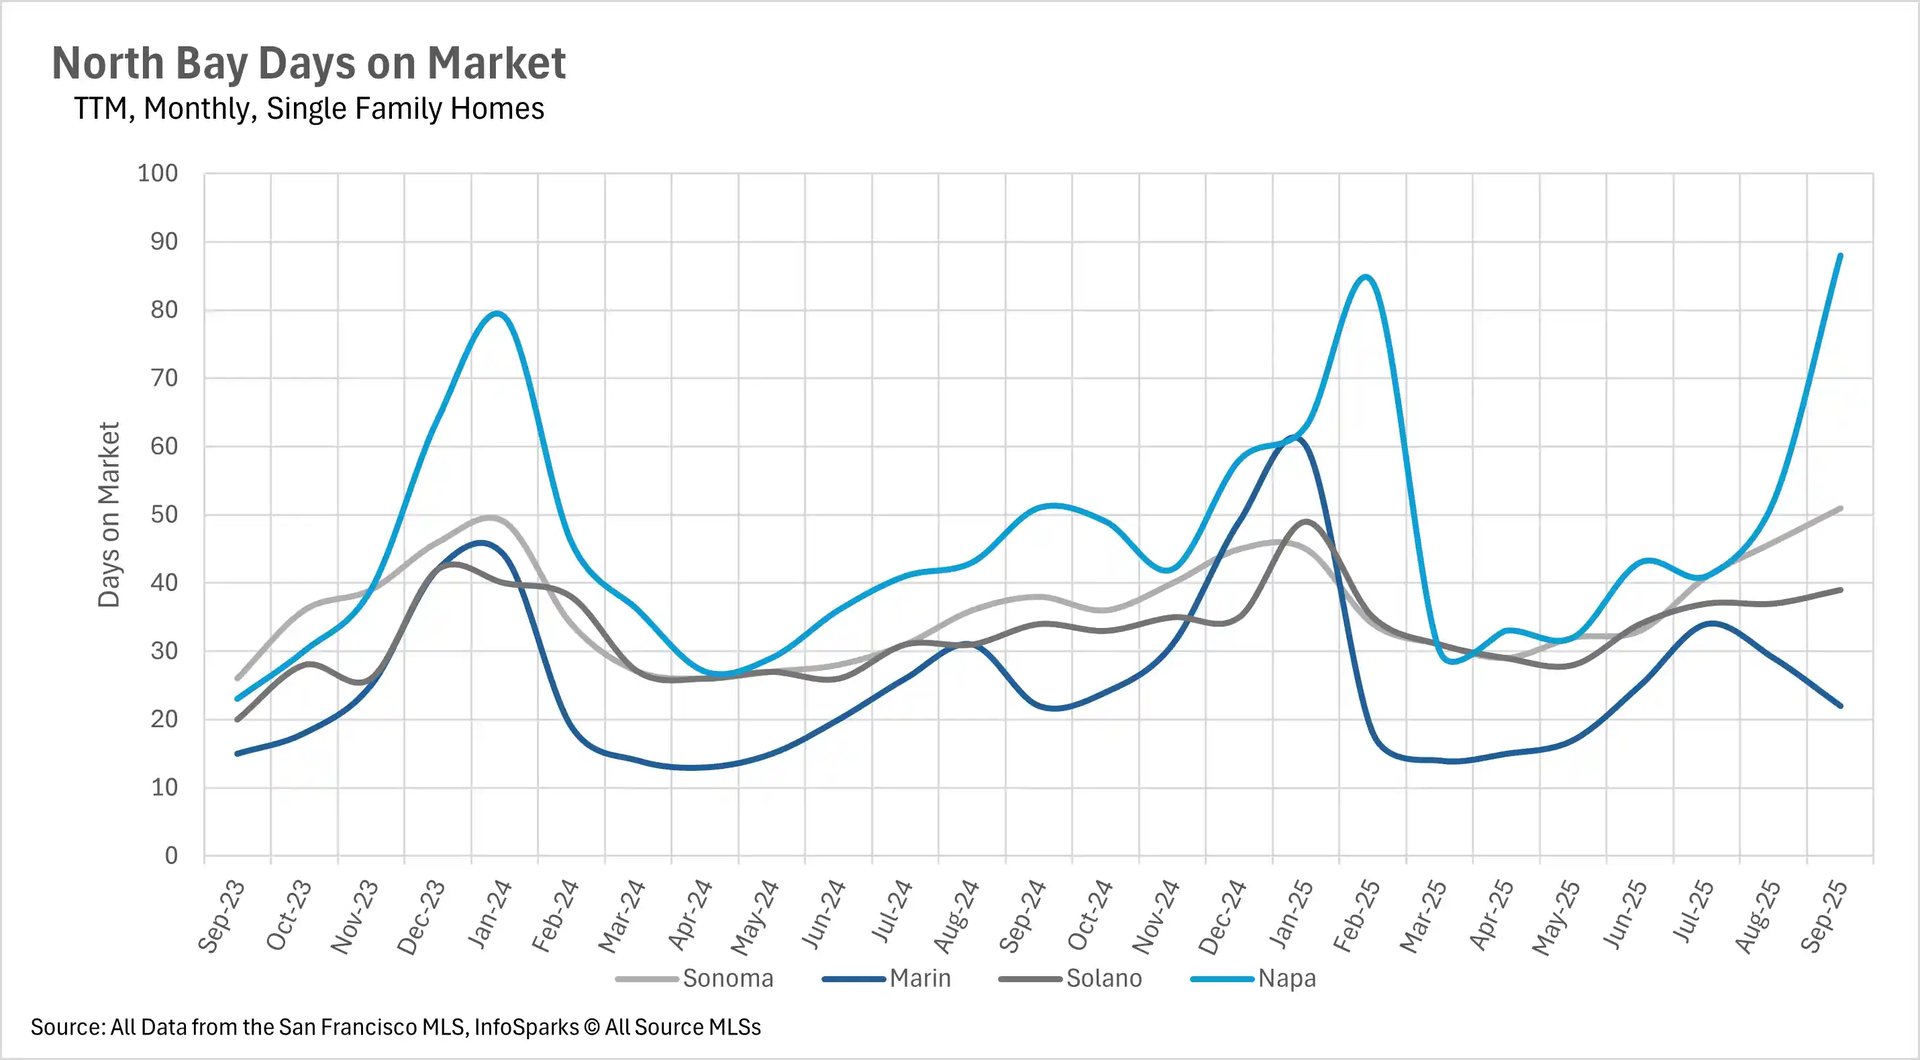
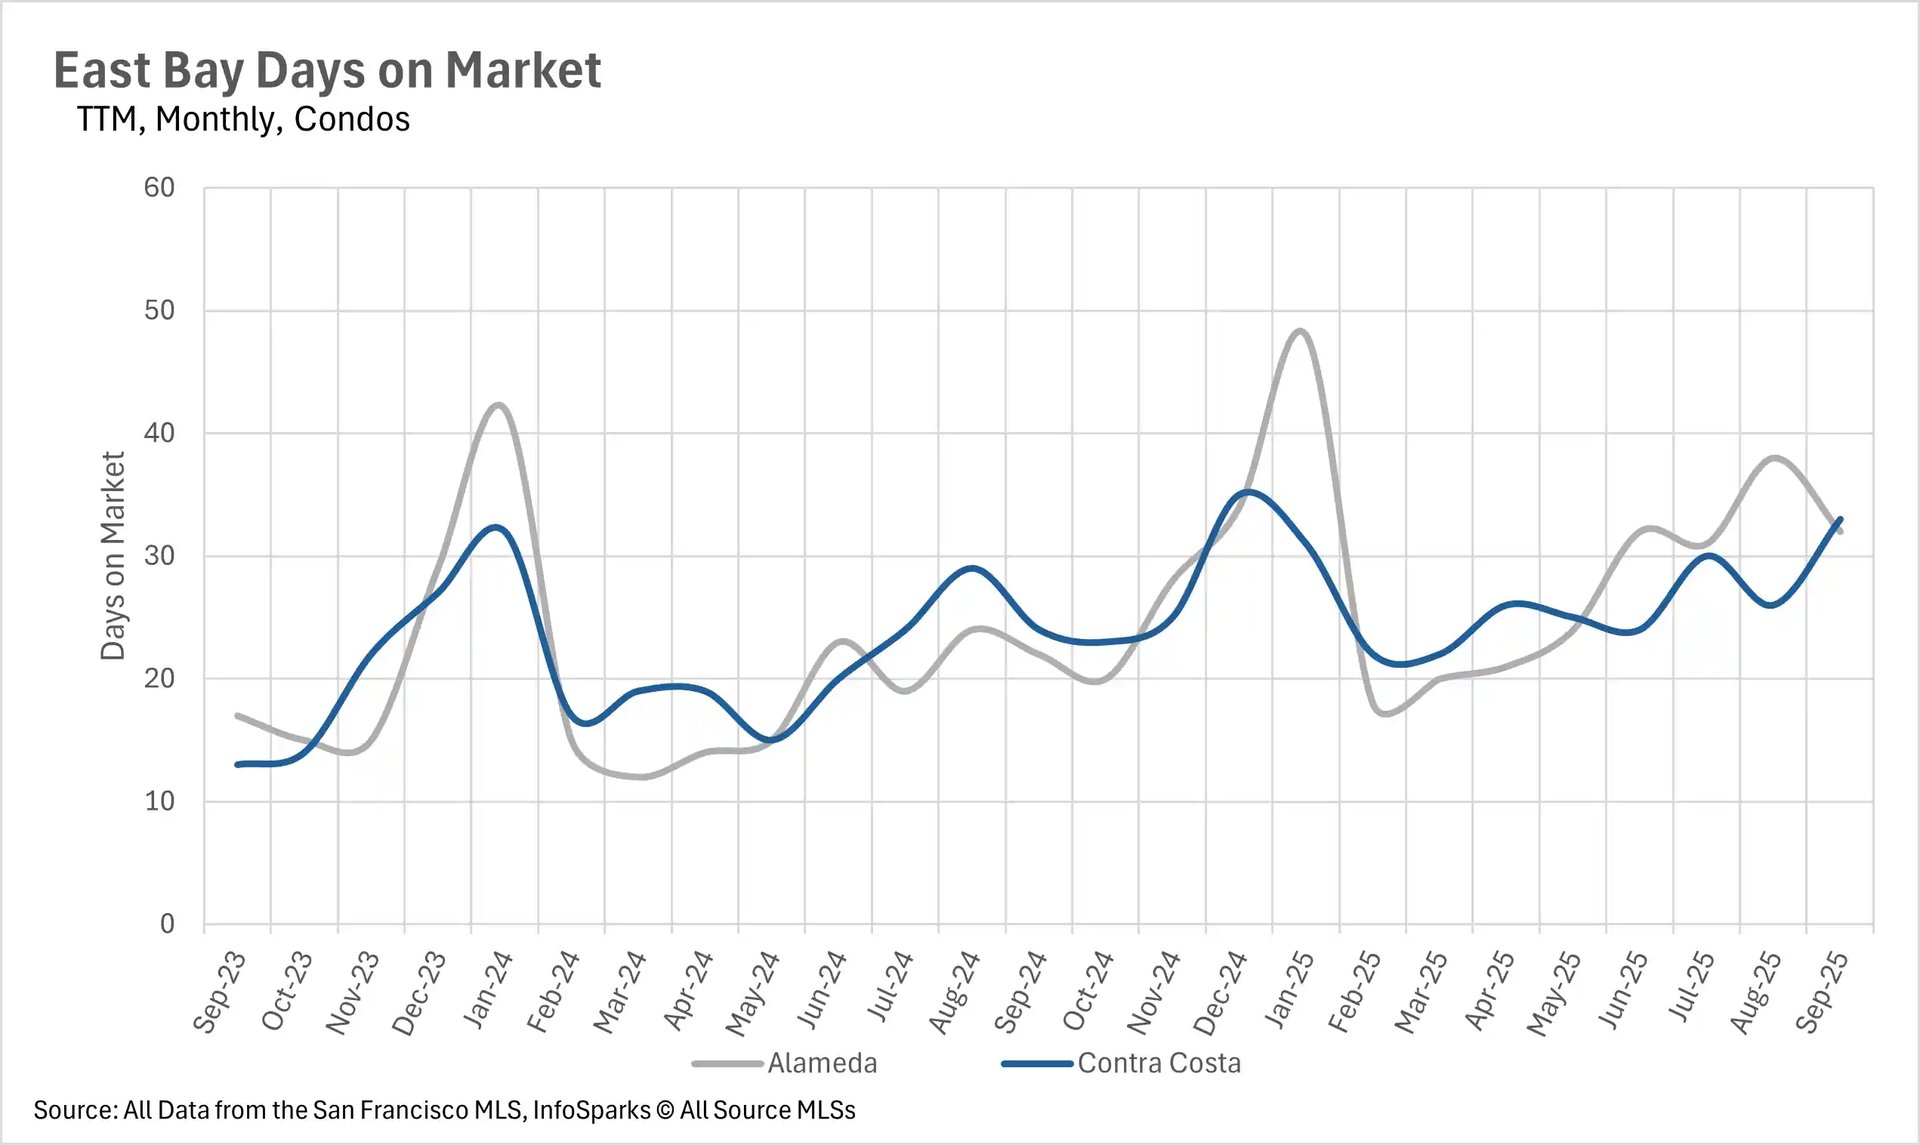
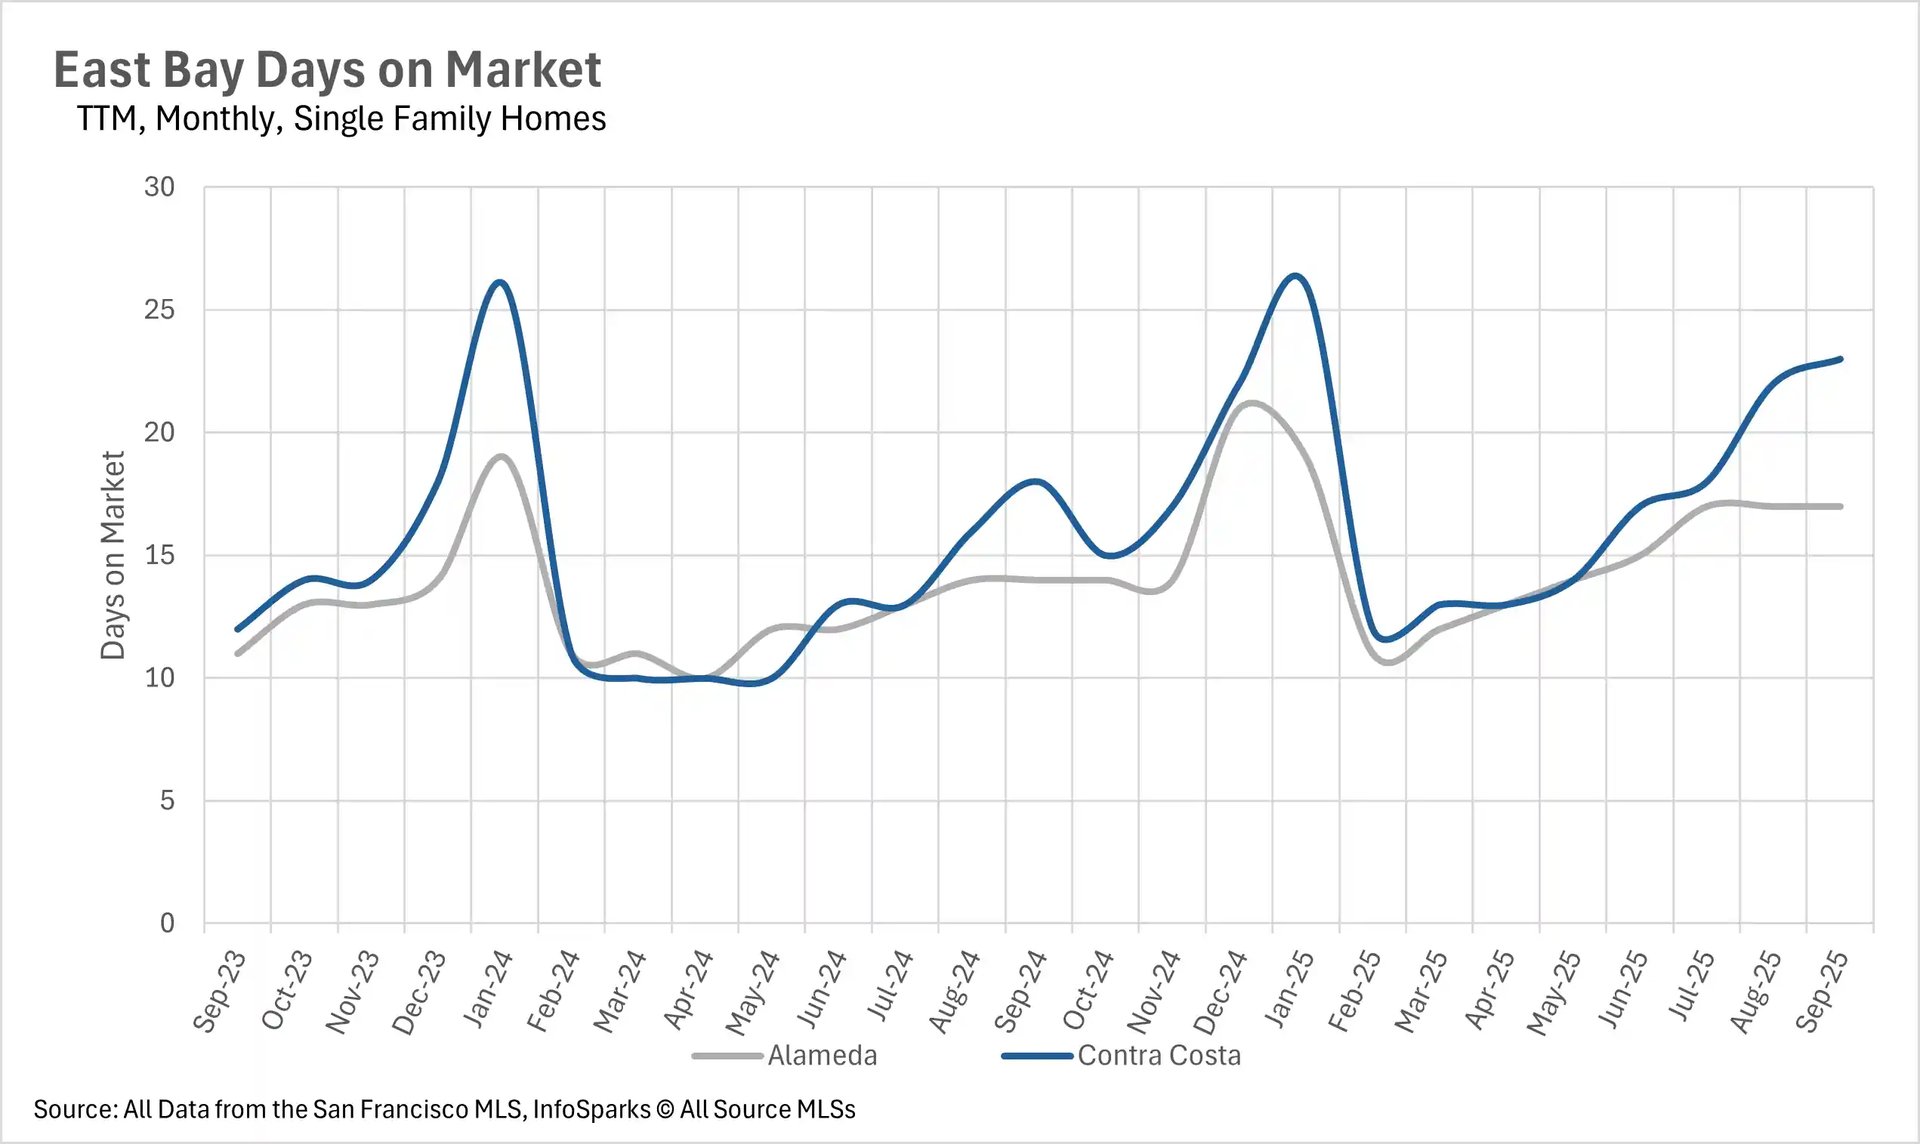
However, condos are experiencing significant delays with San Mateo at 40 days (+25% year-over-year), Santa Clara at 28 days (+55.56%), and Santa Cruz at 41 days (+2.5%). The East Bay showed significant percentage increases but maintained relatively quick absolute times, with single-family homes spending 17 days in Alameda County (+21.43% year-over-year) and 23 days in Contra Costa (+27.78%). Condos moved in 32 and 33 days respectively, despite year-over-year increases of 45.45% and 37.50%. The North Bay presented the most dramatic contrast, with Napa County's average listing spending 88 days on market (up 72.55% year-over-year and 69.23% month-over-month), while other counties showed more moderate increases. Marin County bucked all trends, maintaining the exact same days on market as last year.
Seller's market momentum builds across property types and regions
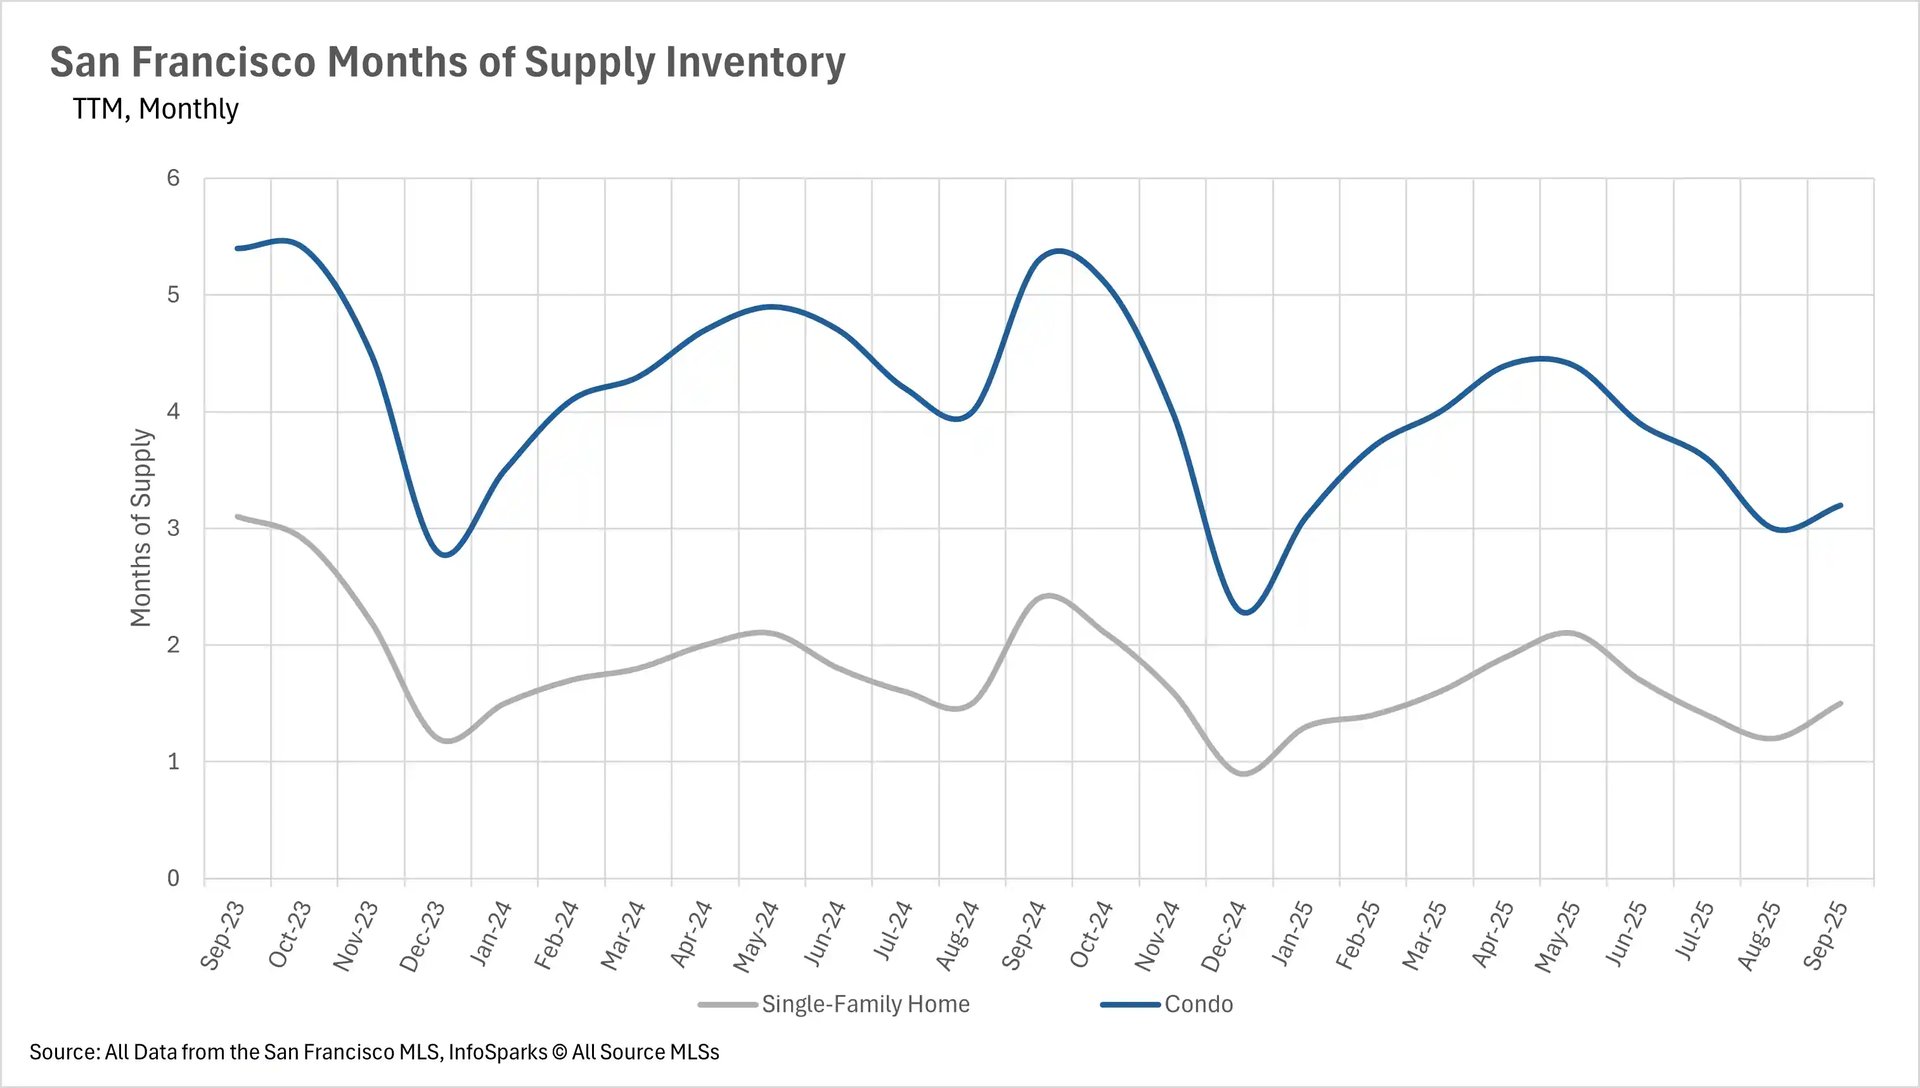
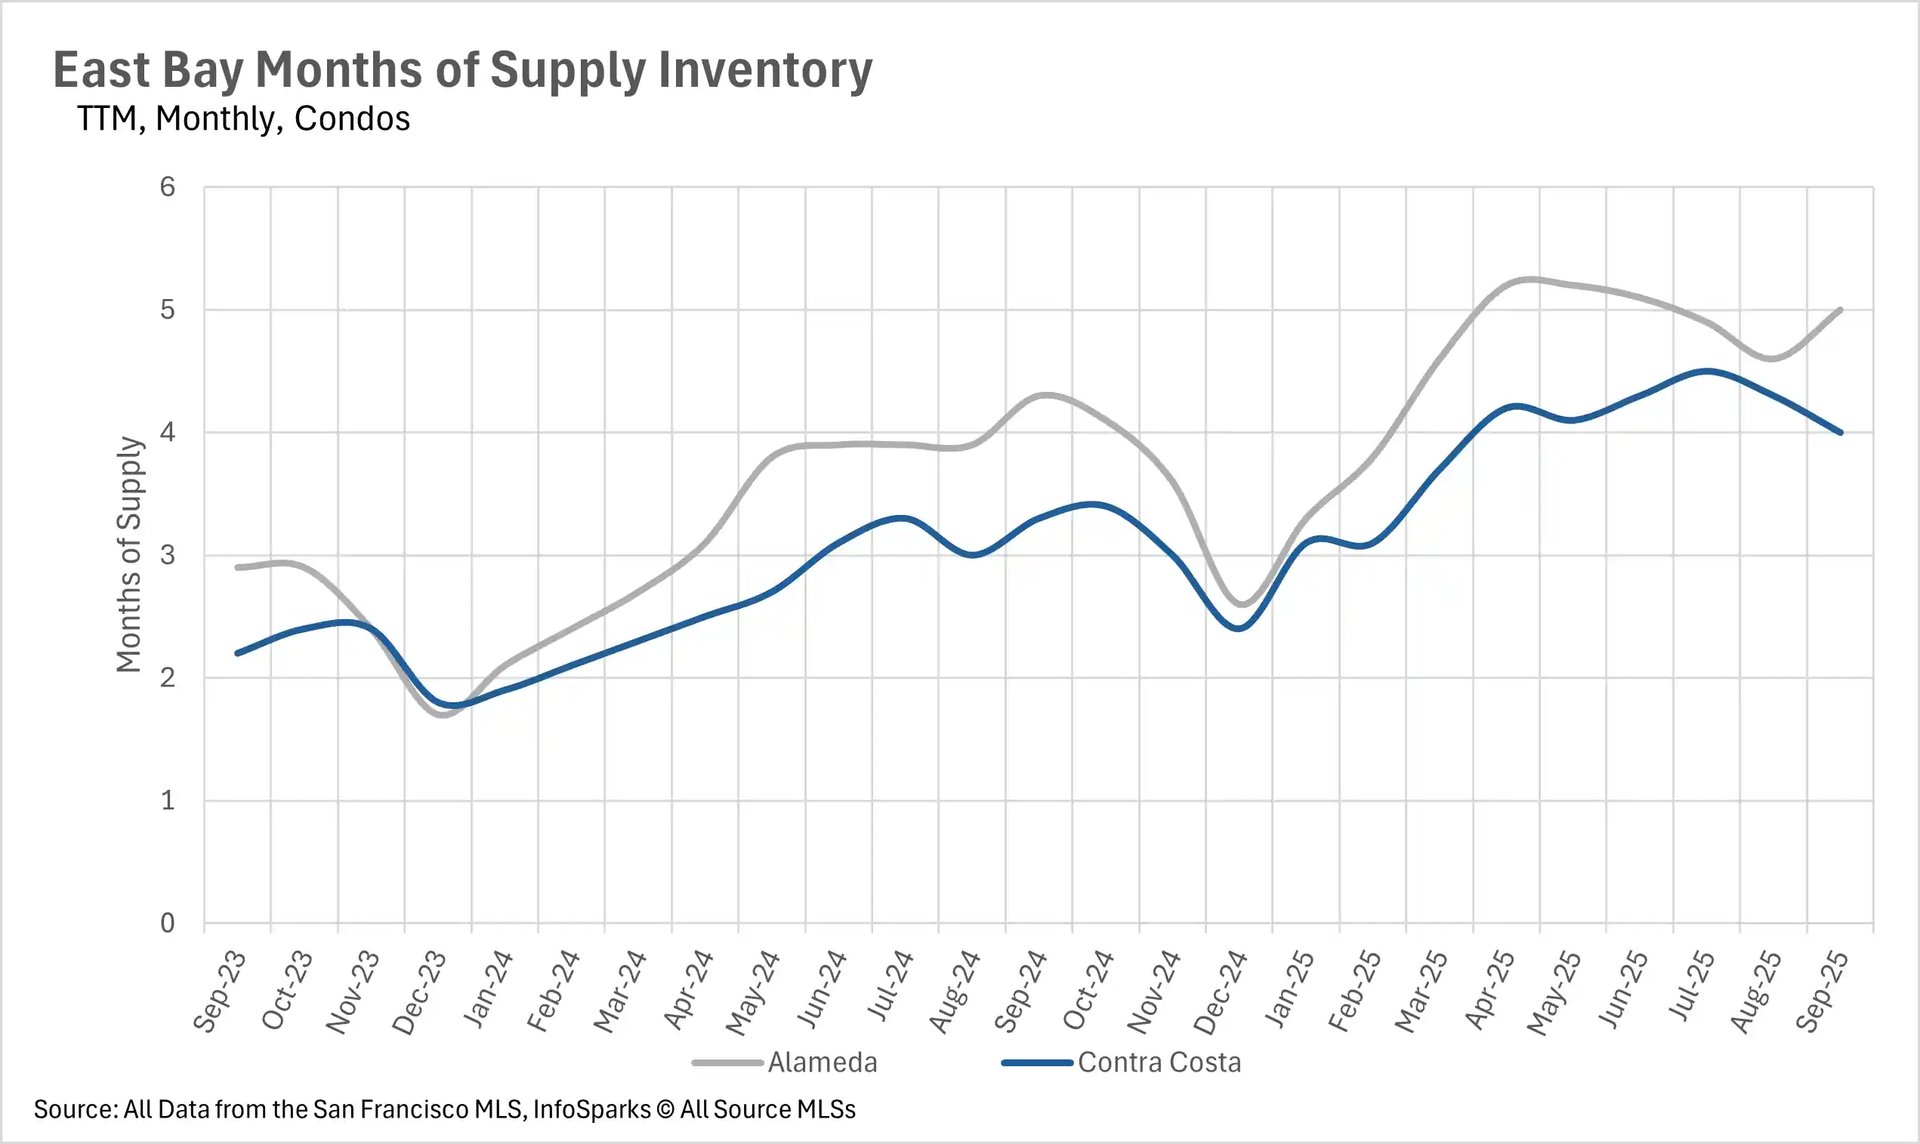
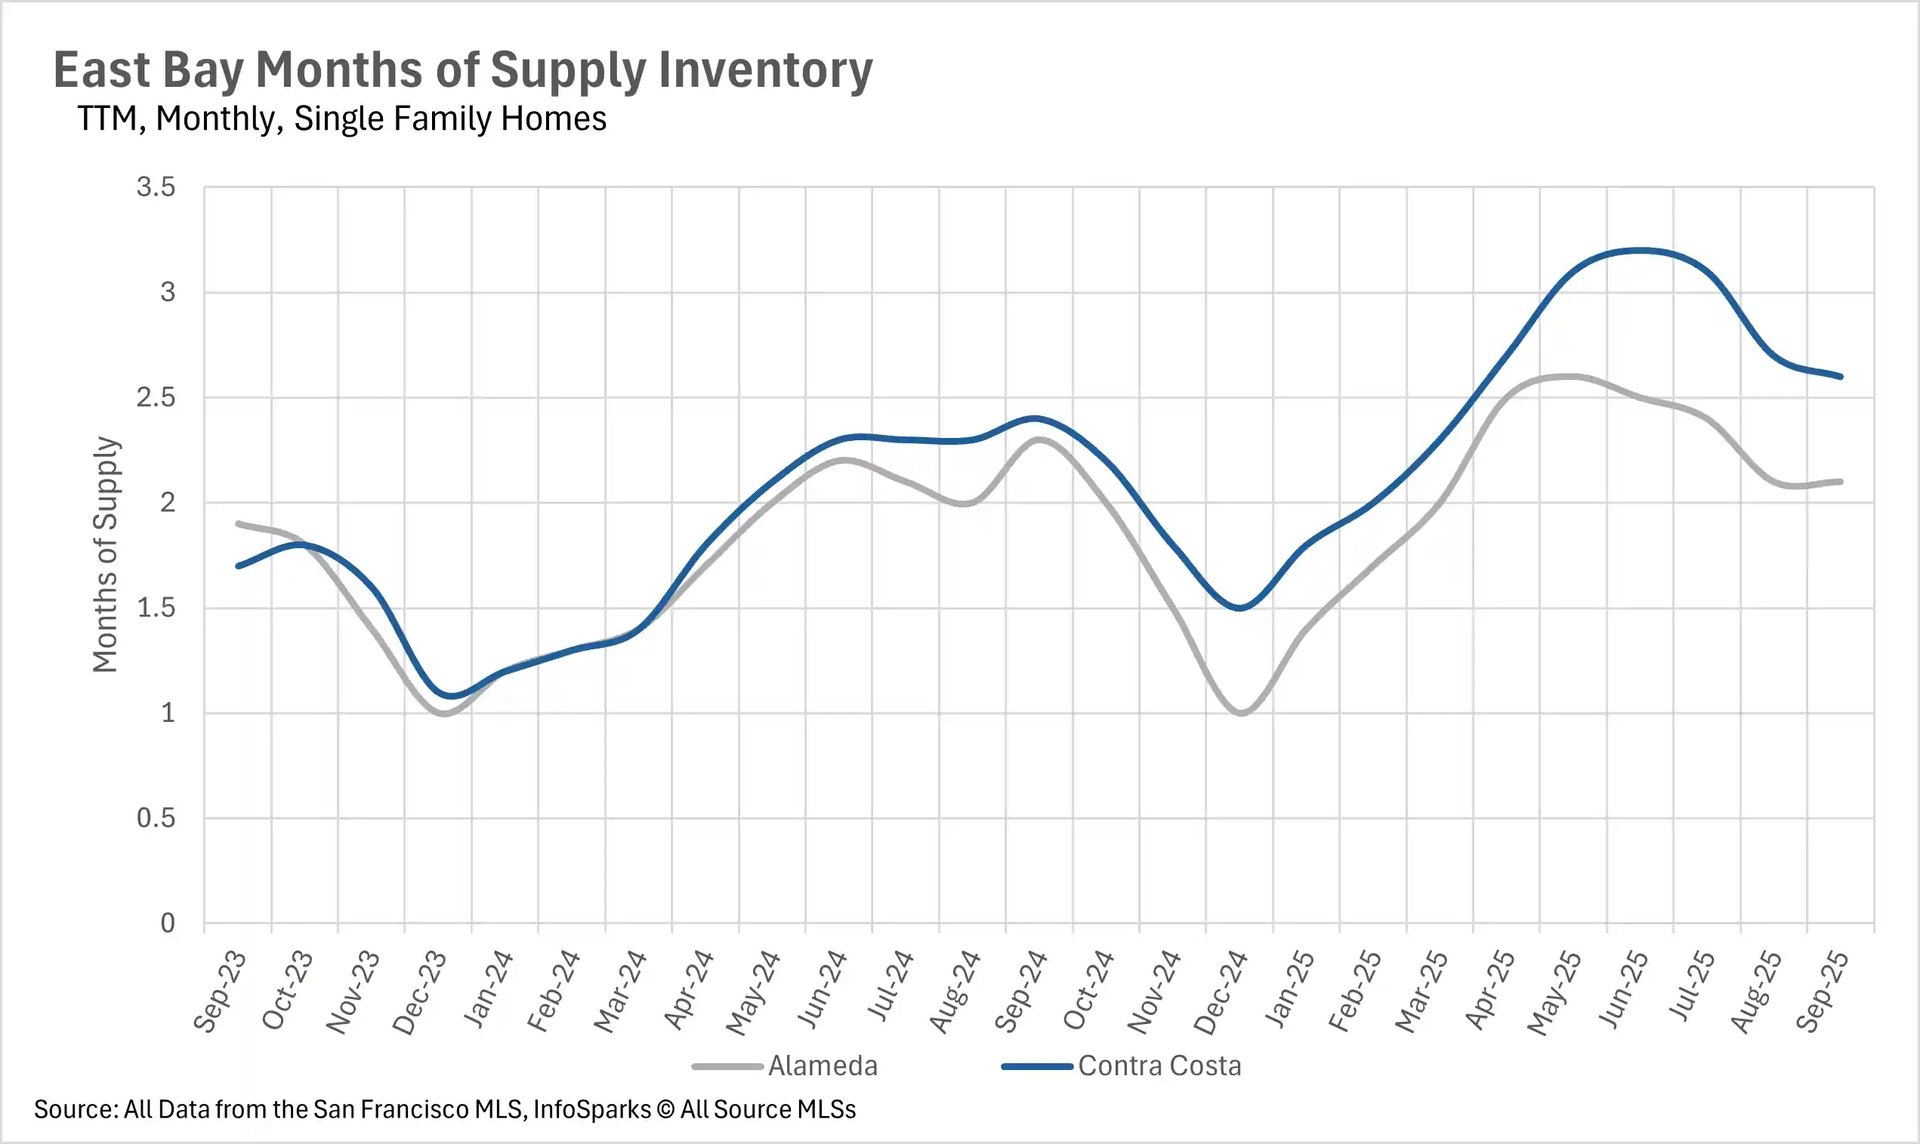
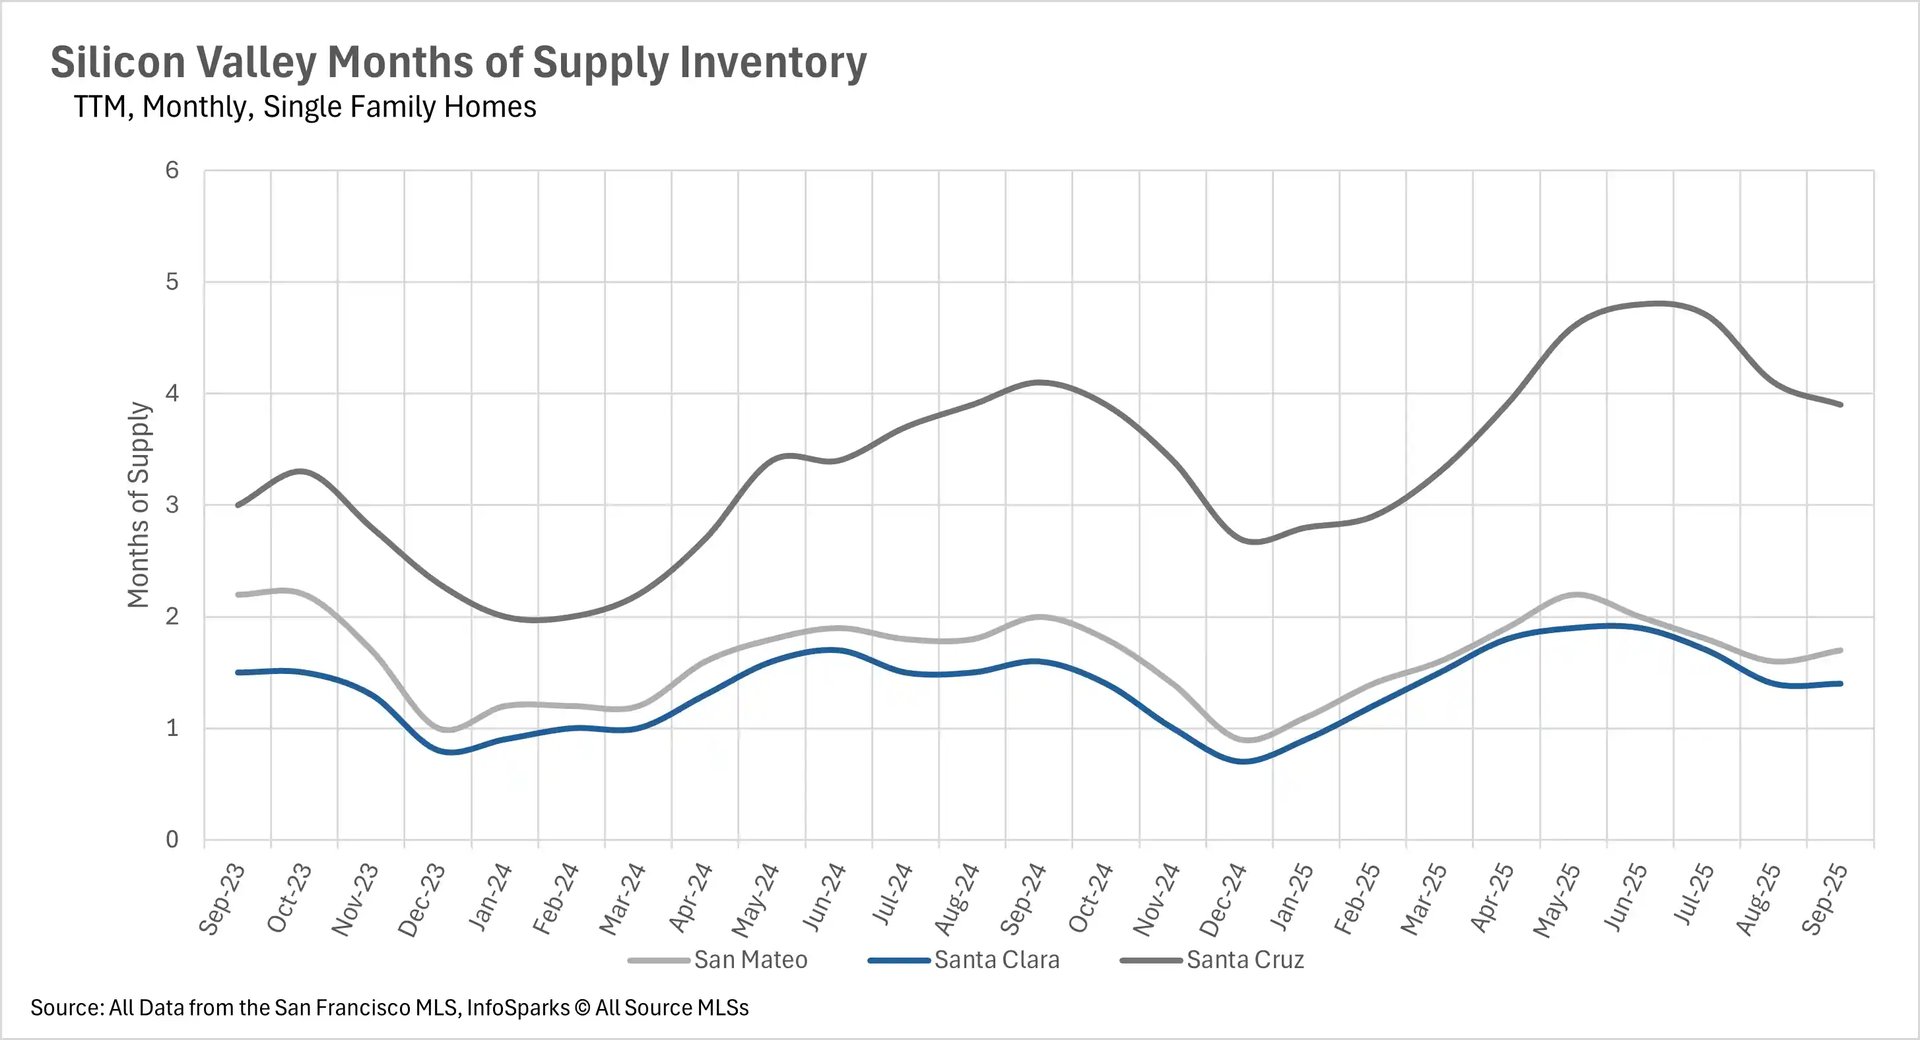
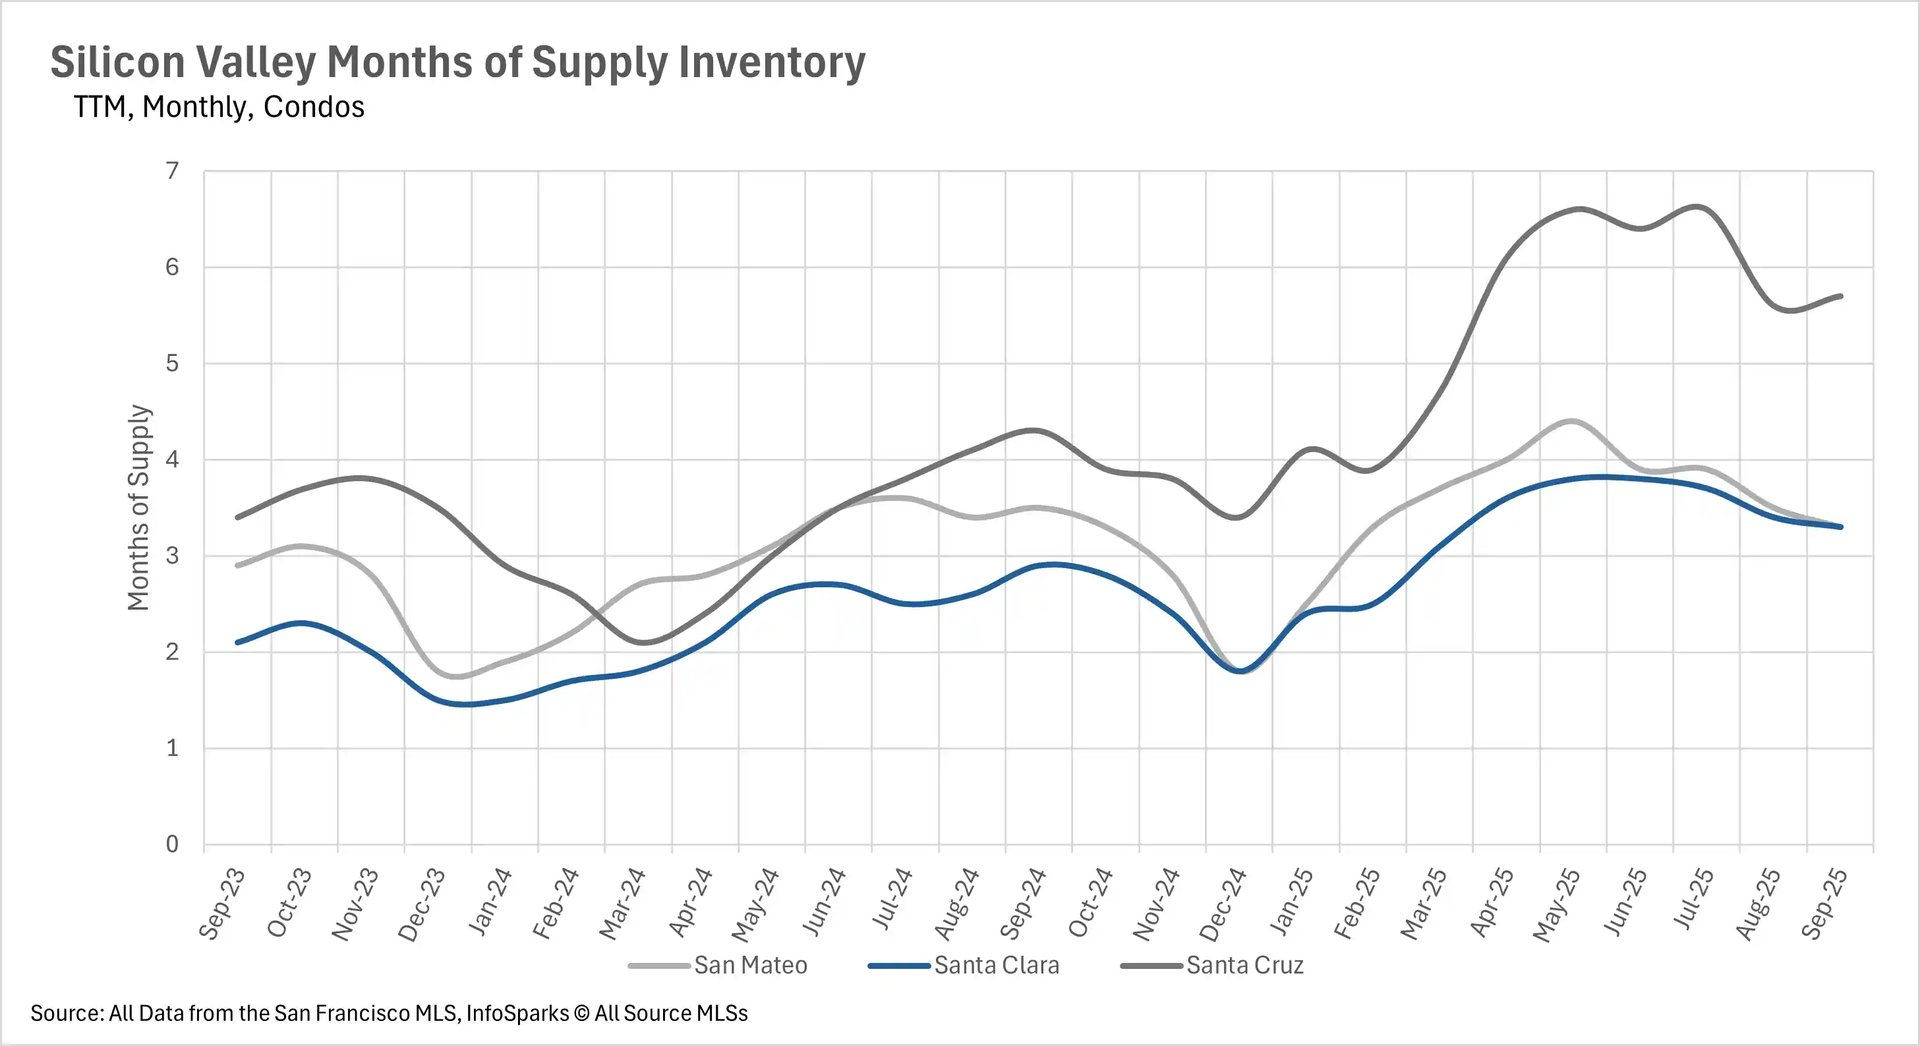
September's inventory normalization accelerated the Bay Area's shift toward seller's markets, with some regions reaching unprecedented levels of seller advantage. San Francisco's single-family market remained firmly in seller's territory at 1.5 months of supply, while the condo market approached seller's status at just 3.2 months - the closest it's been in recent memory. Silicon Valley maintained its ultra-competitive single-family stance with San Mateo at 1.7 months and Santa Clara at an extremely low 1.4 months, while Santa Cruz remained a buyer's market at 3.9 months. All Silicon Valley condo markets favor buyers with 3.3 months in San Mateo and Santa Clara, and 5.7 months in Santa Cruz. The East Bay preserved its traditional split with single-family homes favoring sellers at 2.1 months in Alameda and 2.6 months in Contra Costa, while condos remained buyer-friendly at 5.0 and 4.0 months, respectively.
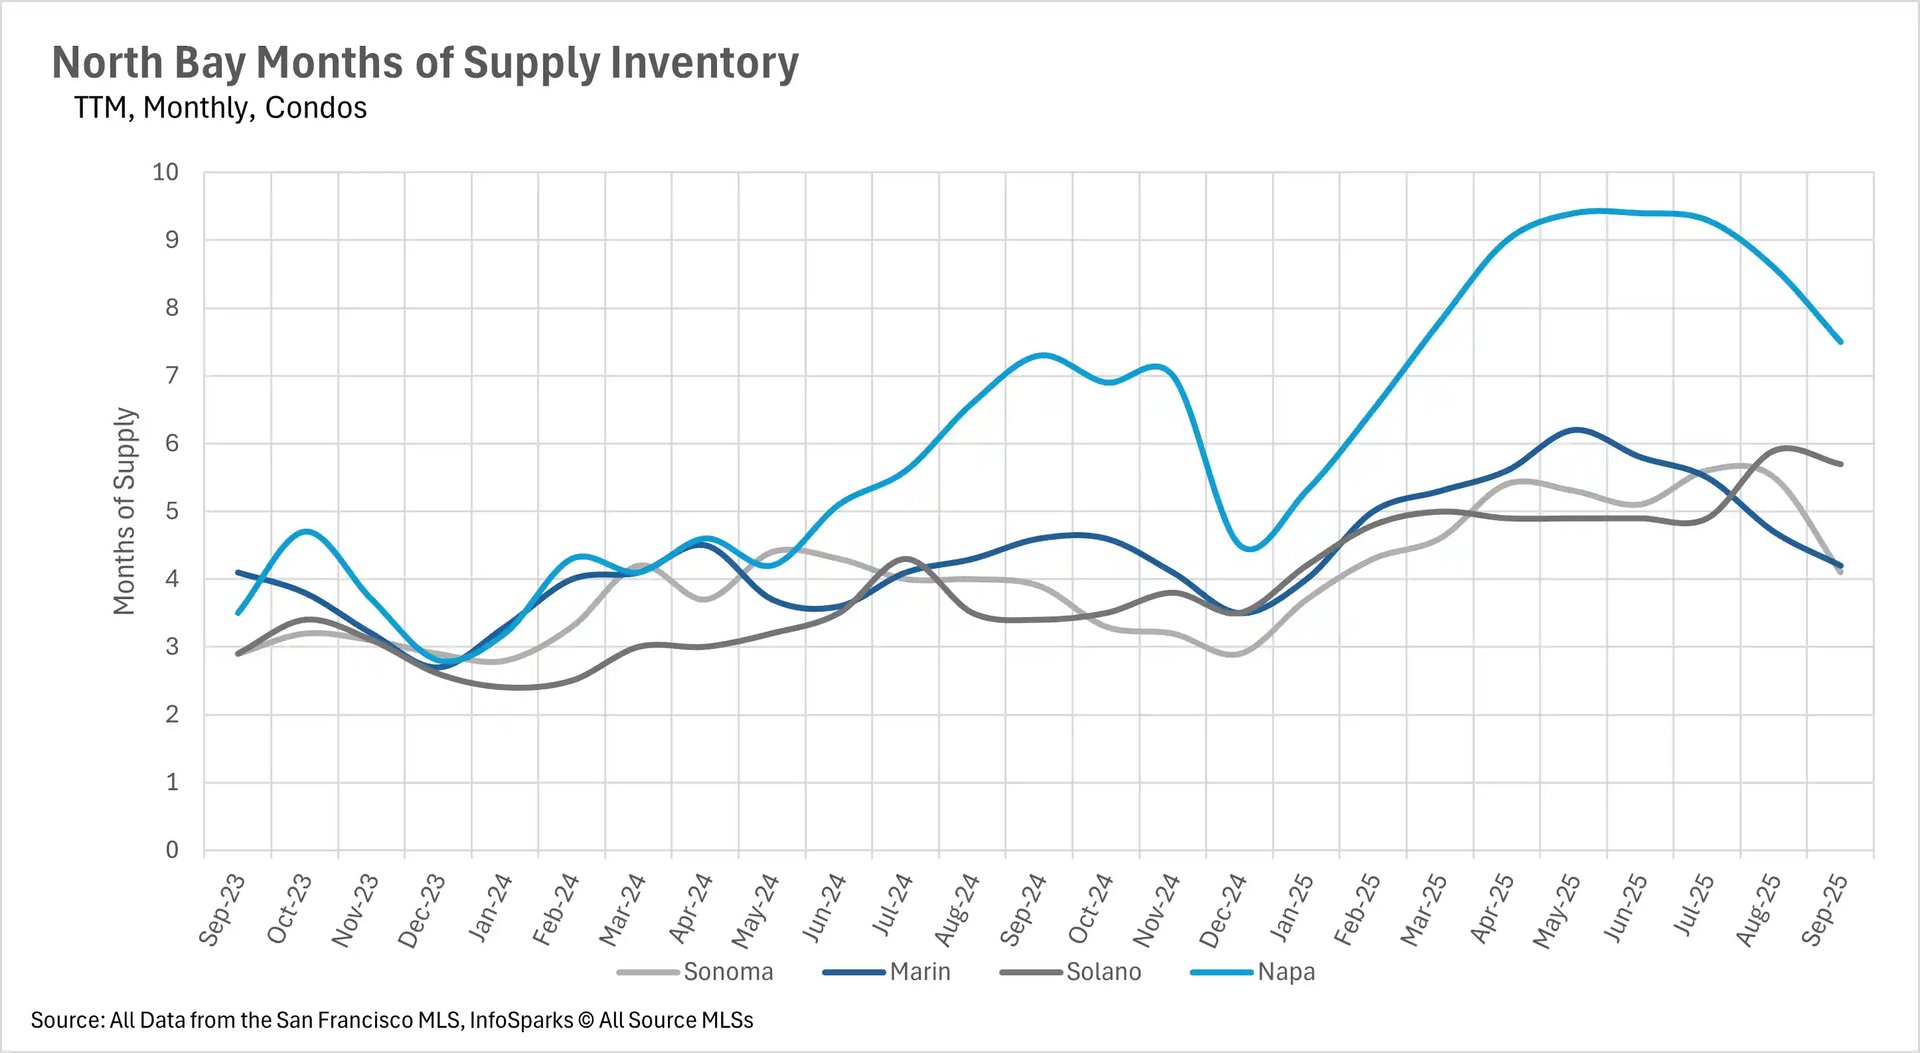
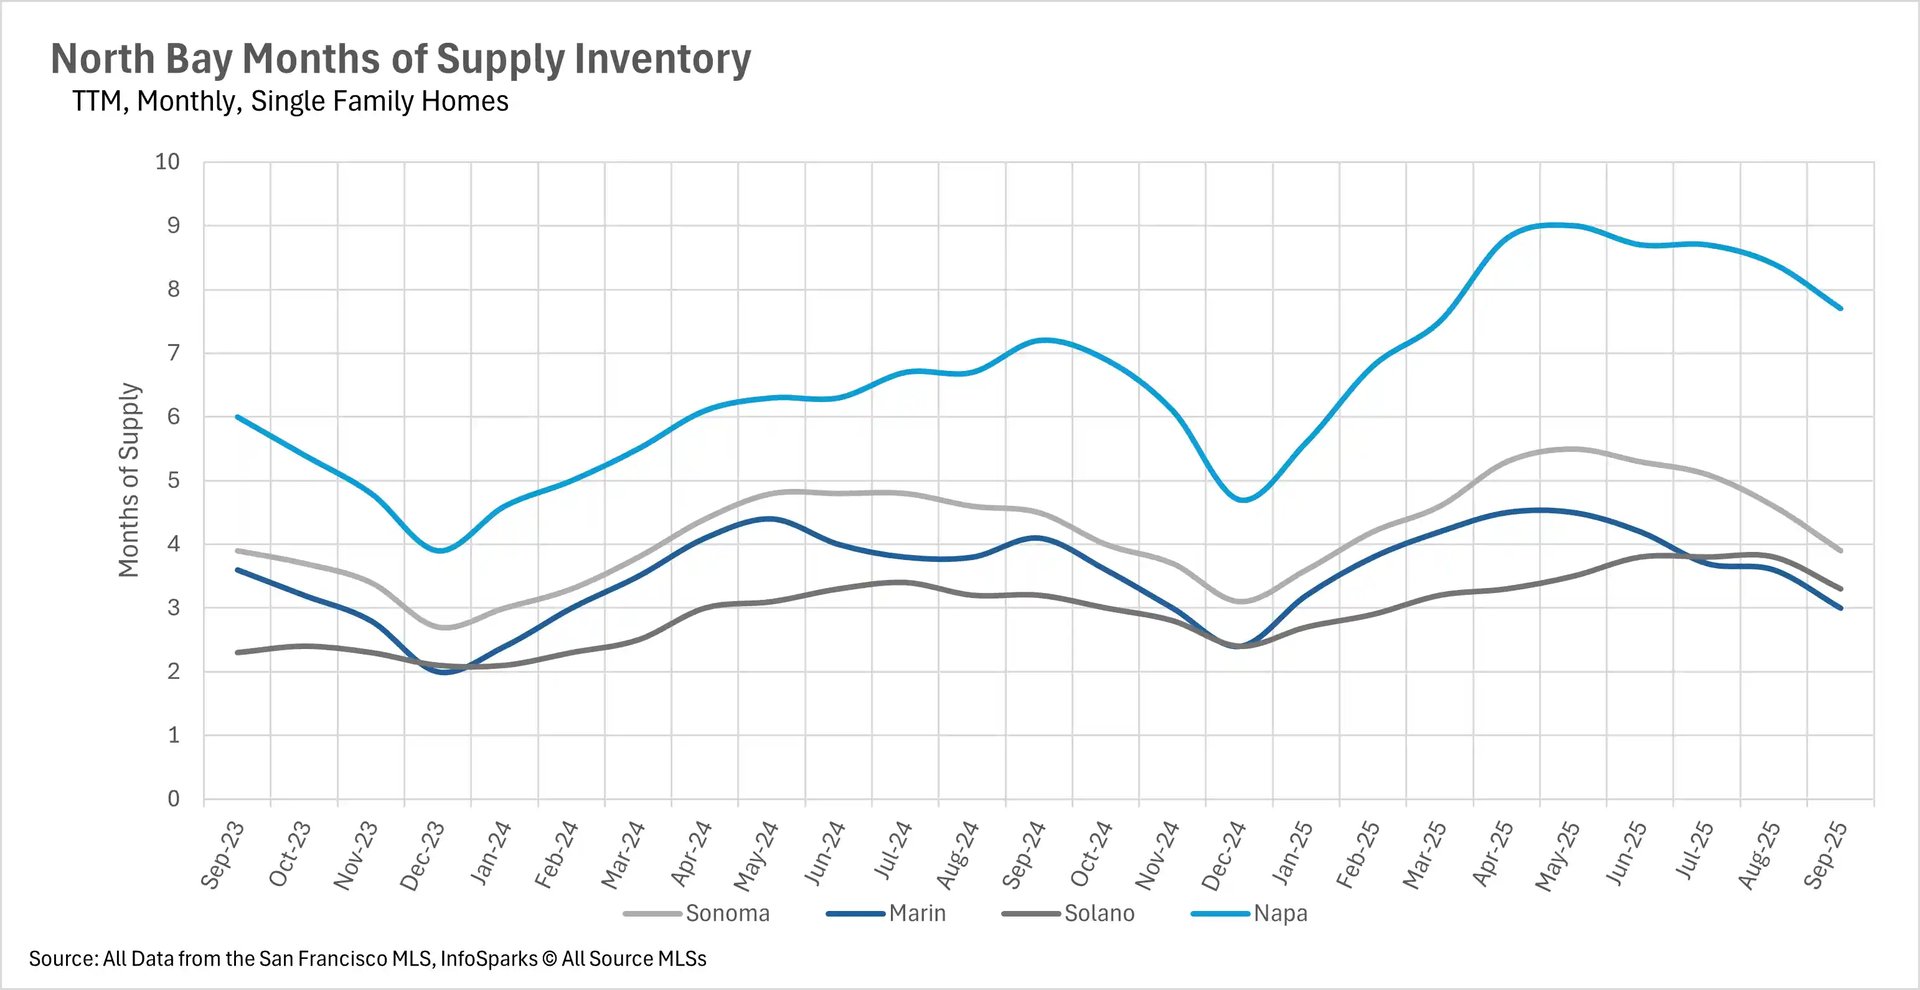
The North Bay showed the clearest shift toward balanced and seller's markets, with Marin County achieving perfect balance at exactly 3.0 months for single-family homes, while Sonoma (3.9 months), Solano (3.3 months), and Napa (7.7 months) continue trending toward balance from buyer's market territory. North Bay condos remain entirely in buyer's market territory but are slowly drifting toward balance, with supply ranging from 4.1 months in Sonoma to 7.5 months in Napa County. This region-wide pattern suggests that as the traditional fall season approaches, seller leverage is strengthening across most Bay Area markets.