Select a Market Report to Read:
Welcome to the latest San Francisco Real Estate Market Report from Kinoko Real Estate! As your trusted local Real Estate experts in San Francisco , we're committed to providing you with the most accurate and insightful data to guide your home buying or selling journey in this dynamic city.
The Local Lowdown
Quick Take:
- Last month we saw a big upward swing in median sale prices for single-family homes in San Francisco
- Inventory continues to be one of the largest issues facing the San Francisco housing market.
- Listings continue to be sold at faster and faster rates.
Note: You can find the charts/graphs for the Local Lowdown at the end of this section.
*National Association of REALTORS® data is released two months behind, so we estimate the most recent month's data when possible and appropriate.
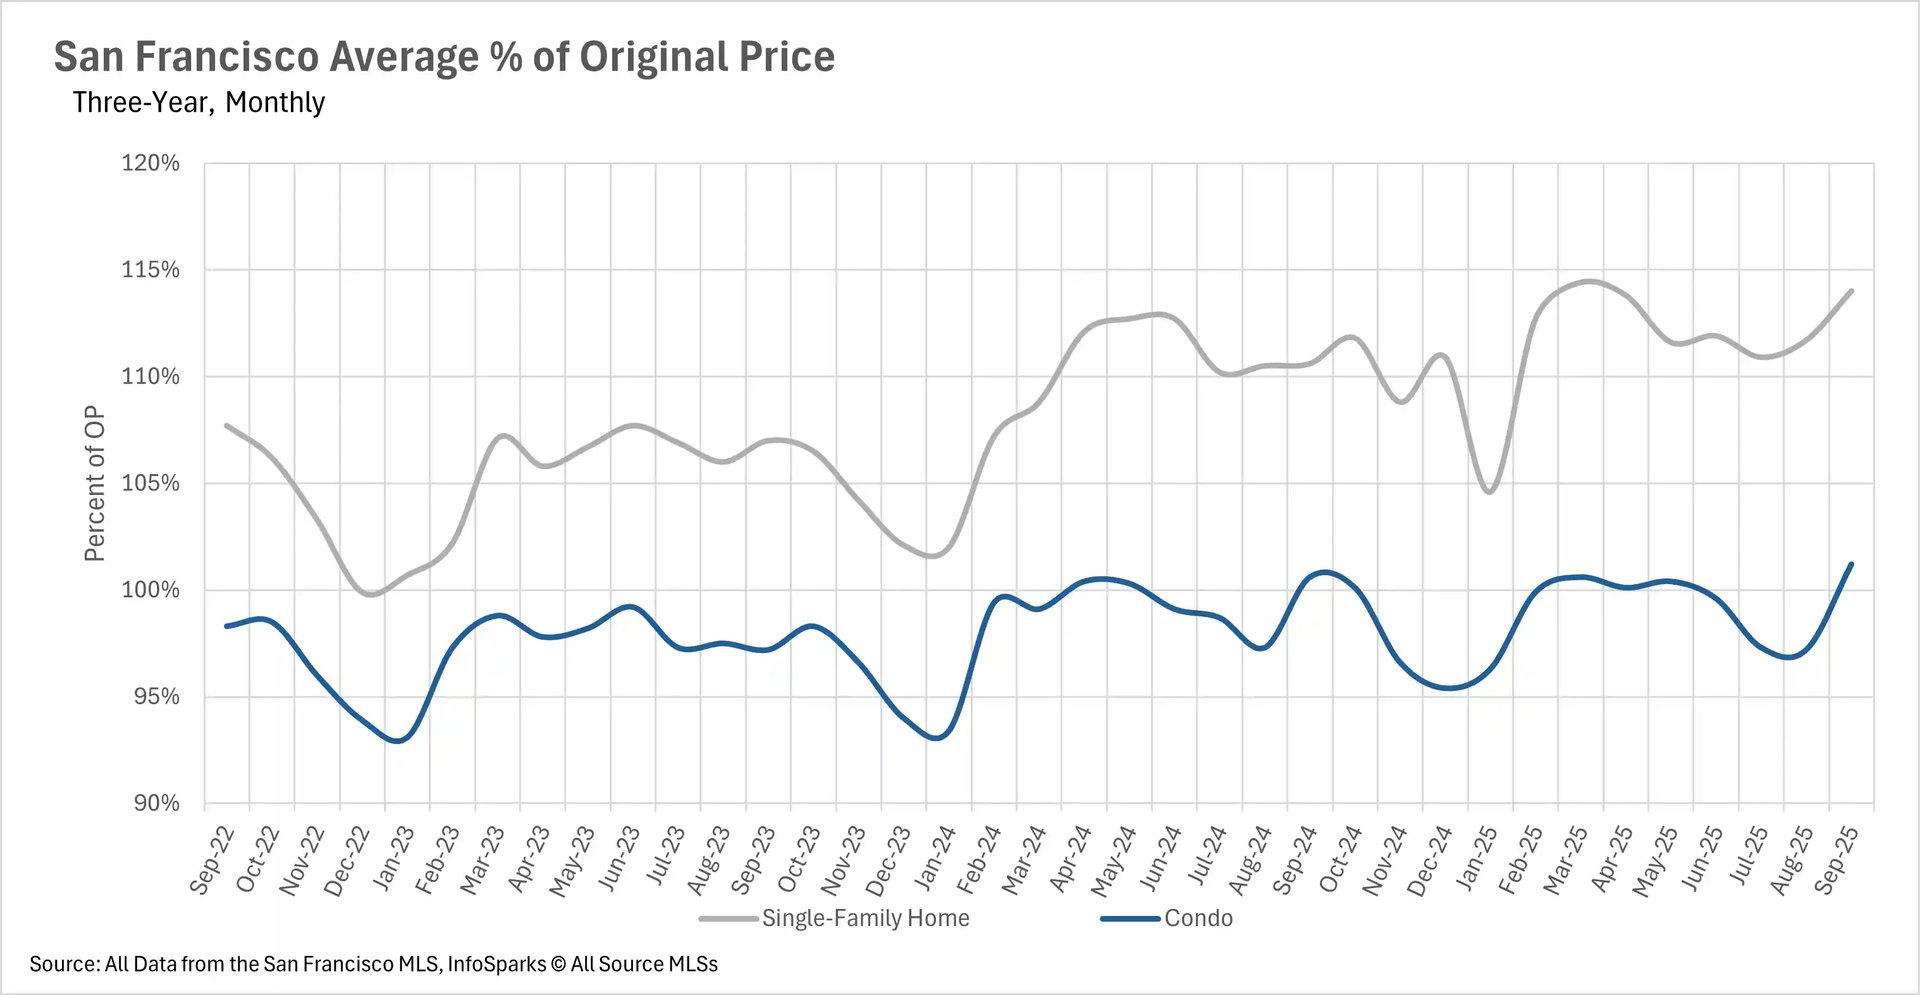
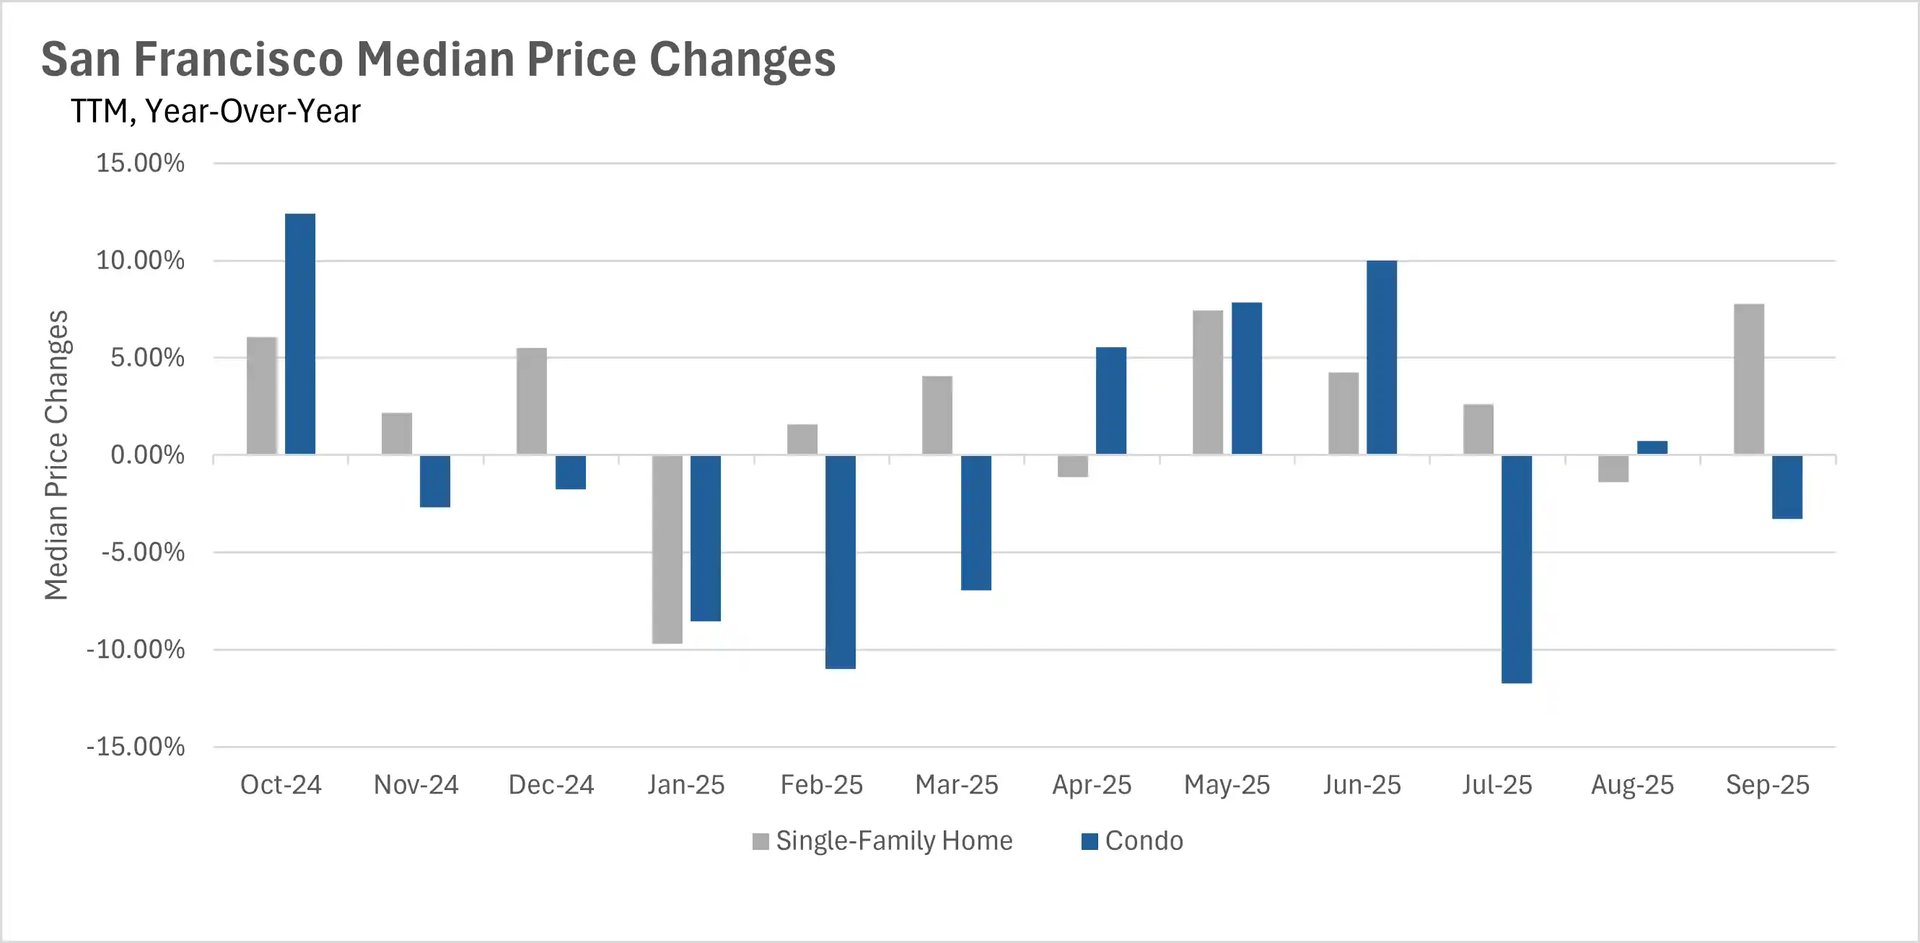
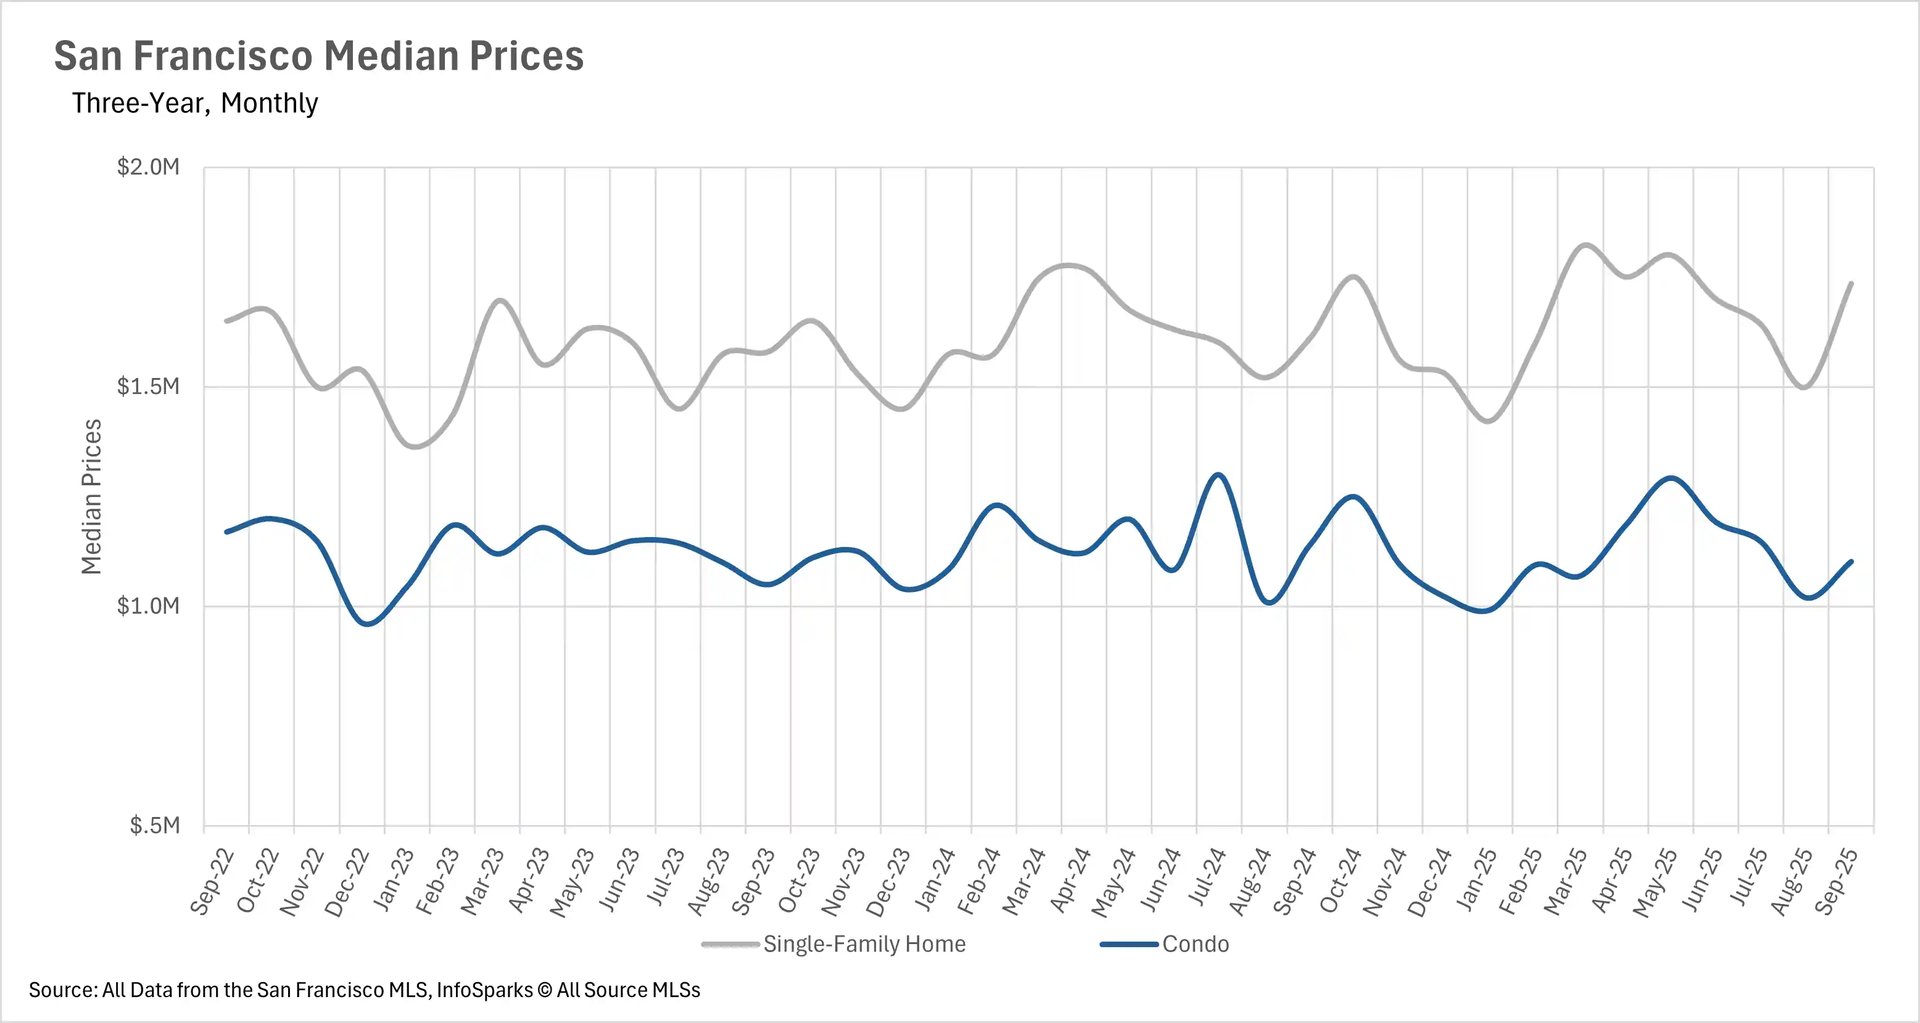
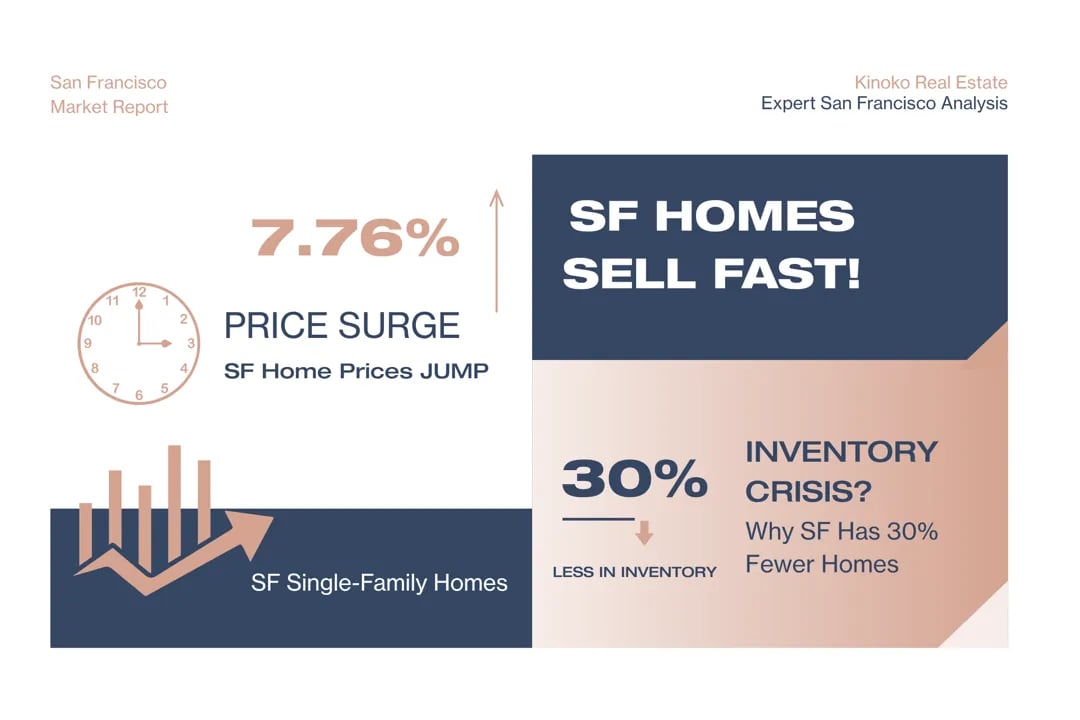
Median sale prices for single-family homes jumped by more than 7% in September
Last month, we saw a big move upward in terms of median sale price for single-family homes in the San Francisco area. The median listing sold for 7.76% more than it did around this time last year, which marks the largest increase in this particular market that we’ve seen all year. When we turn to the condo market, median sale prices decreased by 3.29%. However, it is important to note that the average condo is now selling for a slight premium to the original listing prices, which is a phenomenon that we haven’t seen since May.
If you're considering selling your home in this competitive market, learn more about our proven selling process that help maximize your sale price.
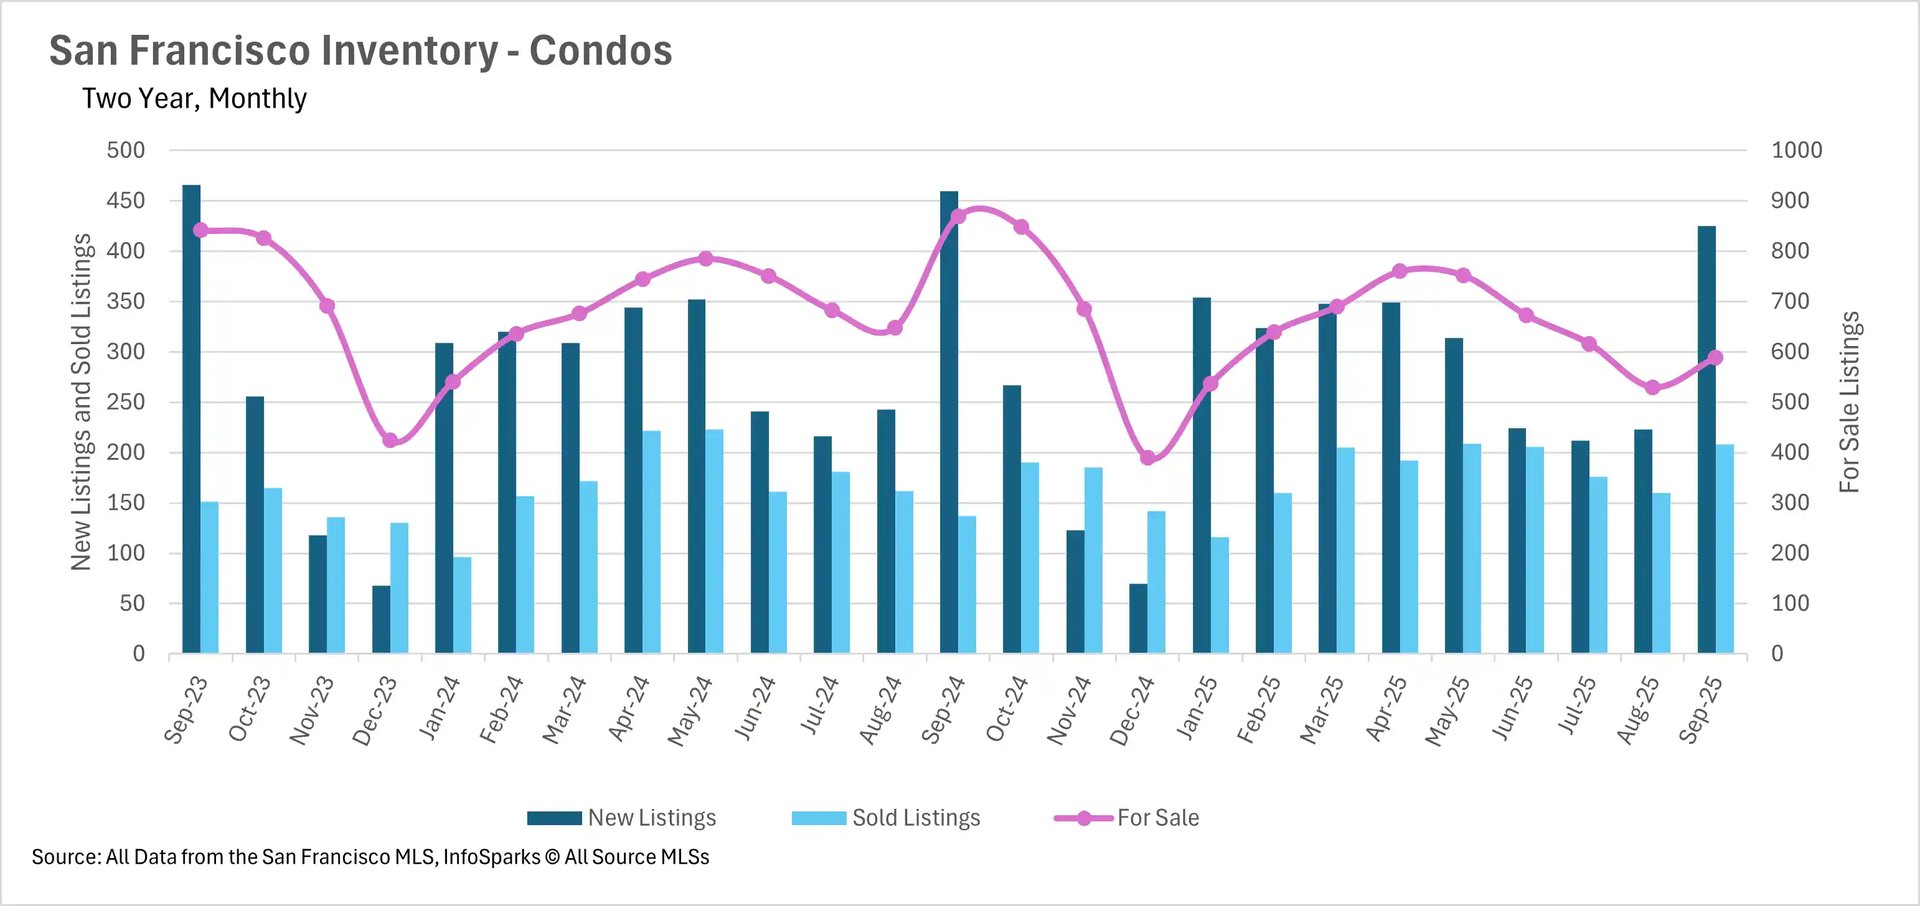
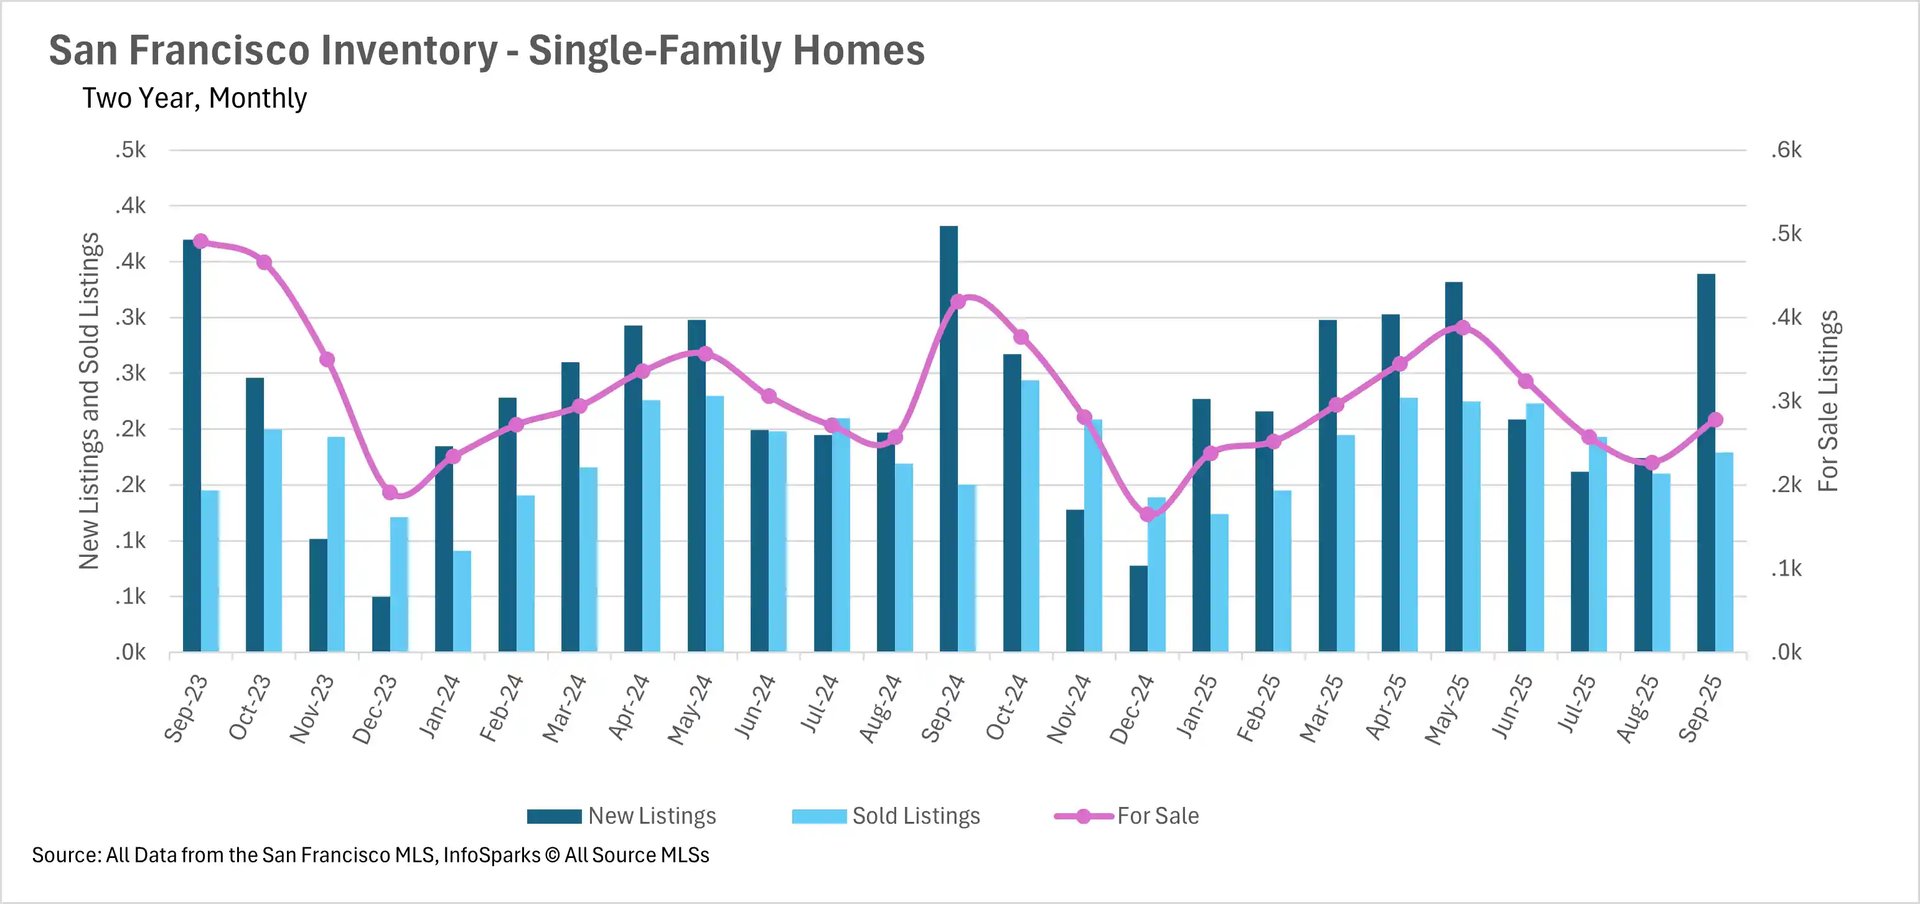
Inventories continue to lag last year's numbers by more than 30%
Inventory issues have been plaguing San Francisco for several years, as the number of active listings slowly dwindles. Unfortunately, nothing changed this month, as single-family home inventories are down 33.65% on a year-over-year basis, and condo inventories are down by 32.22% on a year-over-year basis. This was driven by the fact that fewer new listings are hitting the market, with 7.61% fewer new condo listings and 11.26% fewer new single-family home listings, and compounded by the fact that there were 51.82% more condos and 19.33% more single-family homes sold.
Understanding these market dynamics is just the first step. Whether you're a buyer looking to enter this competitive market or a seller wanting to capitalize on current conditions, having the right strategy and representation makes all the difference.
Don't just take our word for it - read what our clients have to say about their experiences in our testimonials.
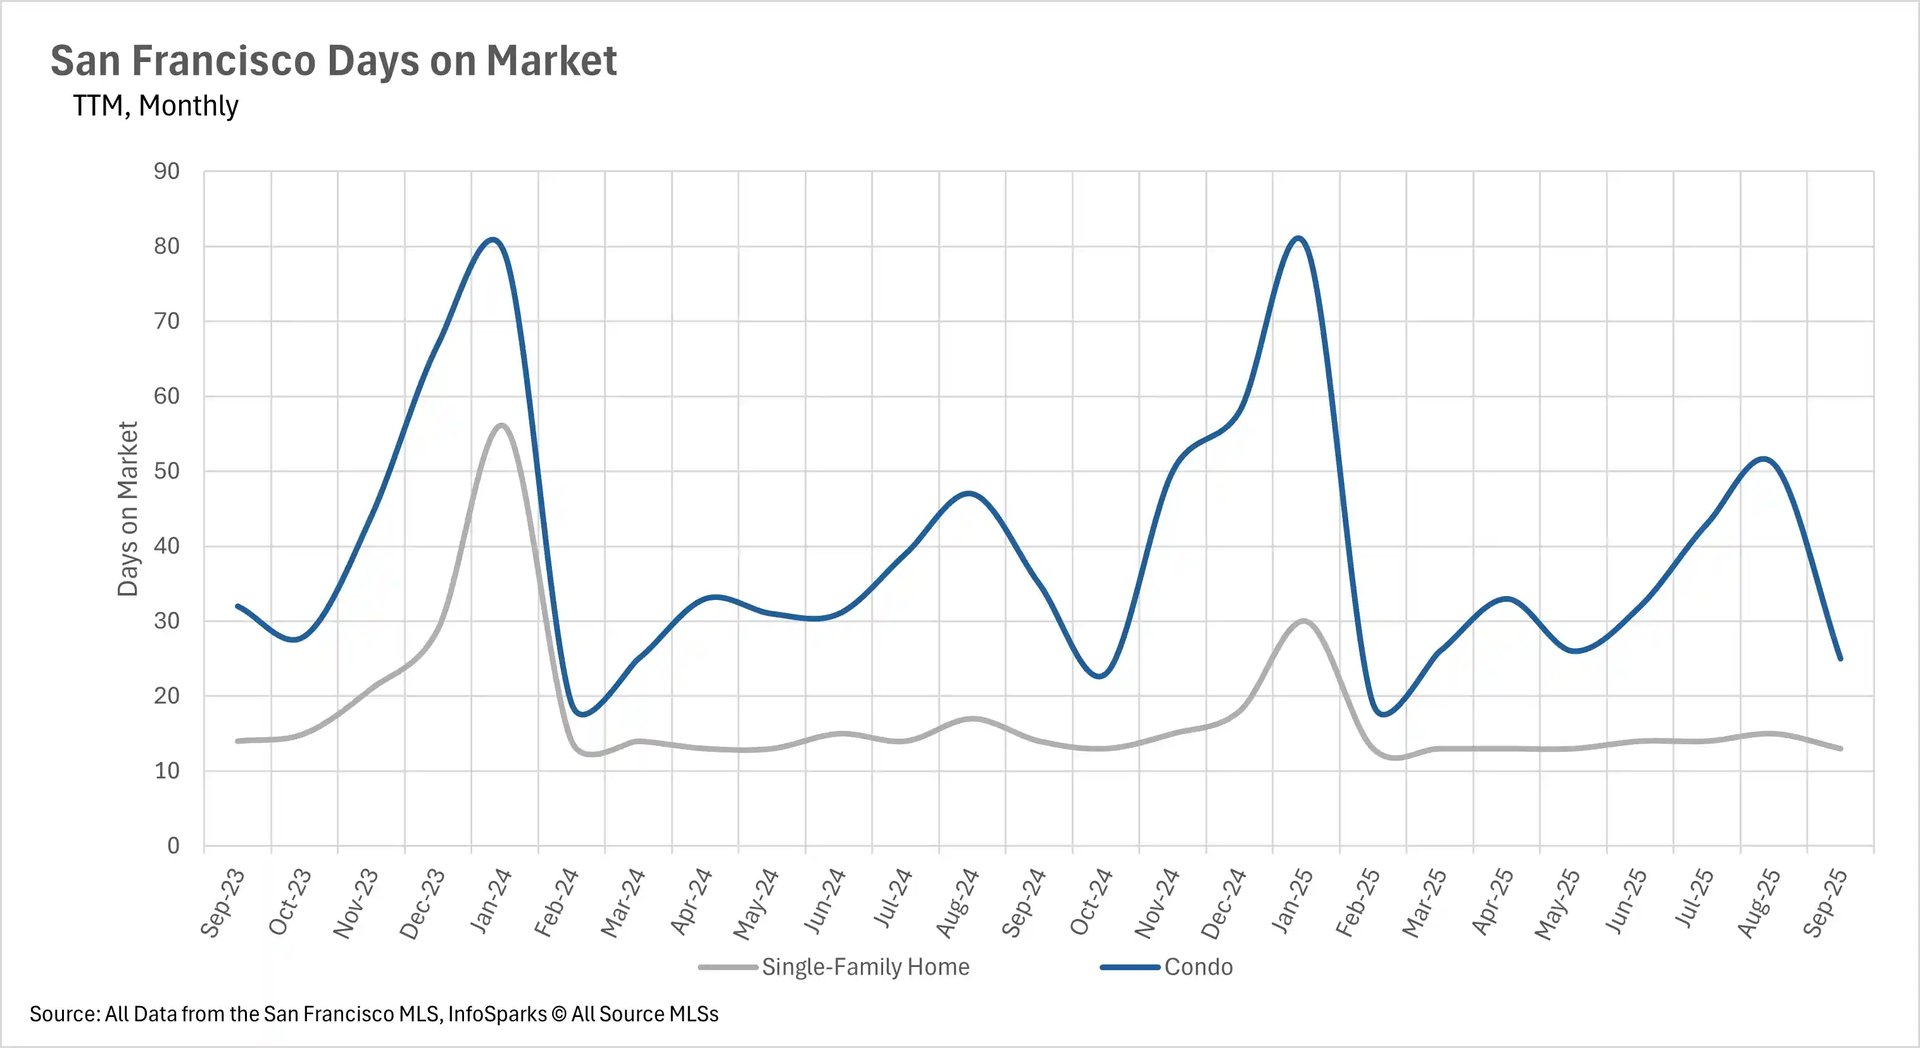
As inventories shrink, homes are sold off incredibly quickly
As you might expect, when inventories shrink, the market becomes much more competitive, which is certainly the dynamic that we are watching play out in San Francisco. The average single-family home is spending just 13 days on the market, representing a 7.14% year-over-year decrease. By the same token, the average condo listing is spending just 25 days on the market, representing a 28.57% year-over-year decrease and a 50.98% month-over-month decrease.
Whether you're buying or selling in today's market, timing and strategy are crucial. Check out our case studies to see how we've successfully navigated similar market conditions for our clients.
The condo market creeps closer to becoming a seller's market
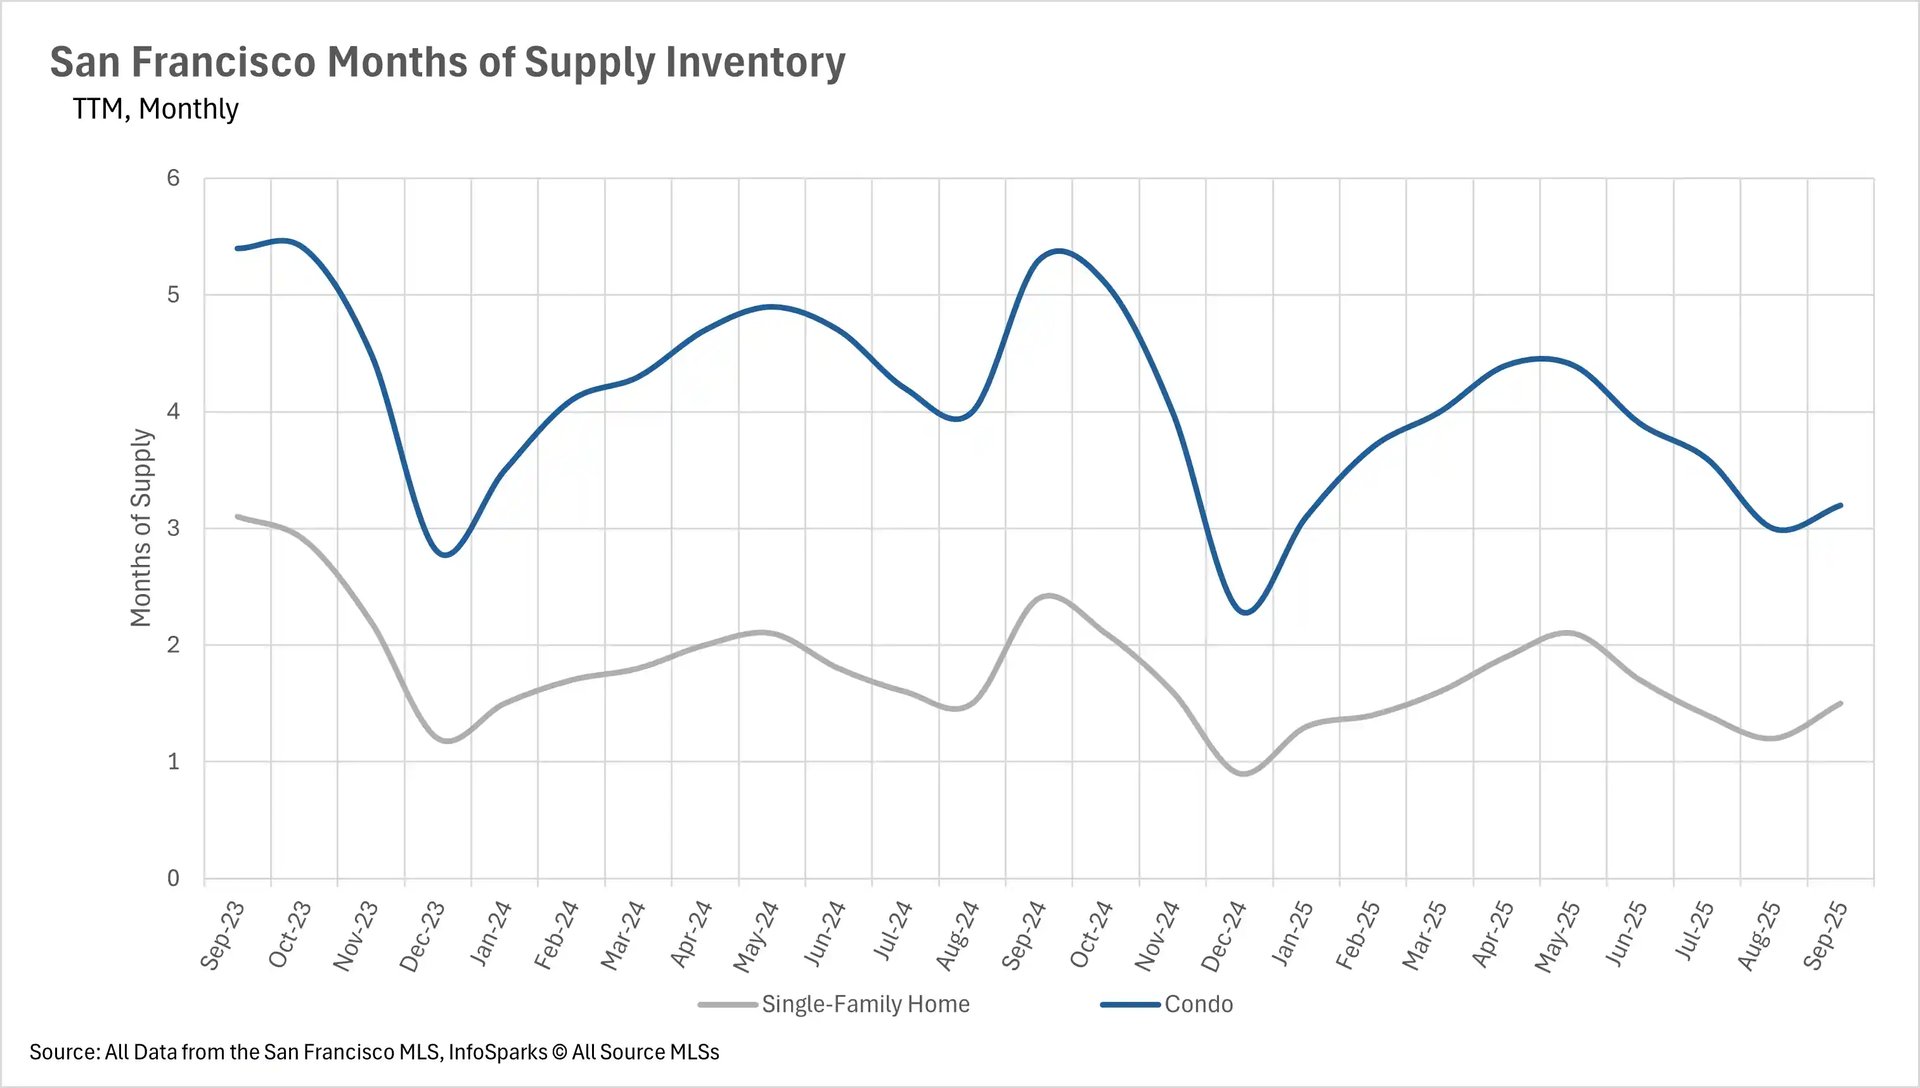
When determining whether a market is a buyers’ market or a sellers’ market, we look to the Months of Supply Inventory (MSI) metric. The state of California has historically averaged around three months of MSI, so any area with at or around three months of MSI is considered a balanced market. Any market that has lower than three months of MSI is considered a seller’s market, whereas markets with more than three months of MSI are considered buyers’ markets.
While the single-family home market has been a heavily entrenched seller's market for quite some time (and it still is, with just 1.5 months of inventory on the market), the condo market has traditionally been more buyer-friendly. However, it’s been creeping closer toward being a seller's market as of late, with the condo market reporting just 3.2 months' worth of active inventory on the market in September.
Ready to make your next move in San Francisco real estate? Contact our team today for personalized guidance tailored to your specific needs and goals.