Select a Market Report to Read:
The Local Lowdown
Quick Take:
- Median sale prices for condos fell precipitously in Silicon Valley this month.
- Inventory levels have overcorrected and are now lower than they were last year.
- Listings are spending much more time on the market than this time last year.
Note: You can find the charts/graphs for the Local Lowdown at the end of this section.
*National Association of REALTORS® data is released two months behind, so we estimate the most recent month's data when possible and appropriate.
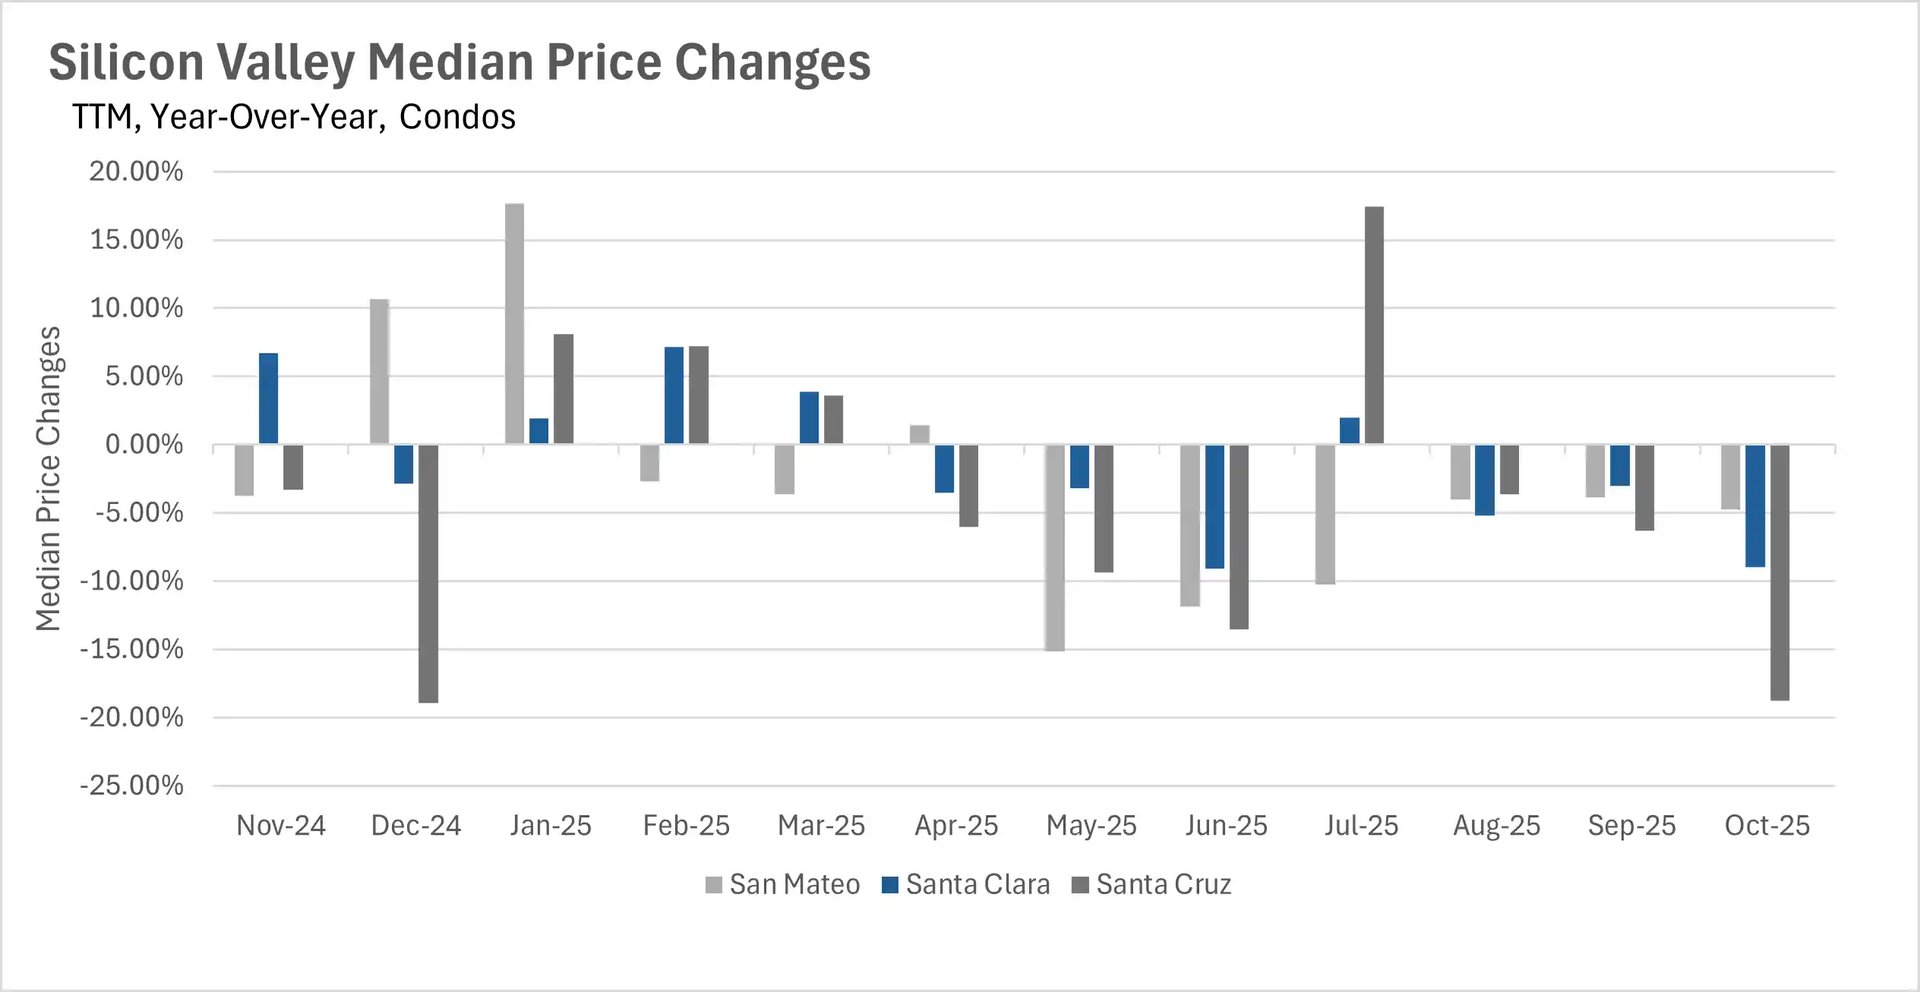
Condo median sale prices fell once again
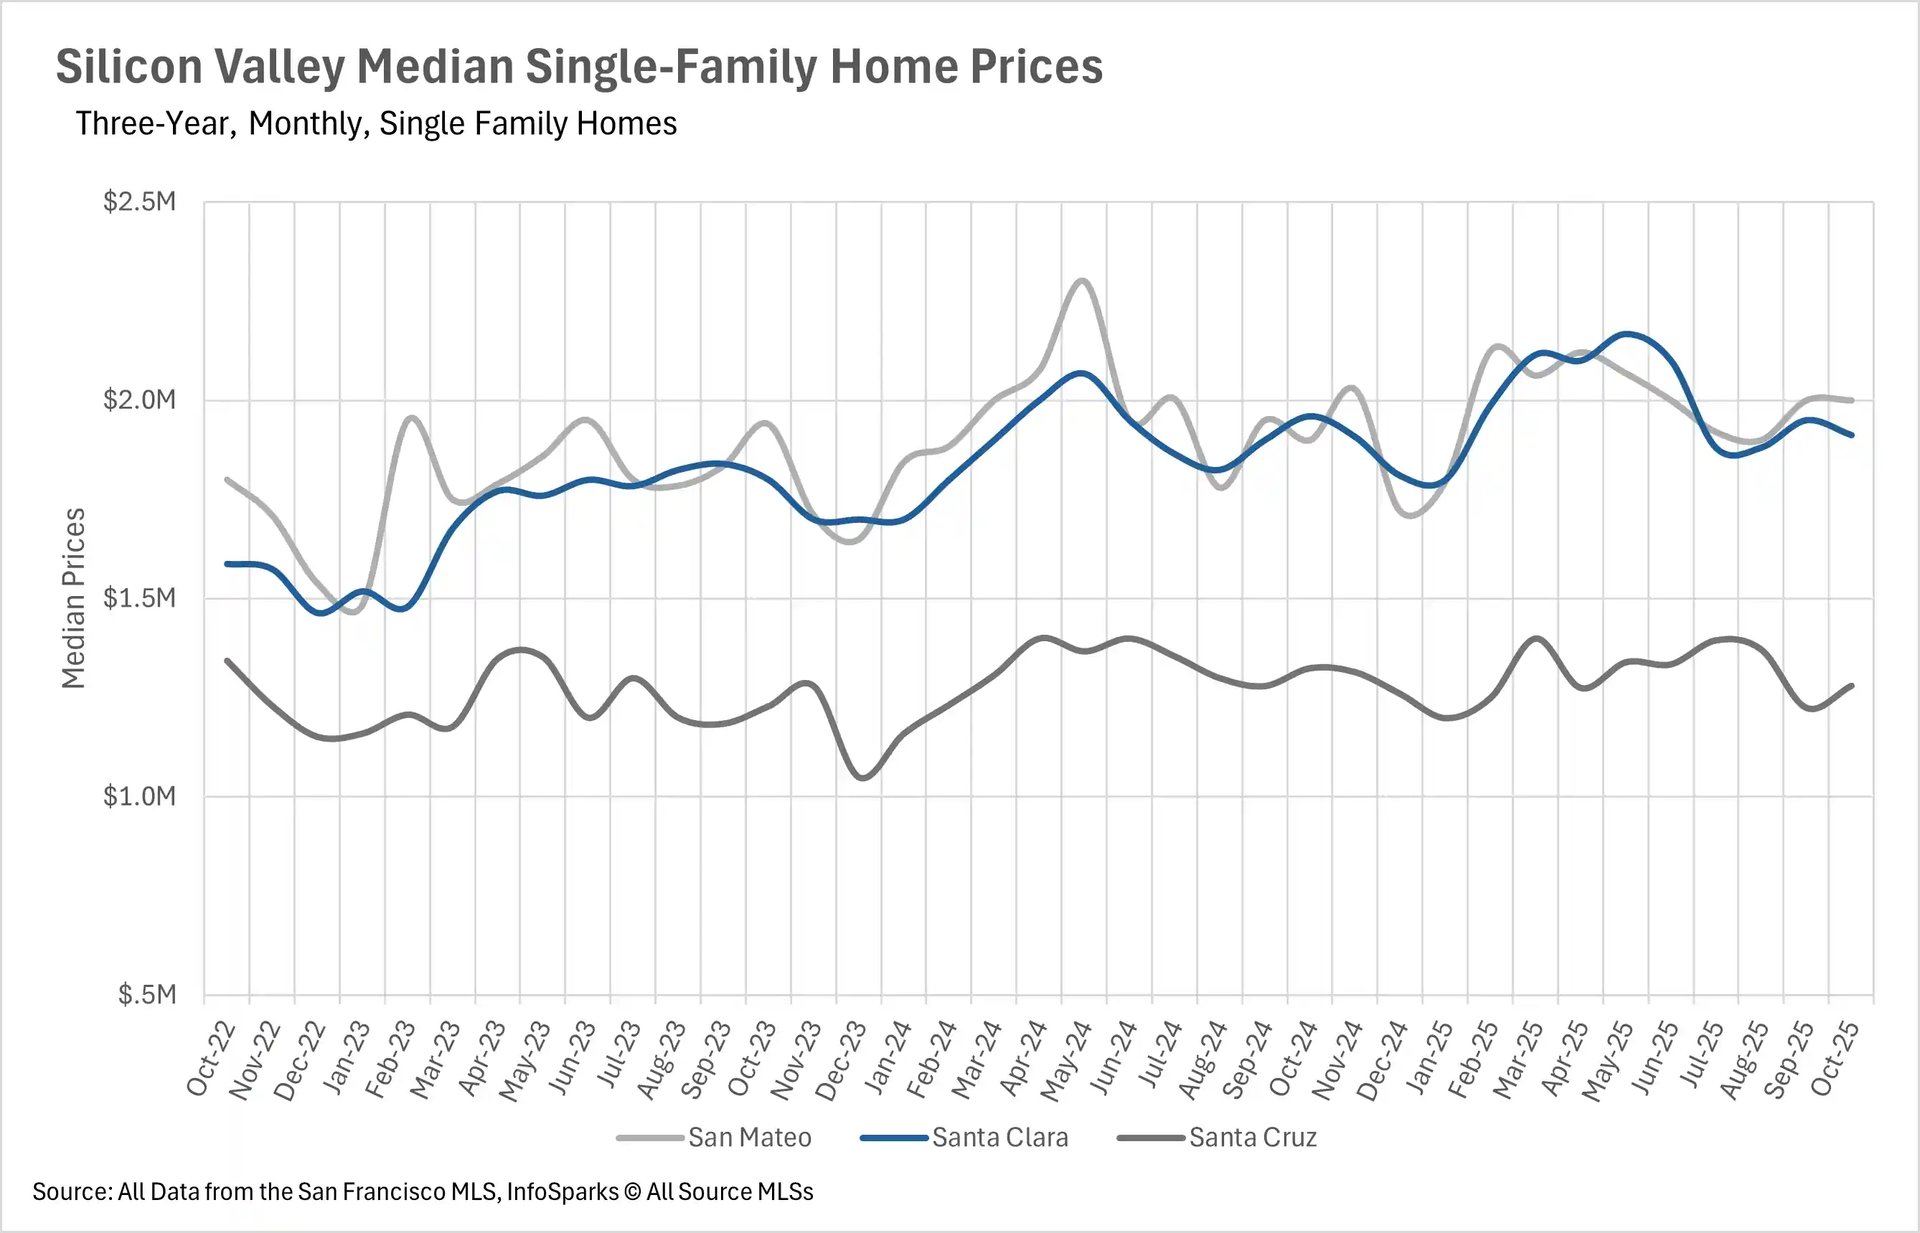
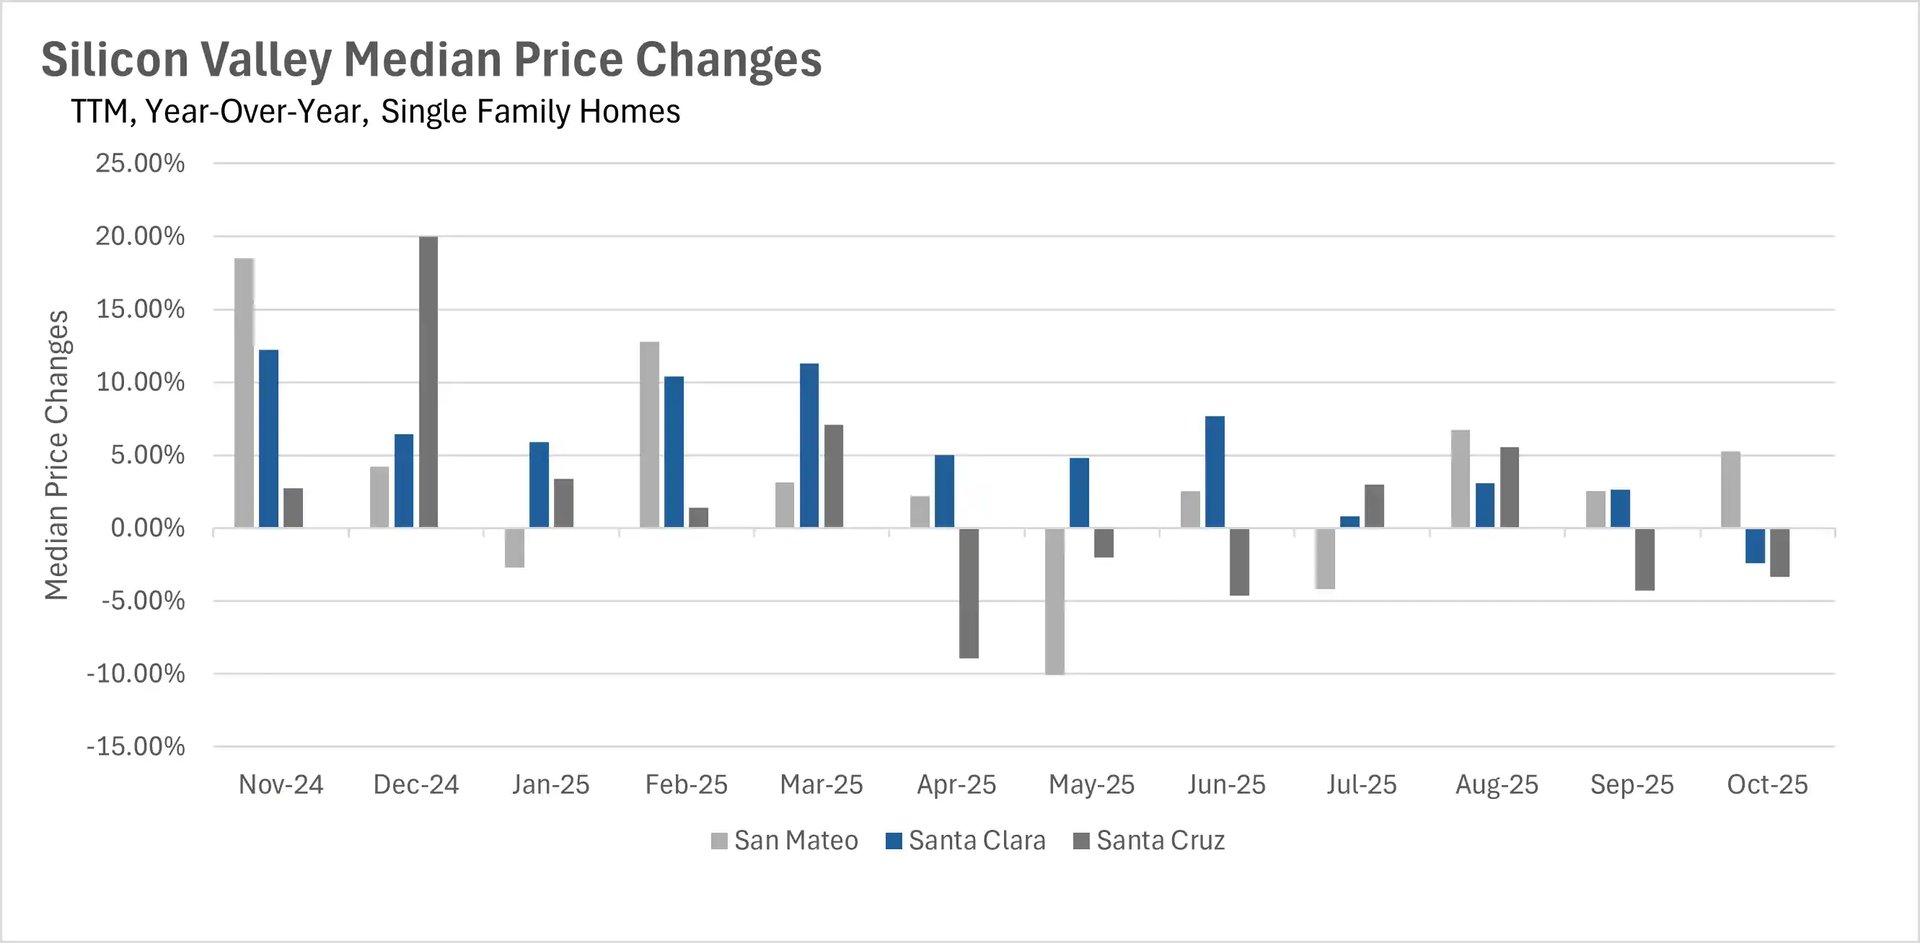
Last month, median sale prices for single-family homes were fairly stable, as they traded roughly within the band that they typically sell for. We saw the median single family in San Mateo County sell for 5.26% more than it did last year, while median single-family homes in Santa Clara and Santa Cruz Counties sold for 2.42% and 3.33% less than they did last year. However, last month the condo market was much more volatile, as condo prices decreased year-over-year throughout Silicon Valley. The median listings in San Mateo, Santa Clara, and Santa Cruz Counties sold for 4.73%, 8.97%, and 18.77% less than they did around this time last year!
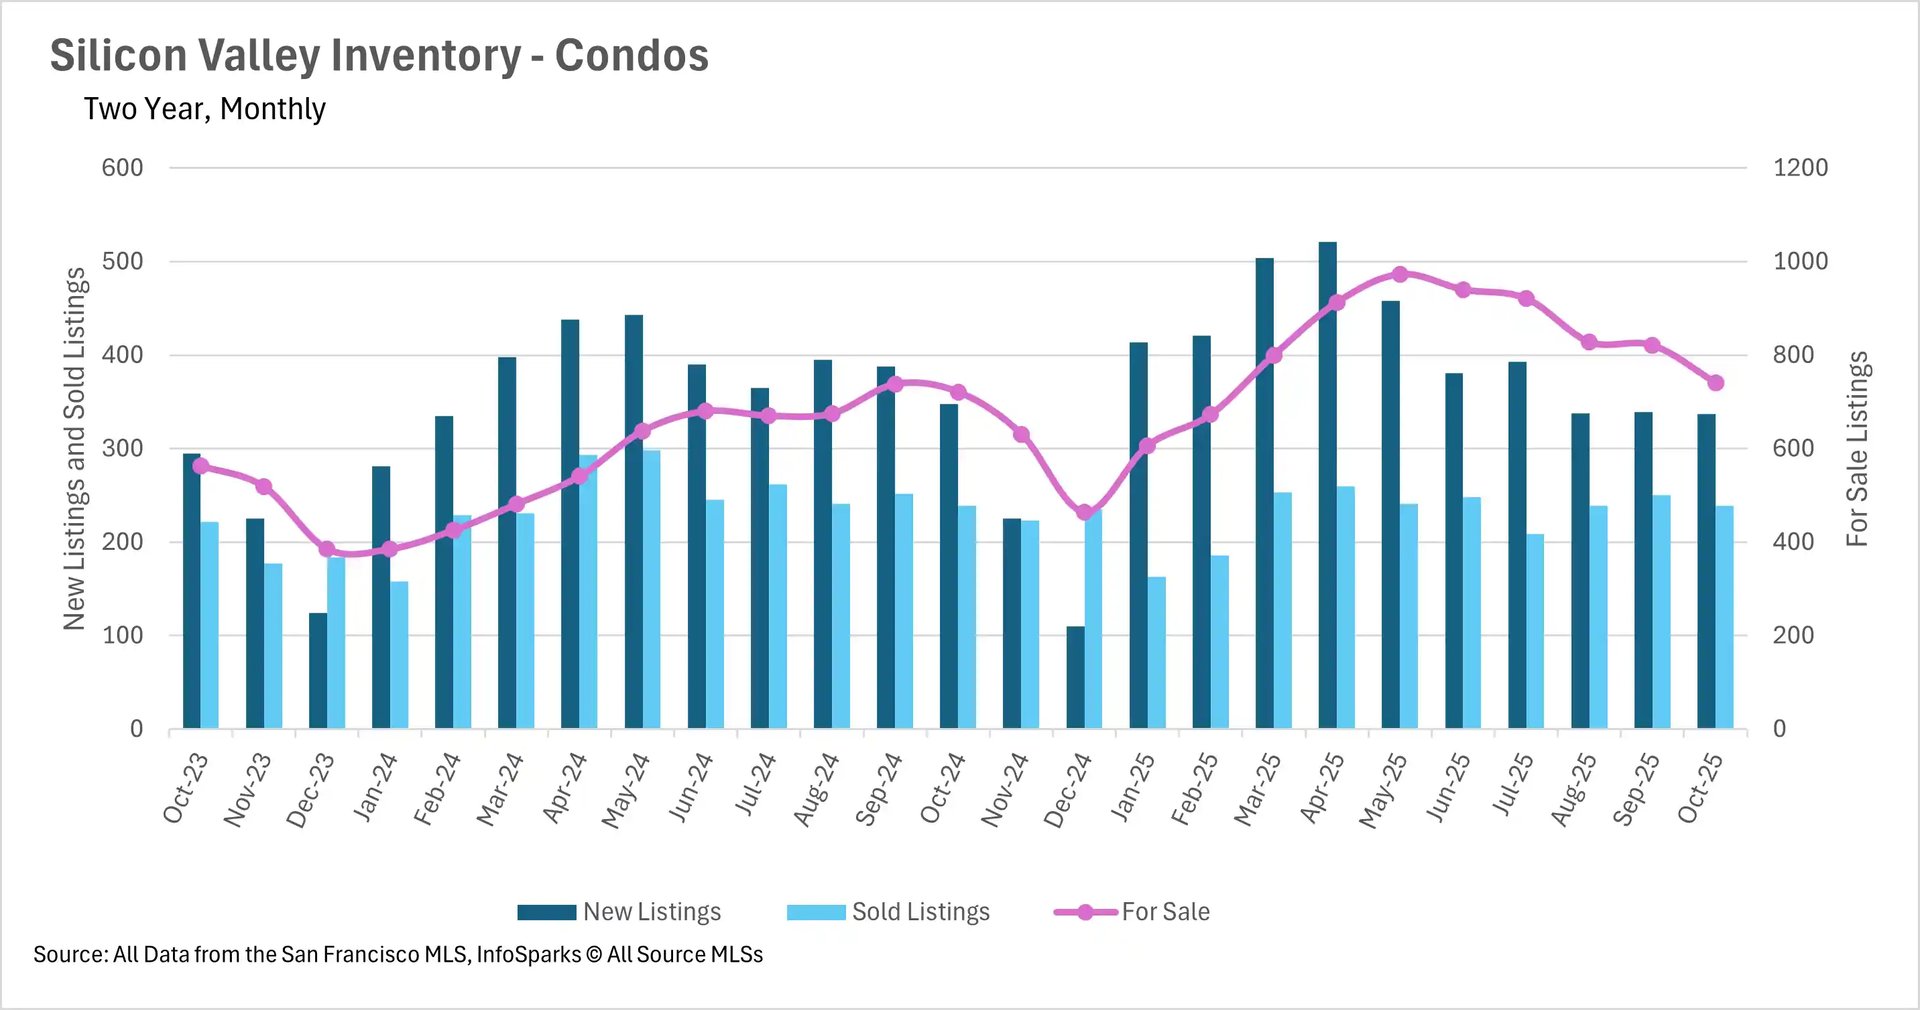
The inventory overcorrection
Like much of the rest of the state of California (and the broader country), inventories increased pretty dramatically in Silicon Valley throughout much of 2025. However, we’ve seen quite the reversal of this trend in the single-family home market. The single-family home market in Silicon Valley closed out the month of October with 8.72% fewer active listings than it had just one year ago, and 15.22% fewer active listings than the prior month. Much of this move can be attributed to the fact that there were 5.89% fewer new listings hitting the market, with roughly the same number of listings sold on a year-over-year basis. The condo market is also seeing this correction, although not nearly as drastically, with there currently being 2.77% more active condo listings when compared to last year.
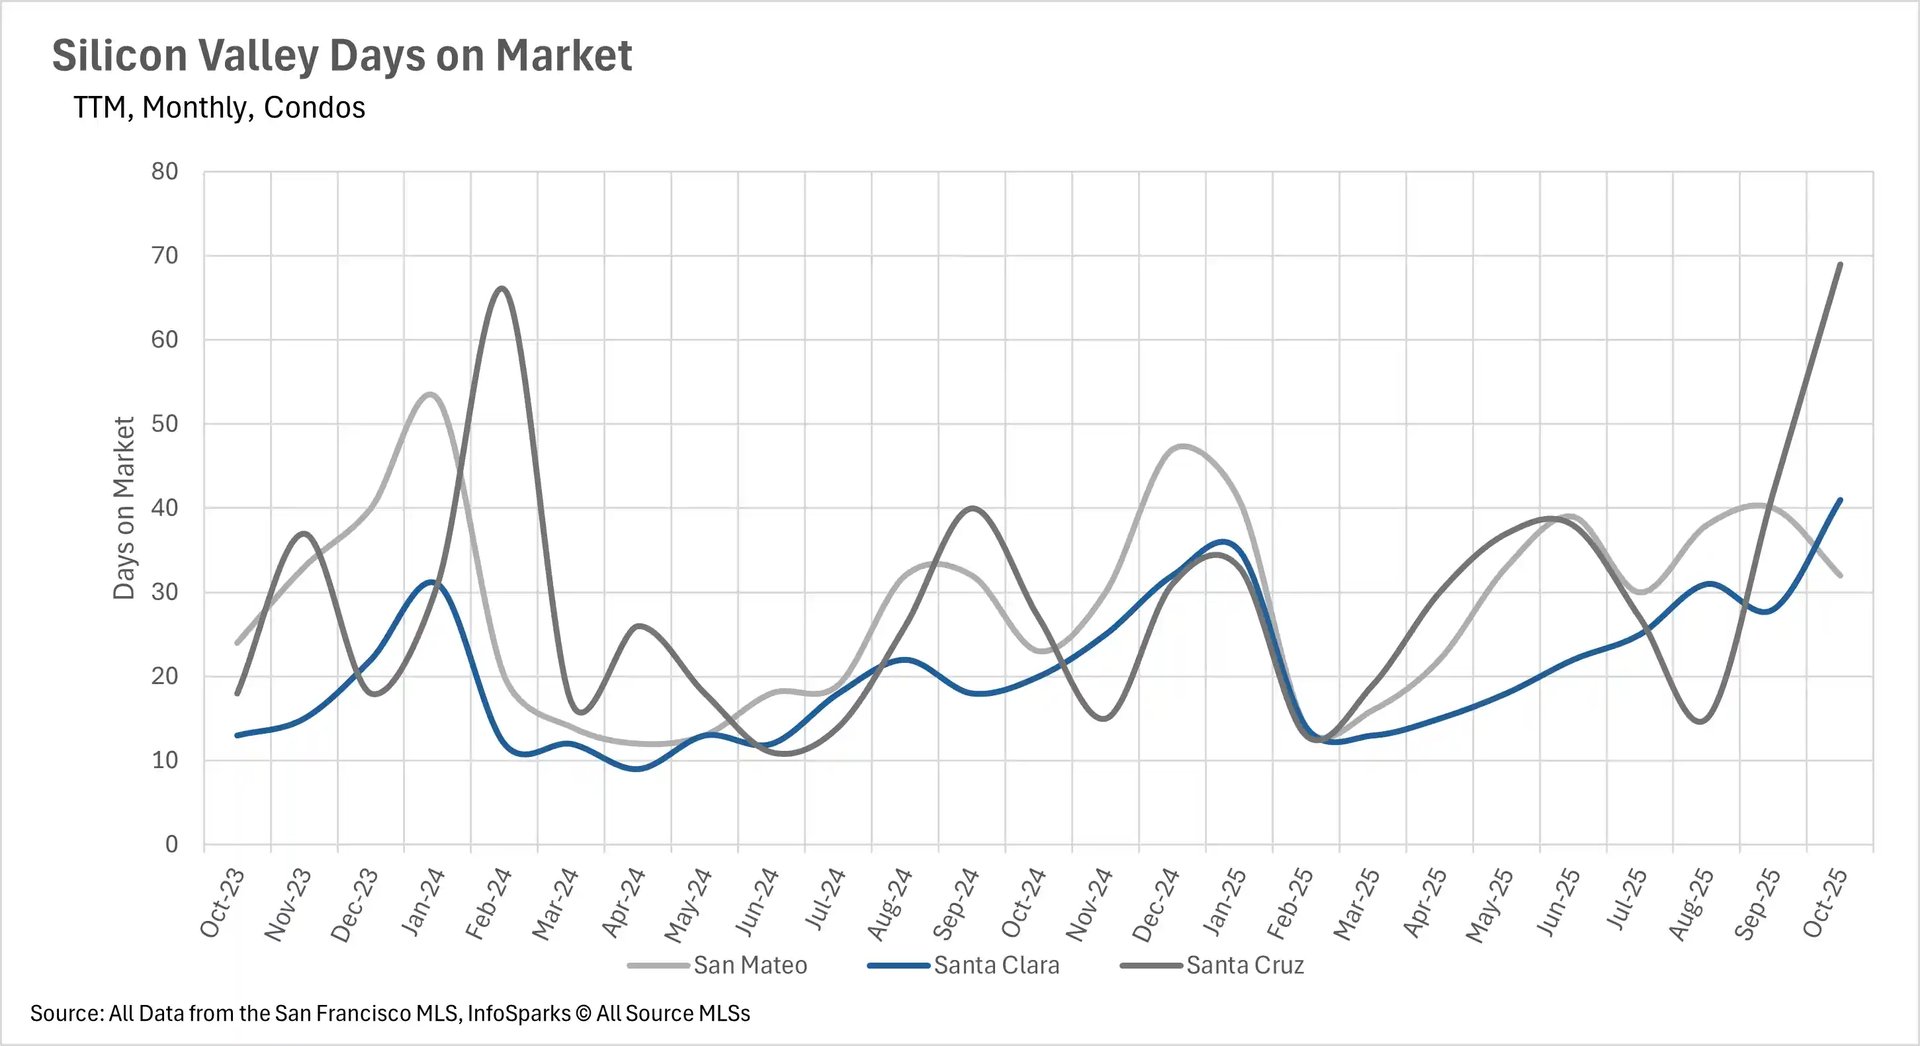
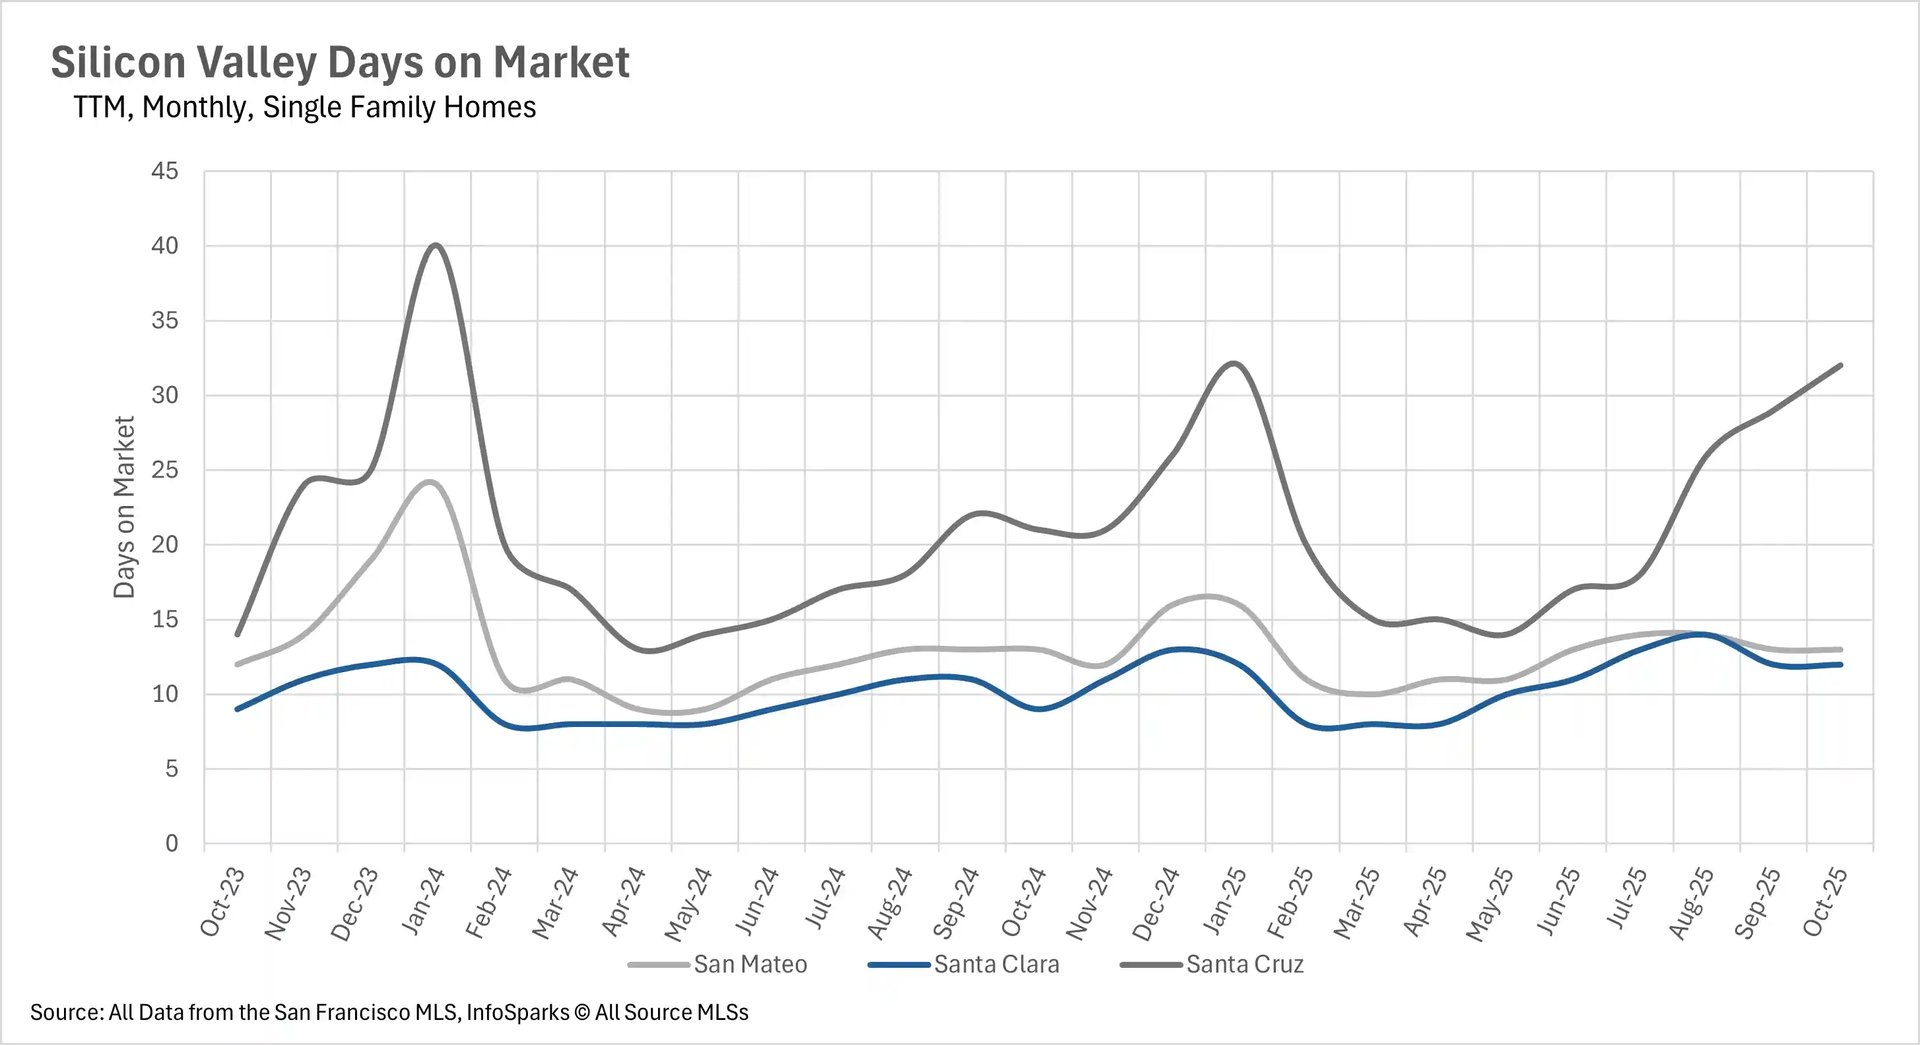
Most condos spend more than twice as much time on the market?
Although we saw some pretty drastic moves on a percentage basis in the single-family home market in terms of average days on market, single-family listings are still moving relatively quickly. The average single-family home in San Mateo and Santa Clara Counties spends 13 and 12 days on the market, respectively. However, the average Santa Cruz County single-family home listing is spending 32 days on the market, representing a 52.38% year-over-year increase. When we turn to the condo market, we see a much different picture being painted, though. San Mateo condos are spending 32 days on the market, representing a 39.13% increase, and Santa Clara and Santa Cruz County condos are spending more than twice as much time on the market as they did last year, with it taking 41 and 69 days for the average listing to sell, respectively. This represents a 105% and a 155.56% year-over-year increase!
The single-family home market remains incredibly competitive
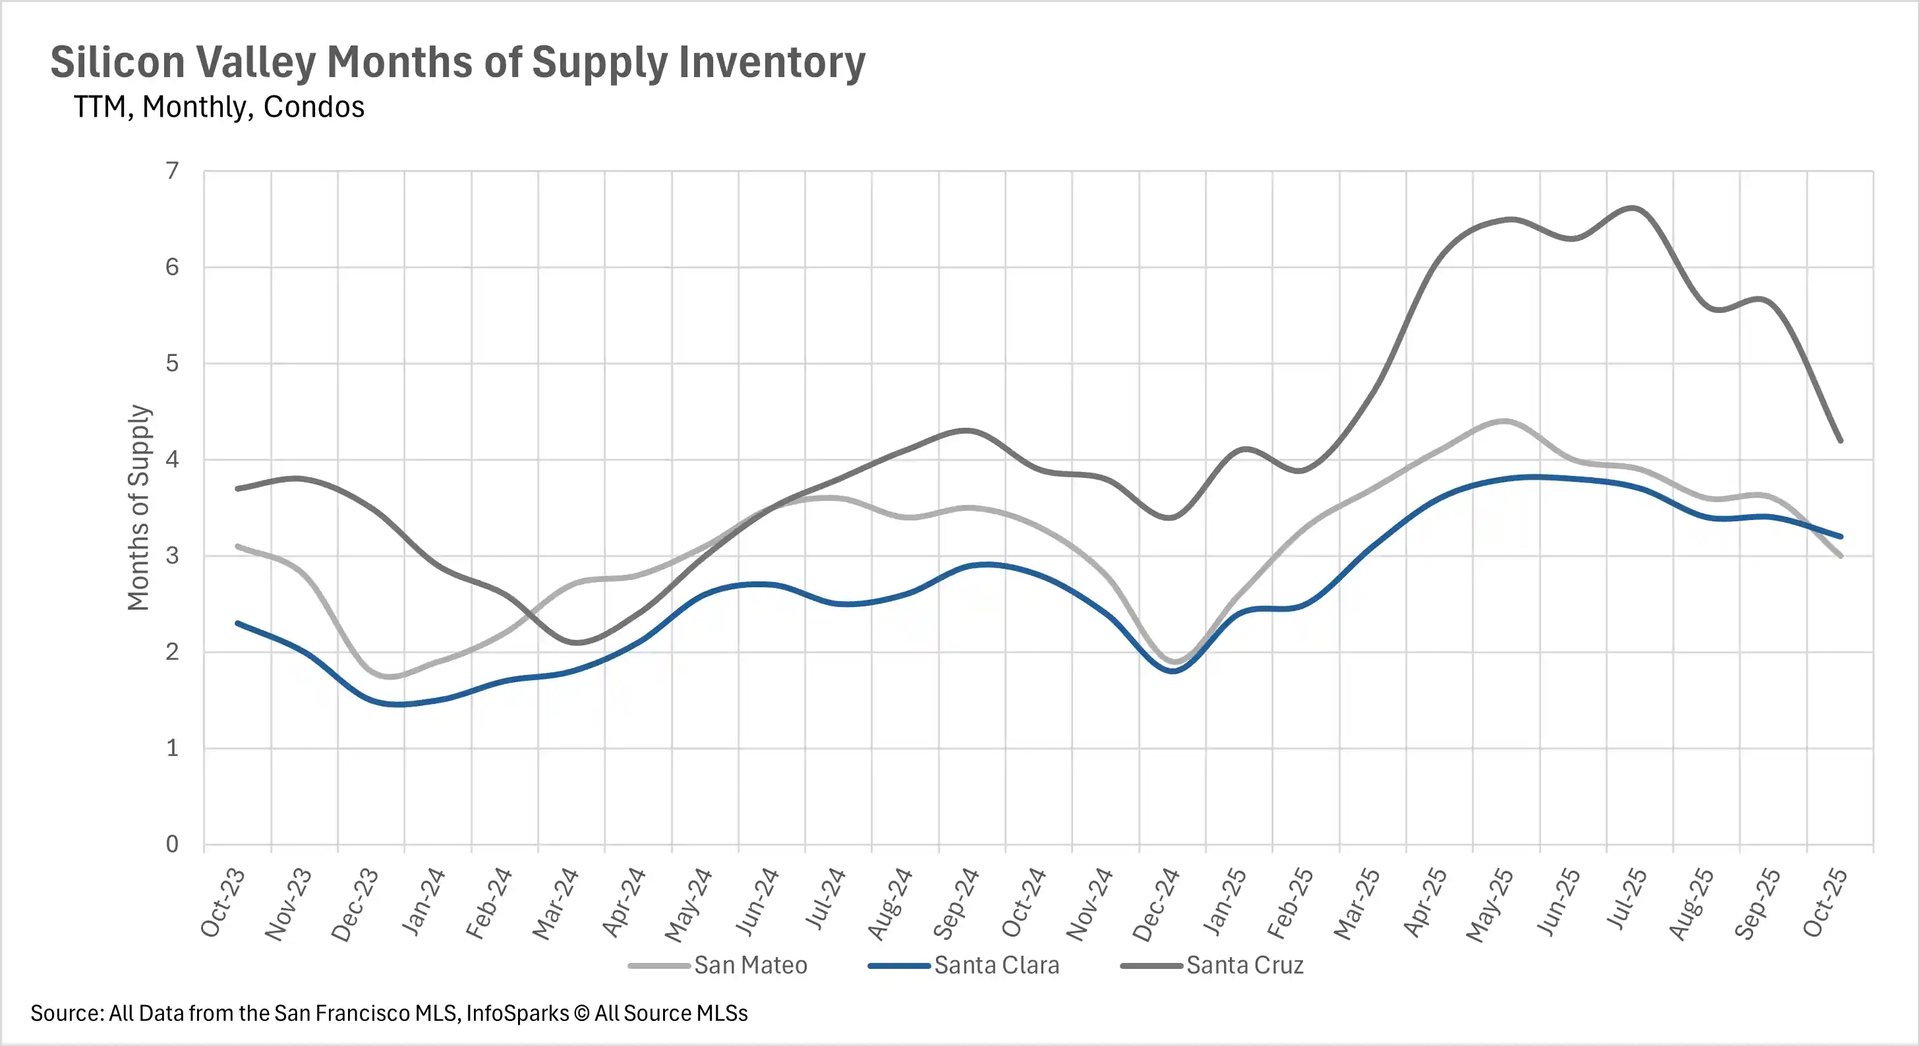
When determining whether a market is a buyers’ market or a sellers’ market, we look to the Months of Supply Inventory (MSI) metric. The state of California has historically averaged around three months of MSI, so any area with at or around three months of MSI is considered a balanced market. Any market that has lower than three months of MSI is considered a sellers’ market, whereas markets with more than three months of MSI are considered buyers’ markets.
As per usual, the single-family home market is incredibly competitive, with San Mateo and Santa Clara Counties having 1.5 and 1.3 months of supply on the market respectively. Santa Cruz County is creeping back toward balanced territory with 3.5 months of supply on the market. When we turn to the condo market, Santa Clara and Santa Cruz Counties are buyers markets, with 3.2 and 4.2 months of supply on the market, respectively. On the other hand, San Mateo County has become more balanced, with exactly 3 months of supply on the market.