Luxurious outdoor living space featuring a wooden pergola with slatted roof casting striped shadows over a deck area. Two white-and-gray striped lounge chairs in foreground, woven dining set with natural wood chairs centered under an elegant beaded chandelier.

East Bay Real Estate - November 2025 Market Report

Select a Market Report to Read:

The Local Lowdown

Quick Take:

  • Median sale prices for condos continue to lag where they were last year.
  • Inventories are surprisingly static on a year-over-year basis
  • Listings are spending a lot more time on the market than they were last year.

Note: You can find the charts/graphs for the Local Lowdown at the end of this section.

*National Association of REALTORS® data is released two months behind, so we estimate the most recent month's data when possible and appropriate.

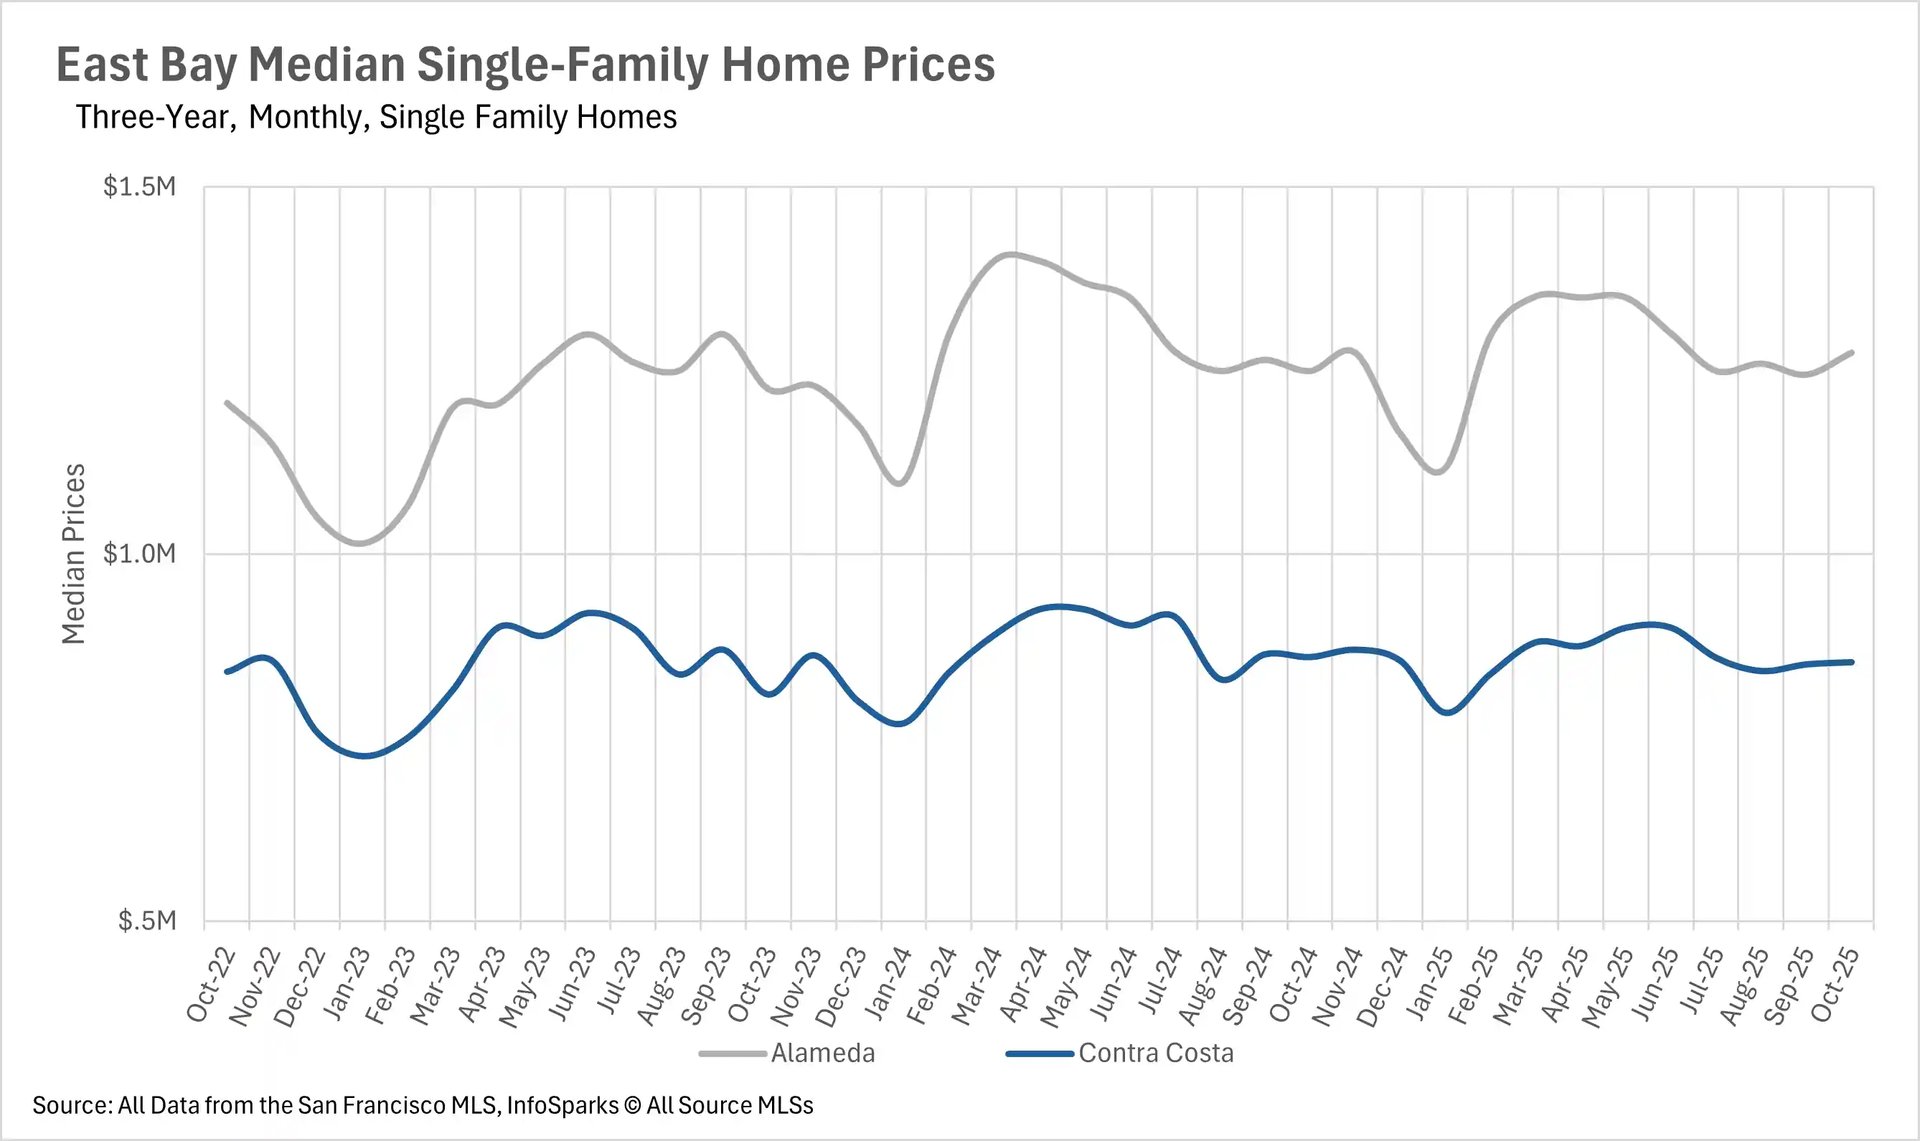
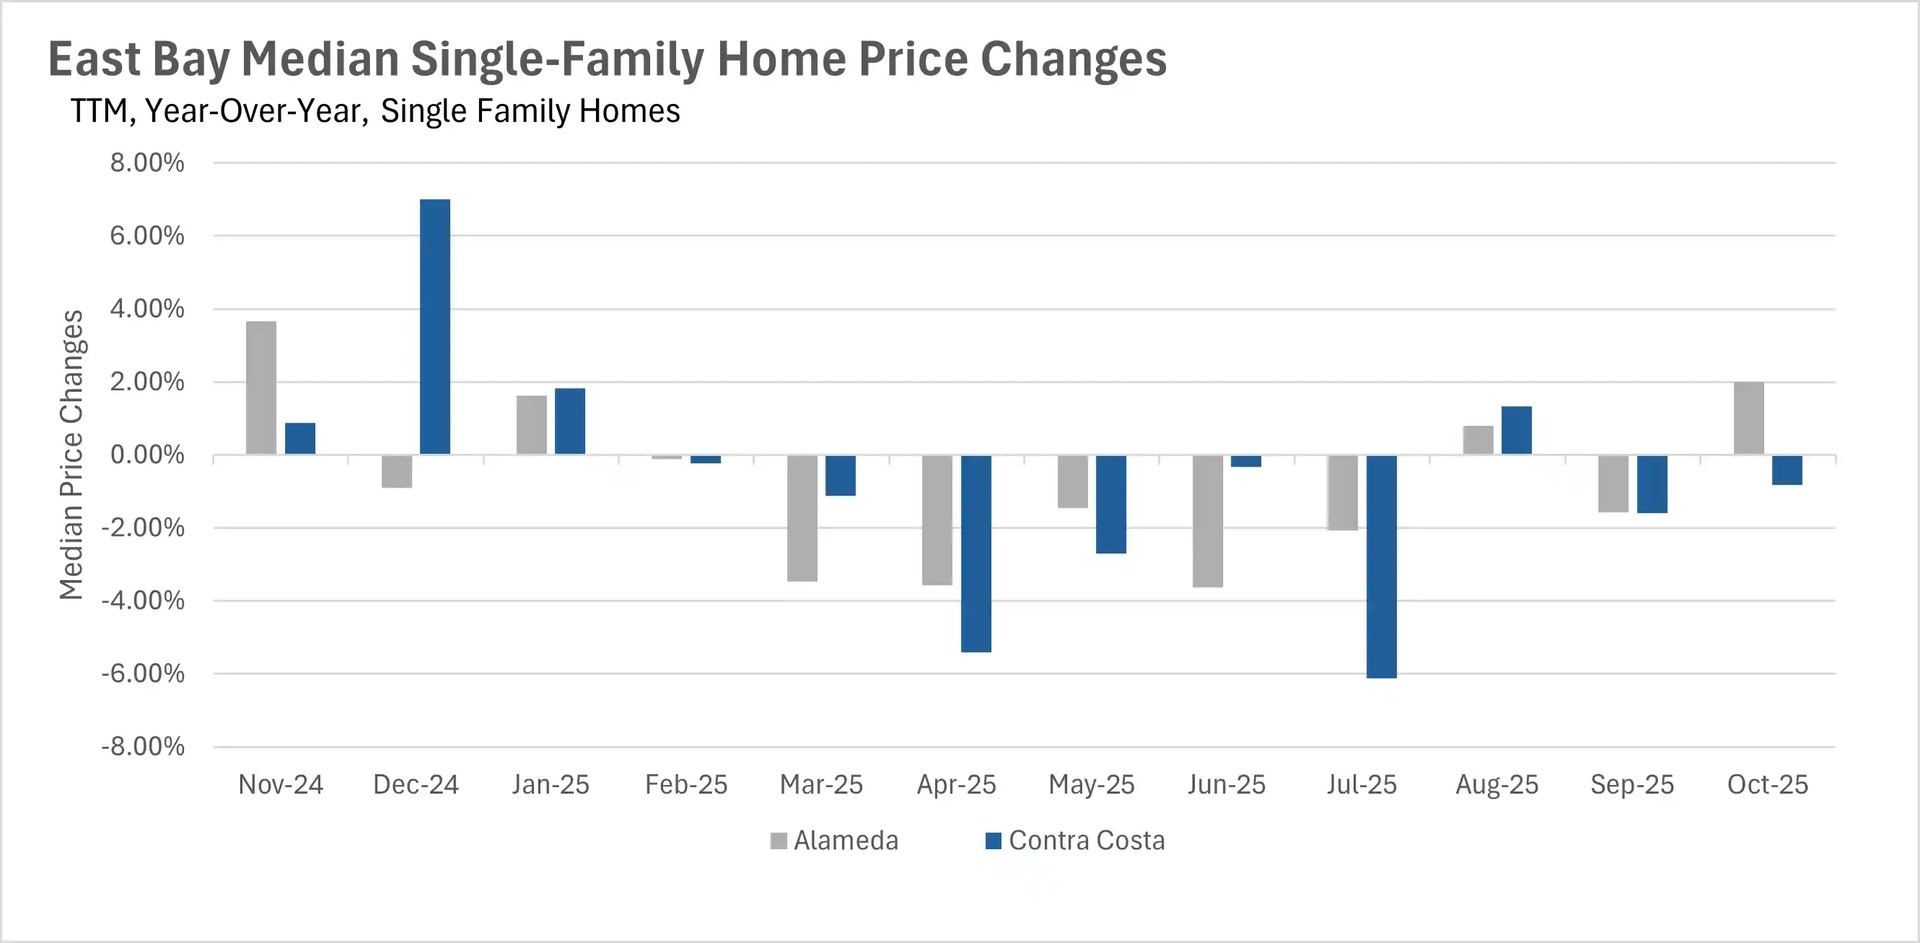
Little change in single-family home pricing, but condos continue to lag

There was very little change in the single-family home market in the month of October, with the median sale price increasing by 2.00% in Alameda County, and decreasing by 0.81% in Contra Costa County. However, there were some movements in the condo market. This month, the condo market extended its losing streak, as the median condo in Alameda County sold for 9.38% less than it did last year, and the median condo in Contra Costa County sold for 7.69% less than last year. Although these are drastic year-over-year decreases, the market is overall fairly stable, with homes holding their value in the band they’ve created for themselves over the past 8-10 months.

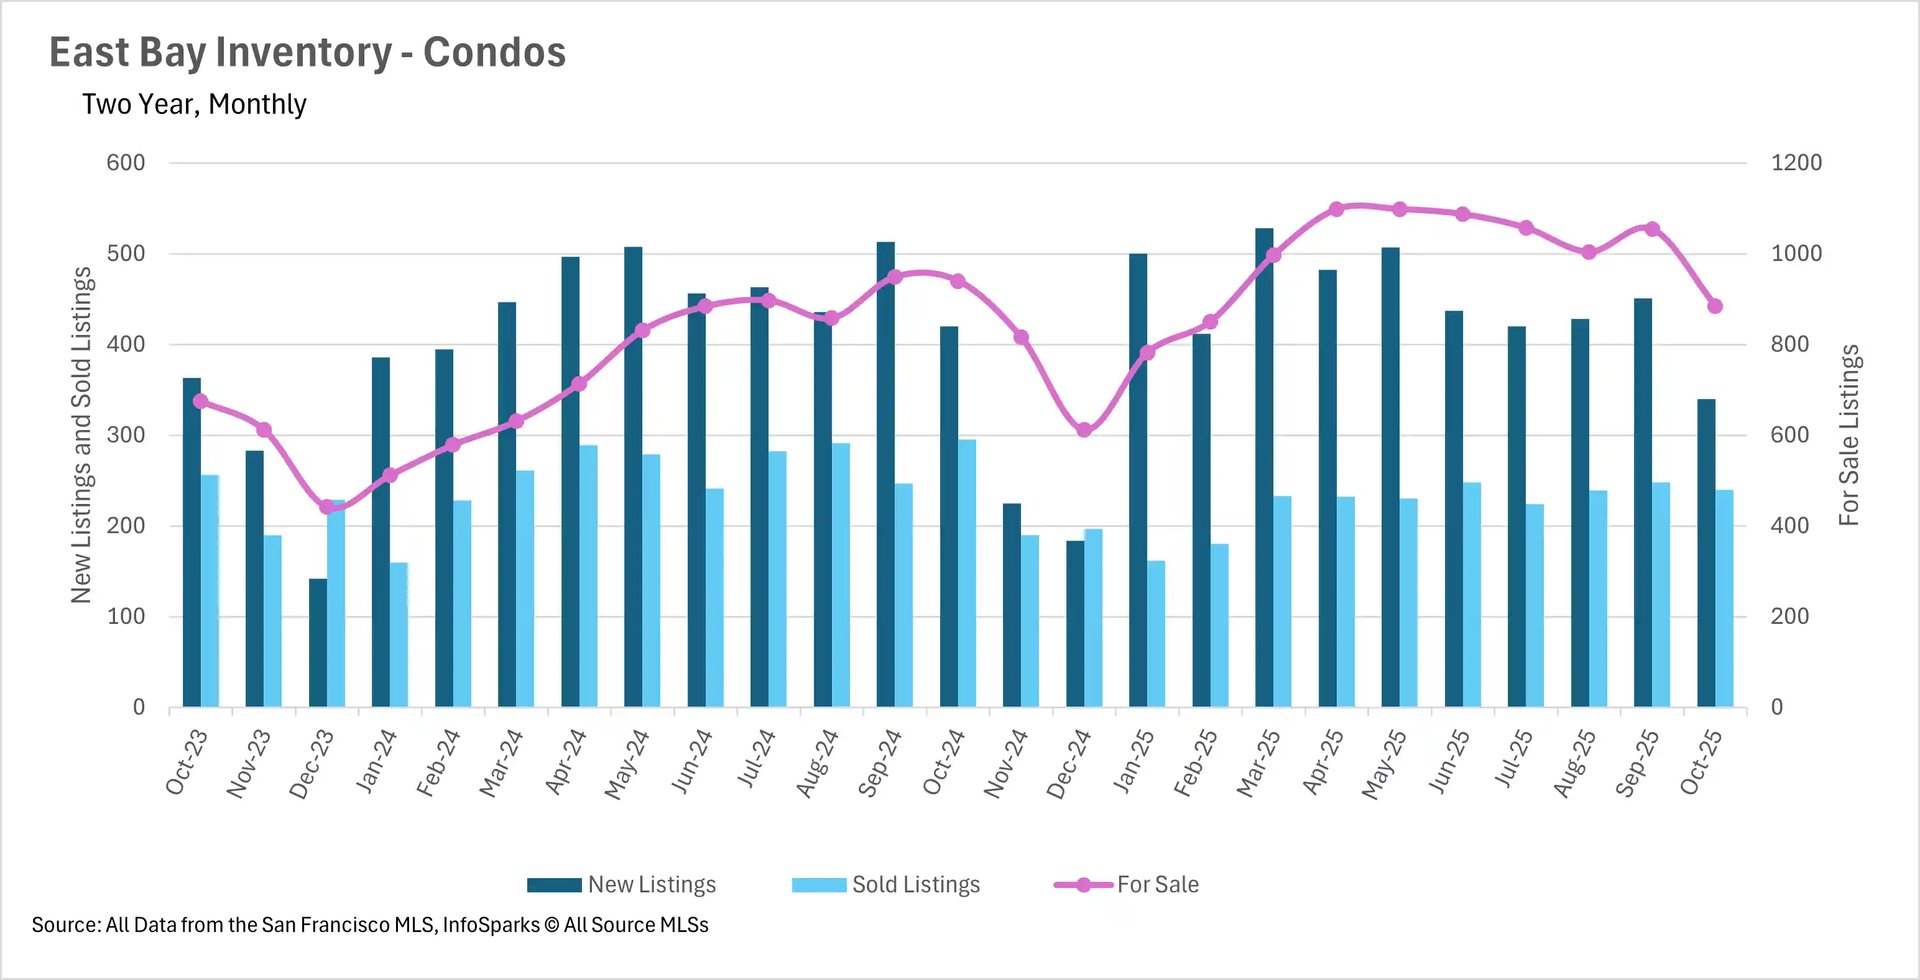
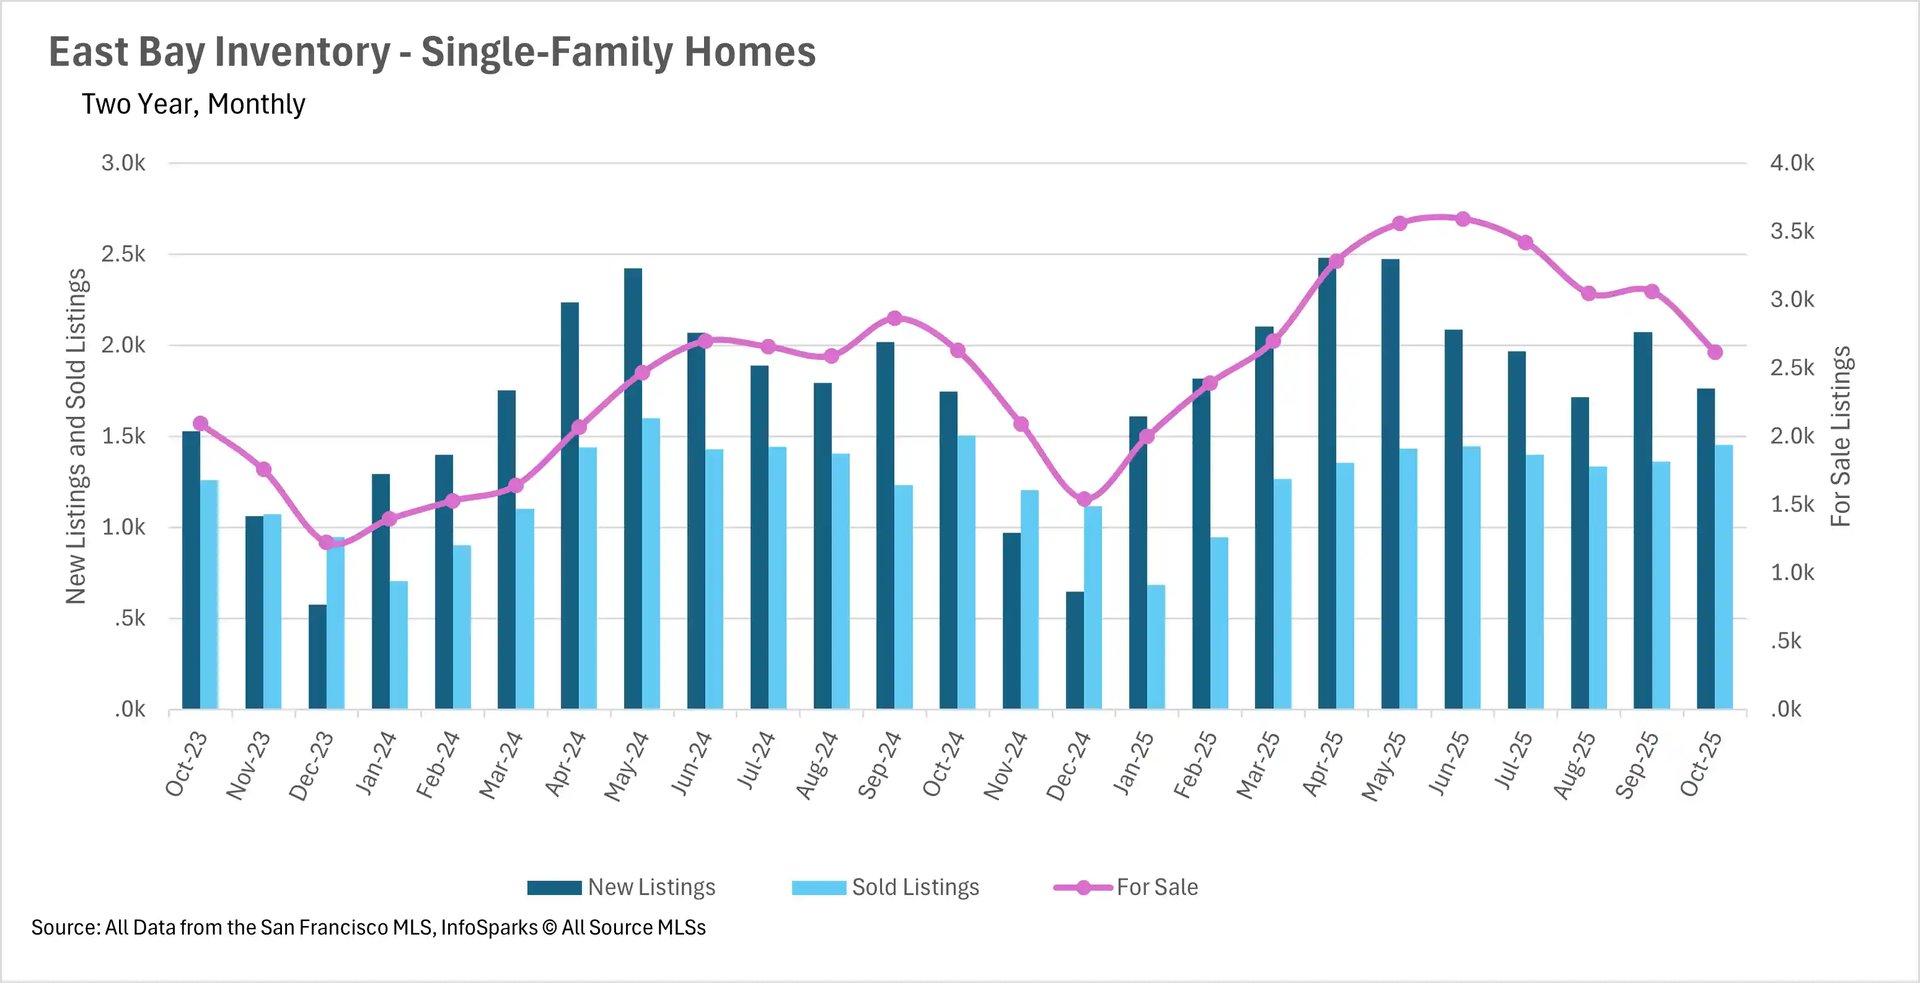
Some interesting developments in condo market inventory levels

Once again, things were more or less business as usual in the single-family home market this month. However, the condo market saw some interesting developments in terms of inventory levels. In the month of October, we saw 19.05% fewer condos listed, and 18.64% fewer condos sold. Active inventory also decreased by 5.85% on a year-over-year basis. It’ll be important to pay attention to how this market evolves over the seasonally slow winter months, as dwindling inventories might drive prices up over time.

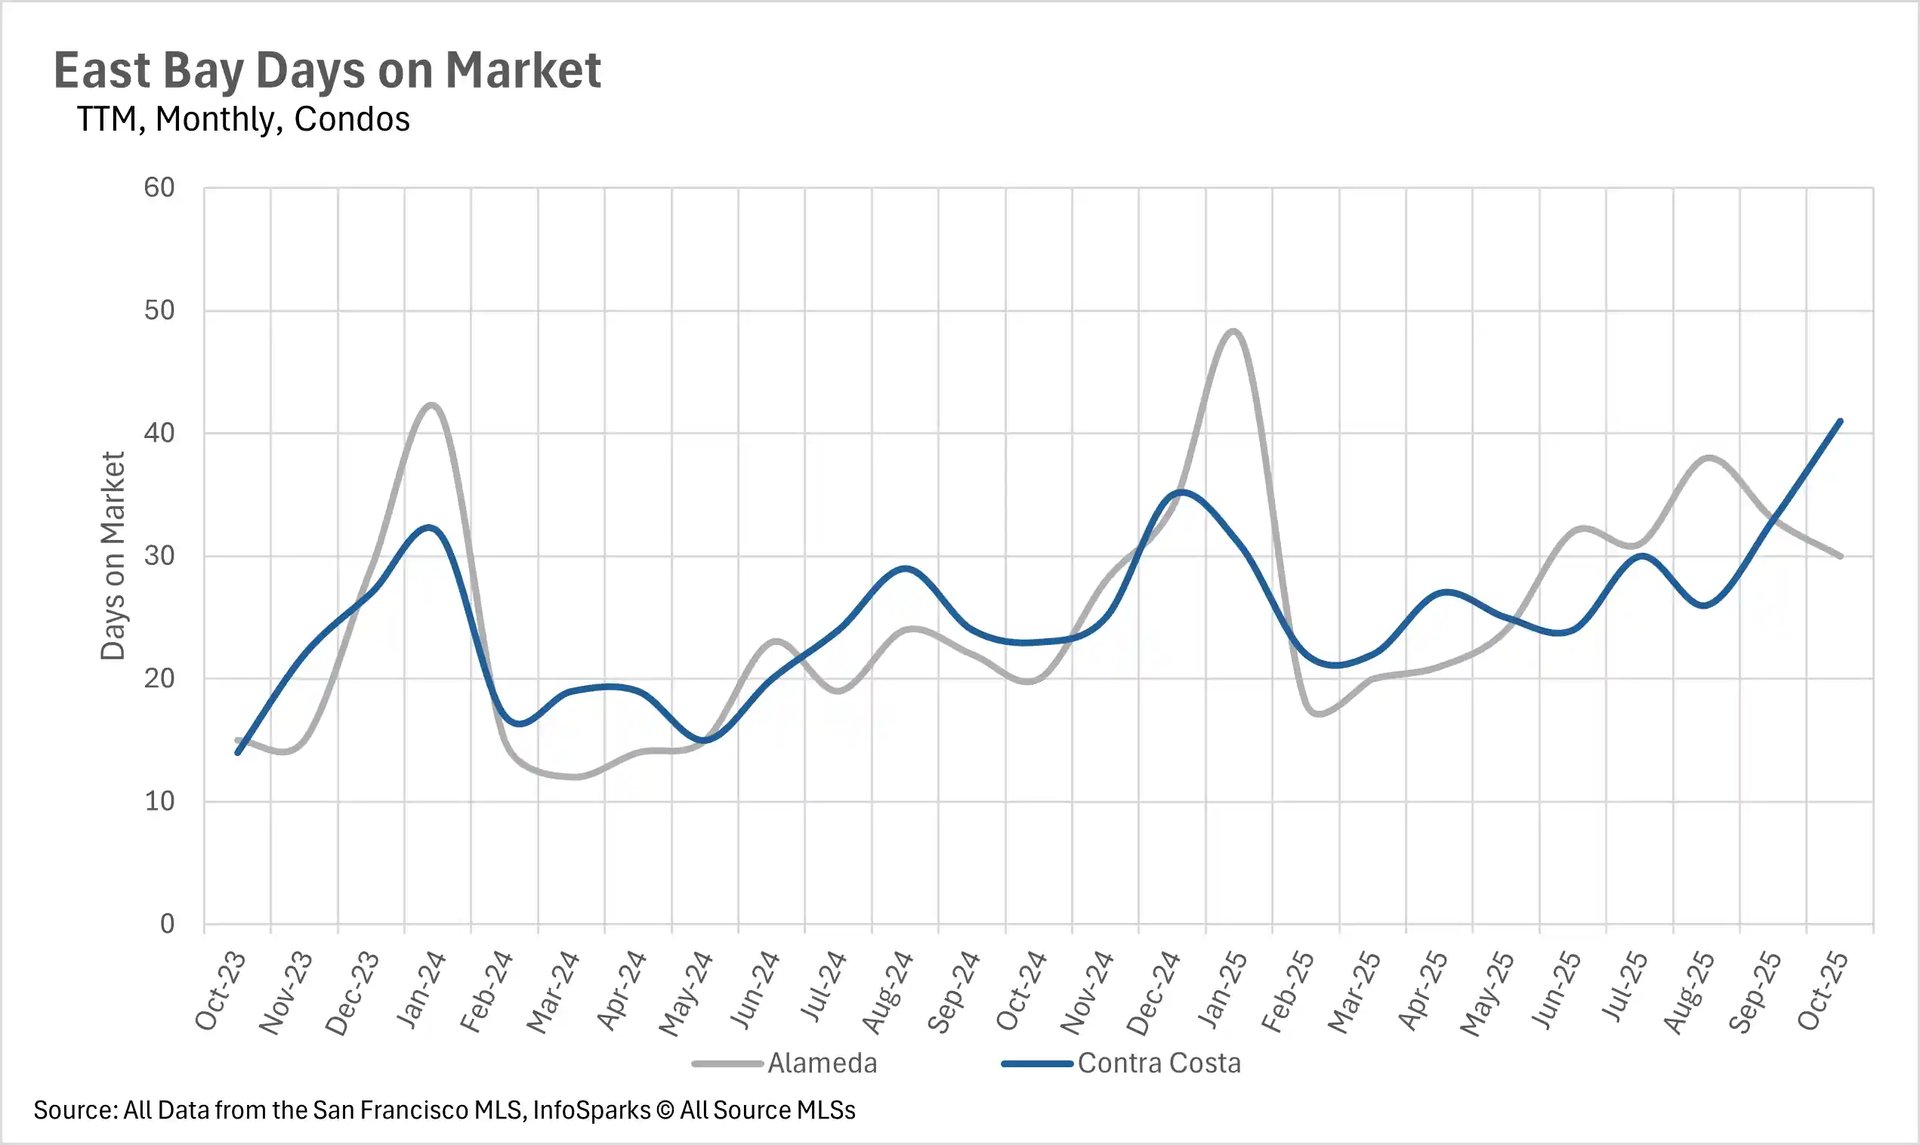
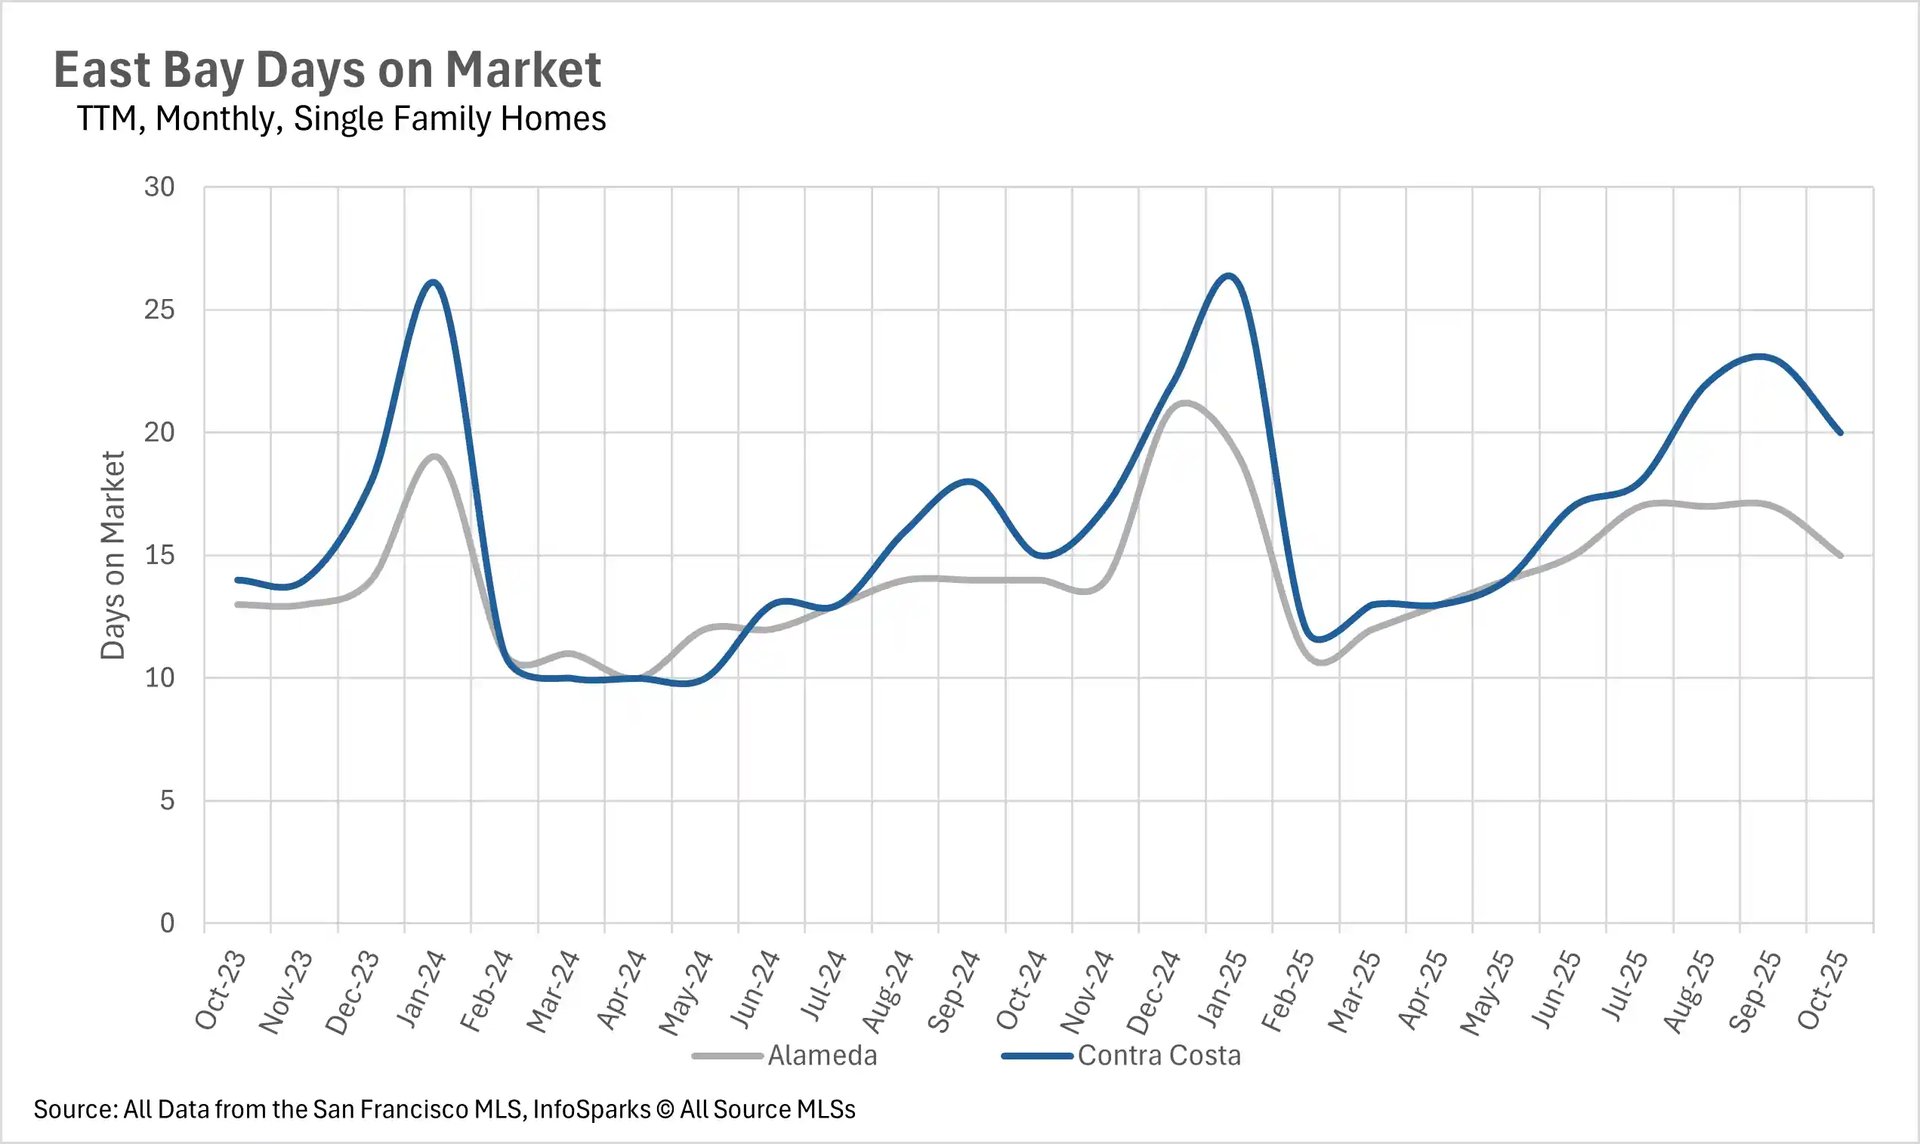
Listings are sitting for quite a bit longer than they did last year

In both the single-family and condo markets, listings are sitting on the market for quite a bit longer than they did around this time last year. The average single-family home in Alameda County saw a 7.14% increase in days on market on a year-over-year basis, which seems like a lot. However, these listings still move relatively quickly, with the average listing sold in 15 days. Contra Costa County single-family homes spend an average of 20 days on the market, representing a 33.33% increase year-over-year. When we turn to the condo market, listings are spending many more days on market, with the average listing in Alameda County selling in 30 days (a 50.00% increase year-over-year), and the average listing in Contra Costa County selling in 41 days (a 78.26% increase year-over-year)

The single-family market is still very competitive, while the condo market is more buyer-friendly

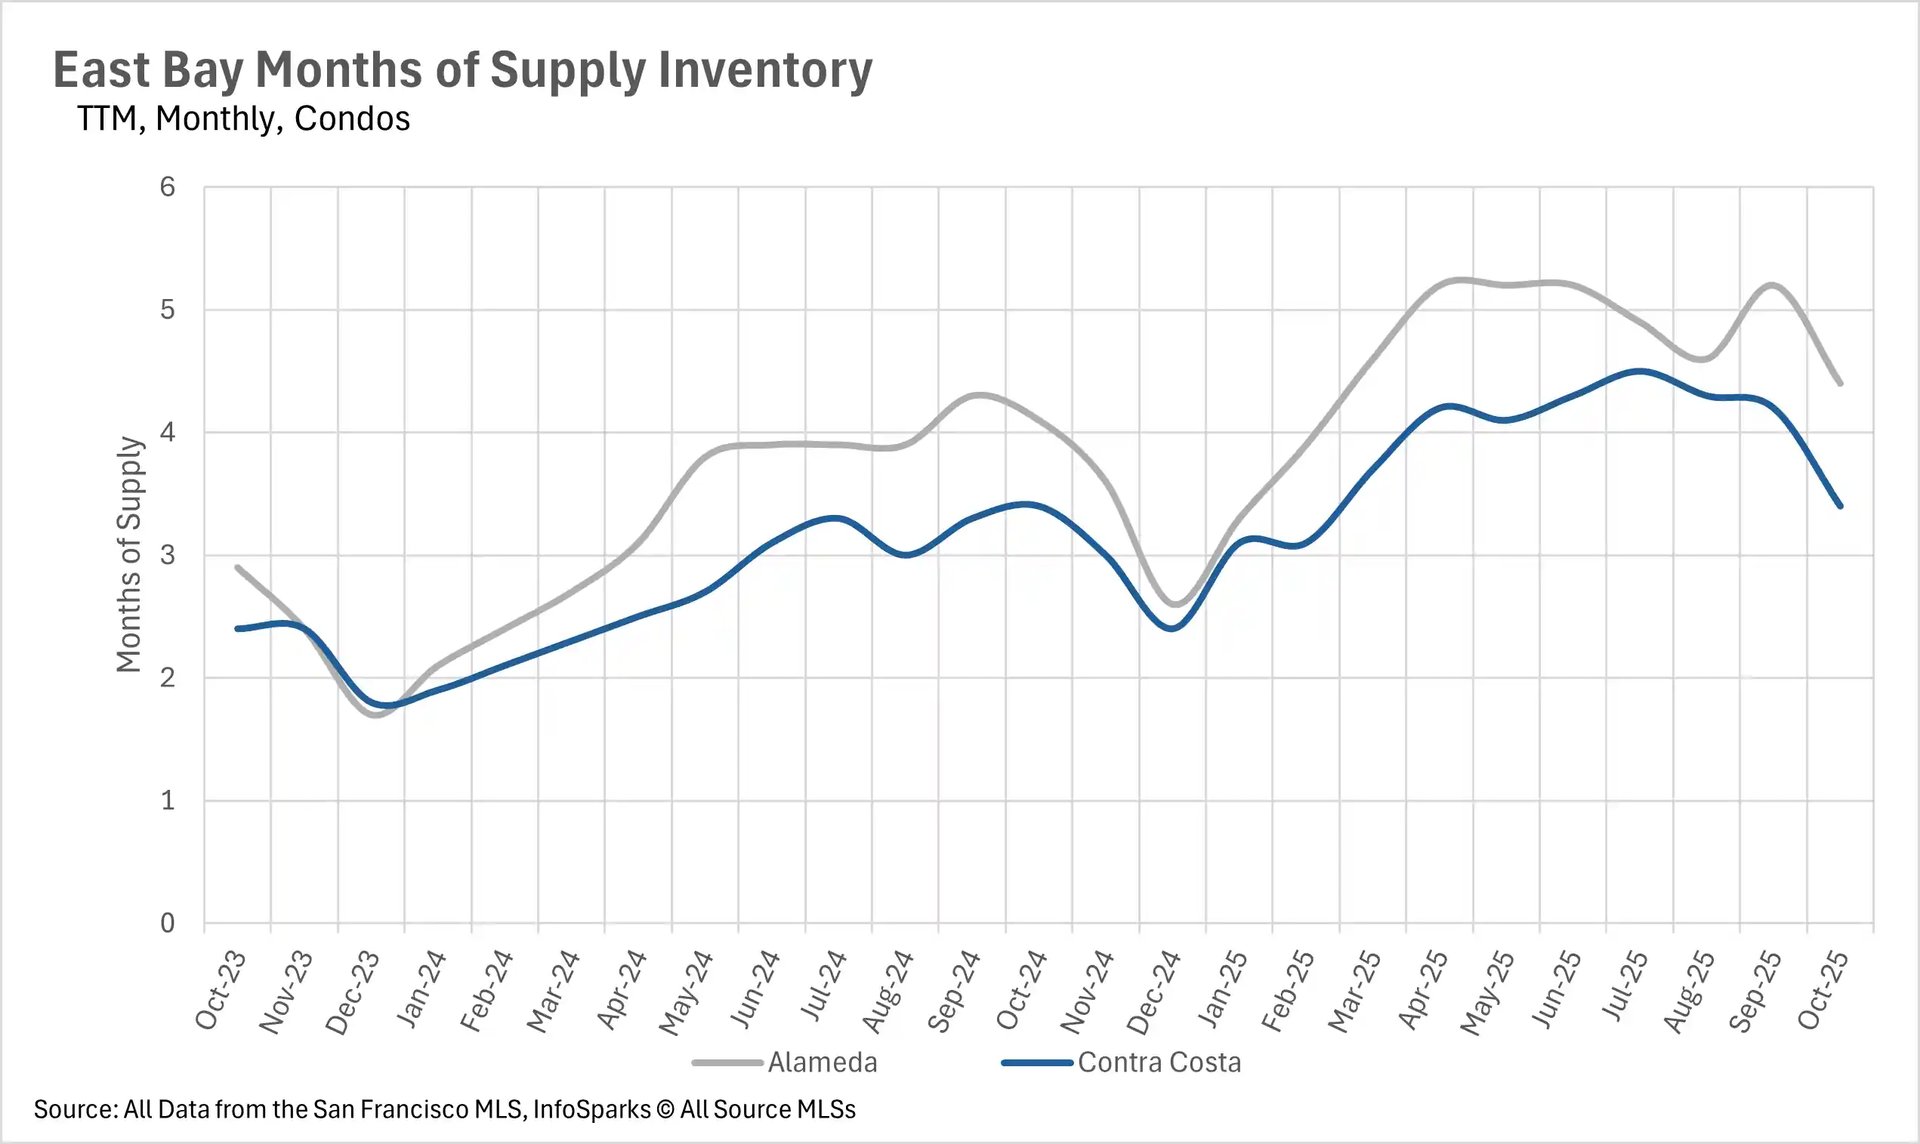
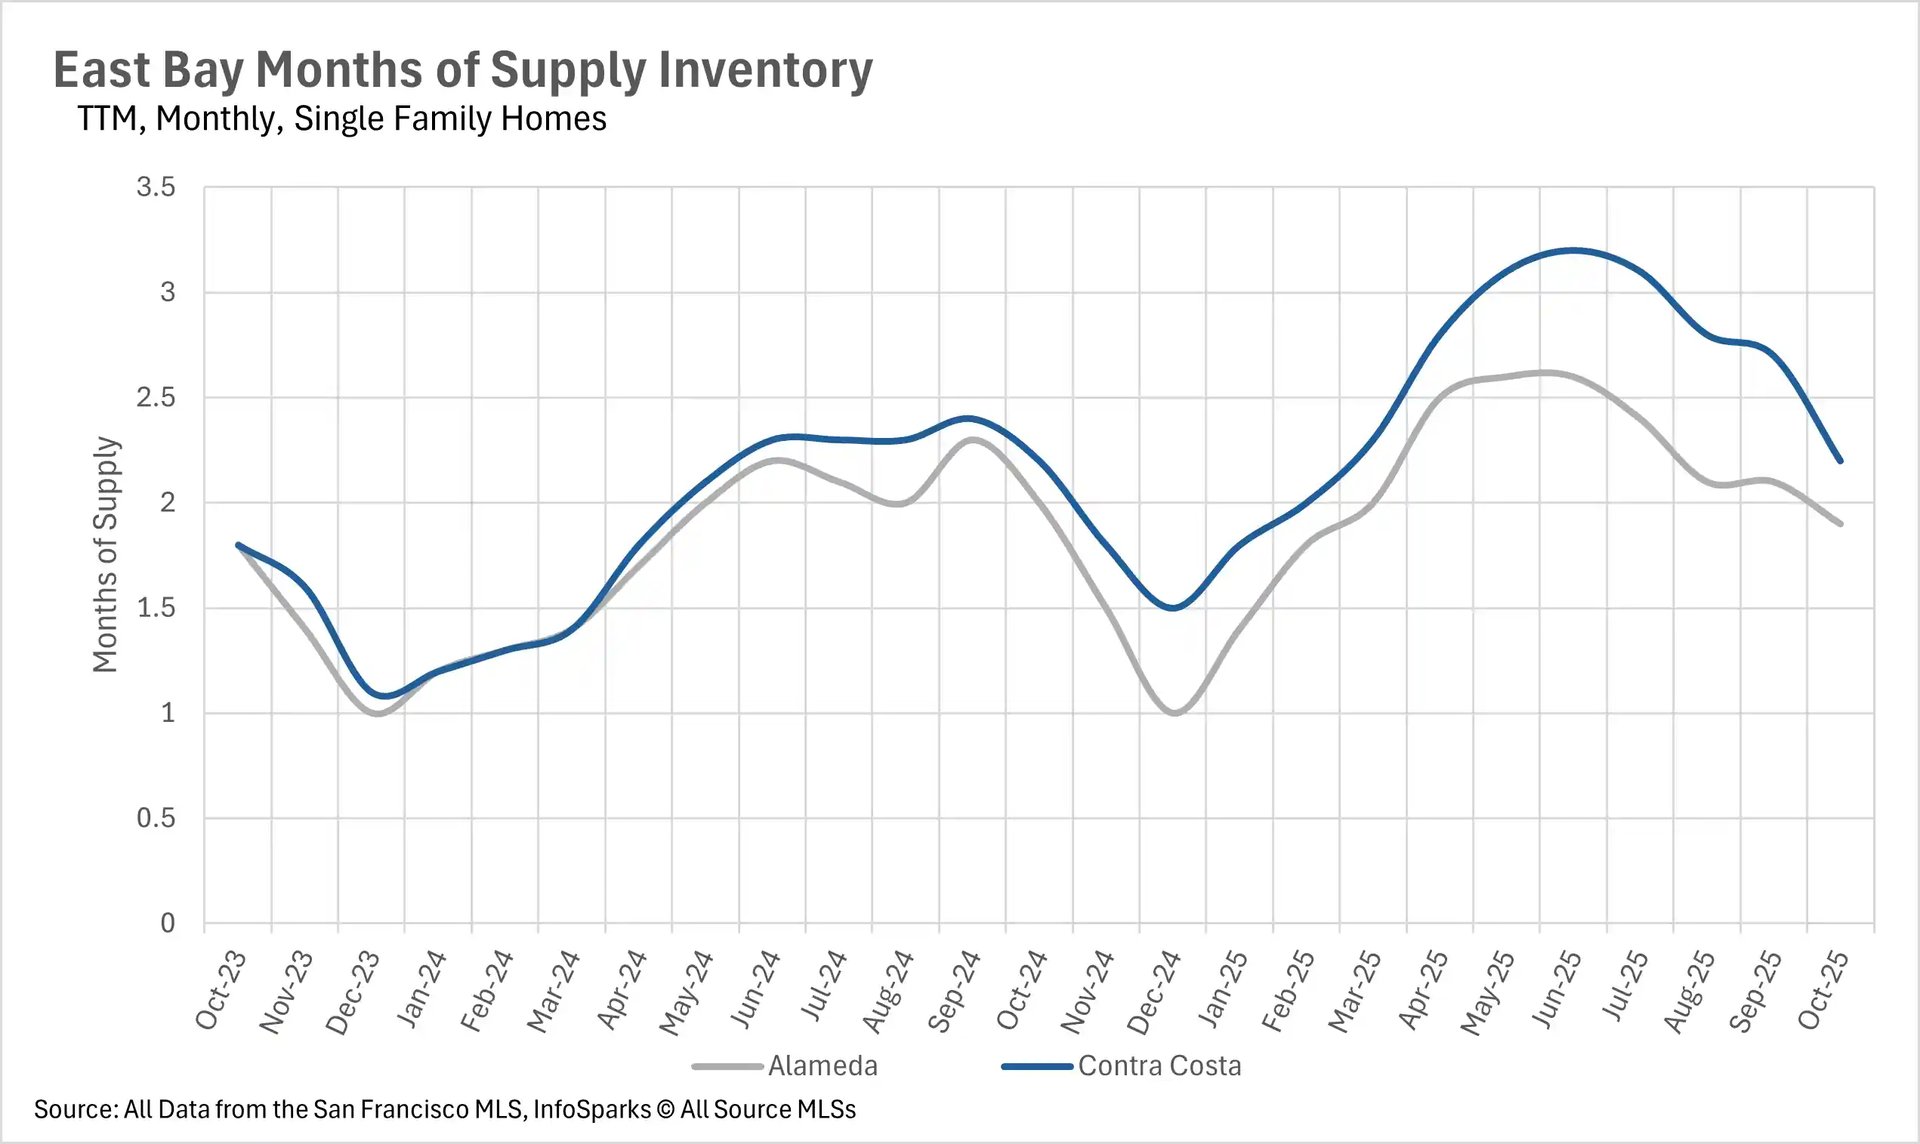
When determining whether a market is a buyers’ market or a sellers’ market, we look to the Months of Supply Inventory (MSI) metric. The state of California has historically averaged around three months of MSI, so any area with at or around three months of MSI is considered a balanced market. Any market that has lower than three months of MSI is considered a seller’s market, whereas markets with more than three months of MSI are considered buyers’ markets.

As per usual, the single-family home market is much more competitive than the condo market. The East Bay is a seller's market when it comes to single-family homes, with Alameda County having 1.9 months of supply on the market, and Contra Costa County having 2.2 months. Whereas the East Bay condo market is a buyer's market, with 4.4 months of supply on the market in Alameda County and 3.4 months of supply on the market in Contra Costa County.

Local Lowdown Data

Line chart showing East Bay median condo prices over three years from October 2022 to October 2025, with two lines comparing Alameda (gray, ranging $550K-$720K) and Contra Costa (blue, ranging $450K-$560K). Both markets show declining trends through 2025, with Alameda consistently priced higher.

Line chart displaying East Bay median single-family home prices over three years from October 2022 to October 2025, comparing Alameda (gray, $1.0M-$1.4M range) and Contra Costa (blue, $700K-$950K range). Both markets show cyclical patterns with Alameda peaking around $1.4M in early 2024 and stabilizing around $1.25M by late 2025.

Bar chart showing year-over-year median condo price changes in the East Bay from November 2024 to October 2025. Alameda (gray bars) and Contra Costa (blue bars) both experienced significant declines, with peaks of 10-14% growth in late 2024 followed by sustained 5-15% declines through mid-2025, recovering slightly to near-flat by October 2025.

Bar chart illustrating year-over-year median single-family home price changes in the East Bay from November 2024 to October 2025. Contra Costa (blue bars) shows dramatic 7% growth in December 2024, followed by significant declines reaching -6% in July 2025. Alameda (gray bars) shows more moderate fluctuations, with both markets approaching flat to slight positive growth by October 2025.

Line chart tracking days on market for East Bay condos from October 2022 to October 2025, comparing Alameda (gray, 10-48 days) and Contra Costa (blue, 14-41 days). Both markets show increasing days on market, with Contra Costa reaching 41 days by October 2025, indicating slower sales velocity compared to the tighter market conditions of 2023.

Line chart showing days on market for East Bay single-family homes from October 2022 to October 2025, comparing Alameda (gray, 10-21 days) and Contra Costa (blue, 10-26 days). Contra Costa shows more volatility with peaks at 26 days, while both markets have stabilized around 15-20 days by late 2025.

Combination chart displaying East Bay condo inventory metrics over two years from October 2023 to October 2025. Dark blue bars show new listings (140-530 units), light blue bars show sold listings (180-310 units), and a pink line tracks for-sale inventory (right axis, 450-1,100 units). Inventory peaked at 1,100 units in mid-2025 before declining to 880 units by October 2025.

Combination chart presenting East Bay single-family home inventory metrics over two years from October 2023 to October 2025. Dark blue bars represent new listings (580-2,500 units), light blue bars show sold listings (650-1,550 units), and a pink line tracks for-sale inventory (right axis, 1,200-3,550 units). Inventory peaked at 3,550 units in spring 2025, declining to 2,550 units by October 2025.

Line chart showing months of supply inventory for East Bay condos from October 2022 to October 2025, comparing Alameda (gray, 1.7-5.2 months) and Contra Costa (blue, 1.7-4.5 months). Both markets show increasing inventory levels, with Alameda reaching 4.4 months and Contra Costa at 3.4 months by October 2025, indicating a shift toward more balanced market conditions.

Line chart displaying months of supply inventory for East Bay single-family homes from October 2022 to October 2025, comparing Alameda (gray, 1.0-2.6 months) and Contra Costa (blue, 1.1-3.2 months). Contra Costa peaked at 3.2 months in spring 2025 before declining to 2.2 months by October 2025. Both markets show increased inventory compared to the sub-2-month levels of late 2023, reflecting improved buyer opportunities.

Let’s Talk

You’ve got questions and we can’t wait to answer them.

Follow Us on Instagram