Select a Market Report to Read:
The Local Lowdown
Quick Take:
- Median sale prices are mostly in line with where they were around this time last year.
- The North Bay has seen inventories crater on a year-over-year basis, as considerably fewer homes hit the market.
- Despite lower inventory levels, listings are still spending more time on the market on a year-over-year basis.
Note: You can find the charts/graphs for the Local Lowdown at the end of this section.
*National Association of REALTORS® data is released two months behind, so we estimate the most recent month's data when possible and appropriate.
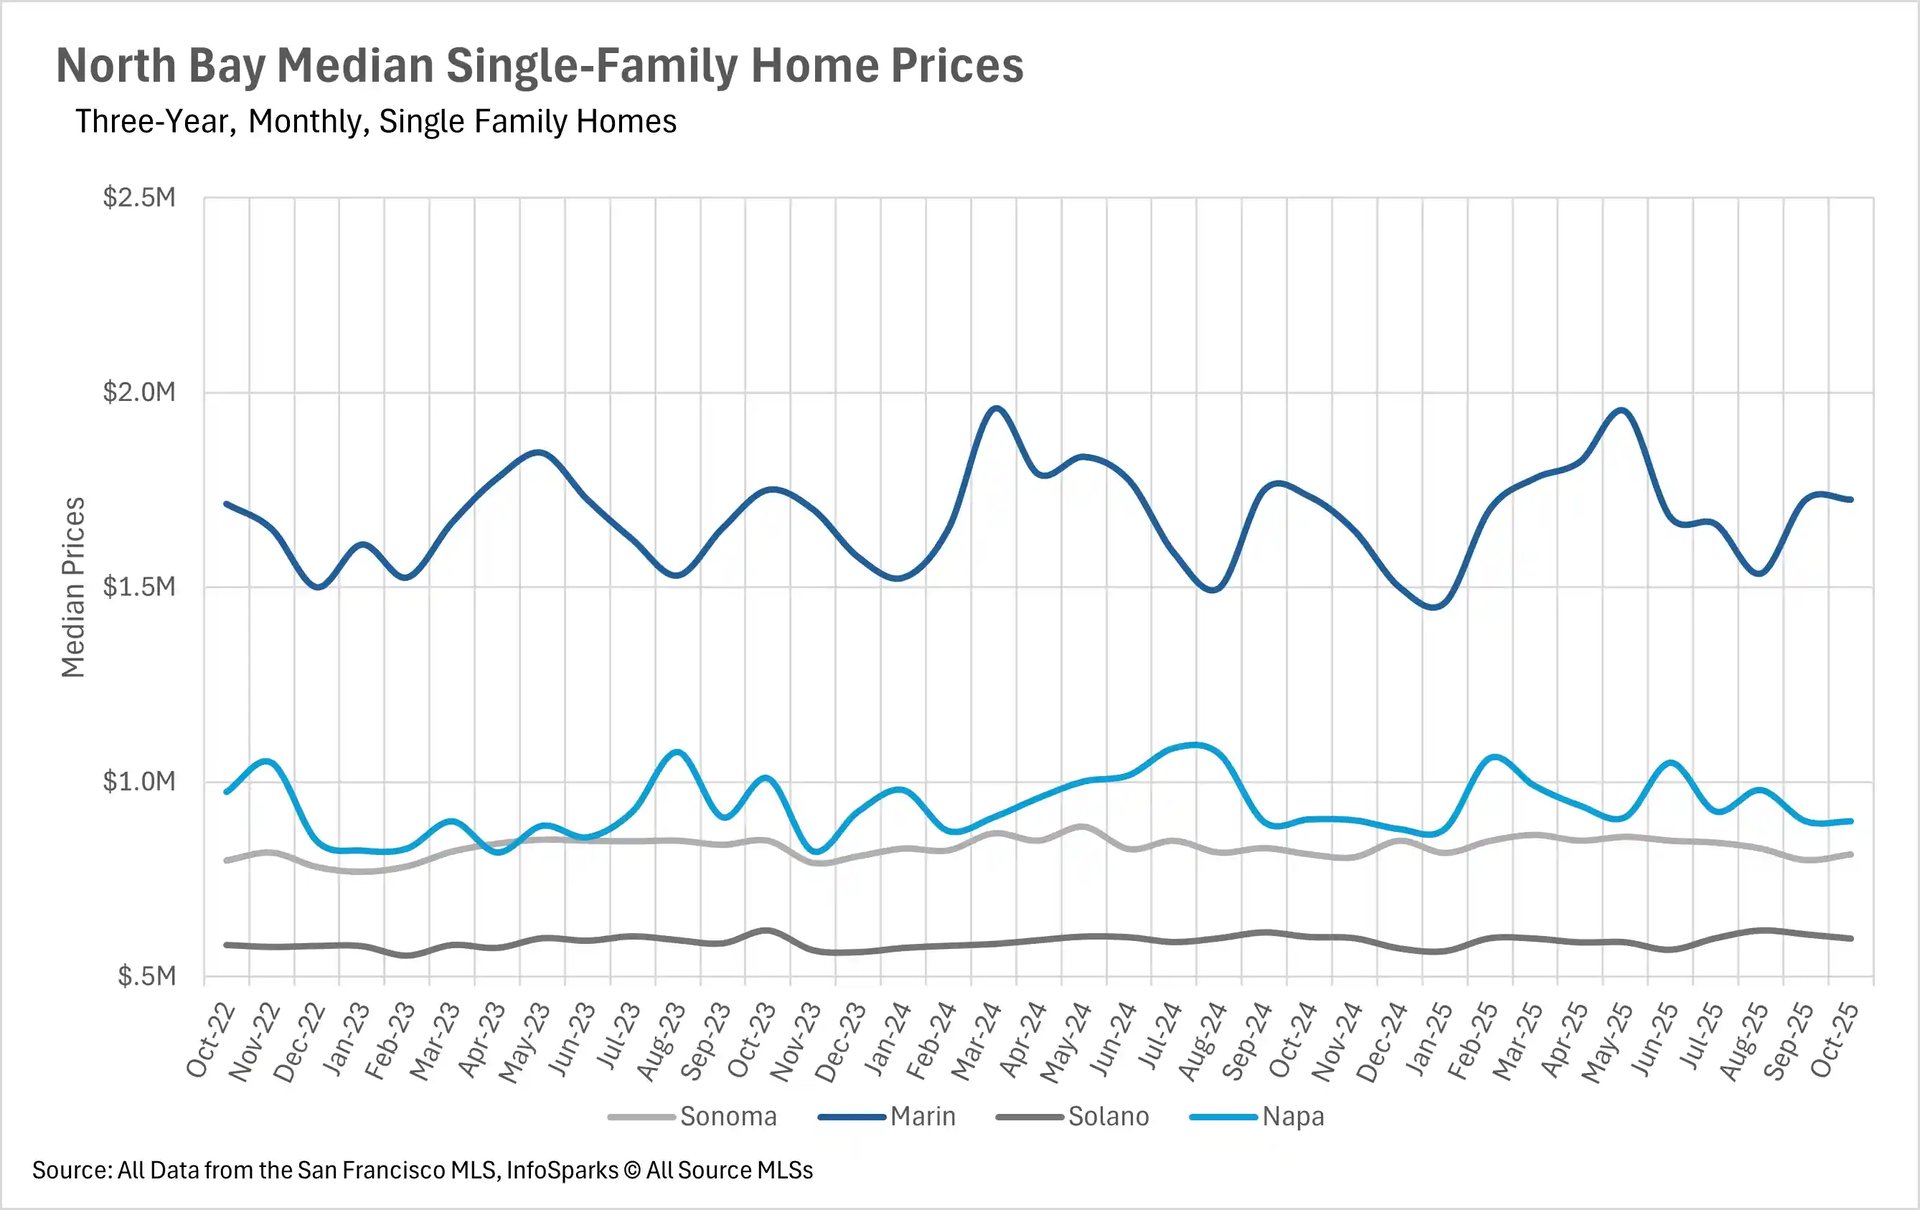
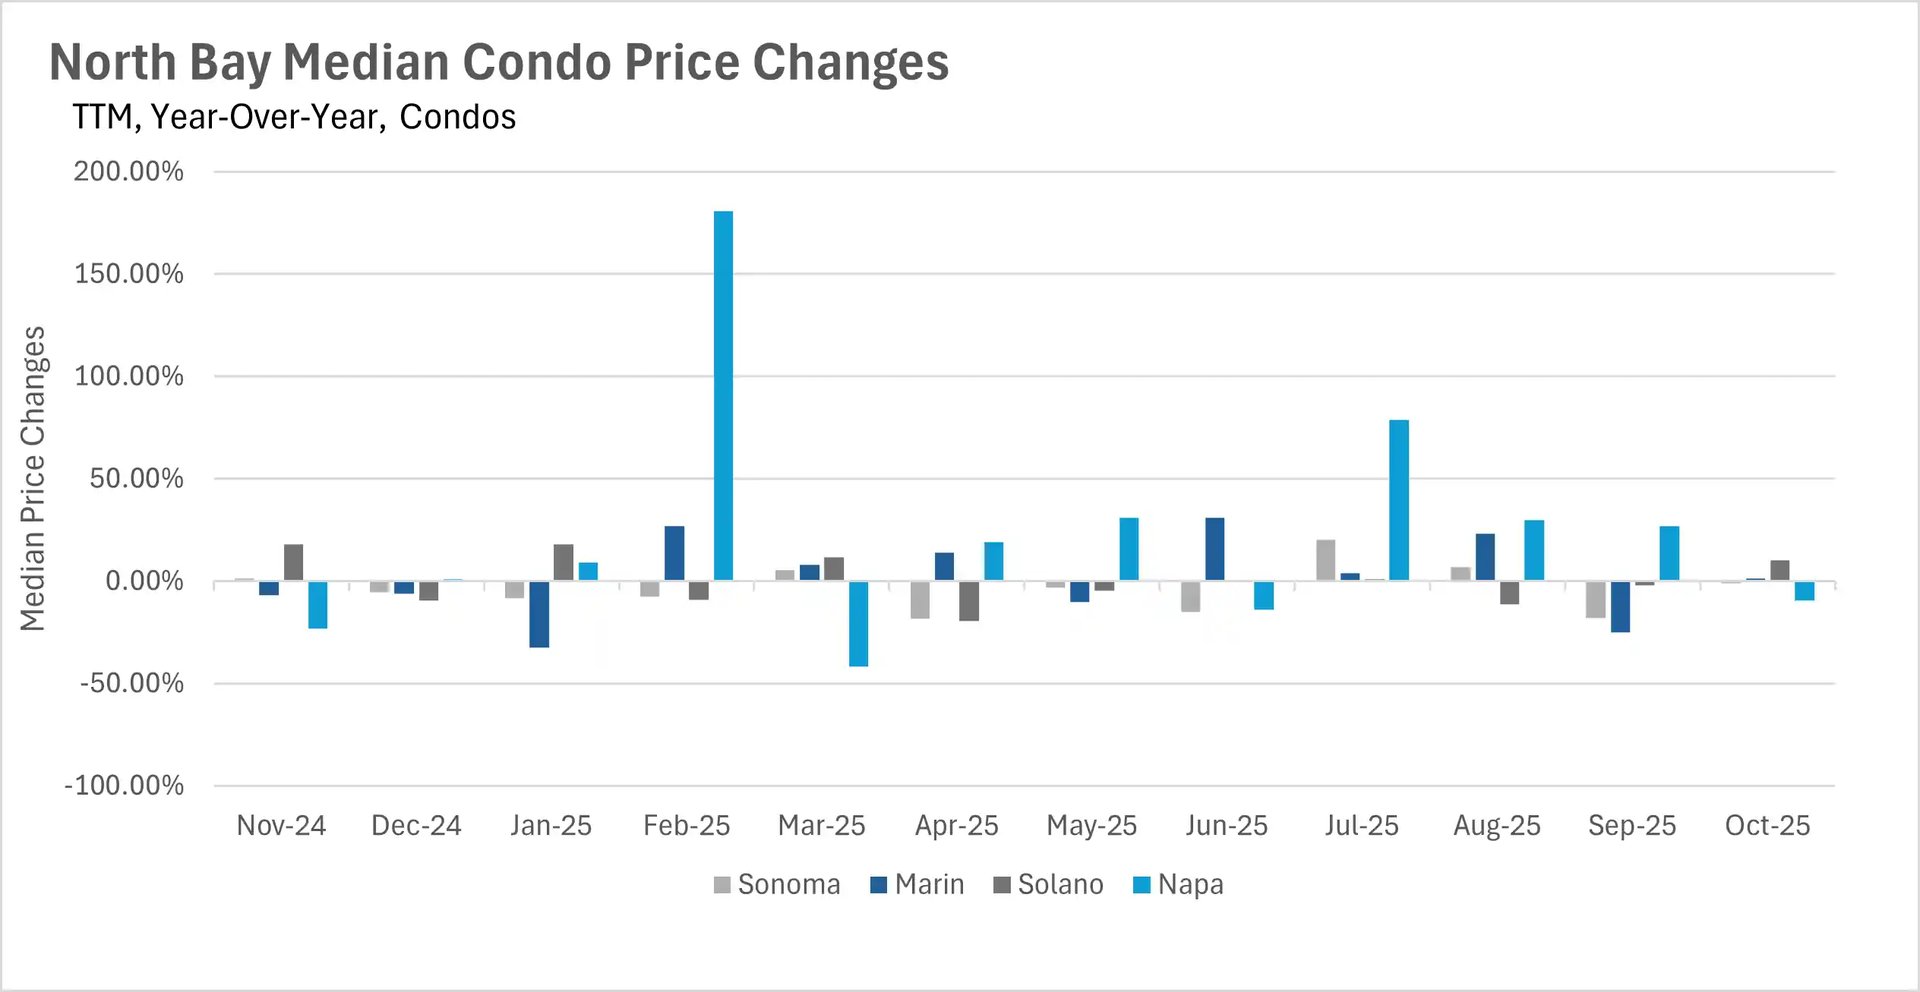
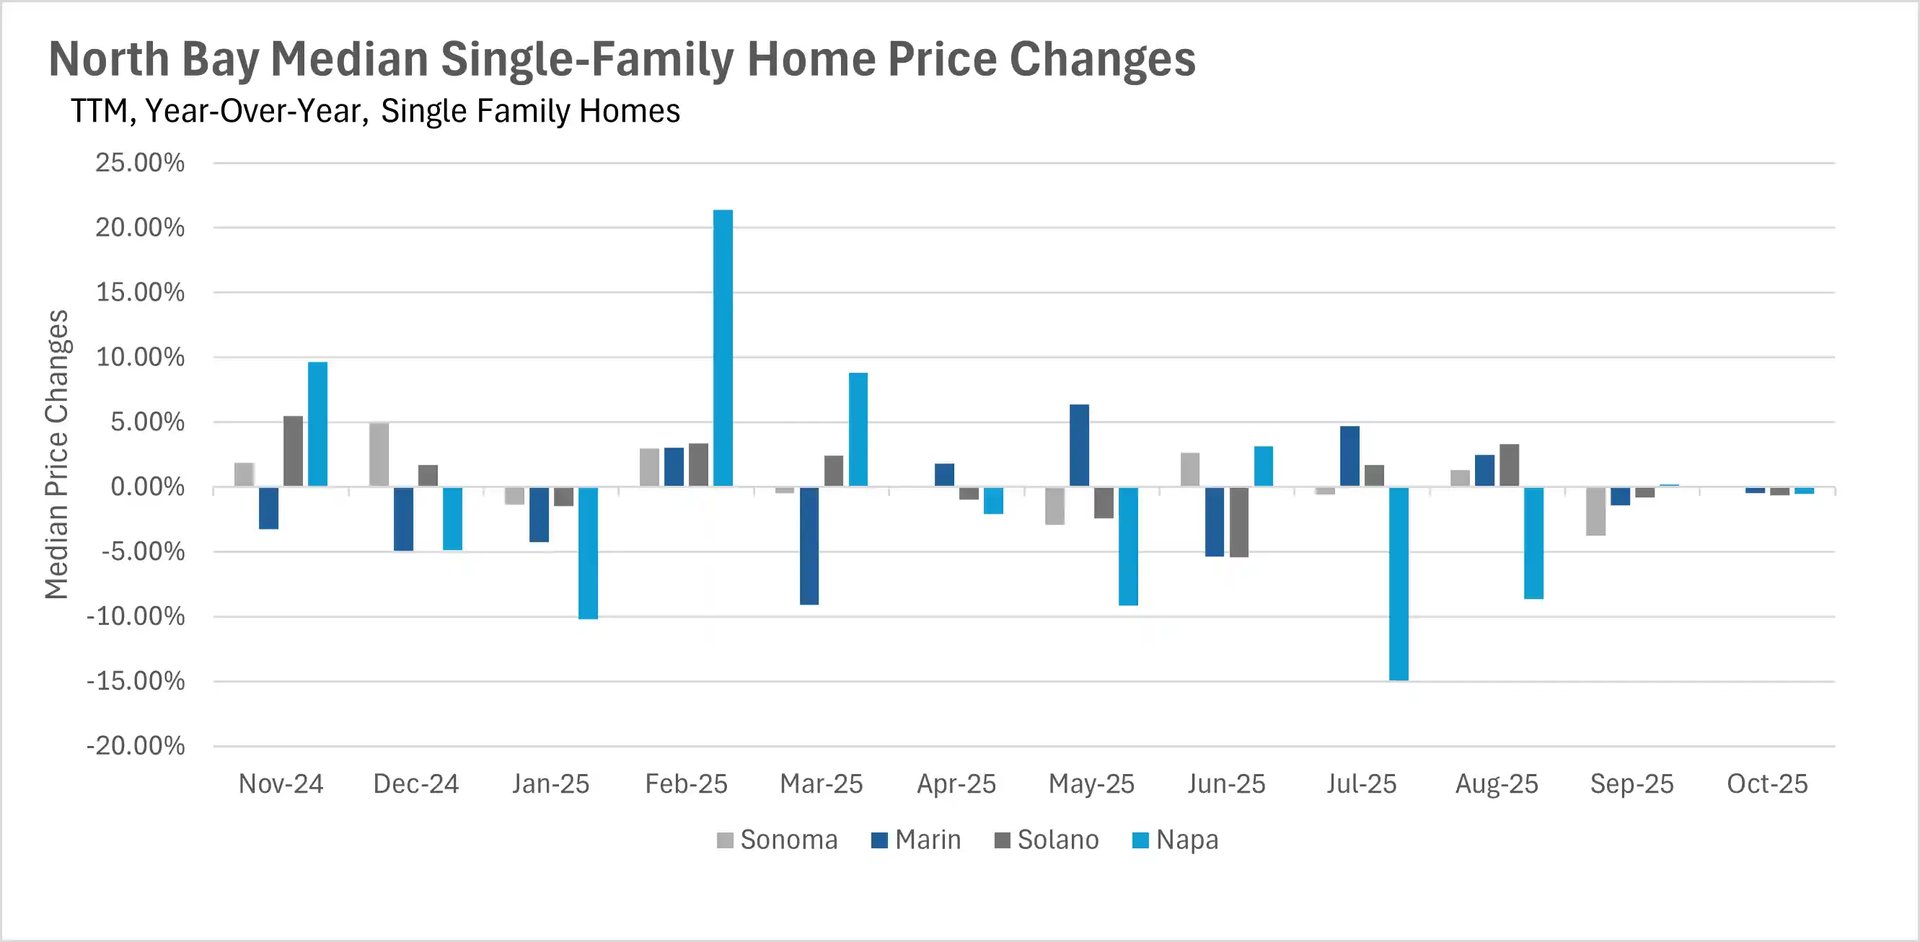
Median sale prices have remained resoundingly strong on a year-over-year basis
Unfortunately, there isn’t much to talk about in terms of median sale prices in the North Bay. Pricing for single-family homes in every county, and condos in Sonoma and Marin Counties, didn’t deviate much from where they were around this time last year. However, we did see some volatility in the Solano and Napa County condo markets. The Solano County condo market saw the median sale price jump by 10.26% on a year-over-year basis. On the flip side, the Napa County condo market saw a 9.49% decline on a year-over-year basis.
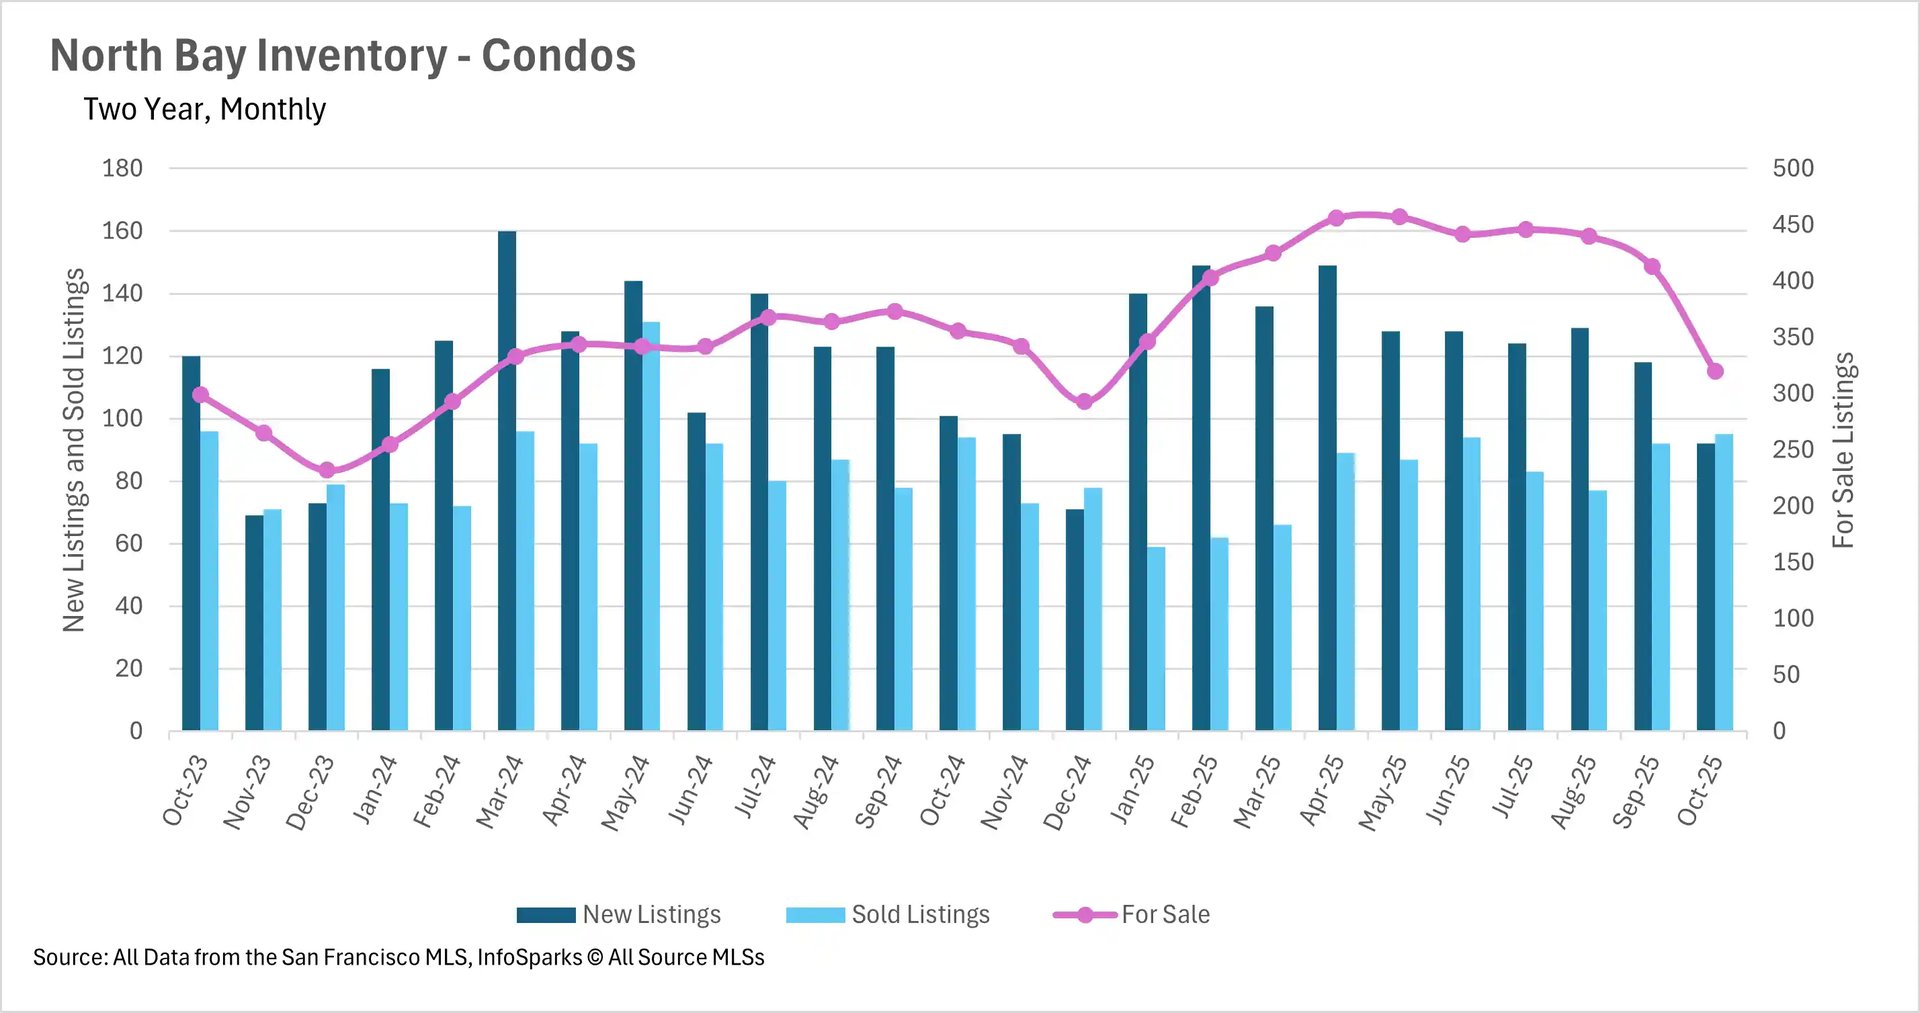
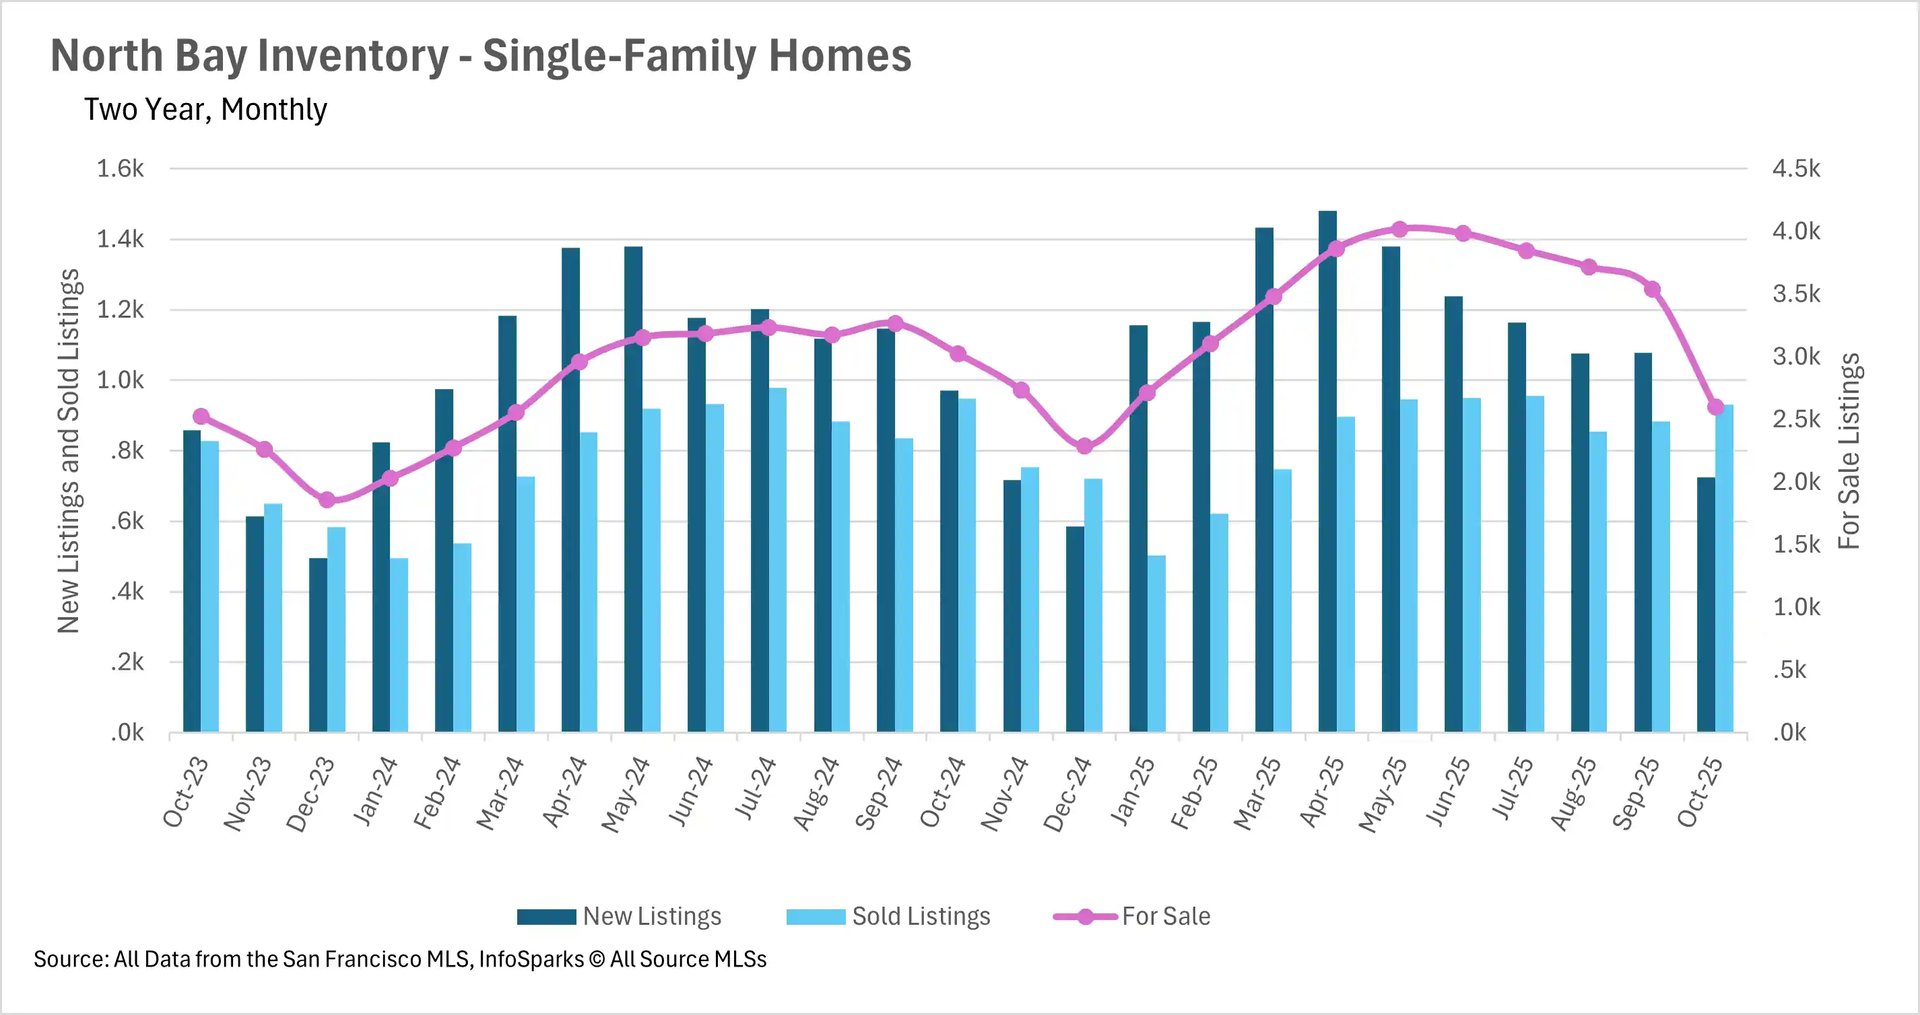
We’re no longer seeing the inventory build-up that was the driving market force all year
Throughout much of the year, inventory was building up throughout the entirety of the state. However, we saw the North Bay buck the trend in a huge way this past month, as single-family home inventory decreased by 14.06% on a year-over-year basis, and condo inventory decreased by 10.11% on a year-over-year basis. This decline was driven mainly by the fact that the rate of new listings hitting the market shrank by a considerable margin (25.41% for the single-family home market and 8.91% for the condo market), while the number of sold listings remained roughly the same on a year-over-year basis. This led to the steeper-than-usual drop-off that we can see in the accompanying chart.
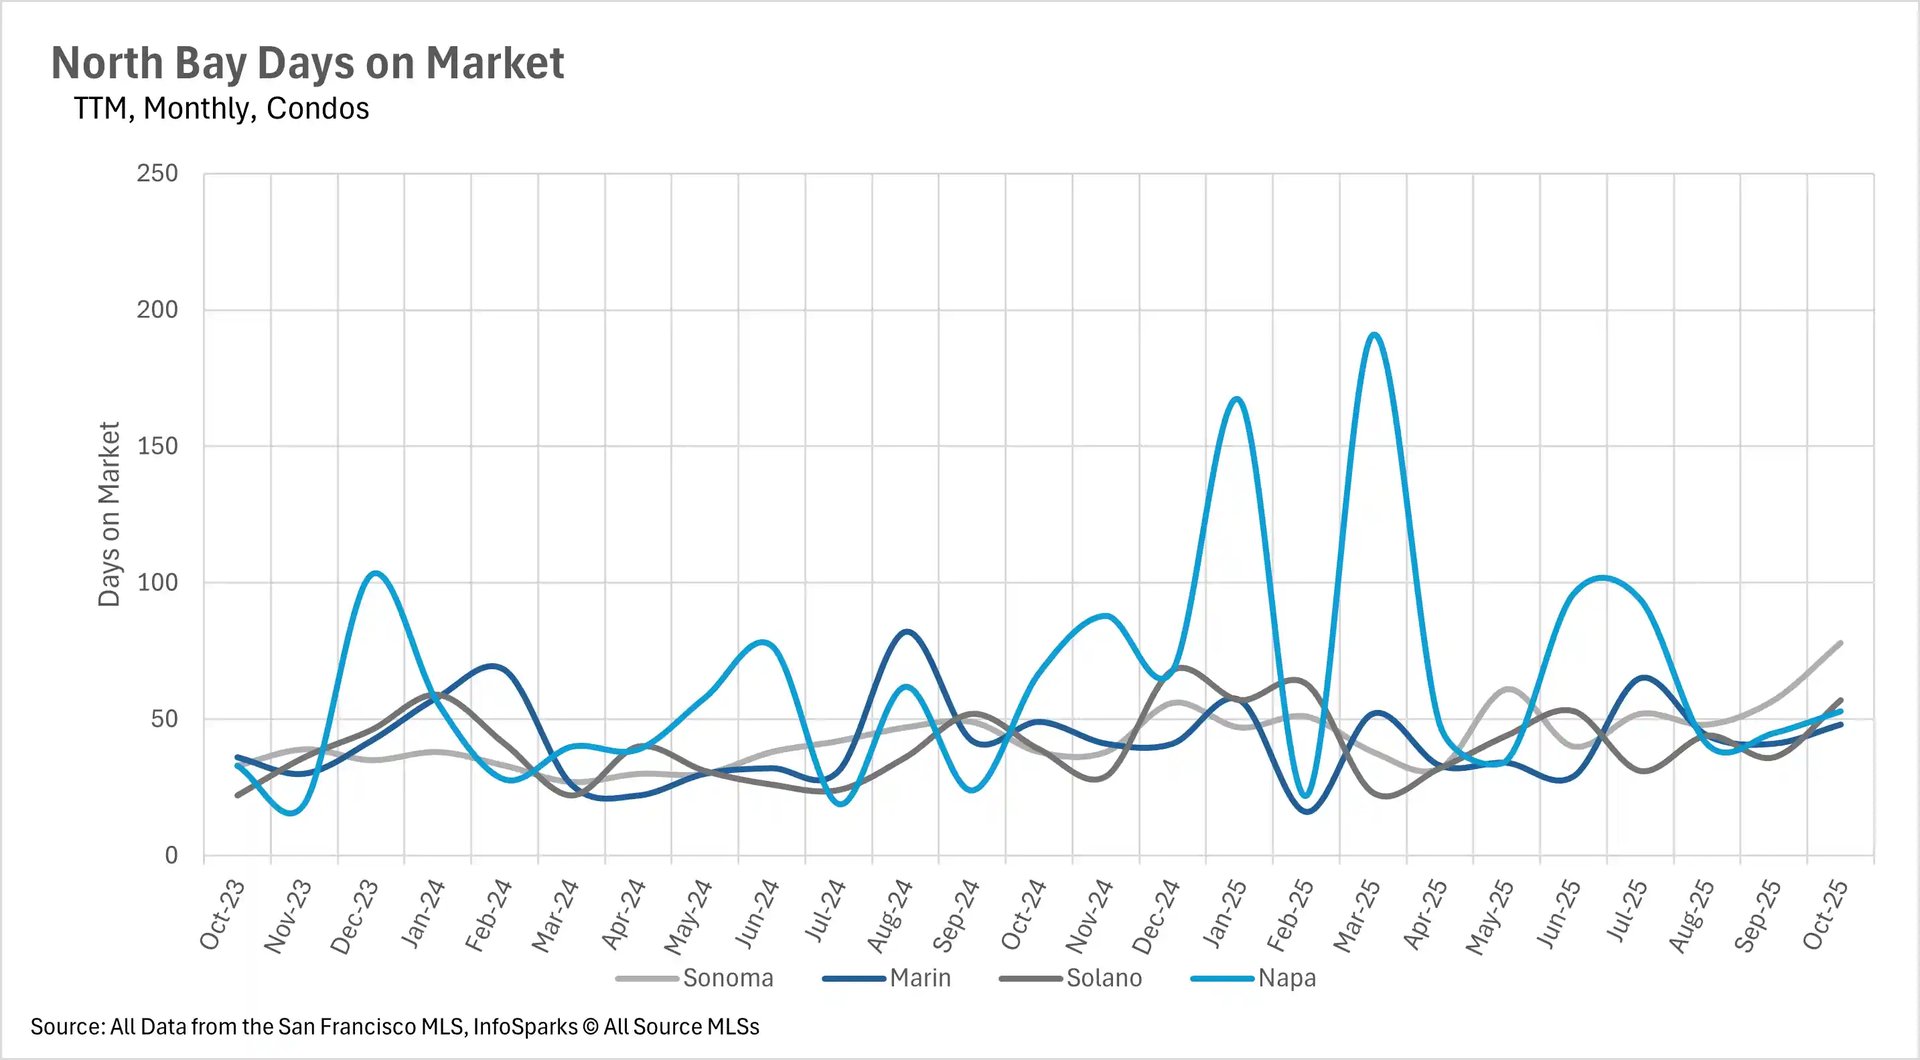
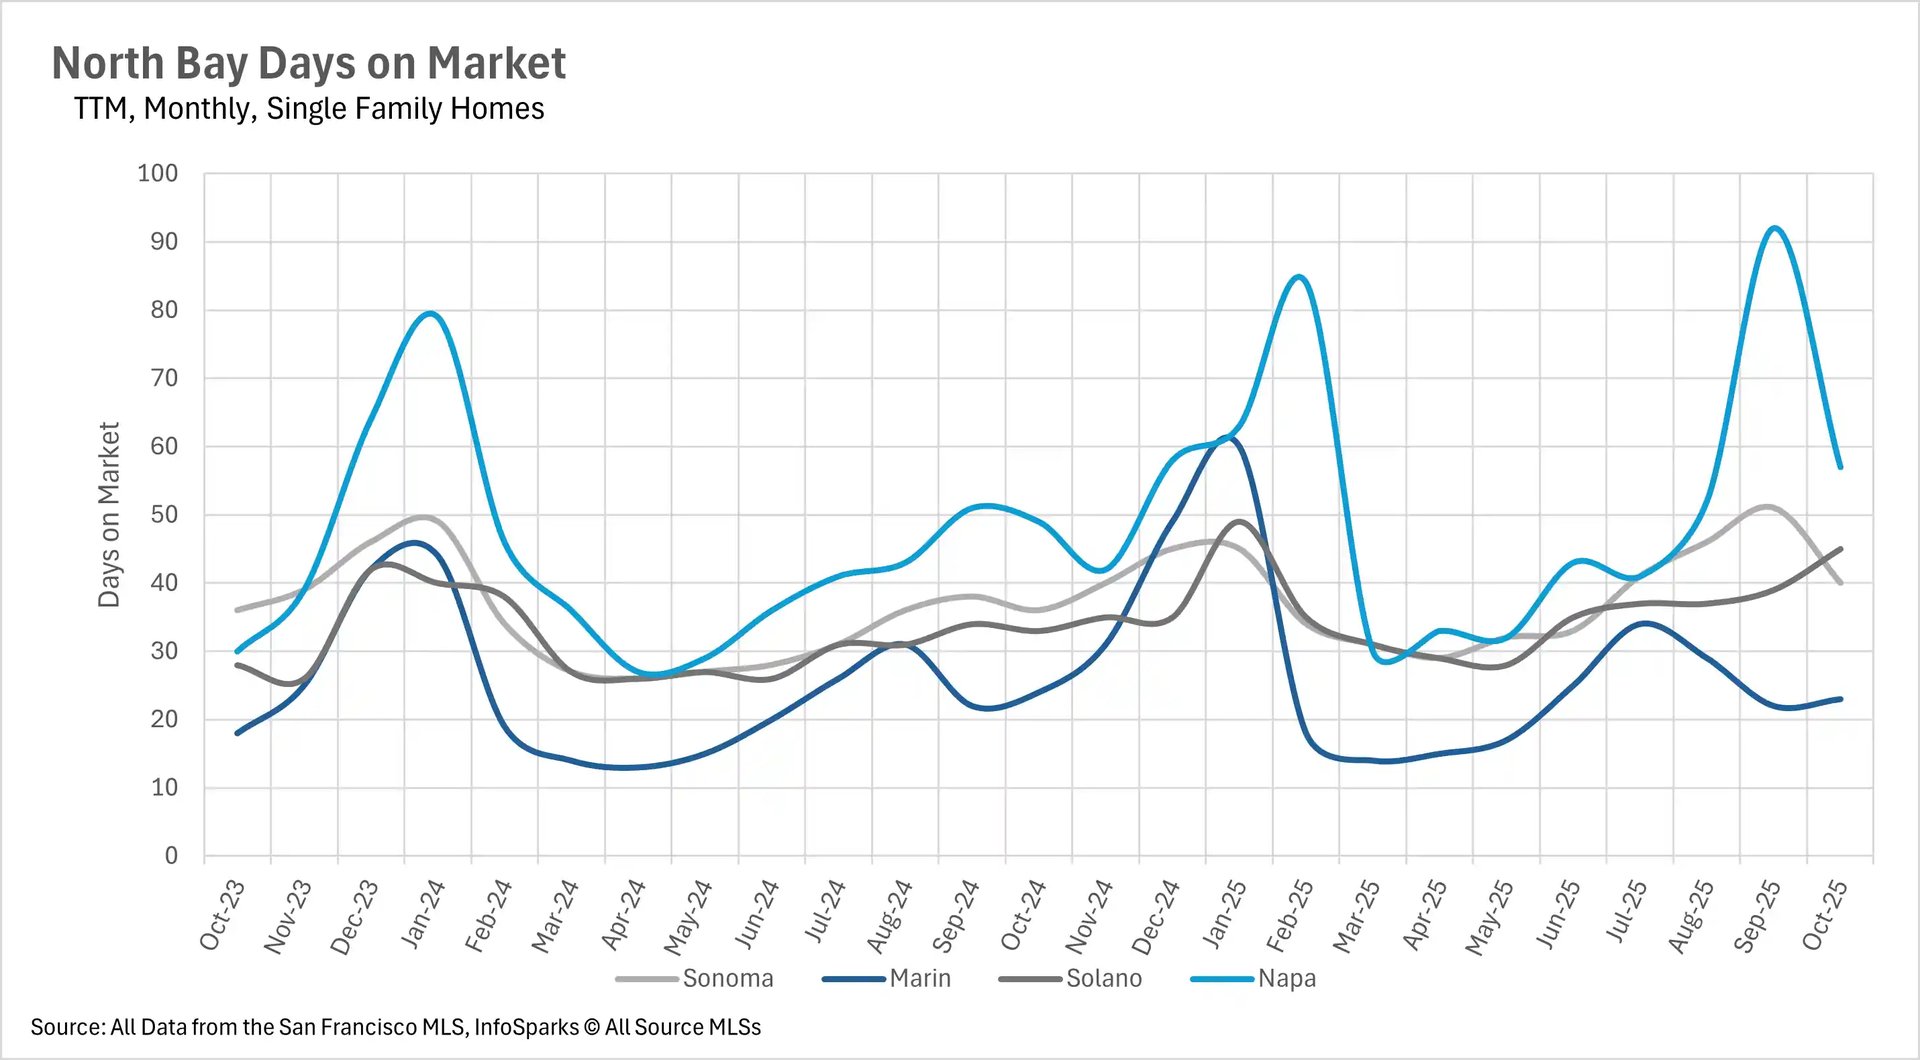
Despite the inventory sell-off, listings are sitting for longer than they were last year
When inventory levels drop as suddenly as they did this month, you might expect the amount of time a listing is on the market to do the same. The average single-family home was on the market for 11.11% longer on a year-over-year basis in Sonoma County, 36.36% longer in Solano County, and 16.33% in Napa County. Whereas the average single-family home listing in Marin County spent 4.17% less time on the market. However, it’s important to note that new listings hitting the market are a leading indicator, while days on market are a trailing indicator. This is mostly attributable to the fact that real estate transactions take quite a bit of time. However, we’ll likely see a shift in days on market in next month’s data.
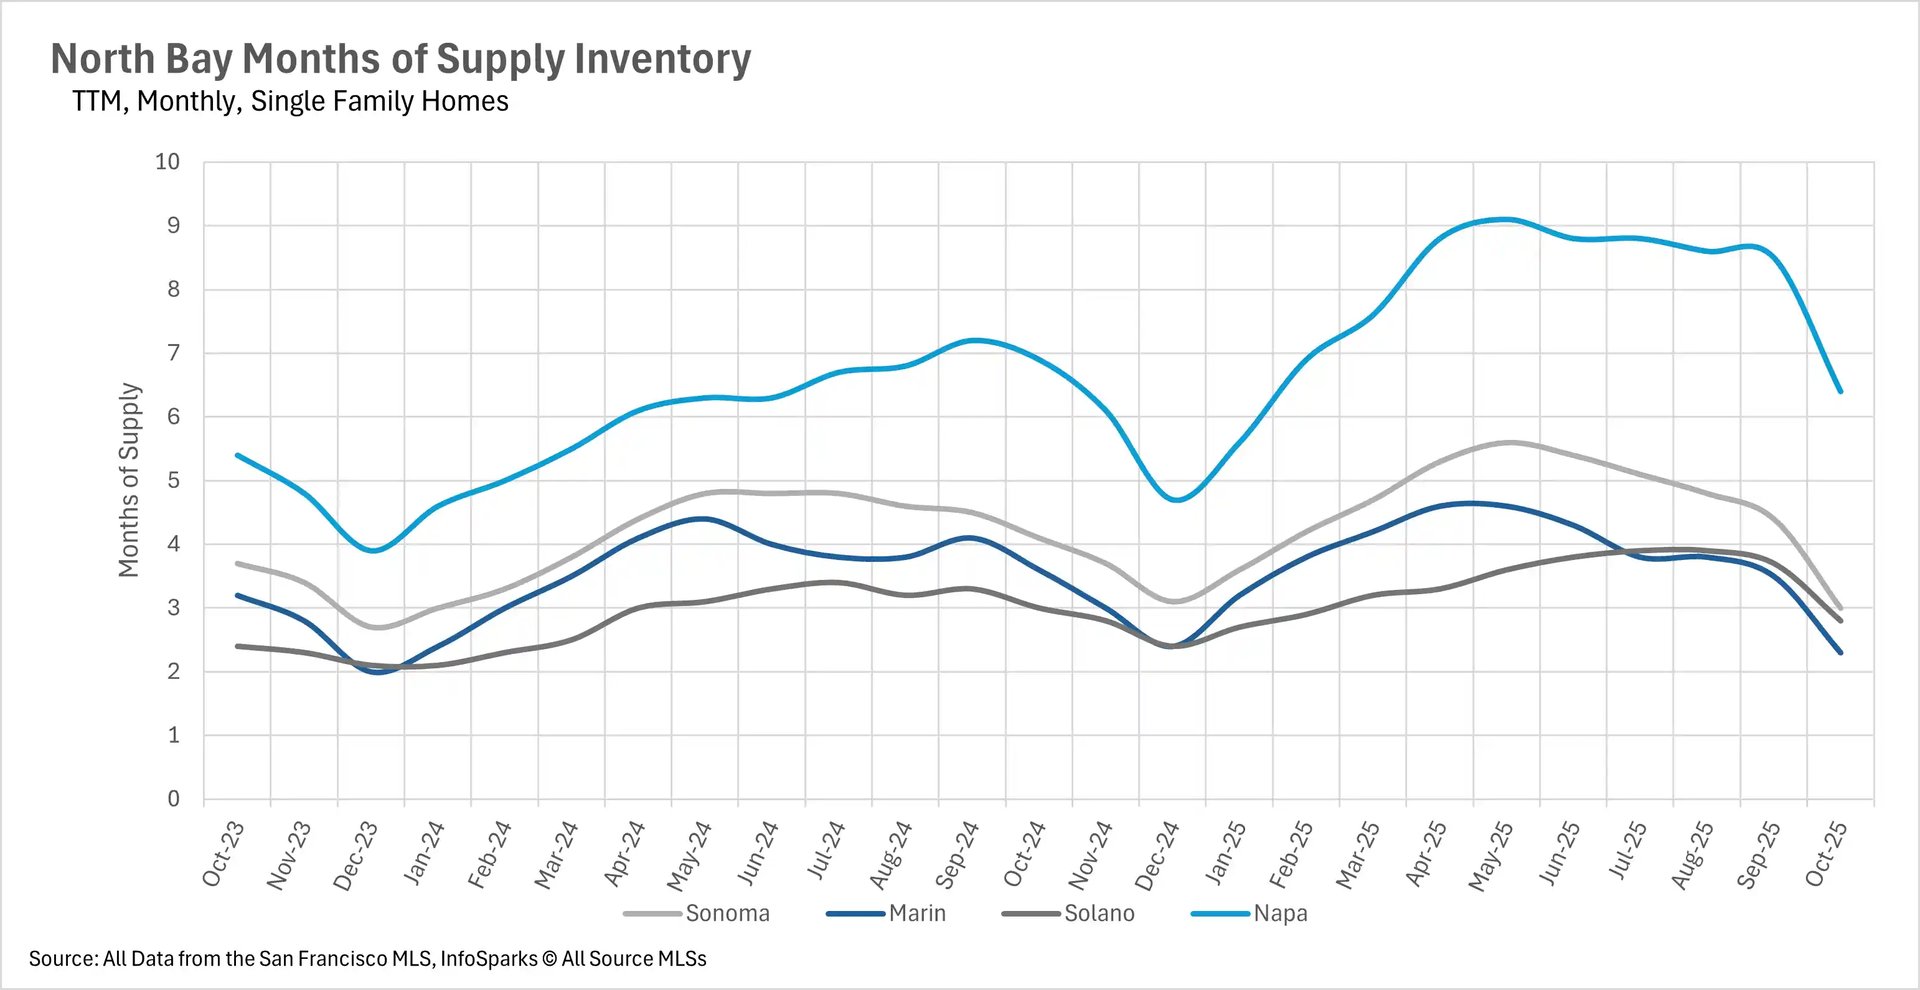
The renewed move toward a seller's market
When determining whether a market is a buyers’ market or a sellers’ market, we look to the Months of Supply Inventory (MSI) metric. The state of California has historically averaged around three months of MSI, so any area with at or around three months of MSI is considered a balanced market. Any market that has lower than three months of MSI is considered a sellers’ market, whereas markets with more than three months of MSI are considered buyers’ markets.
As inventory has slipped in the past month, this has led the number of months worth of supply on the market to shrink, pushing the market as a whole toward a sellers market. The single-family home markets in Marin and Solano Counties flipped to sellers markets, with 2.3 and 2.8 months of inventory on the market, respectively. The Sonoma County single-family market became a balanced market, with exactly 3 months of inventory, and Napa County moved closer to a balanced market, with 6.4 months of supply on the market. The condo market was less affected, with Sonoma County becoming a balanced market, and the other counties moving closer to balanced, with Marin County having 3.5 months of supply, Solano County having 5.1 months of supply, and Napa County having 5.4 months of supply.