Select a Market Report to Read:
The Local Lowdown
Quick Take:
- San Francisco reaches unprecedented market tightness with single-family homes hitting two-year price highs and inventory dropping over 35% year-over-year, while both property types firmly establish seller's market status.
- The Bay Area experiences a dramatic "inventory overcorrection" in October, with most regions swinging from elevated summer levels to below-normal supply, driven primarily by sharp declines in new listings rather than increased sales.
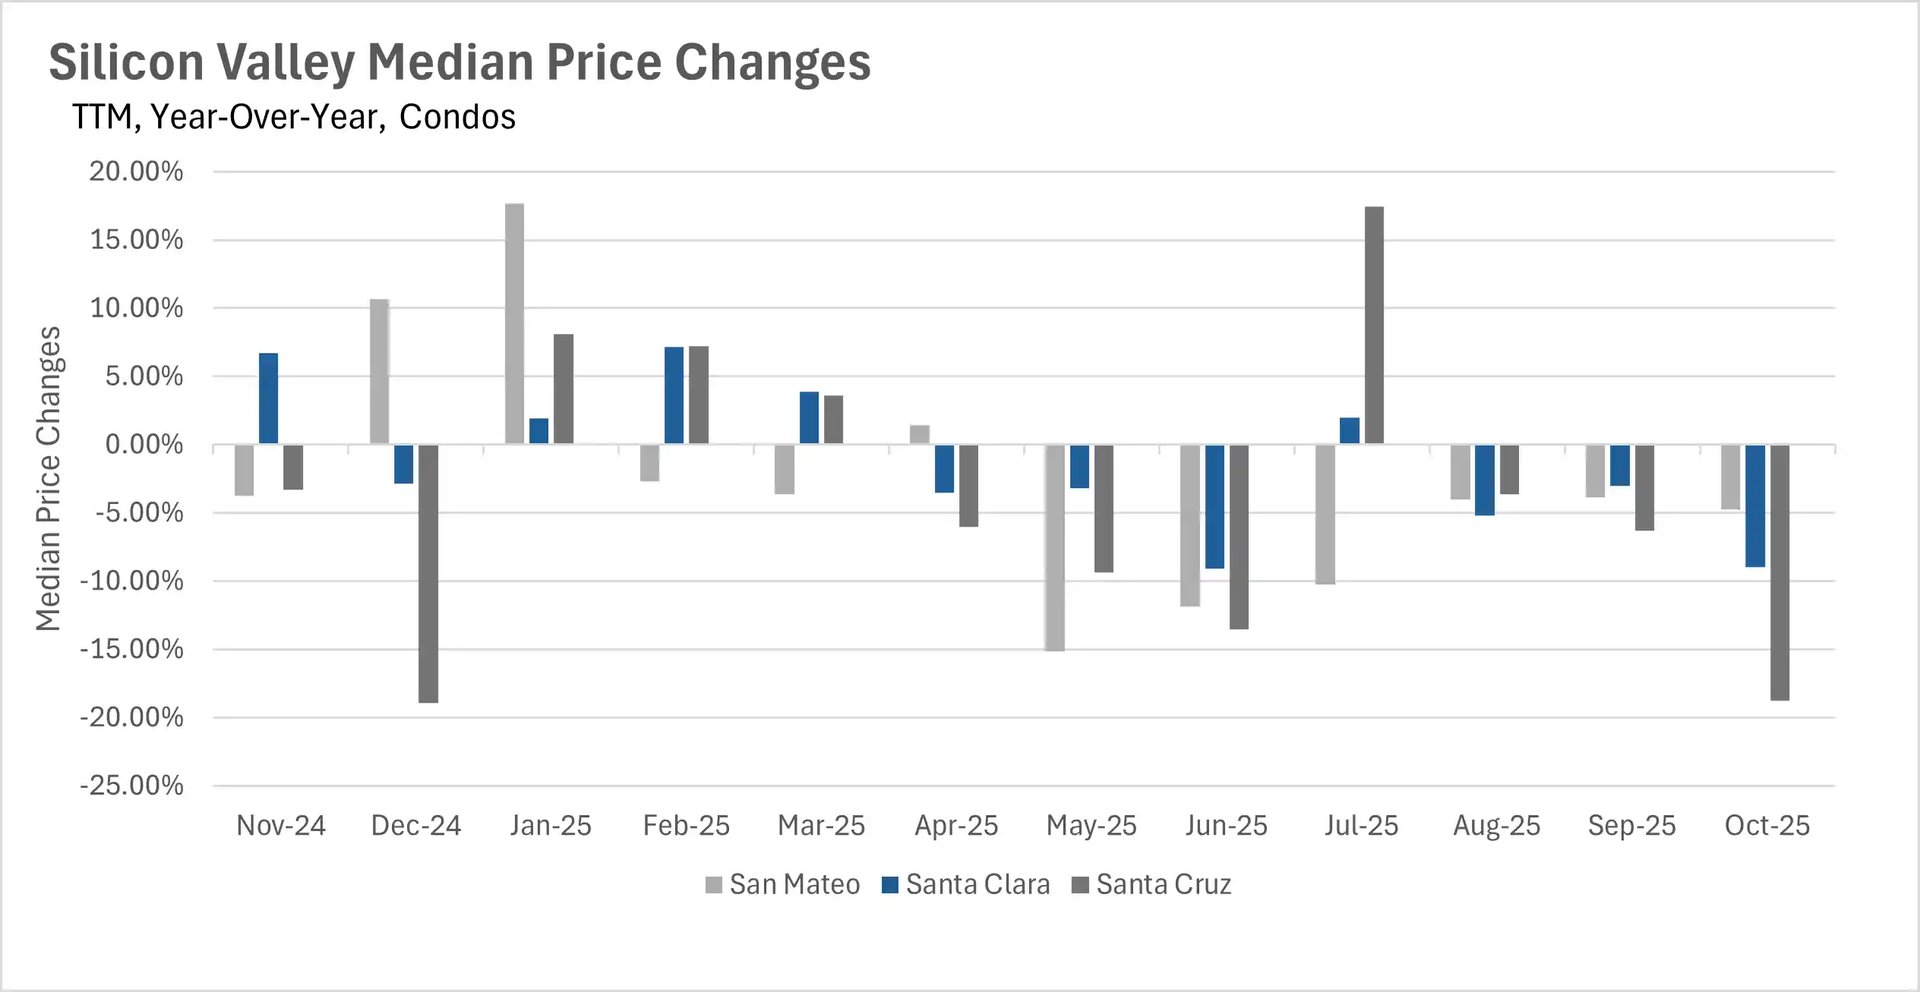
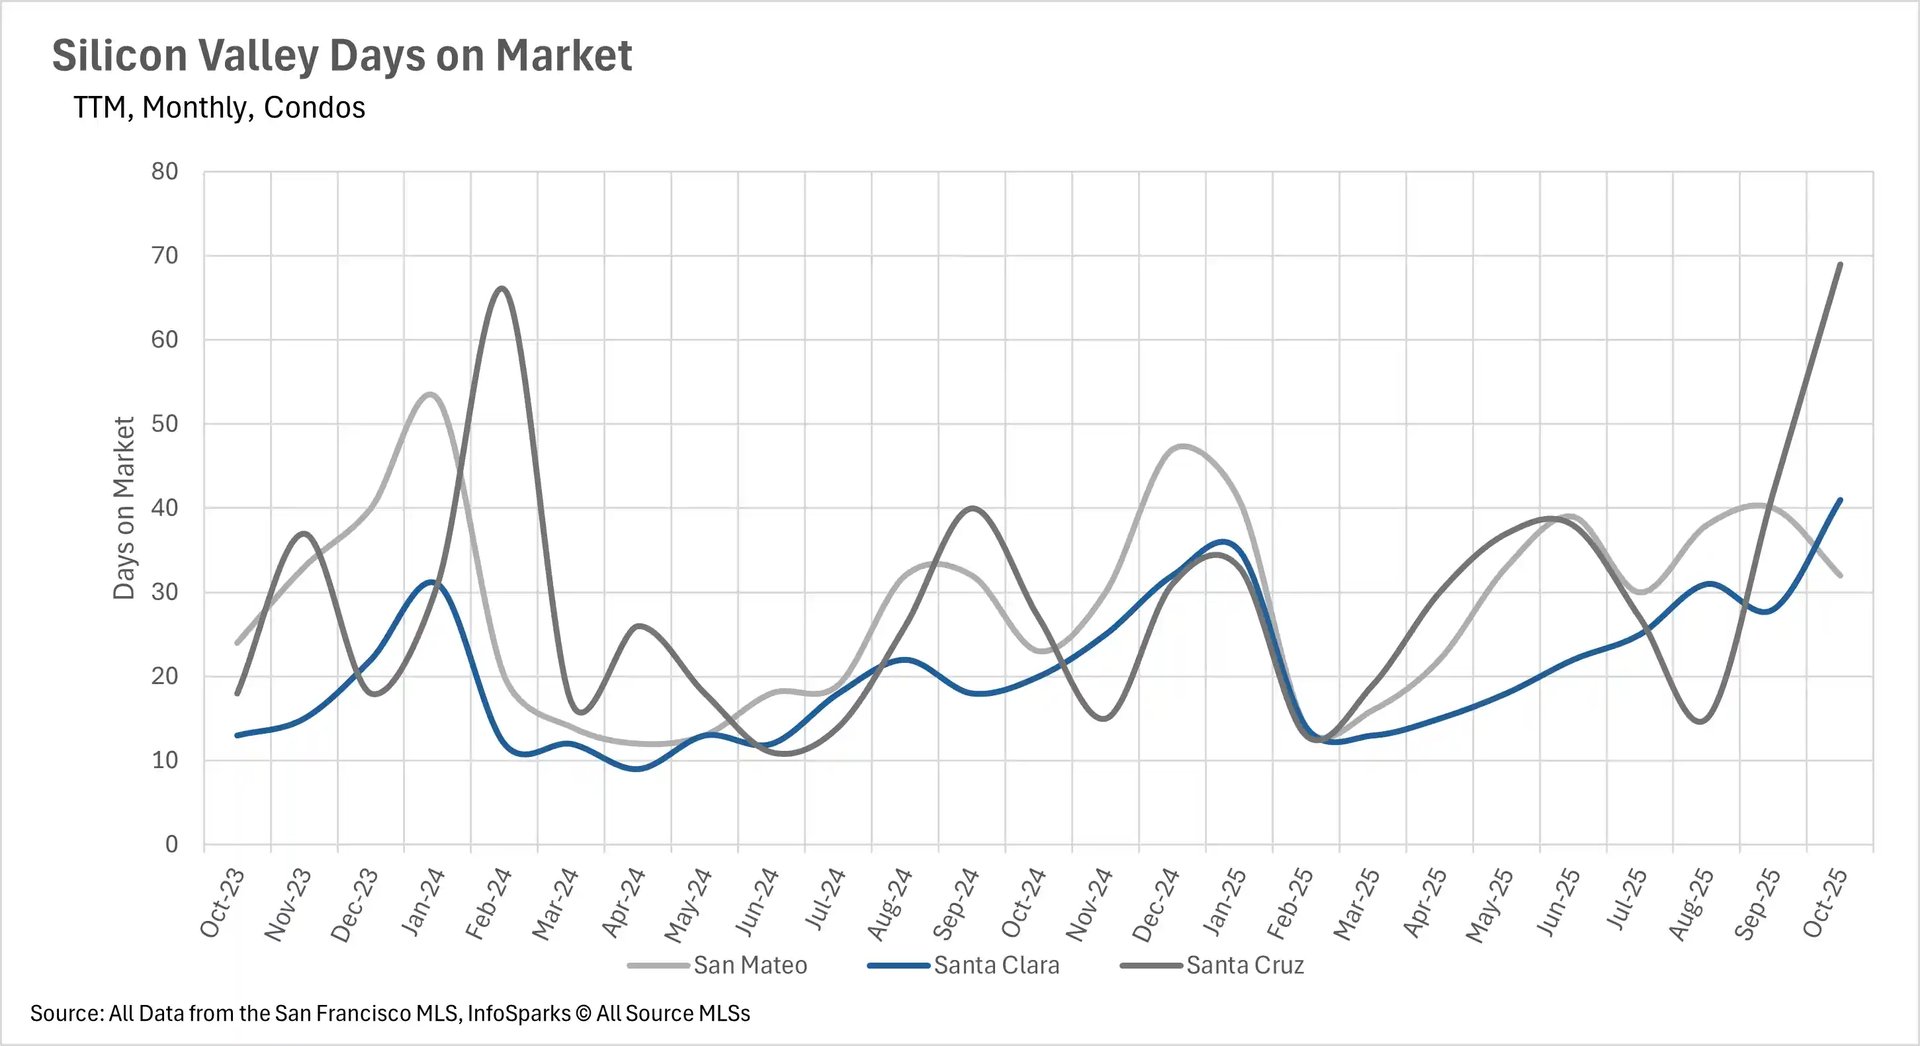
- Condo markets across the region face mounting pressure with widespread price declines and dramatically extended days on market, particularly in Silicon Valley where some areas see listings taking more than twice as long to sell.
- The property type divide intensifies as single-family homes maintain ultra-competitive conditions with rapid sales, while condos struggle with extended market times despite favorable buyer conditions.
Note: You can find the charts/graphs for the Local Lowdown at the end of this section.
*National Association of REALTORS® data is released two months behind, so we estimate the most recent month's data when possible and appropriate.
San Francisco surges while regional condo markets face persistent headwinds
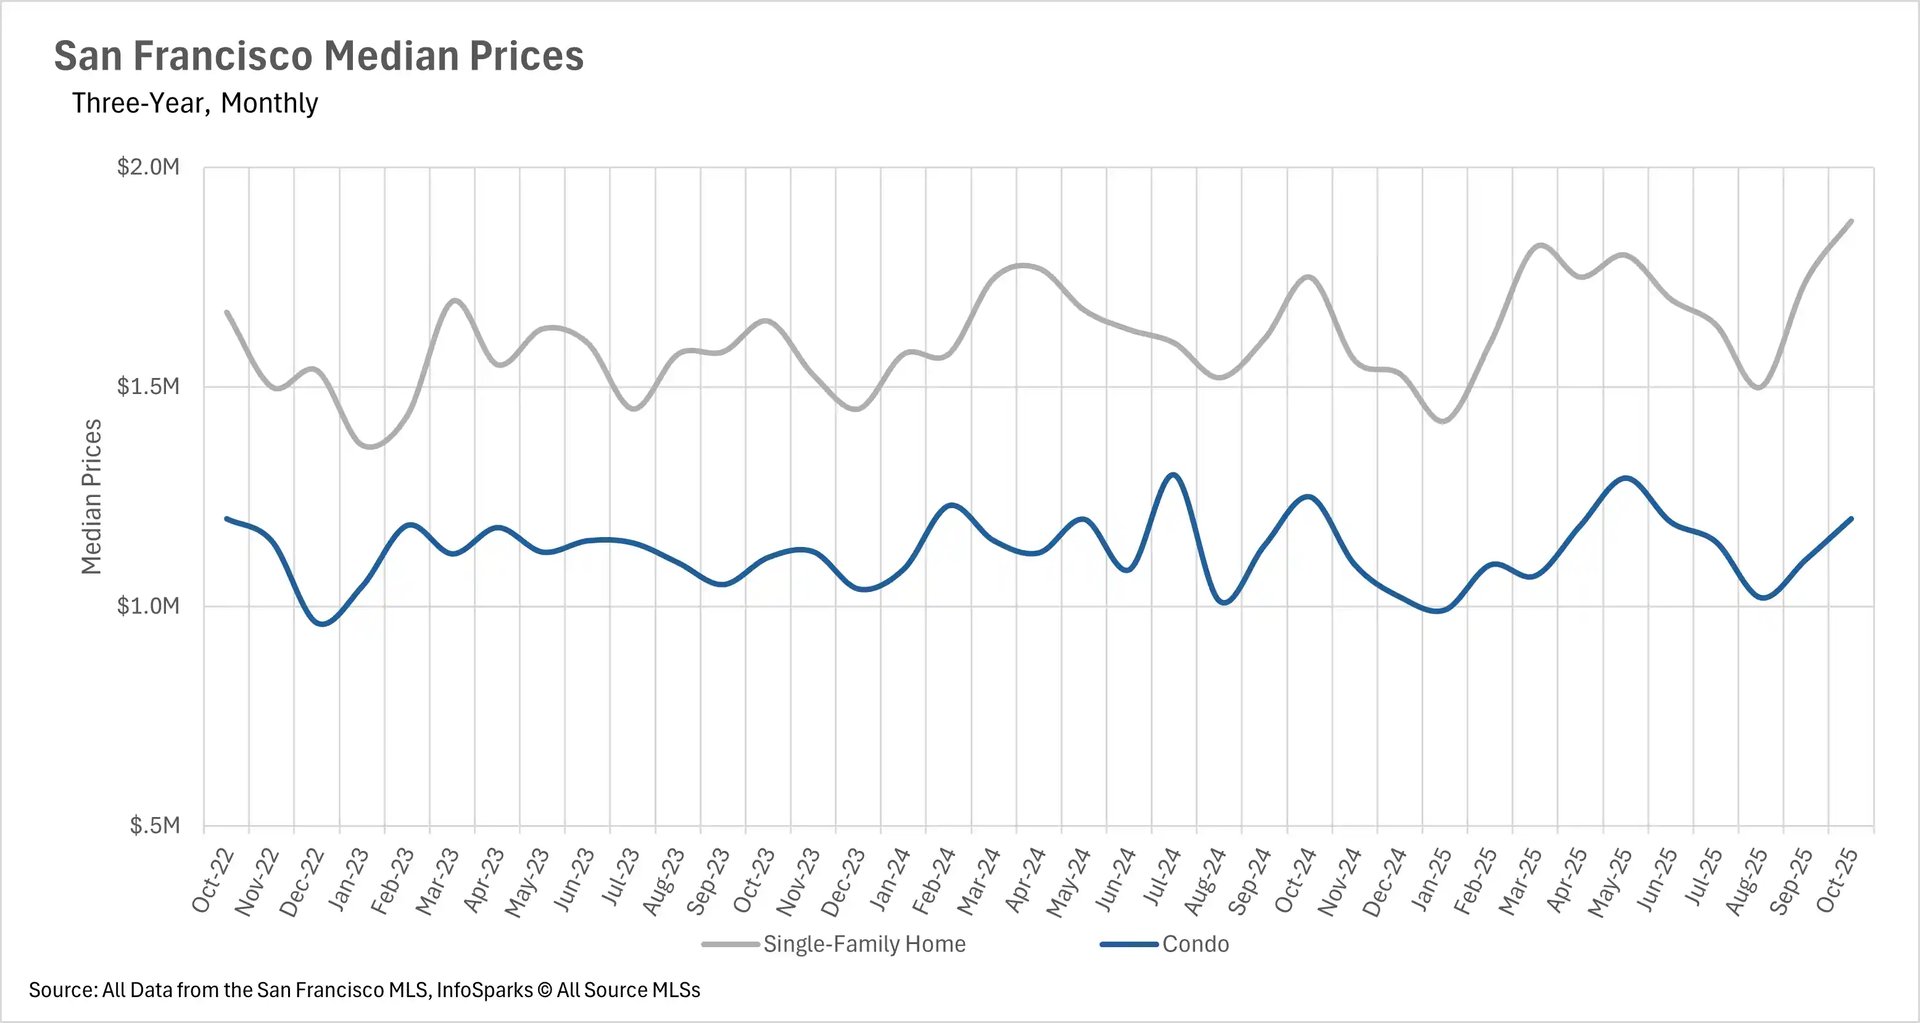
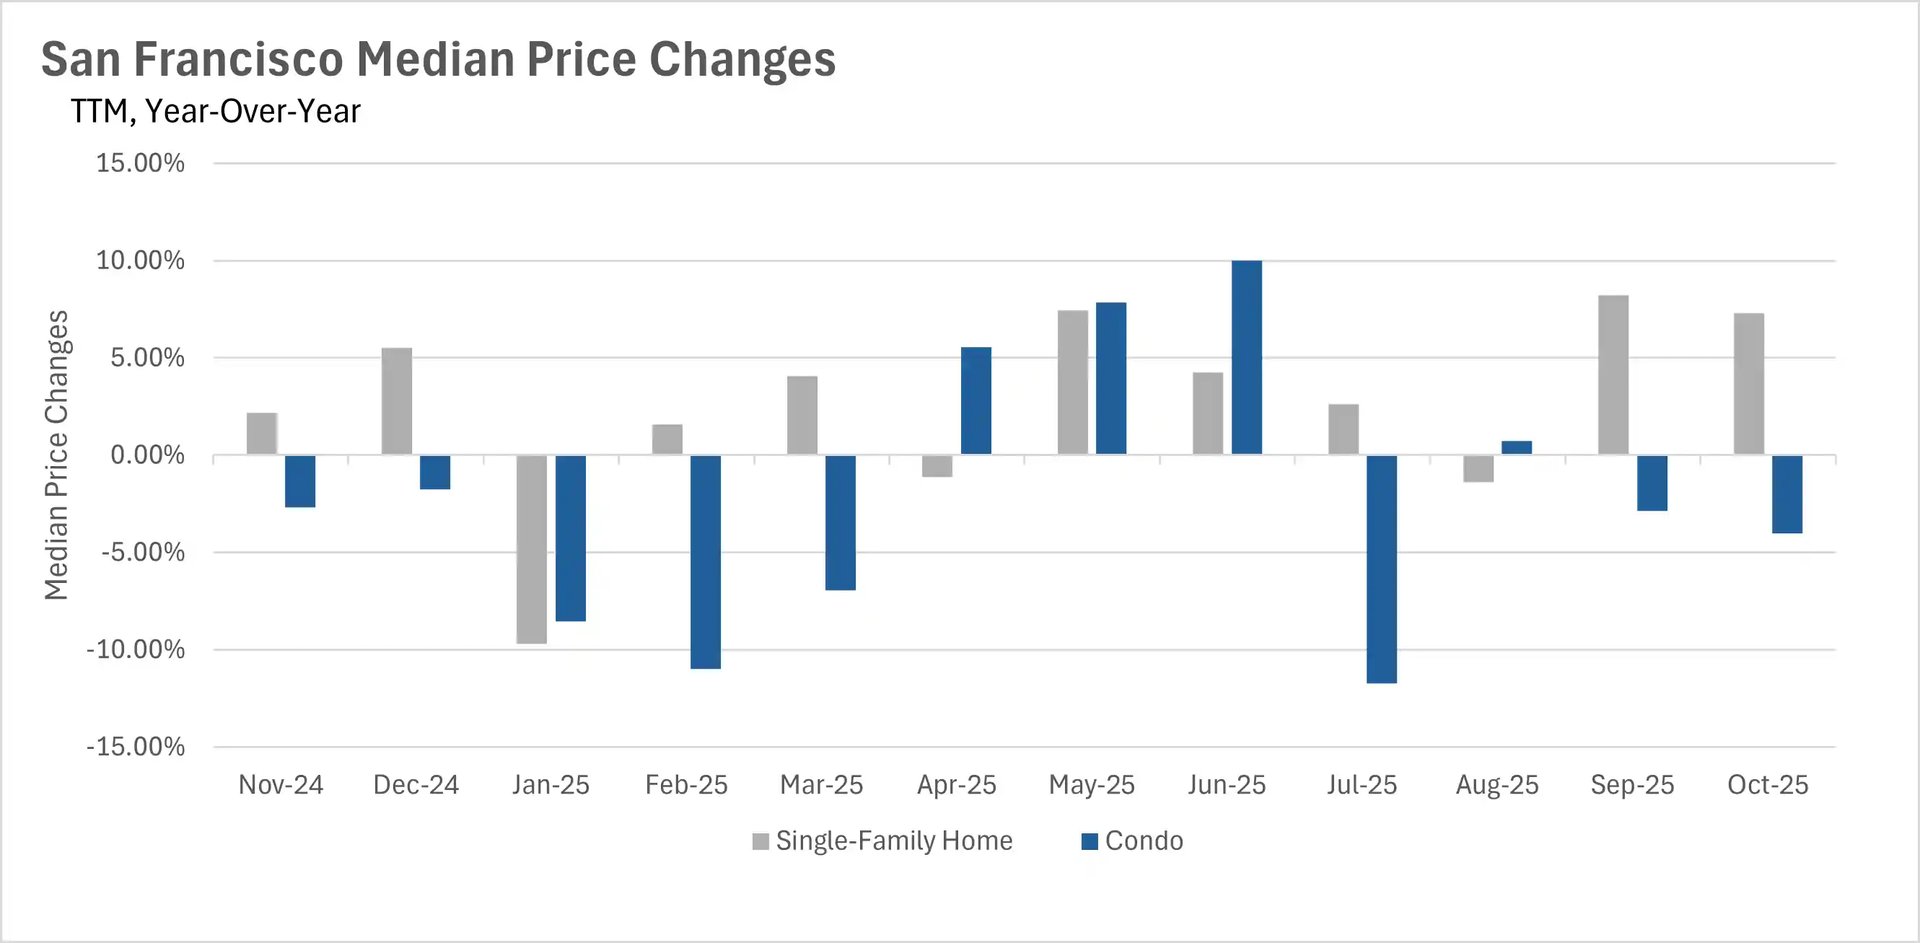
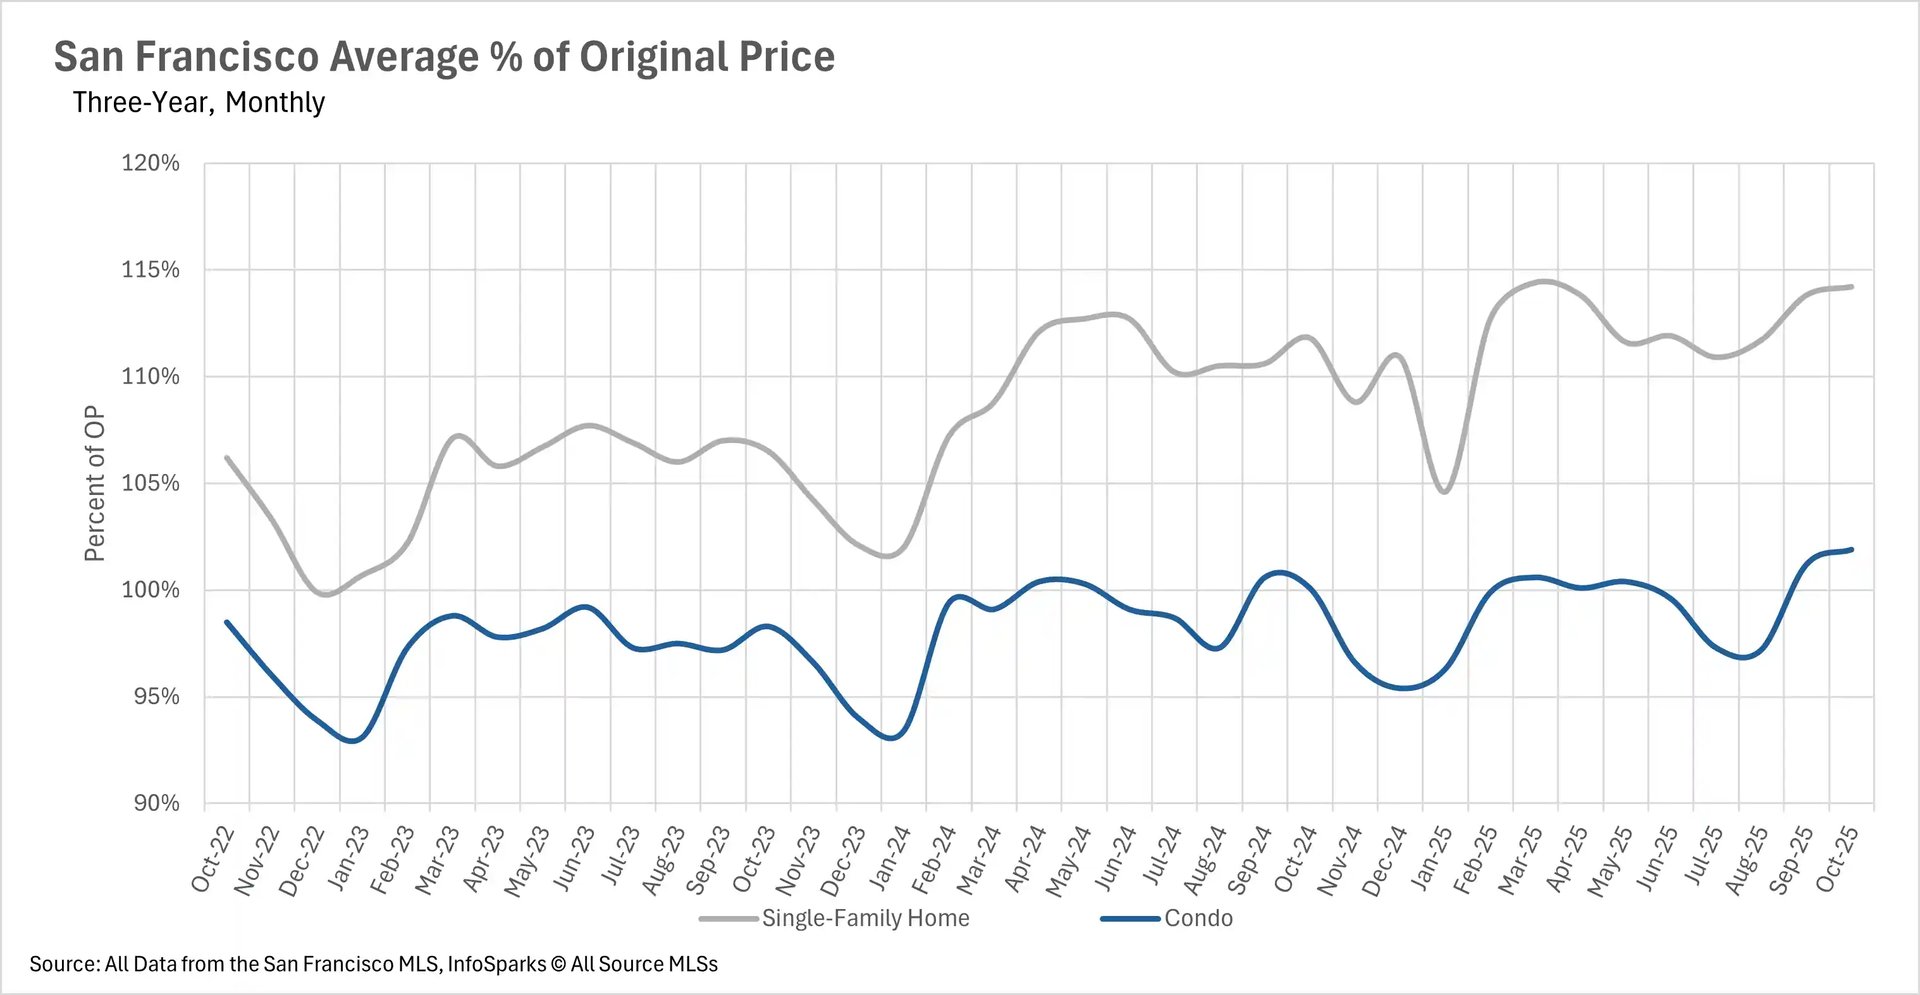
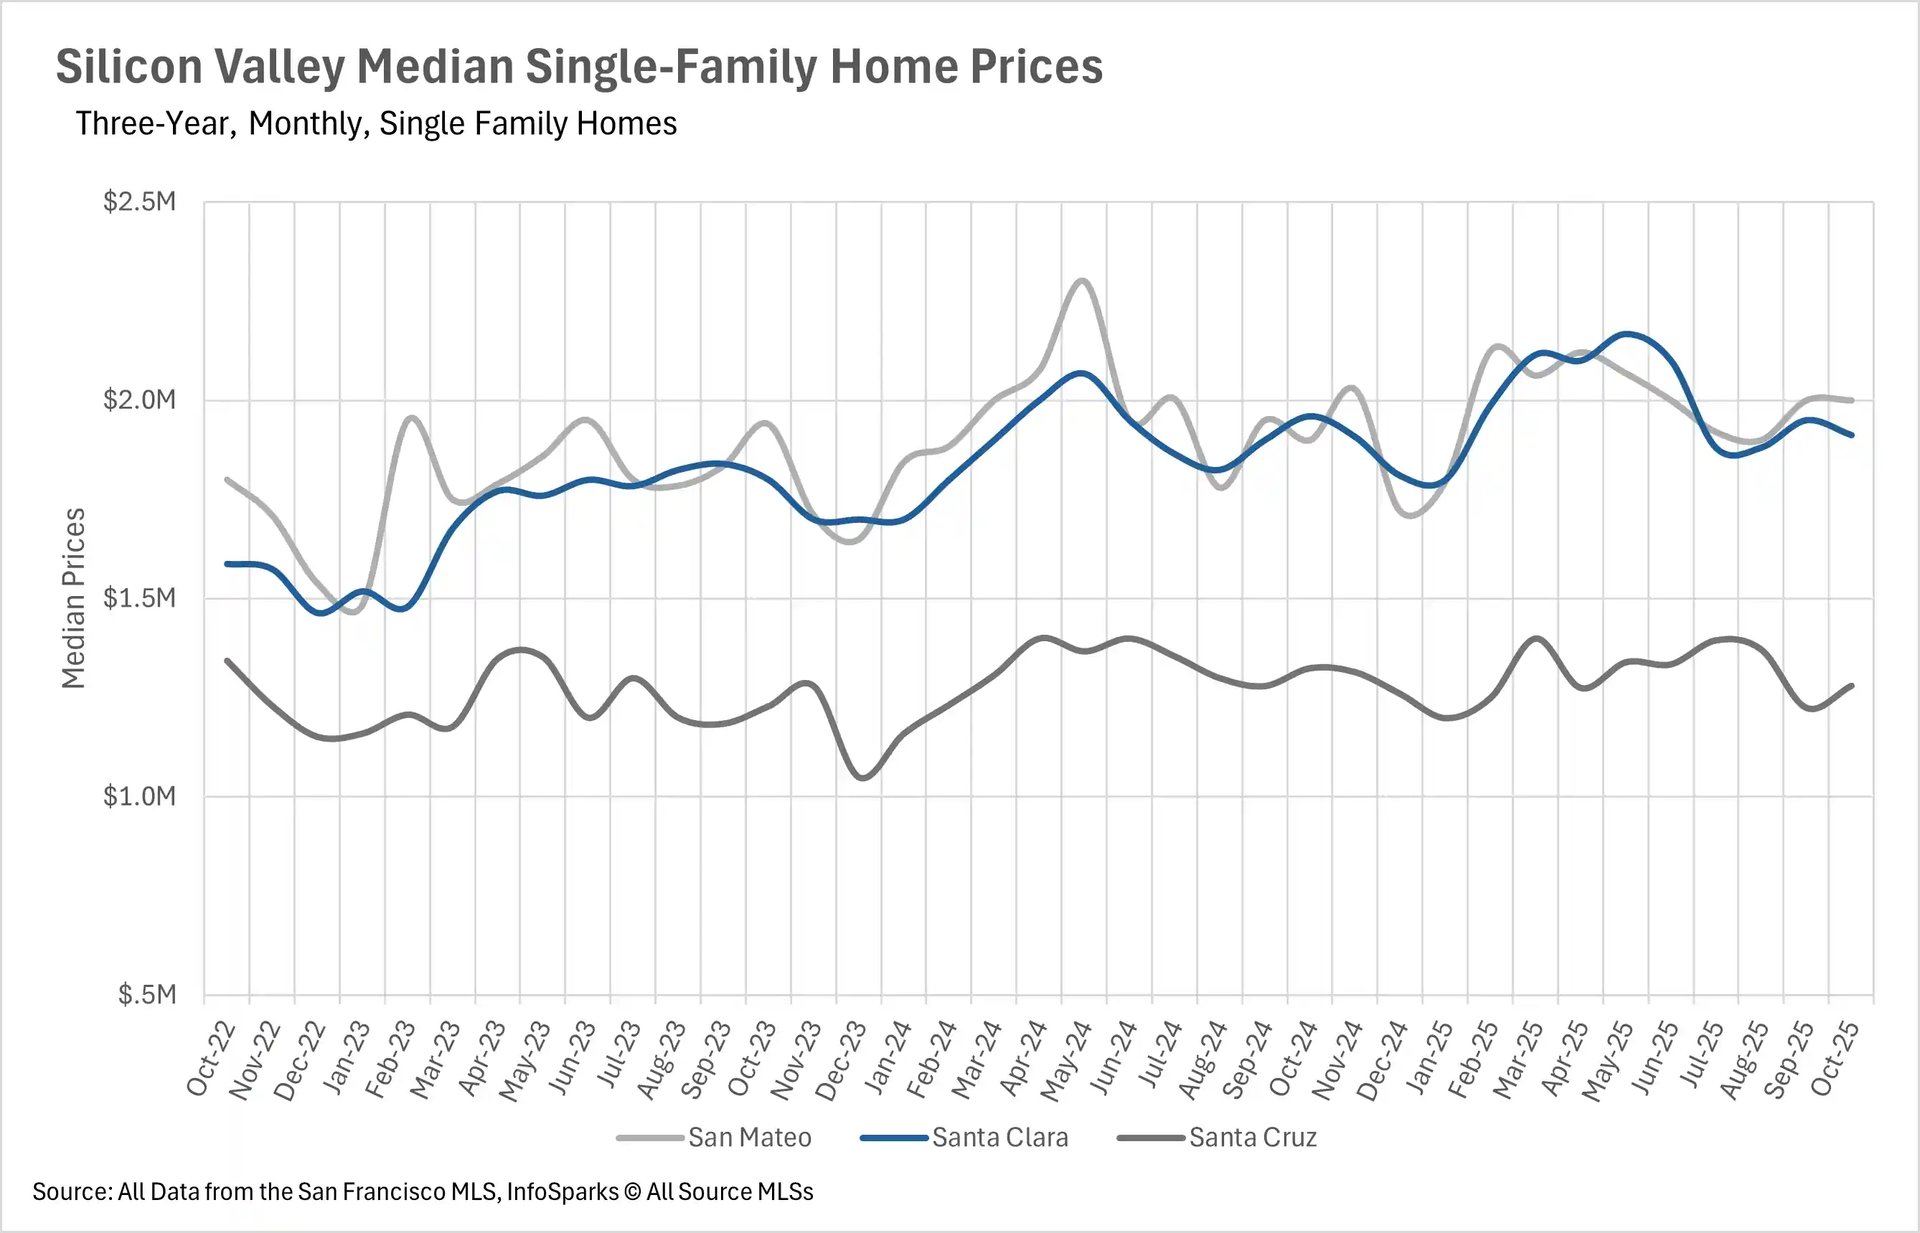
October showcased San Francisco's extraordinary market strength, with single-family homes reaching their highest median sale price in two years, representing a 7.29% year-over-year increase. The average single-family home sells for 114.2% of asking price, while condos trade at 101.9% of asking - marking a notable shift from earlier months. However, this San Francisco strength stands in stark contrast to widespread condo weakness across other Bay Area regions. Silicon Valley experienced particularly severe condo declines, with San Mateo down 4.73%, Santa Clara plummeting 8.97%, and Santa Cruz collapsing 18.77% year-over-year.
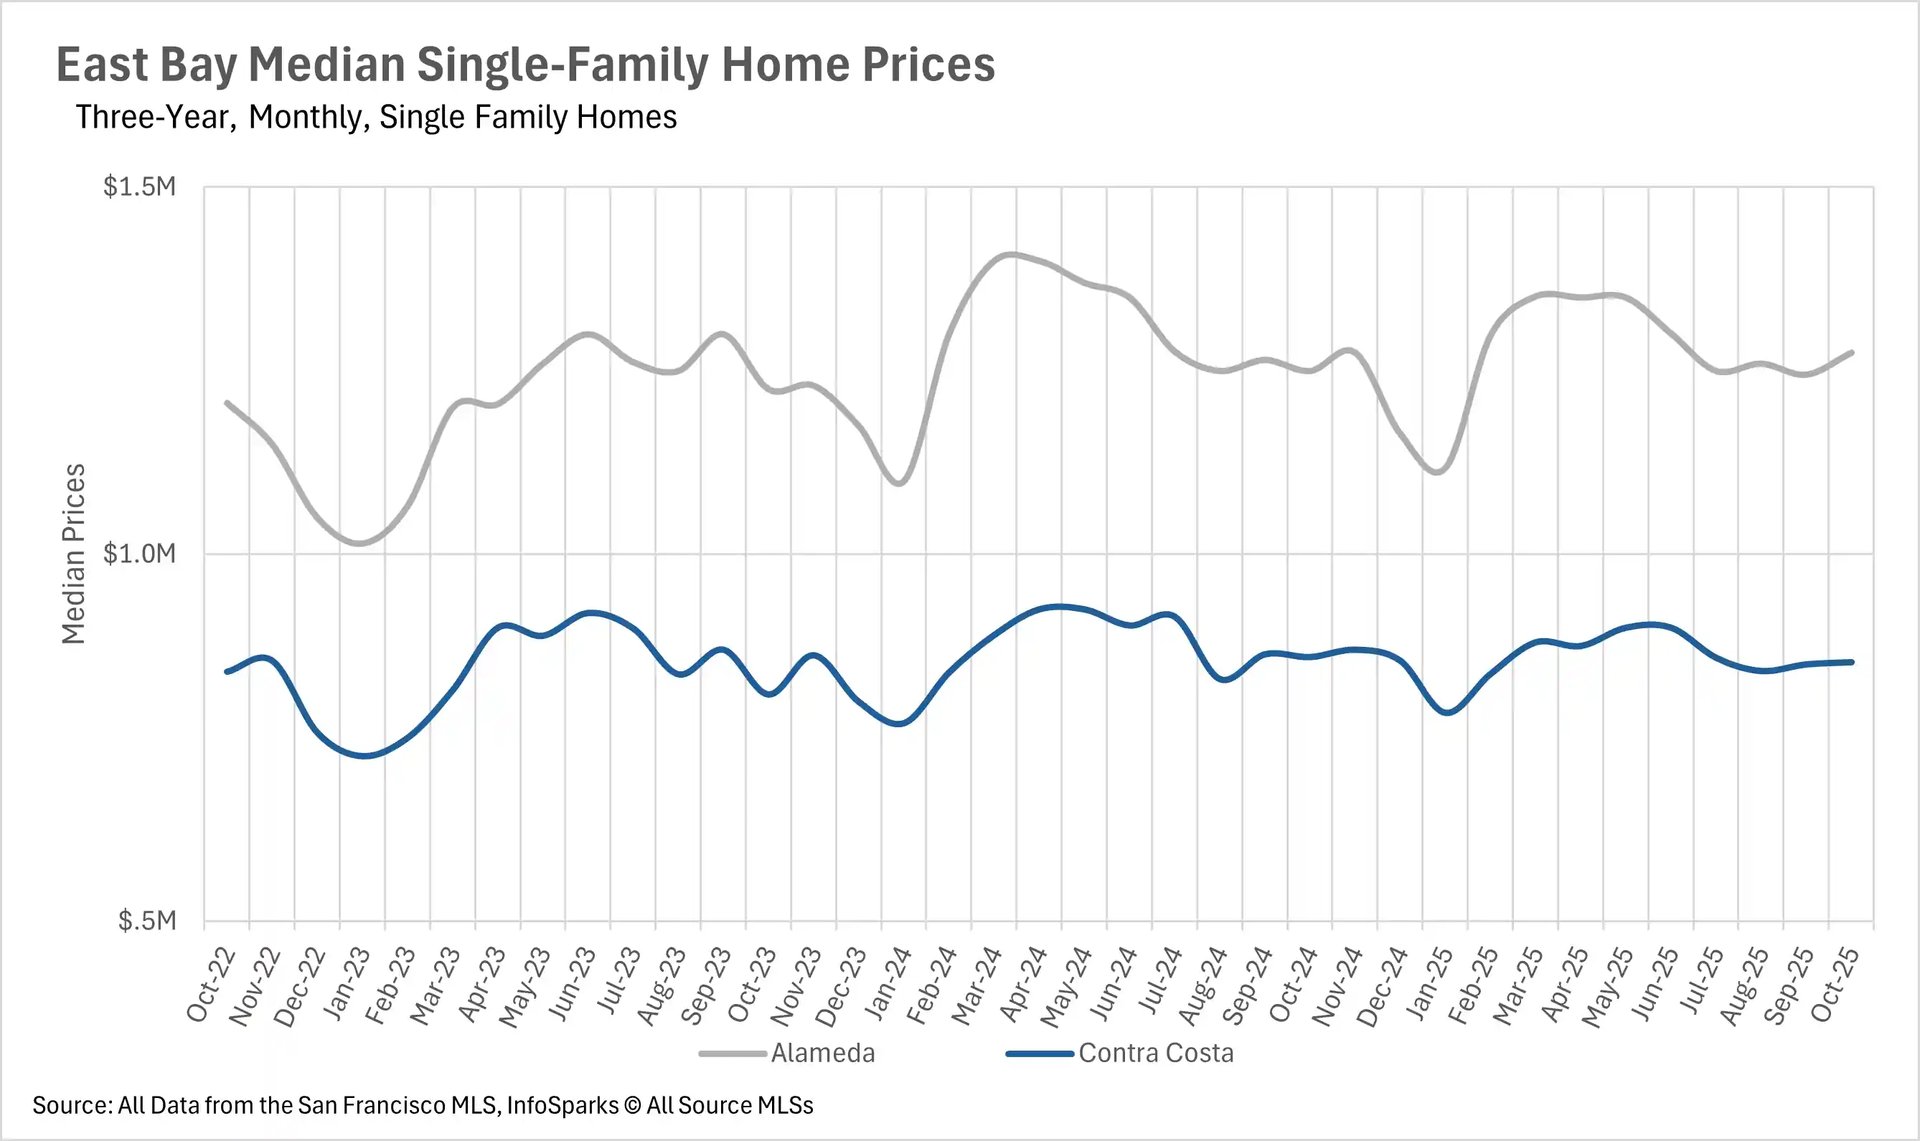
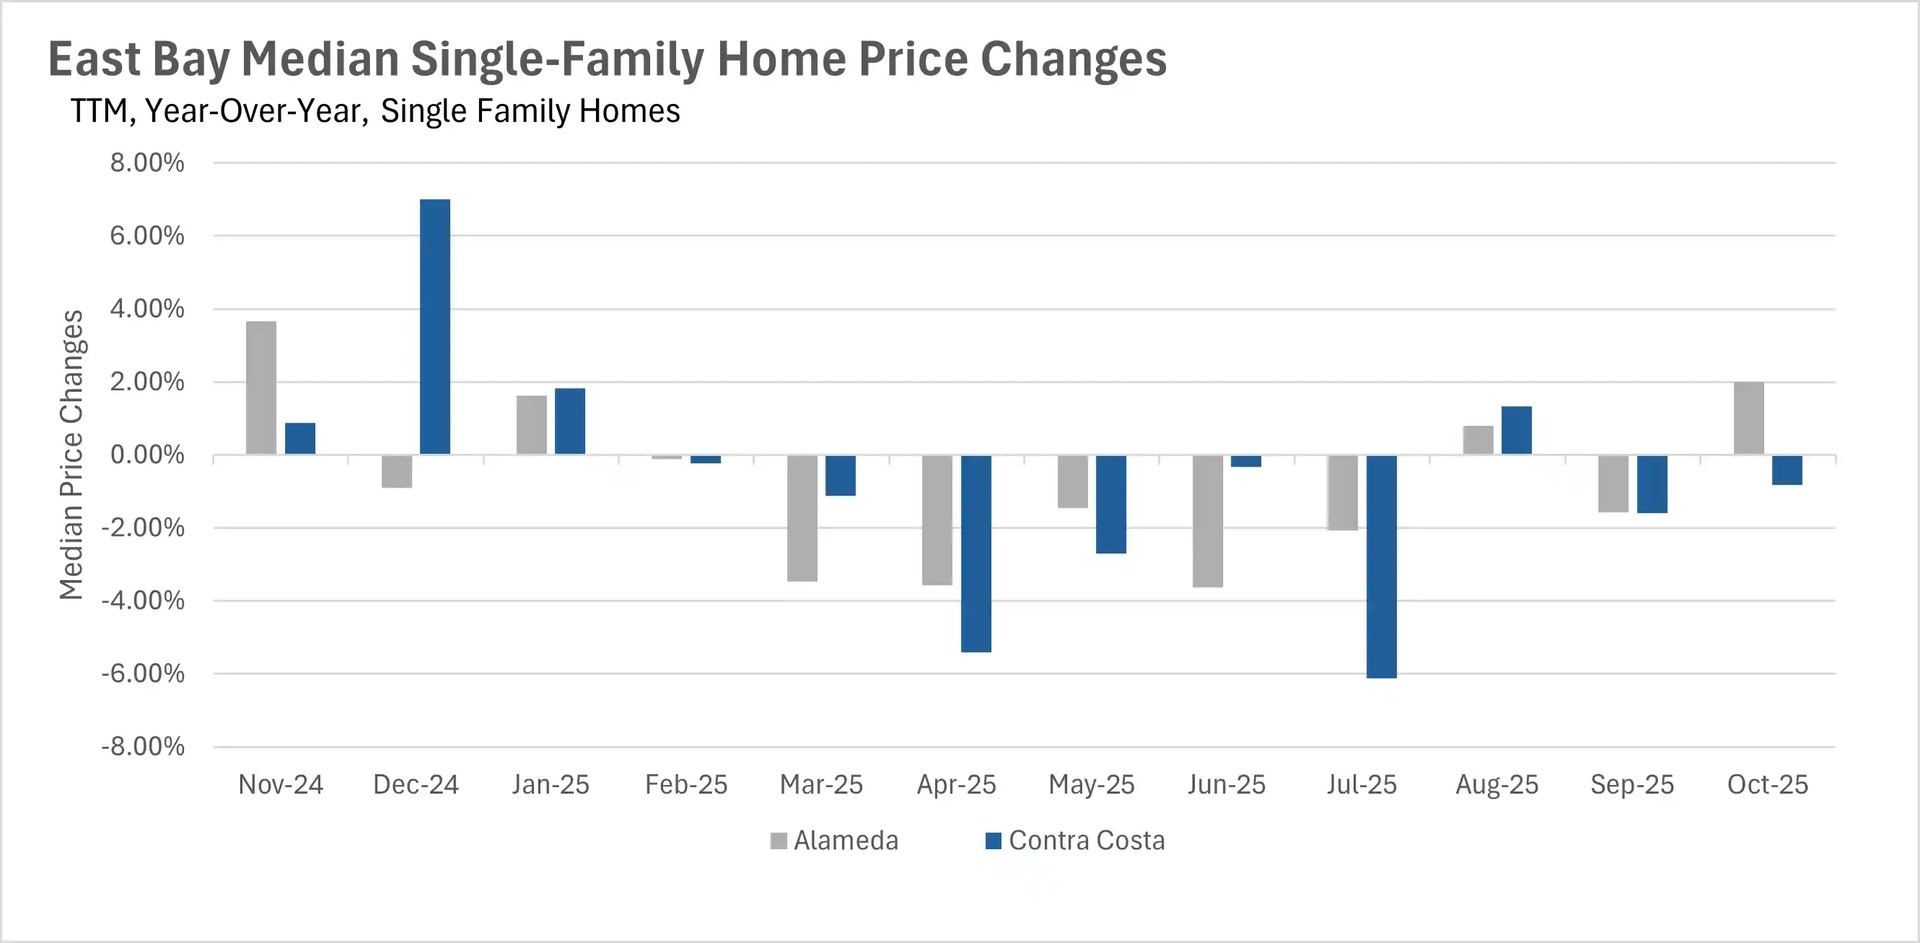
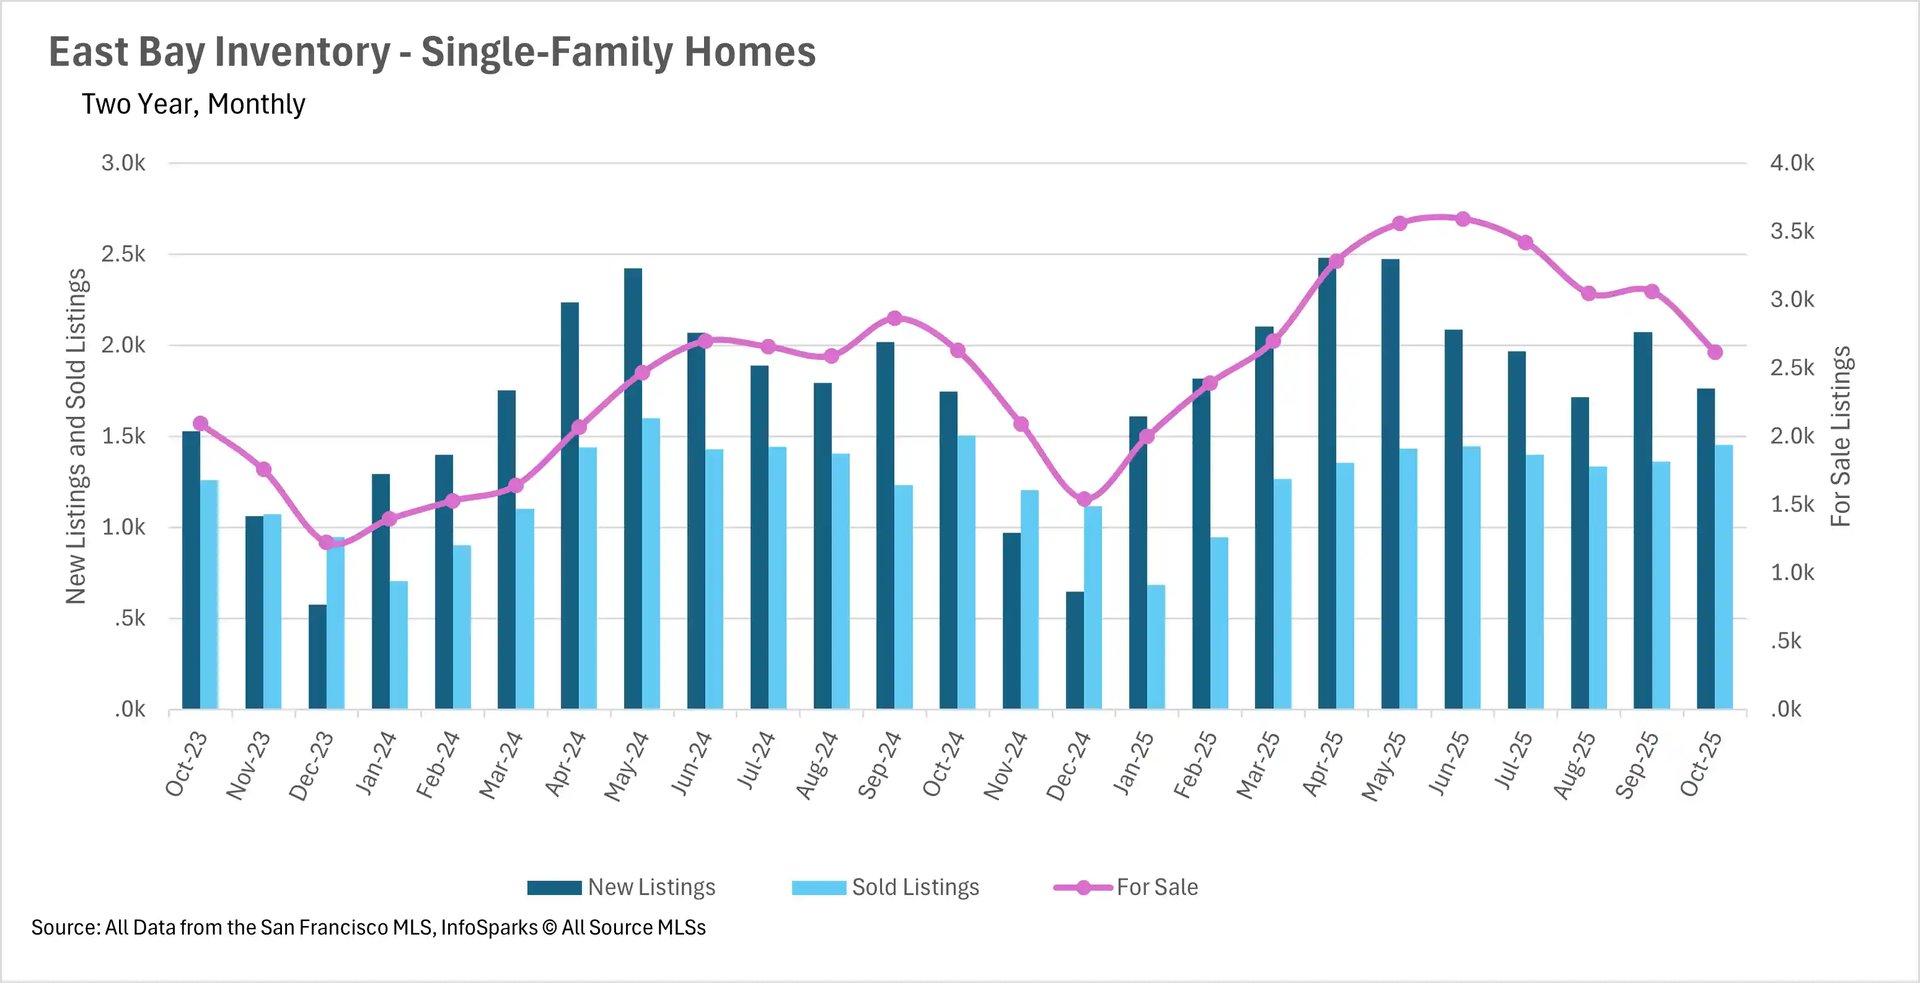
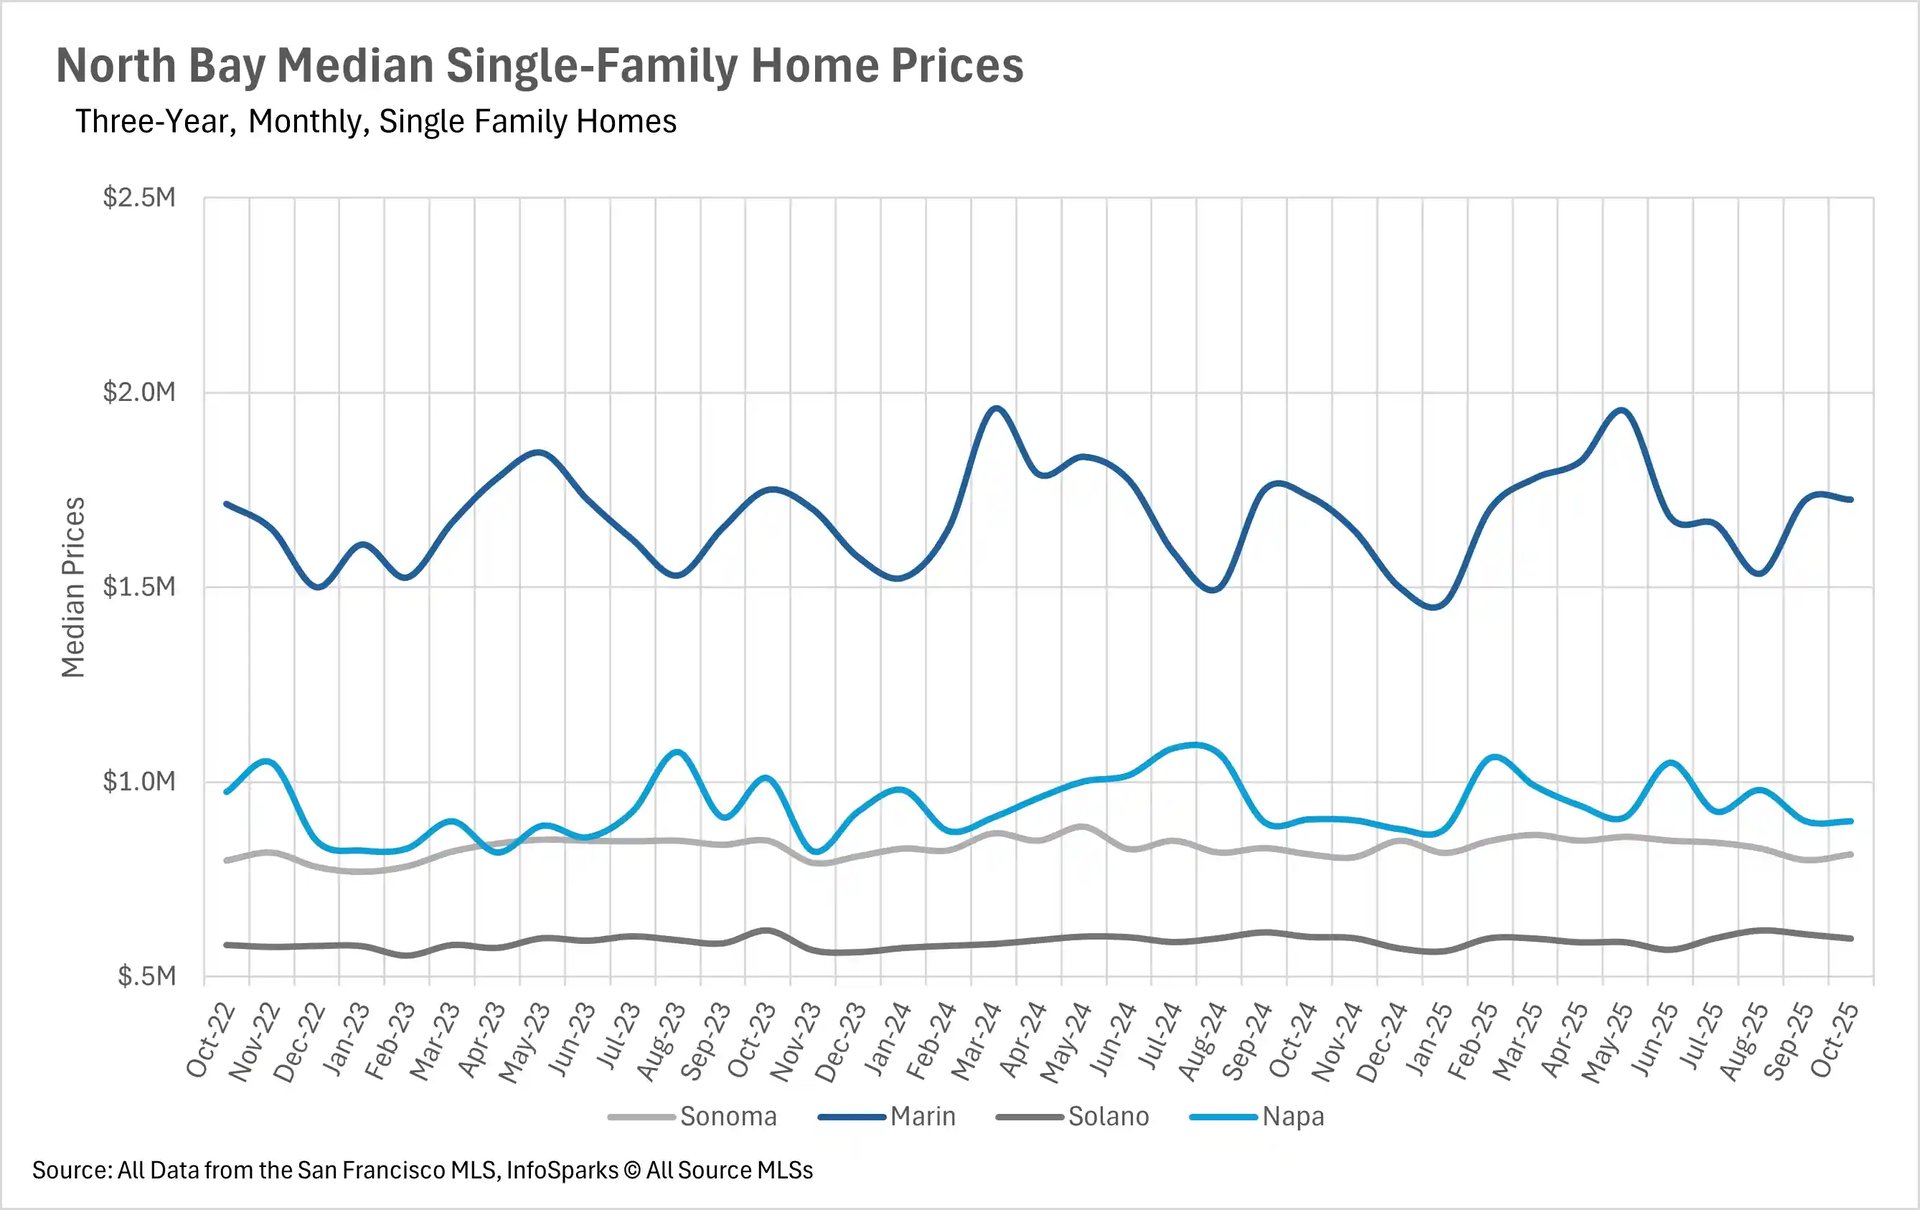
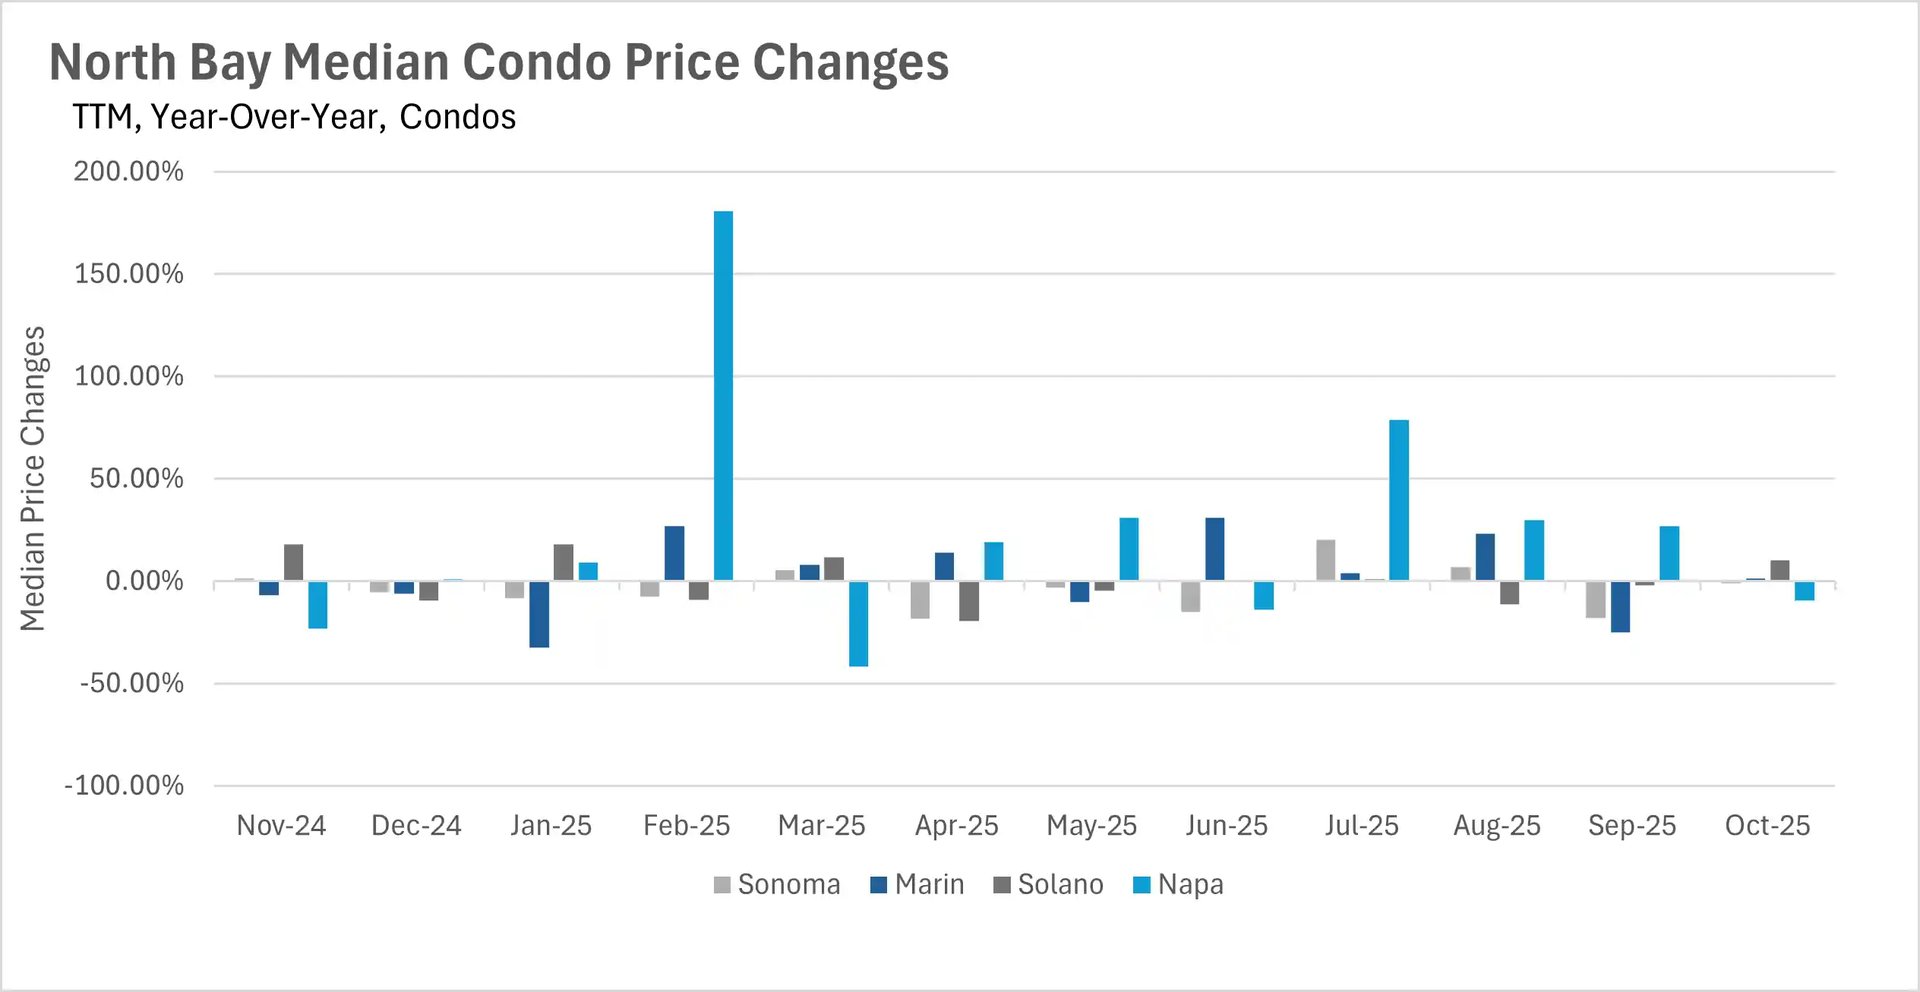
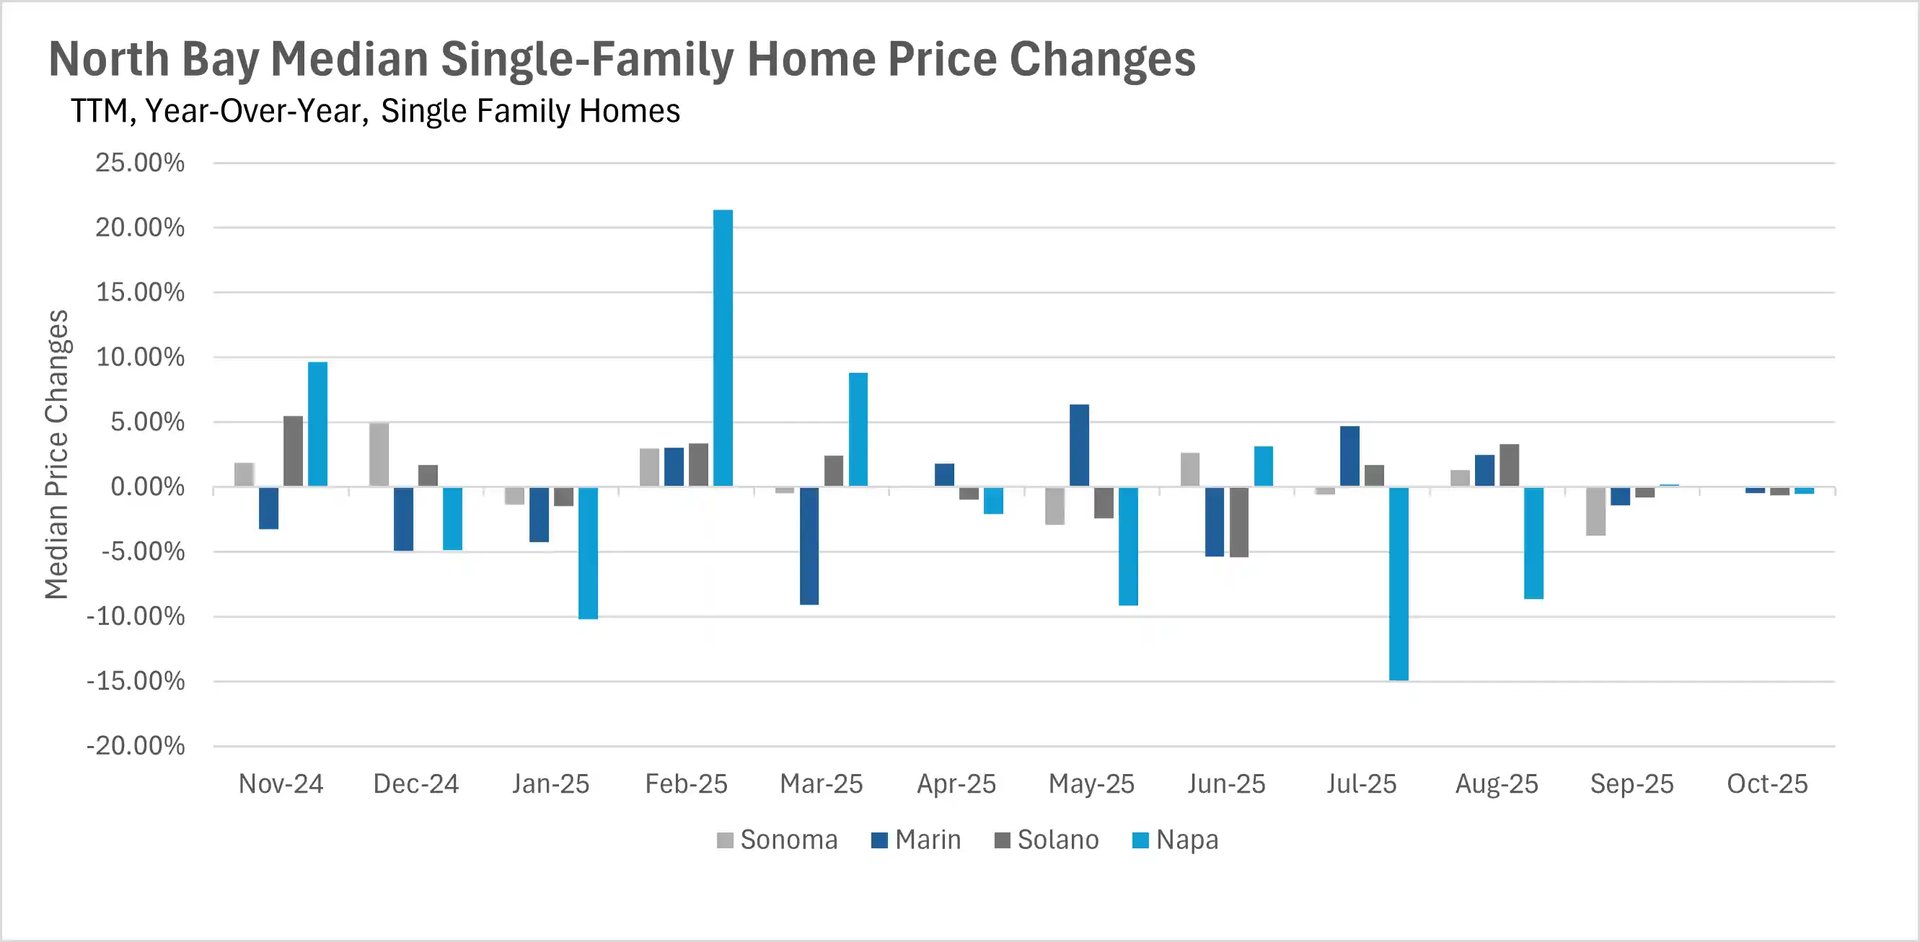
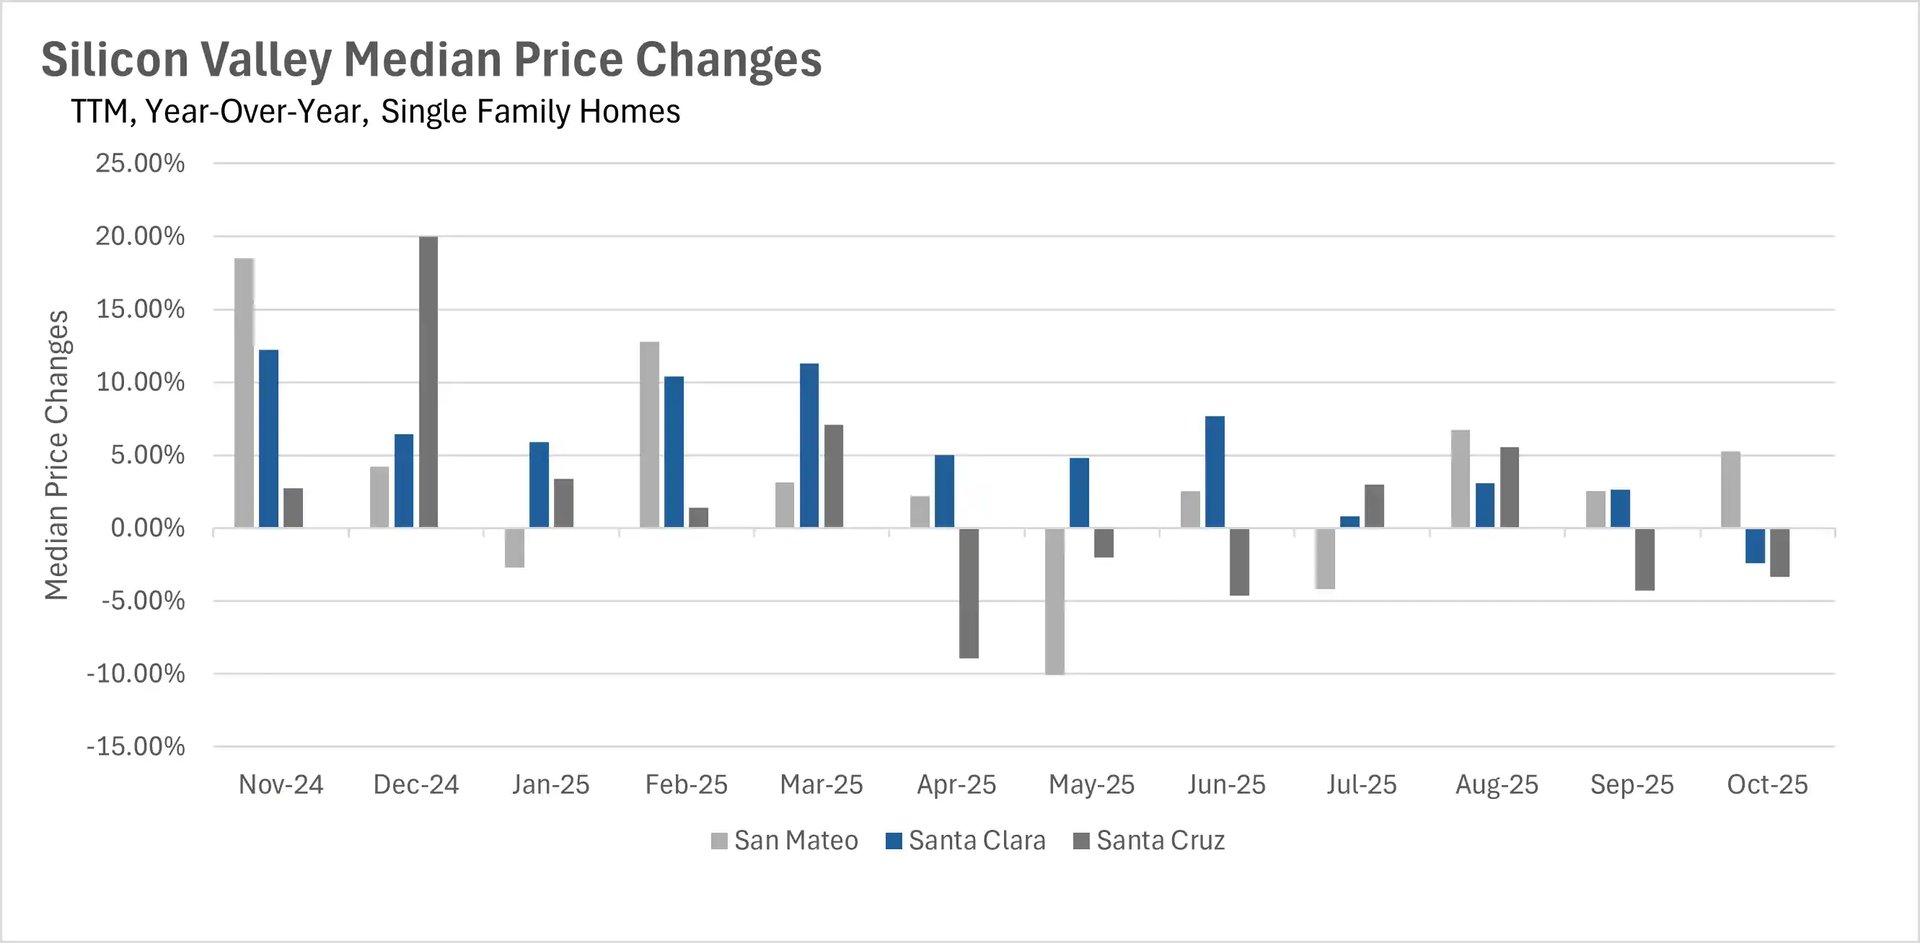
Single-family homes in Silicon Valley showed more stability, with San Mateo up 5.26%, while Santa Clara and Santa Cruz declined modestly by 2.42% and 3.33% respectively. The East Bay demonstrated minimal movement in single-family prices, with Alameda up 2.00% and Contra Costa down just 0.81%, though condos extended their losing streak with declines of 9.38% and 7.69% respectively. The North Bay showed remarkable price stability overall, with single-family homes and condos in most counties trading within their historical bands, though notable volatility emerged in certain condo markets - Solano County jumped 10.26% while Napa County fell 9.49%.
The great inventory overcorrection transforms regional supply dynamics
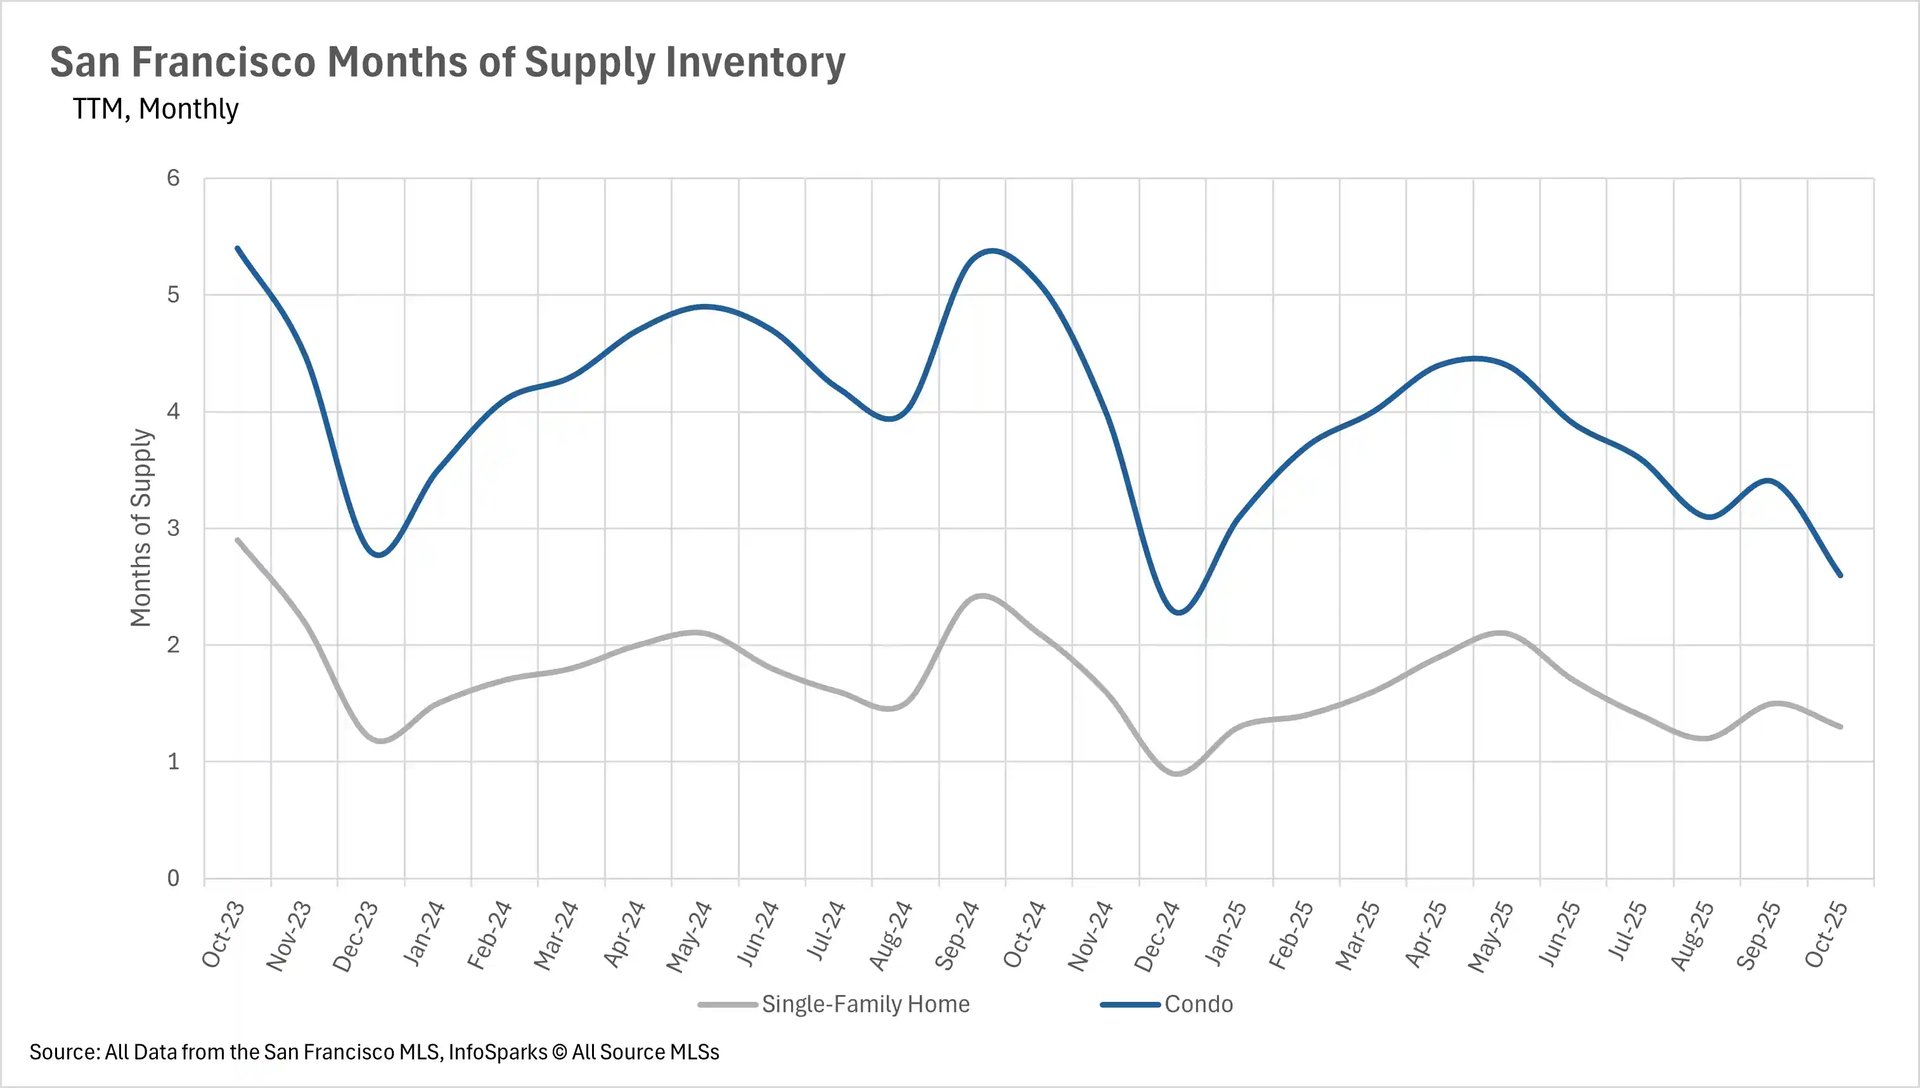
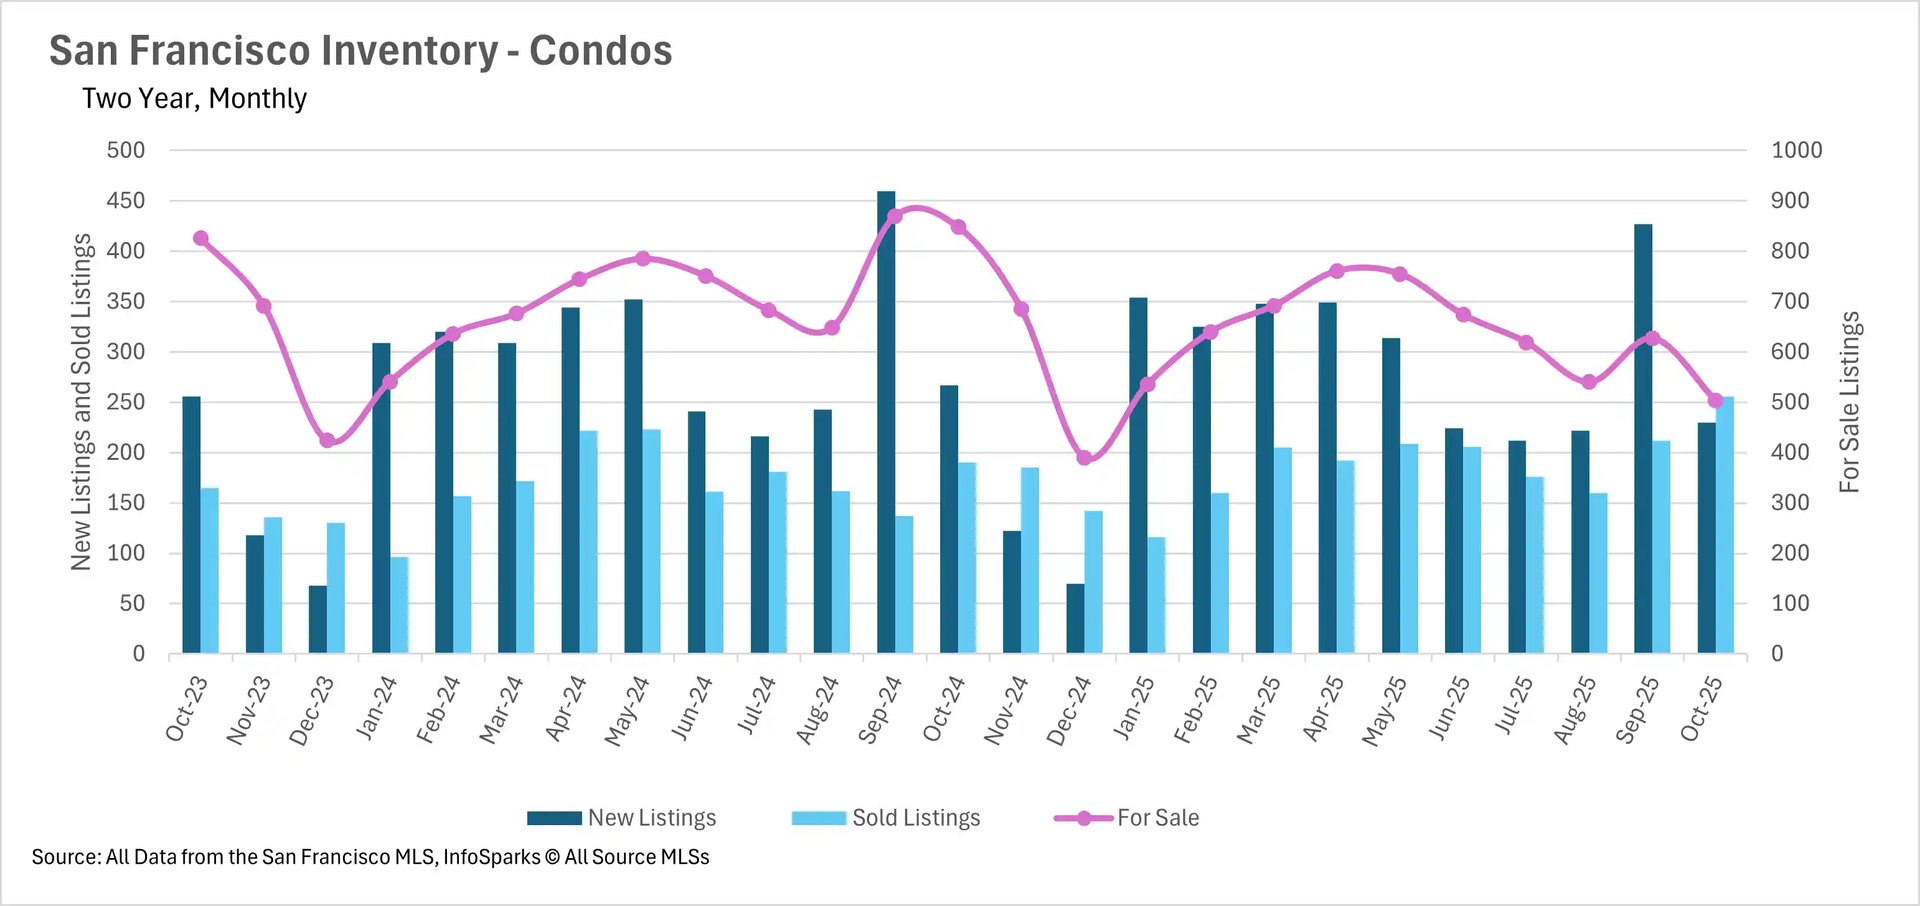
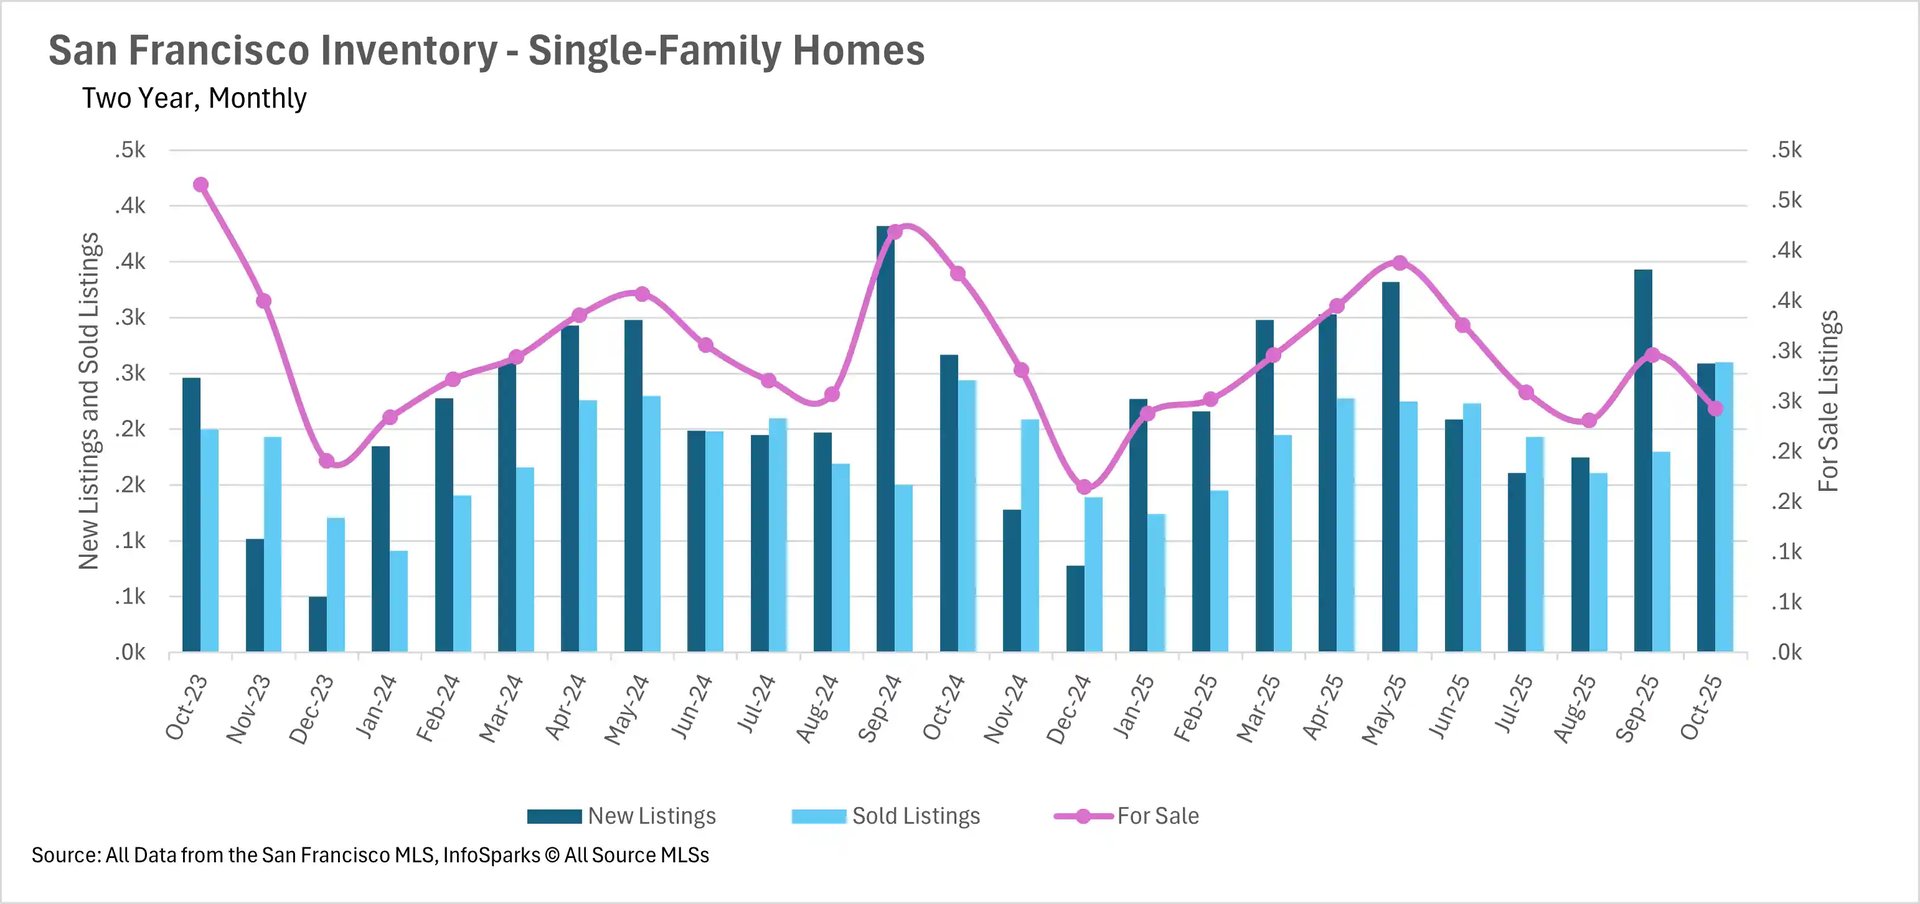
October marked a dramatic reversal in Bay Area inventory trends, with most regions swinging from elevated summer levels to significant year-over-year deficits. San Francisco led this transformation with the most extreme contraction, as single-family inventory plummeted 35.54% and condo inventory crashed 40.68% below last year's levels. This dramatic decline resulted in months of supply dropping to 1.3 for single-family homes (down 38.10% year-over-year) and 2.6 for condos (down 49.02%), pushing both property types firmly into seller's market territory for the first time in recent memory.
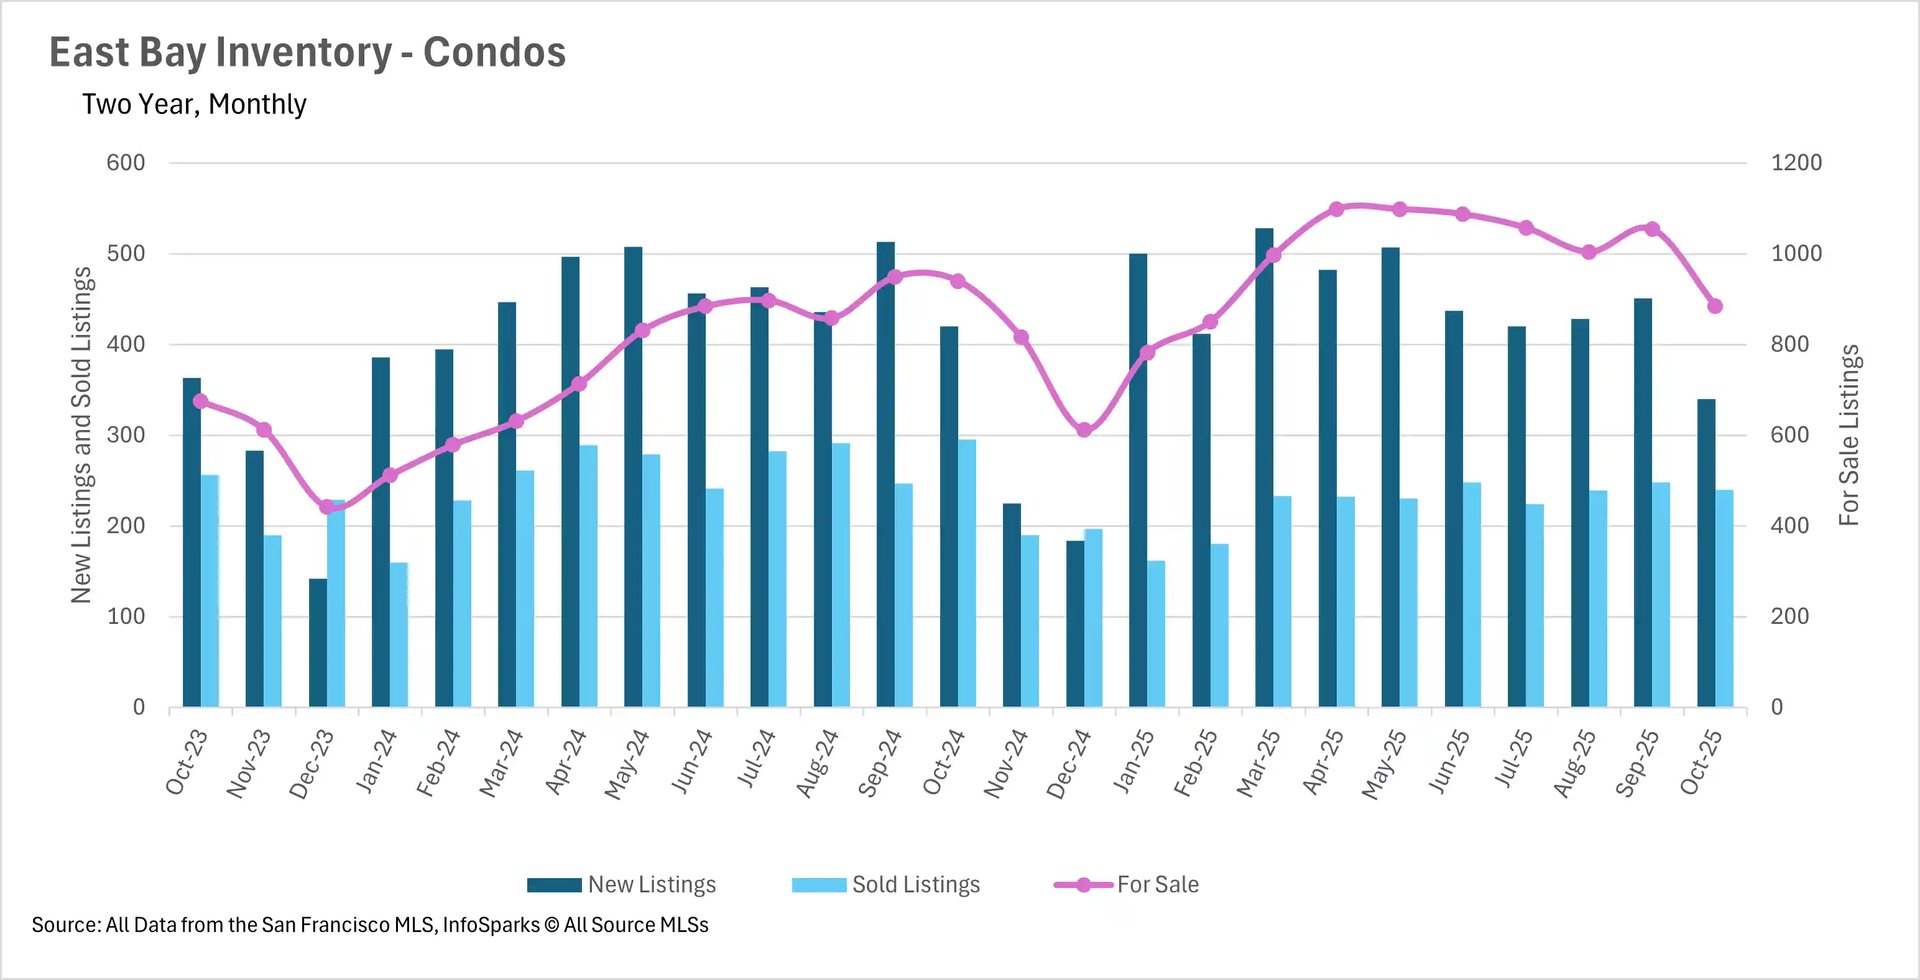
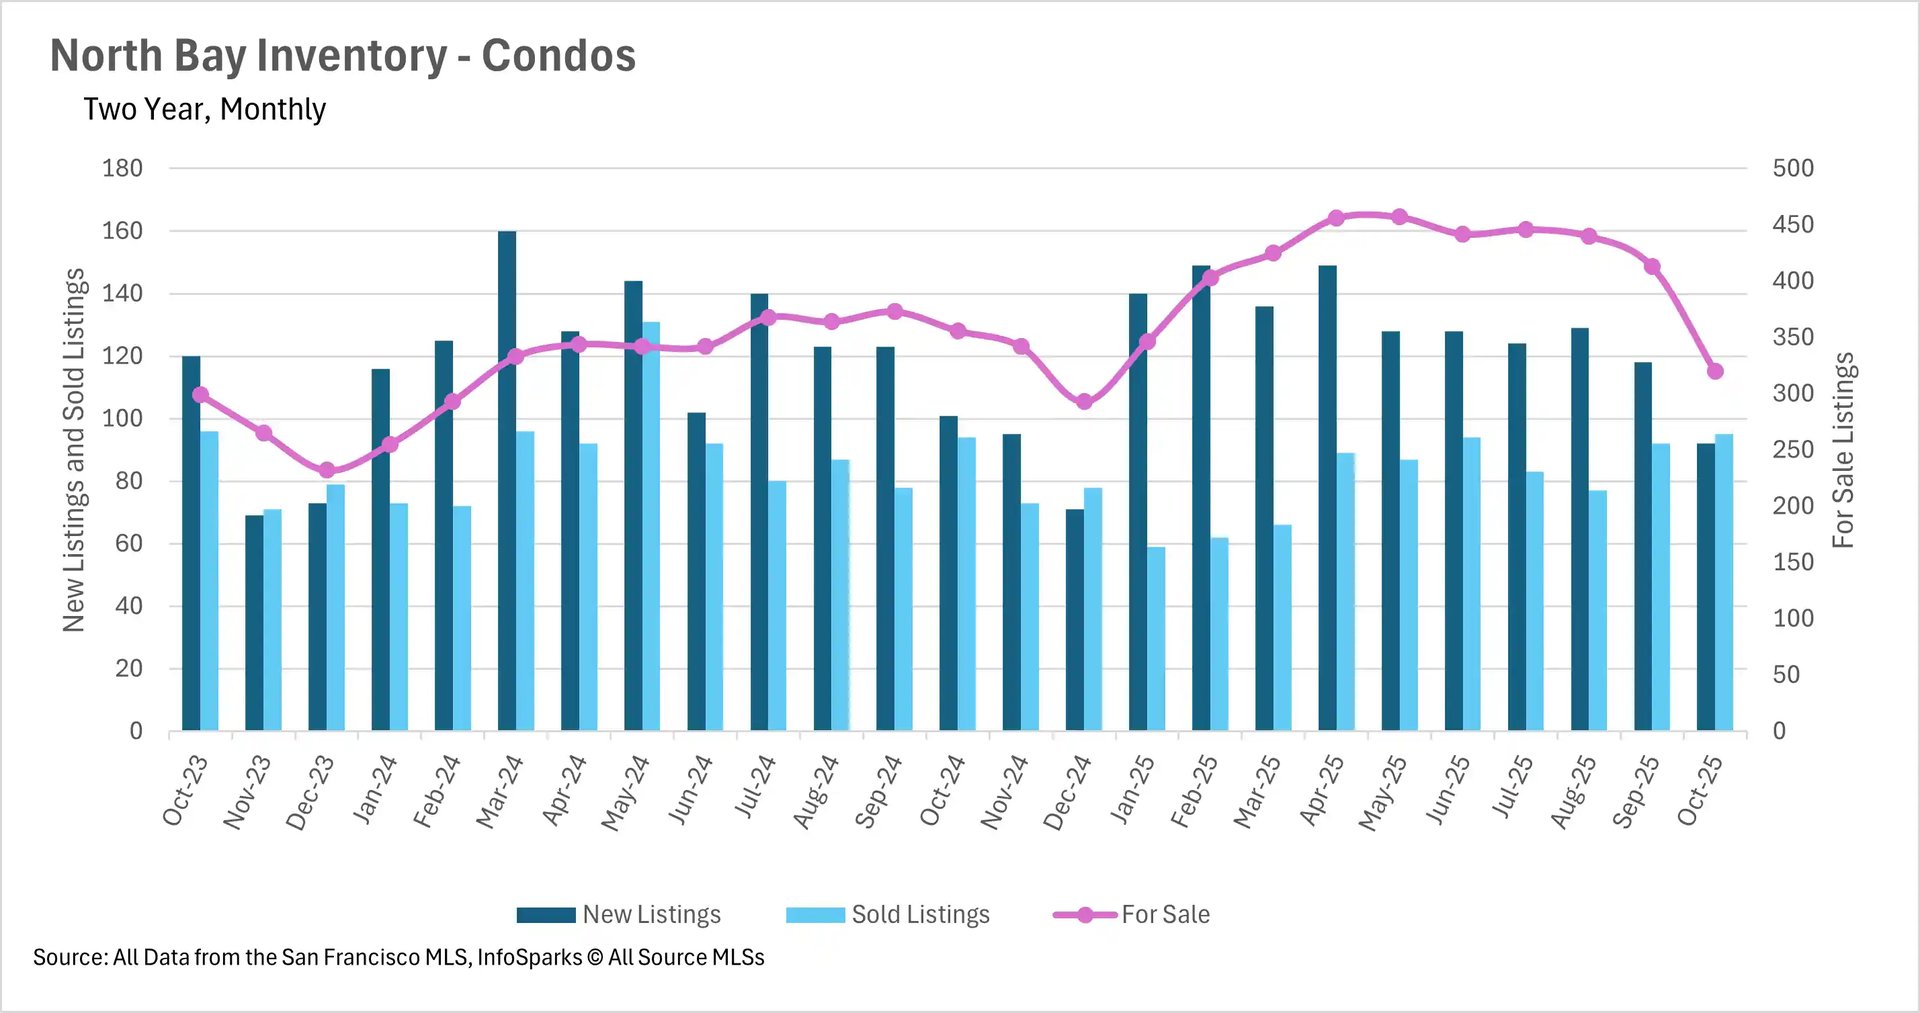
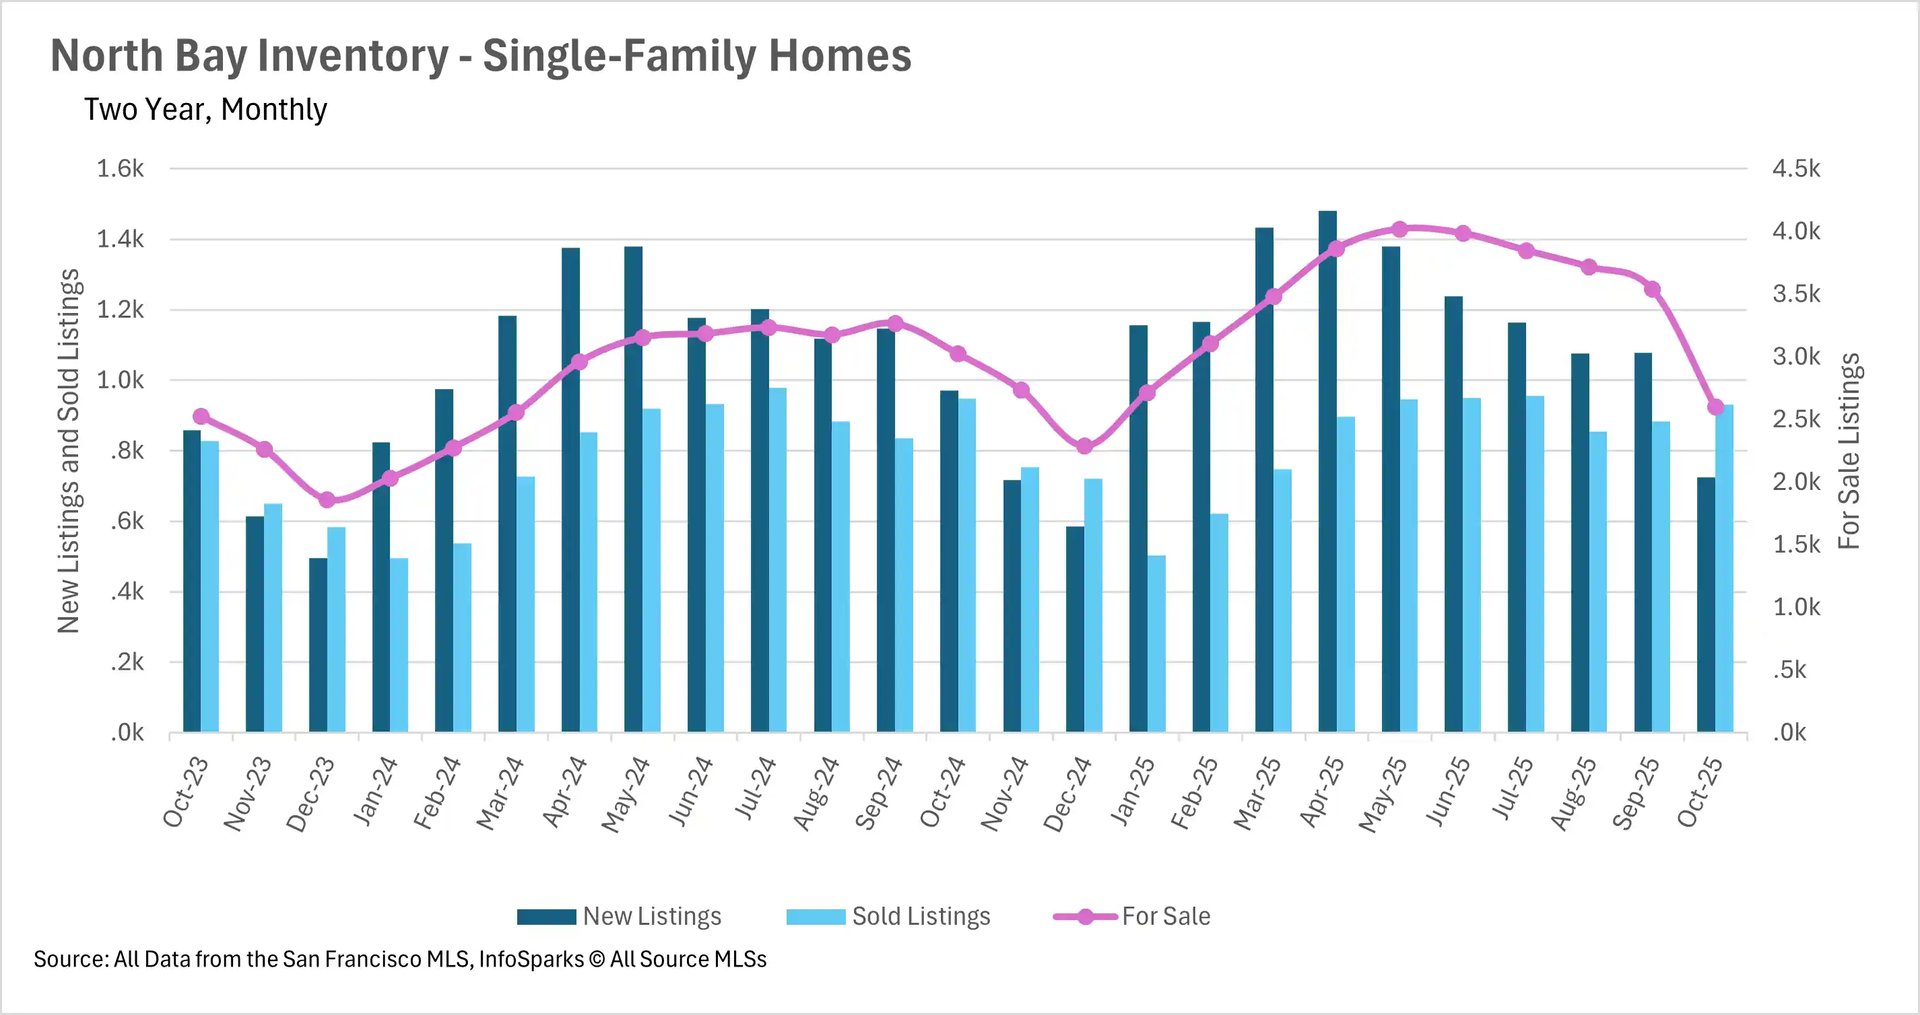
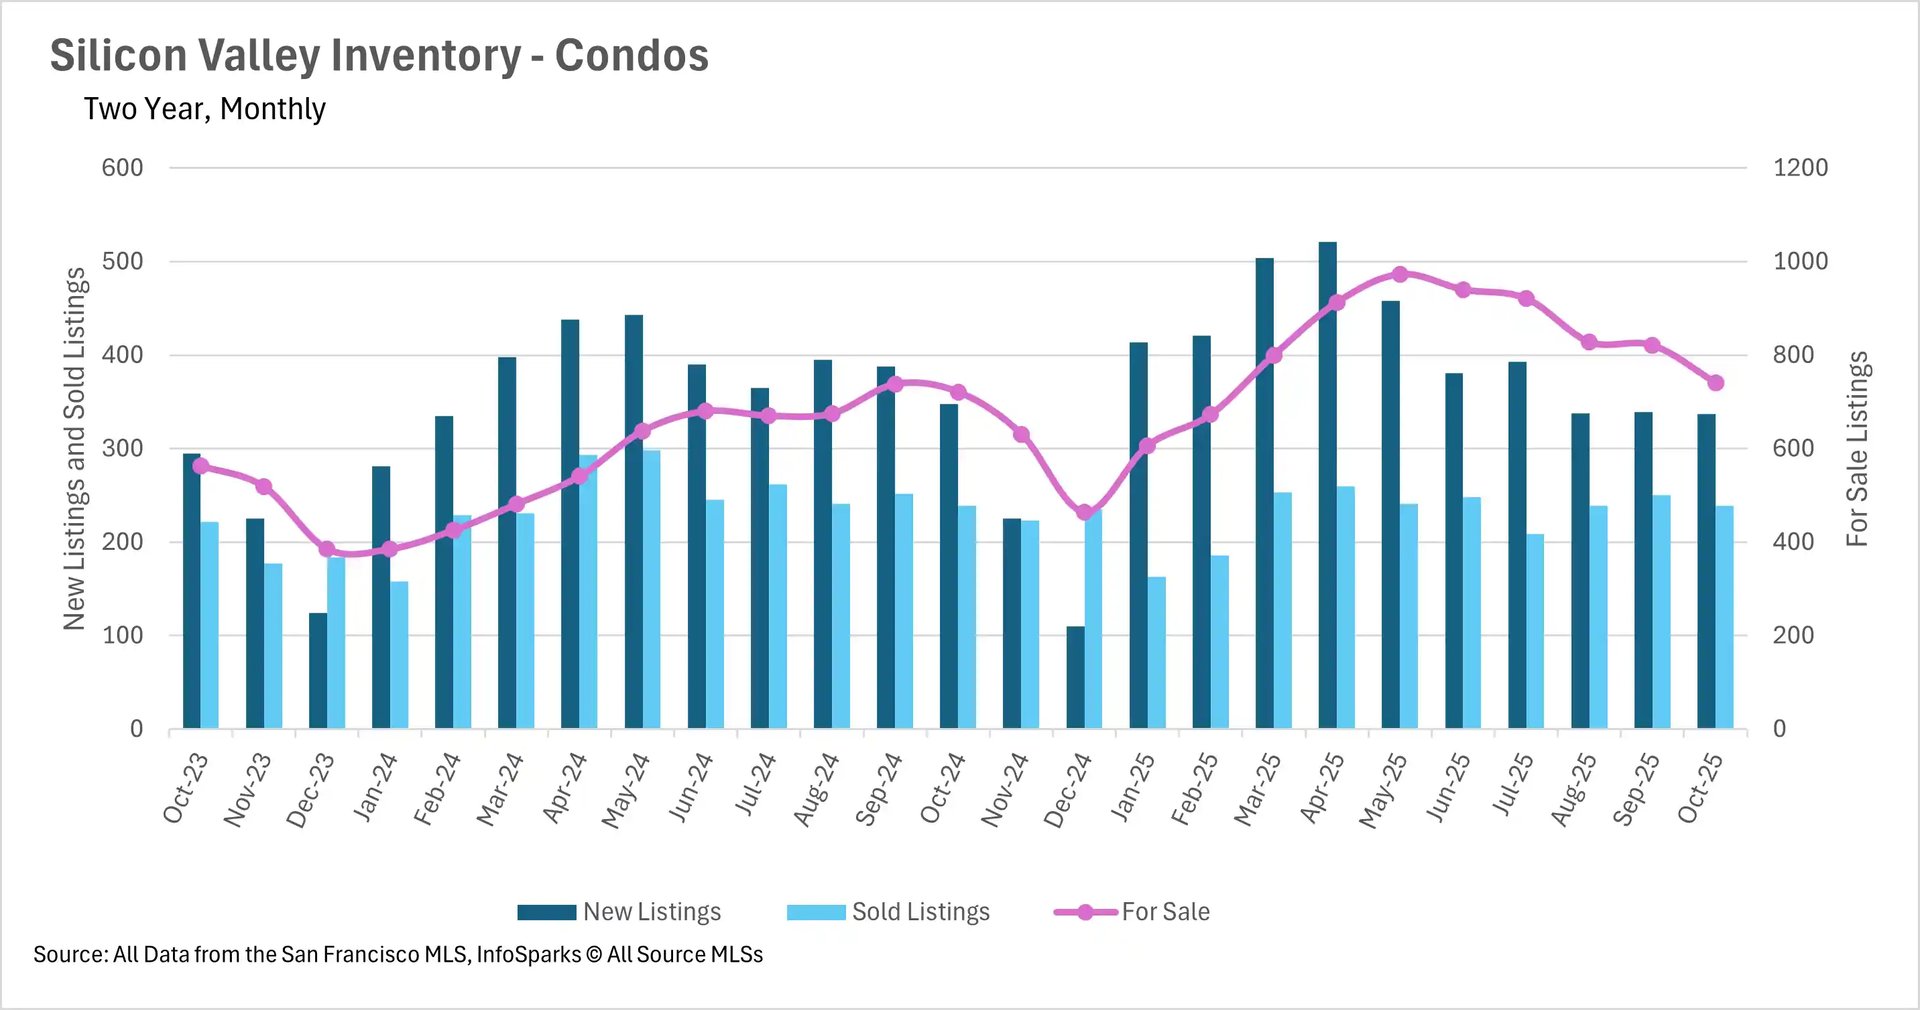
Silicon Valley's single-family market completed its inventory reversal, ending October with 8.72% fewer active listings than last year and 15.22% fewer than the prior month, driven by 5.89% fewer new listings hitting the market. The condo market showed a more modest correction at 2.77% above last year. The North Bay experienced similarly dramatic shifts, with single-family inventory down 14.06% and condos down 10.11% year-over-year, driven primarily by steep 25.41% and 8.91% declines in new listings for each property type respectively. The East Bay stood as the lone exception with relatively static inventory levels, though the condo market showed interesting developments with 19.05% fewer listings added and 5.85% lower active inventory, suggesting a potential inflection point.
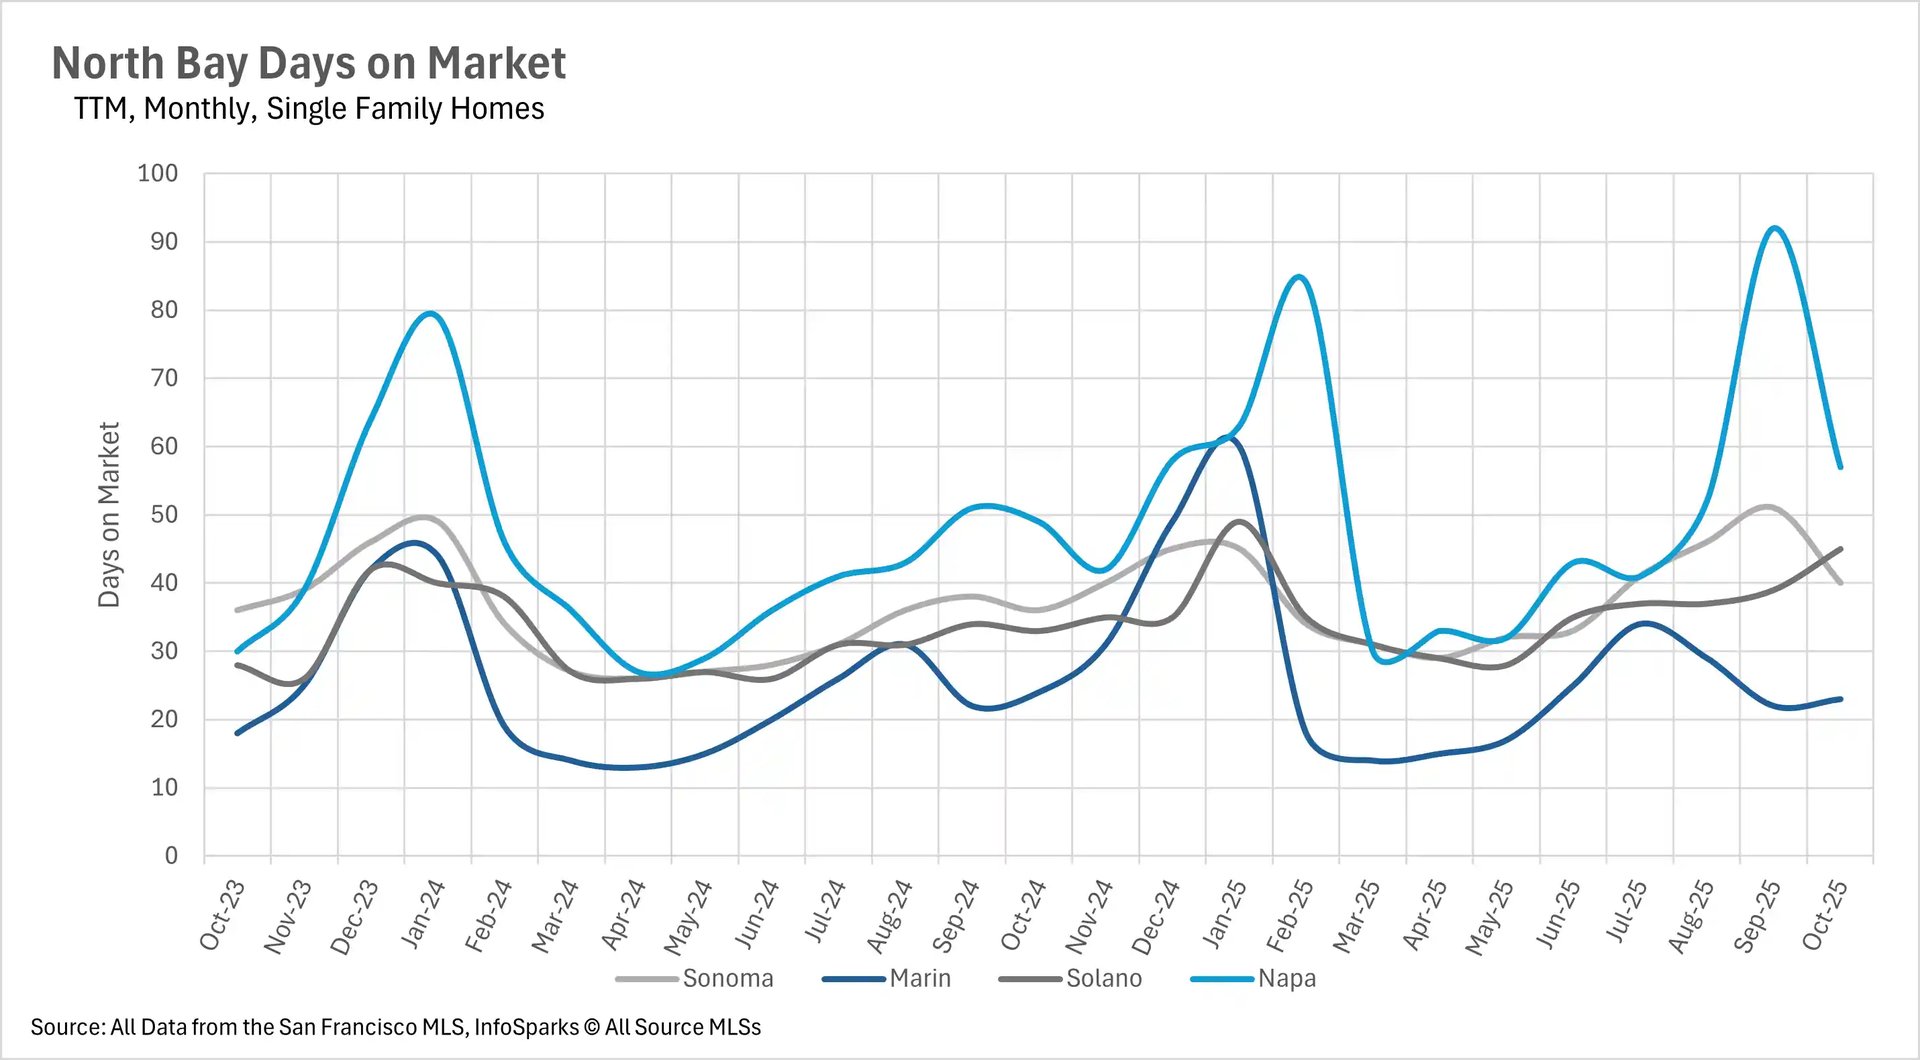
Days on market paradox: percentage spikes mask varied absolute performance
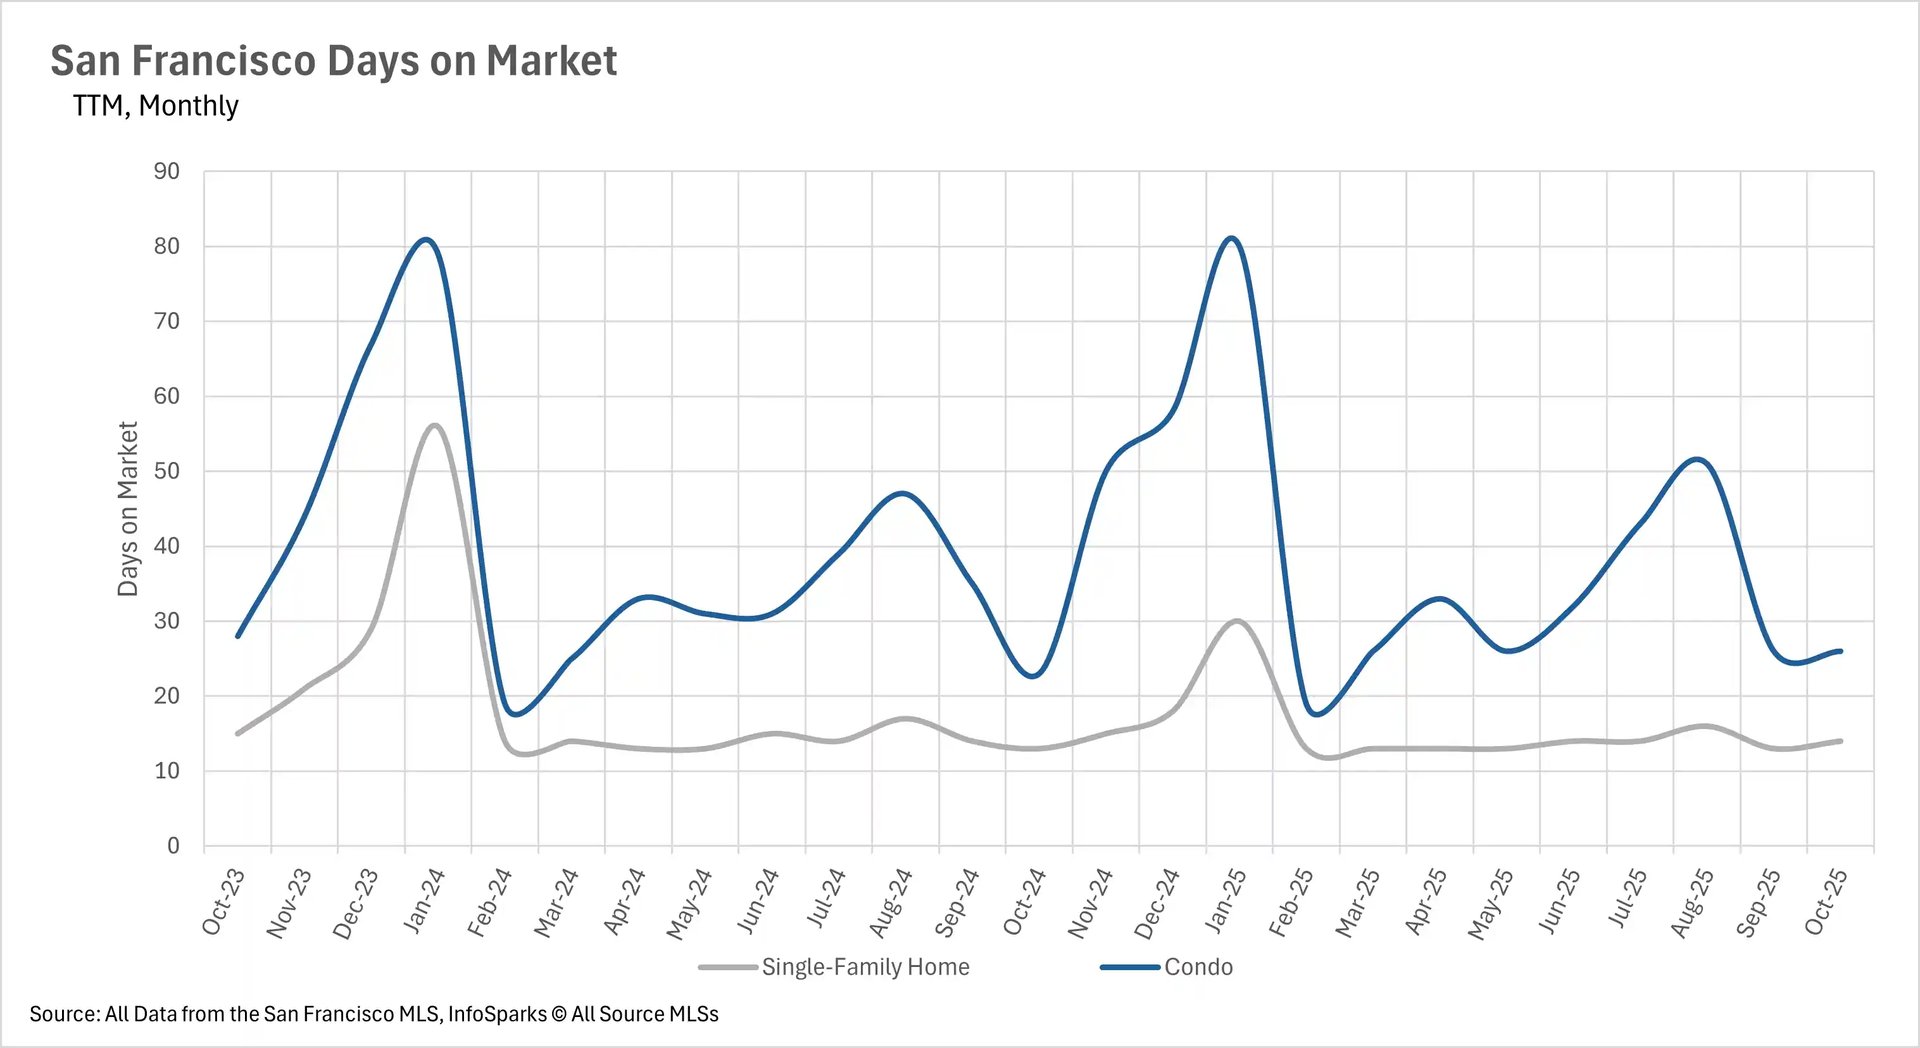
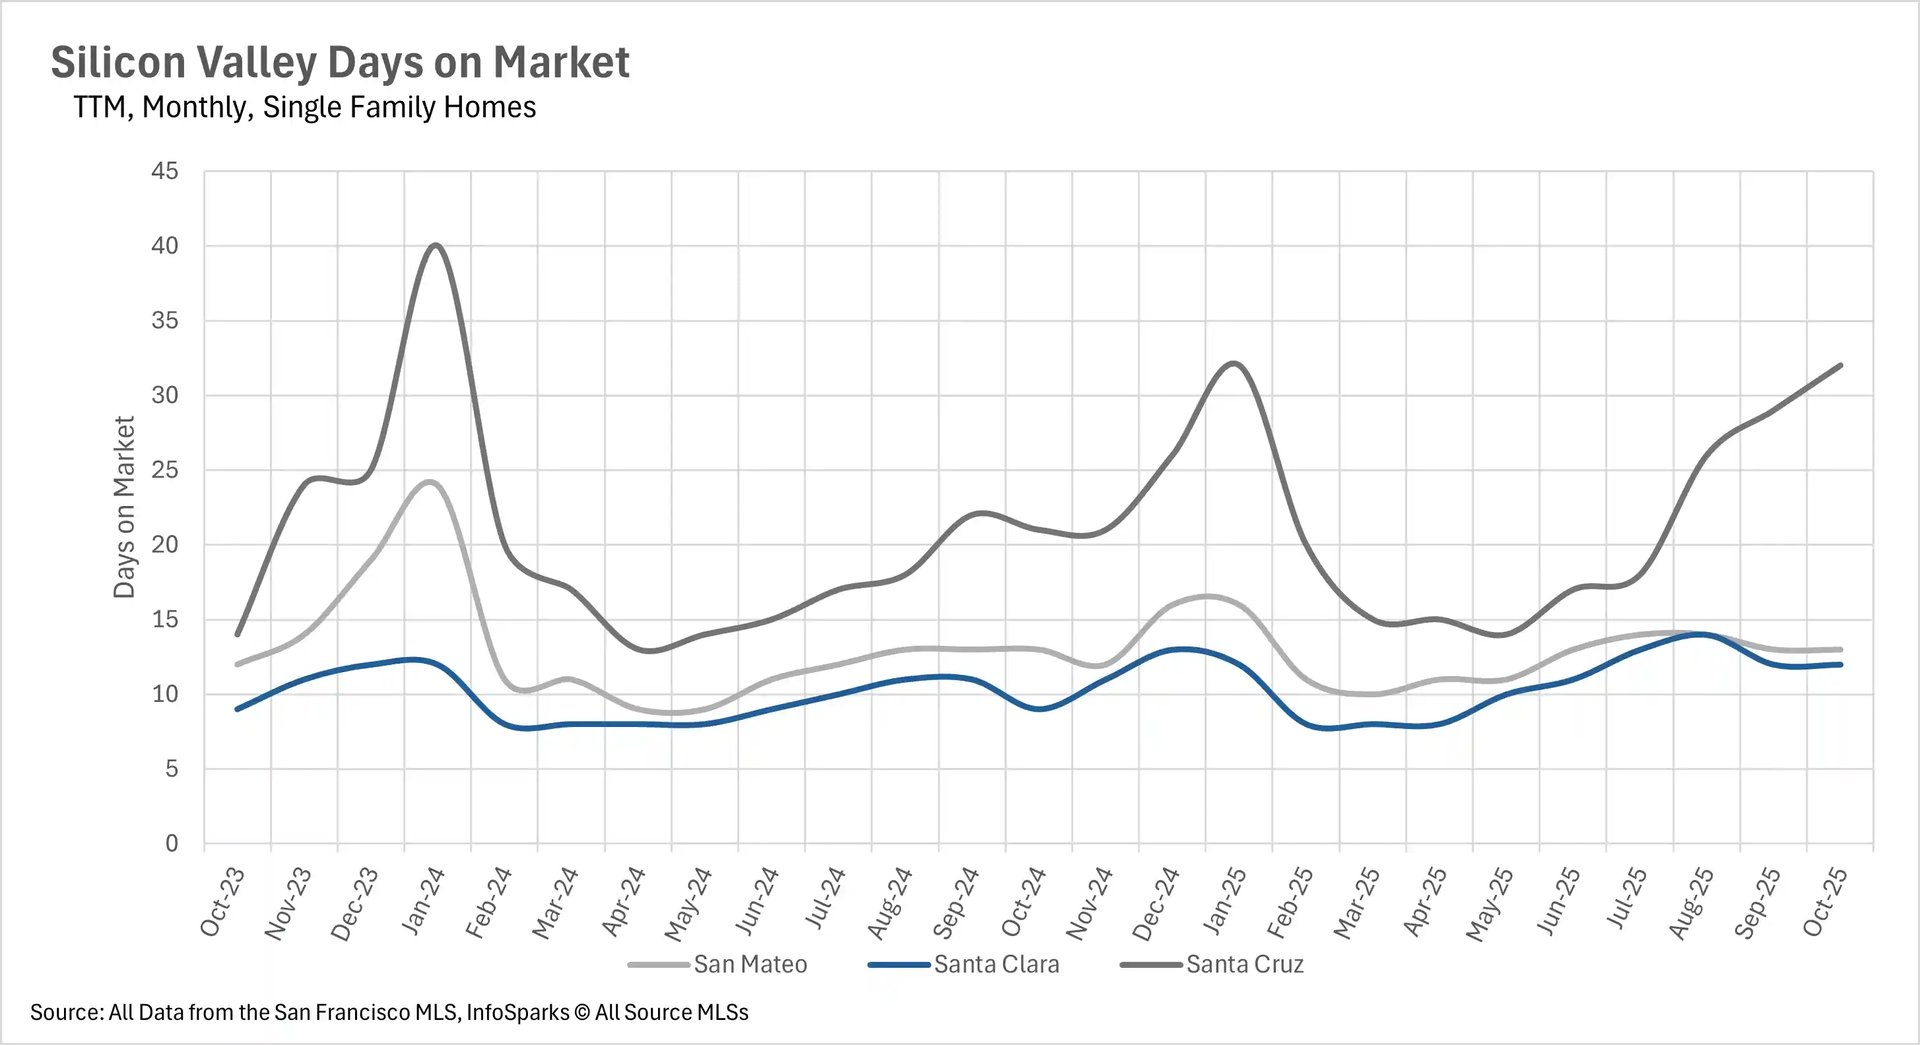
October revealed a fascinating divergence between percentage increases in days on market and actual selling speeds, with the condo market showing particularly dramatic extensions. San Francisco maintained relatively quick movement with single-family homes averaging 14 days (up 7.69% year-over-year) and condos at 26 days (up 13.04%), though both figures represent slight increases as inventory tightens further. Silicon Valley presented the starkest contrasts, with single-family homes in San Mateo and Santa Clara selling in just 12-13 days while condos experienced severe delays - San Mateo condos now average 32 days (up 39.13%), while Santa Clara and Santa Cruz condos spend 41 and 69 days on market respectively, representing shocking year-over-year increases of 105% and 155.56%.
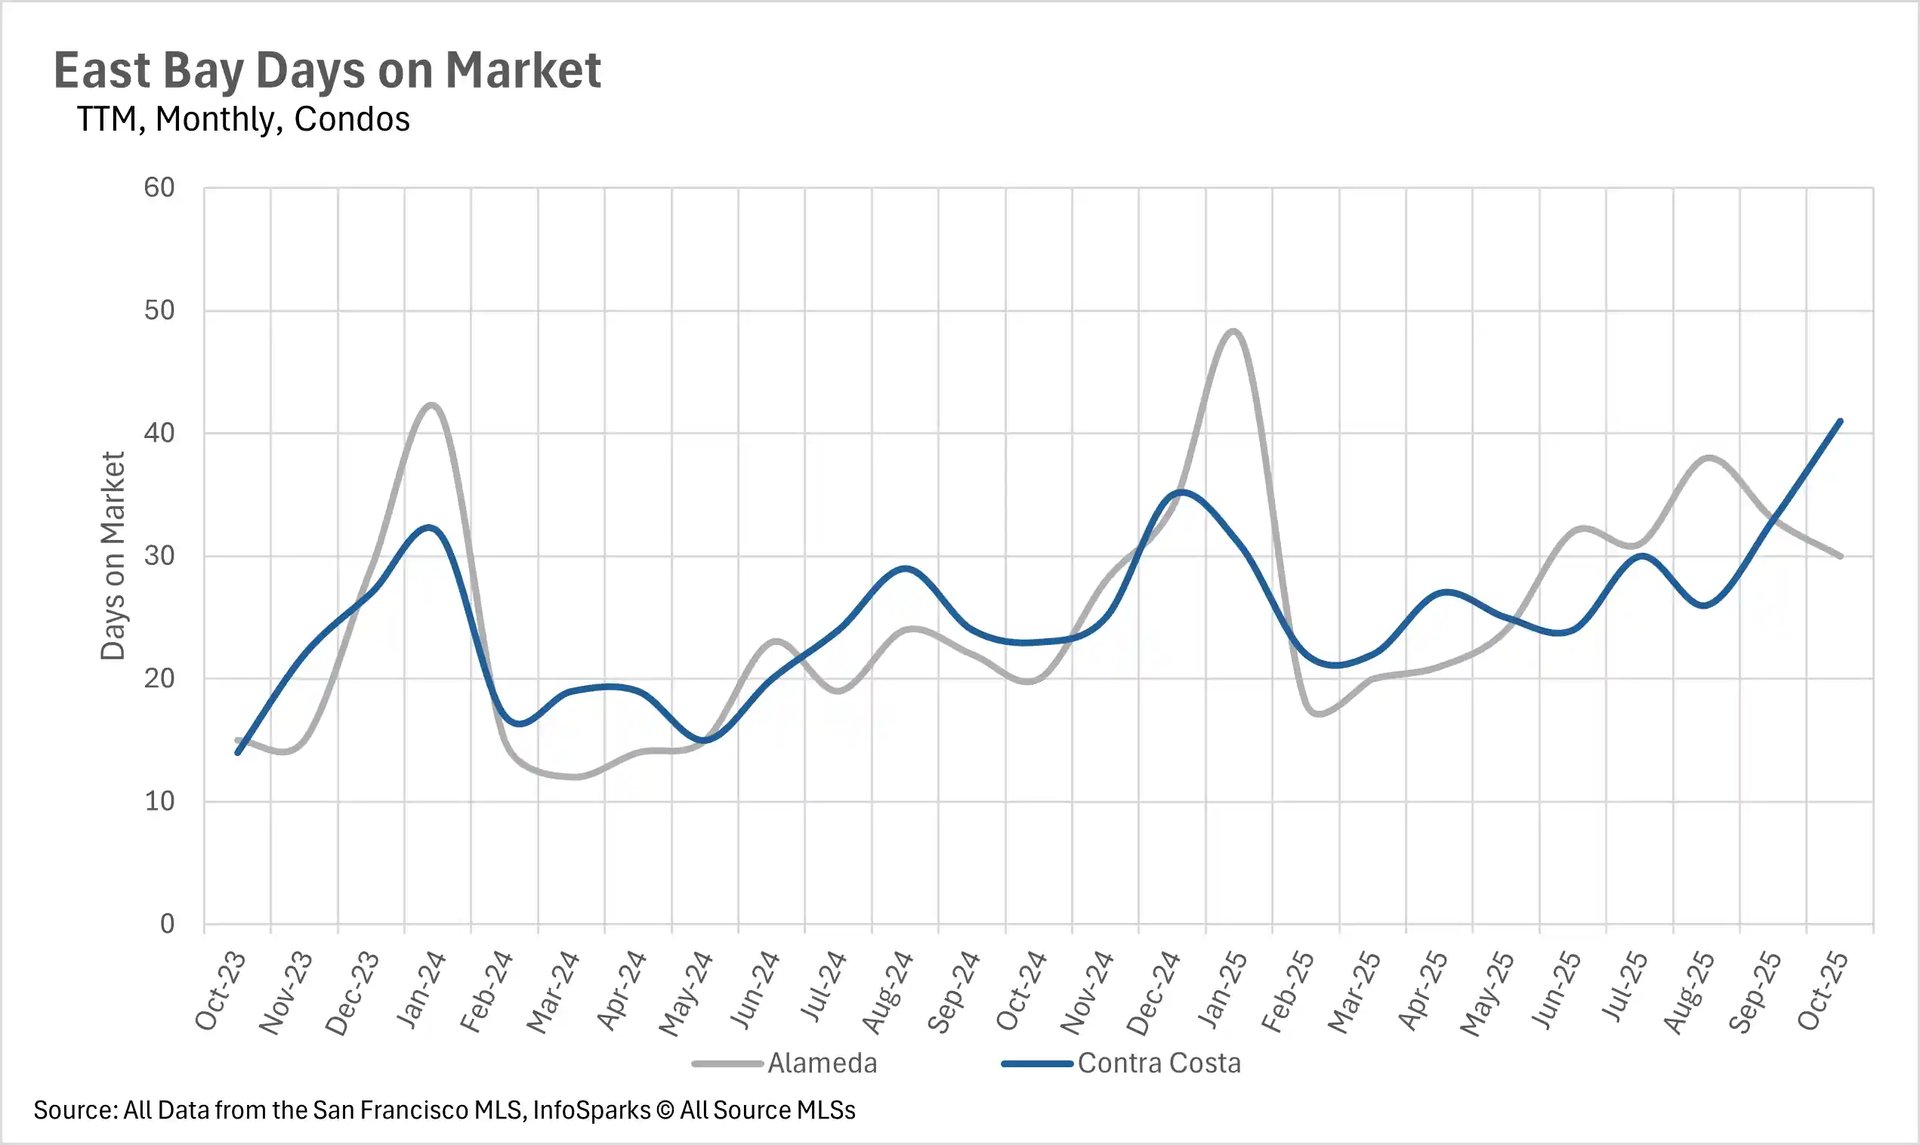
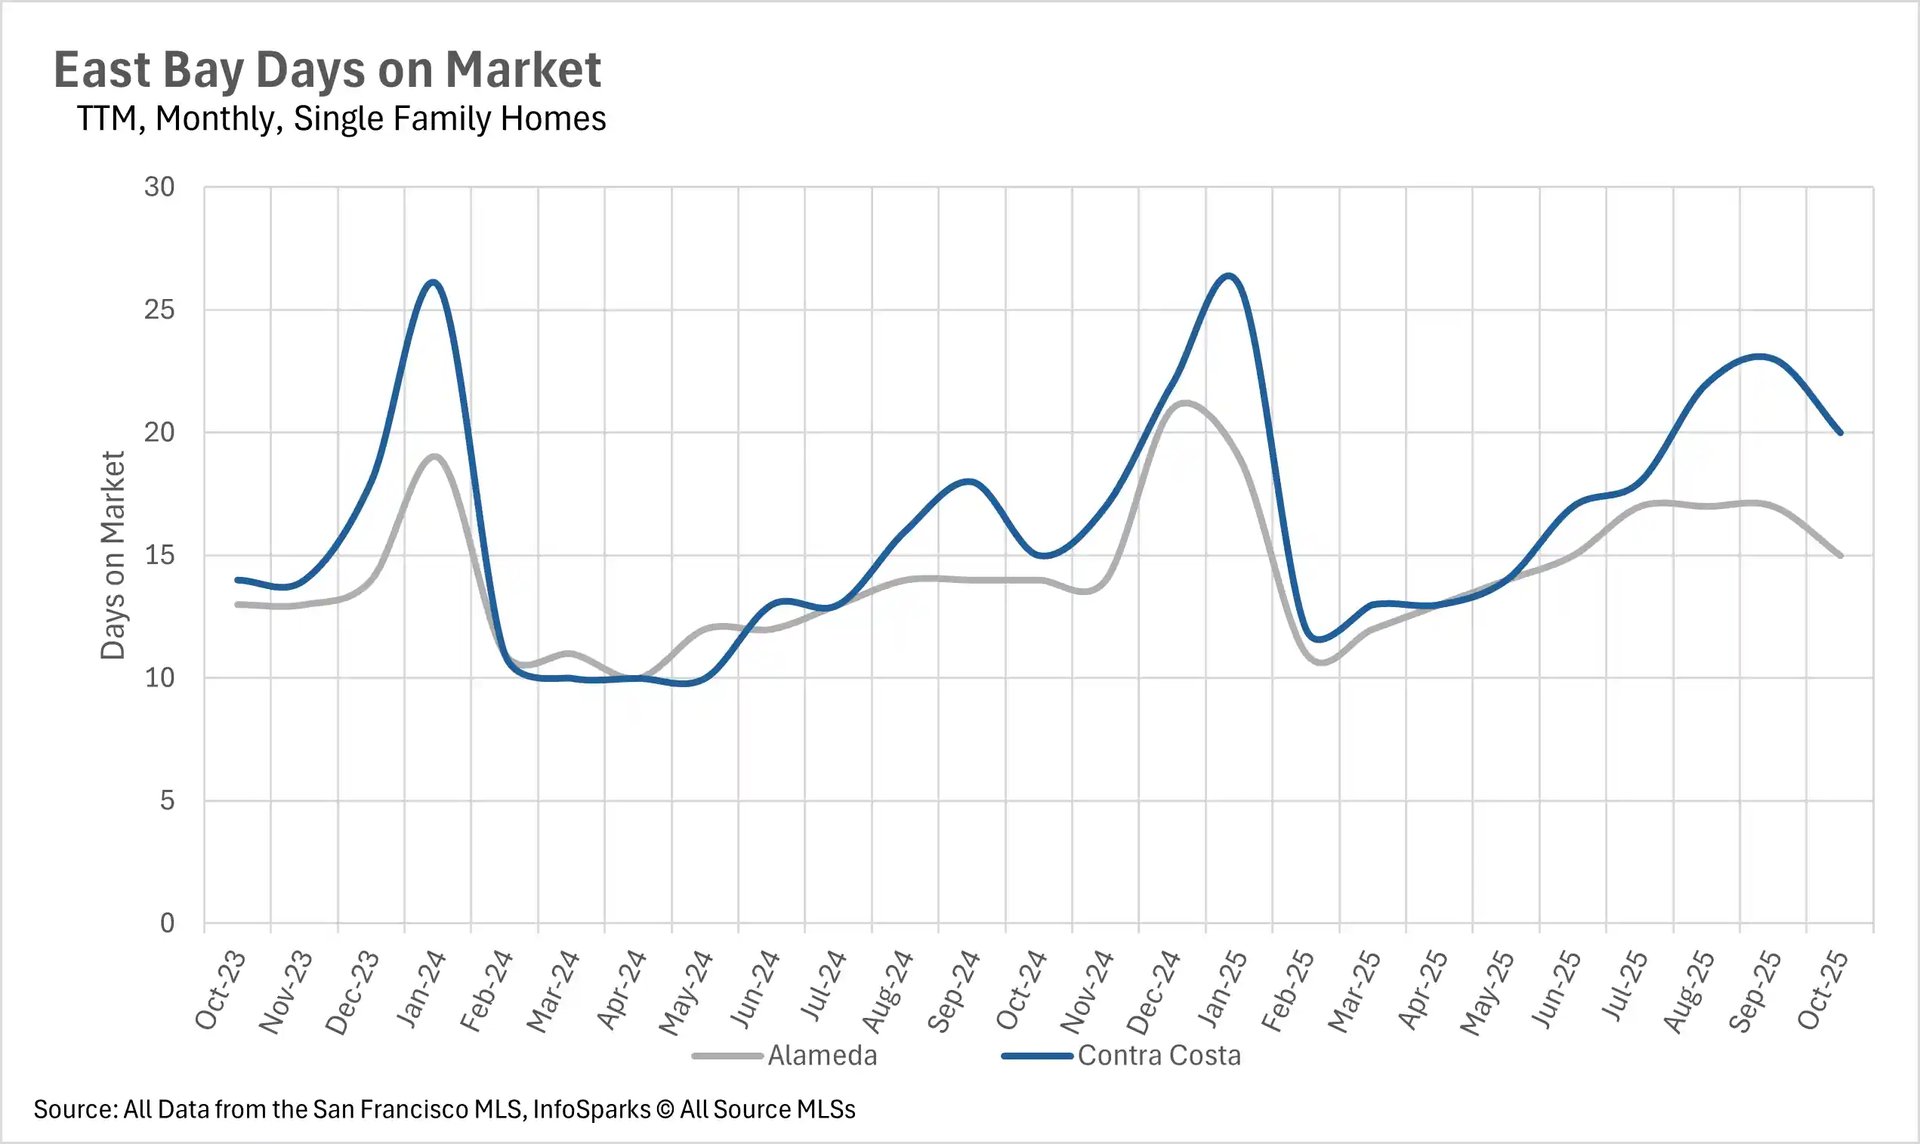
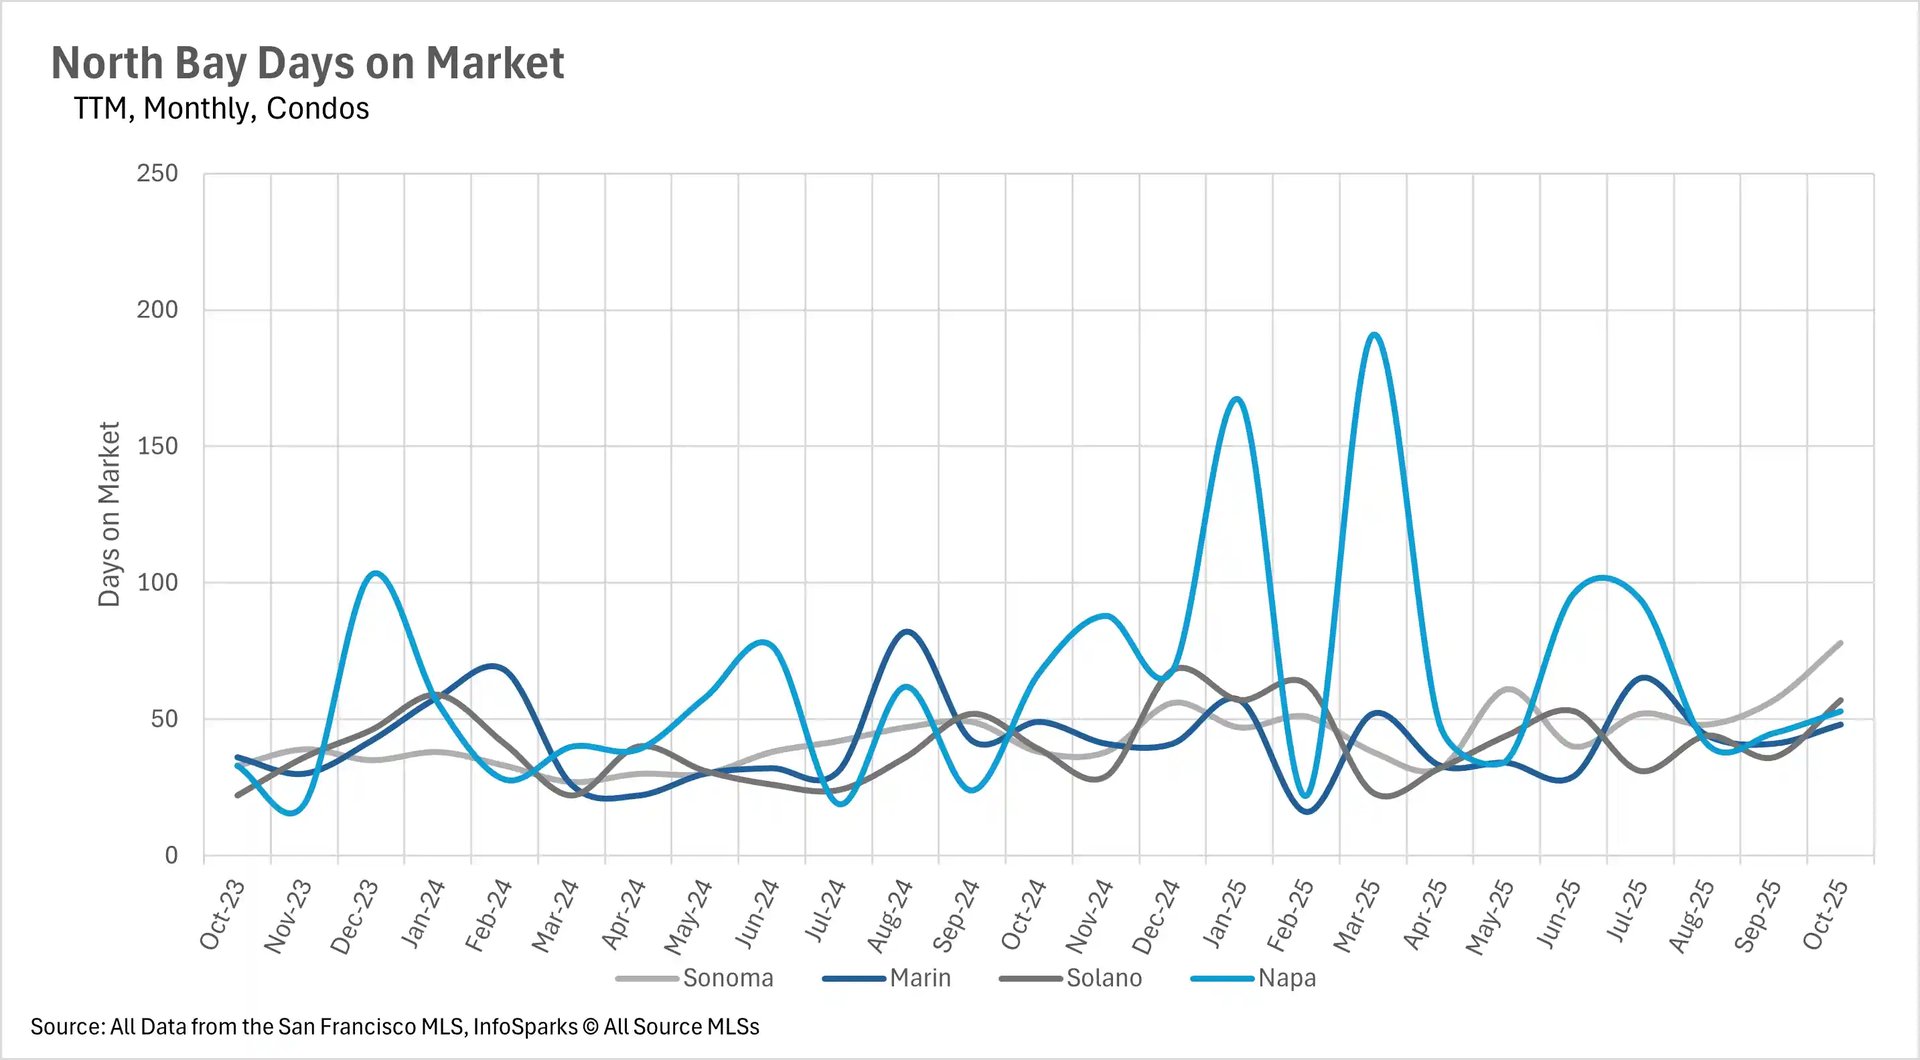
The East Bay showed significant percentage increases but maintained relatively fast absolute times for single-family homes at 15 days in Alameda (up 7.14%) and 20 days in Contra Costa (up 33.33%), while condos extended to 30 and 41 days with 50.00% and 78.26% year-over-year increases. The North Bay displayed the most mixed results, with most counties showing modest increases of 11-36%, though Marin County notably saw a 4.17% decrease. This pattern suggests that while buyer selectivity has increased across the board, the actual impact on market velocity varies significantly by property type and location.
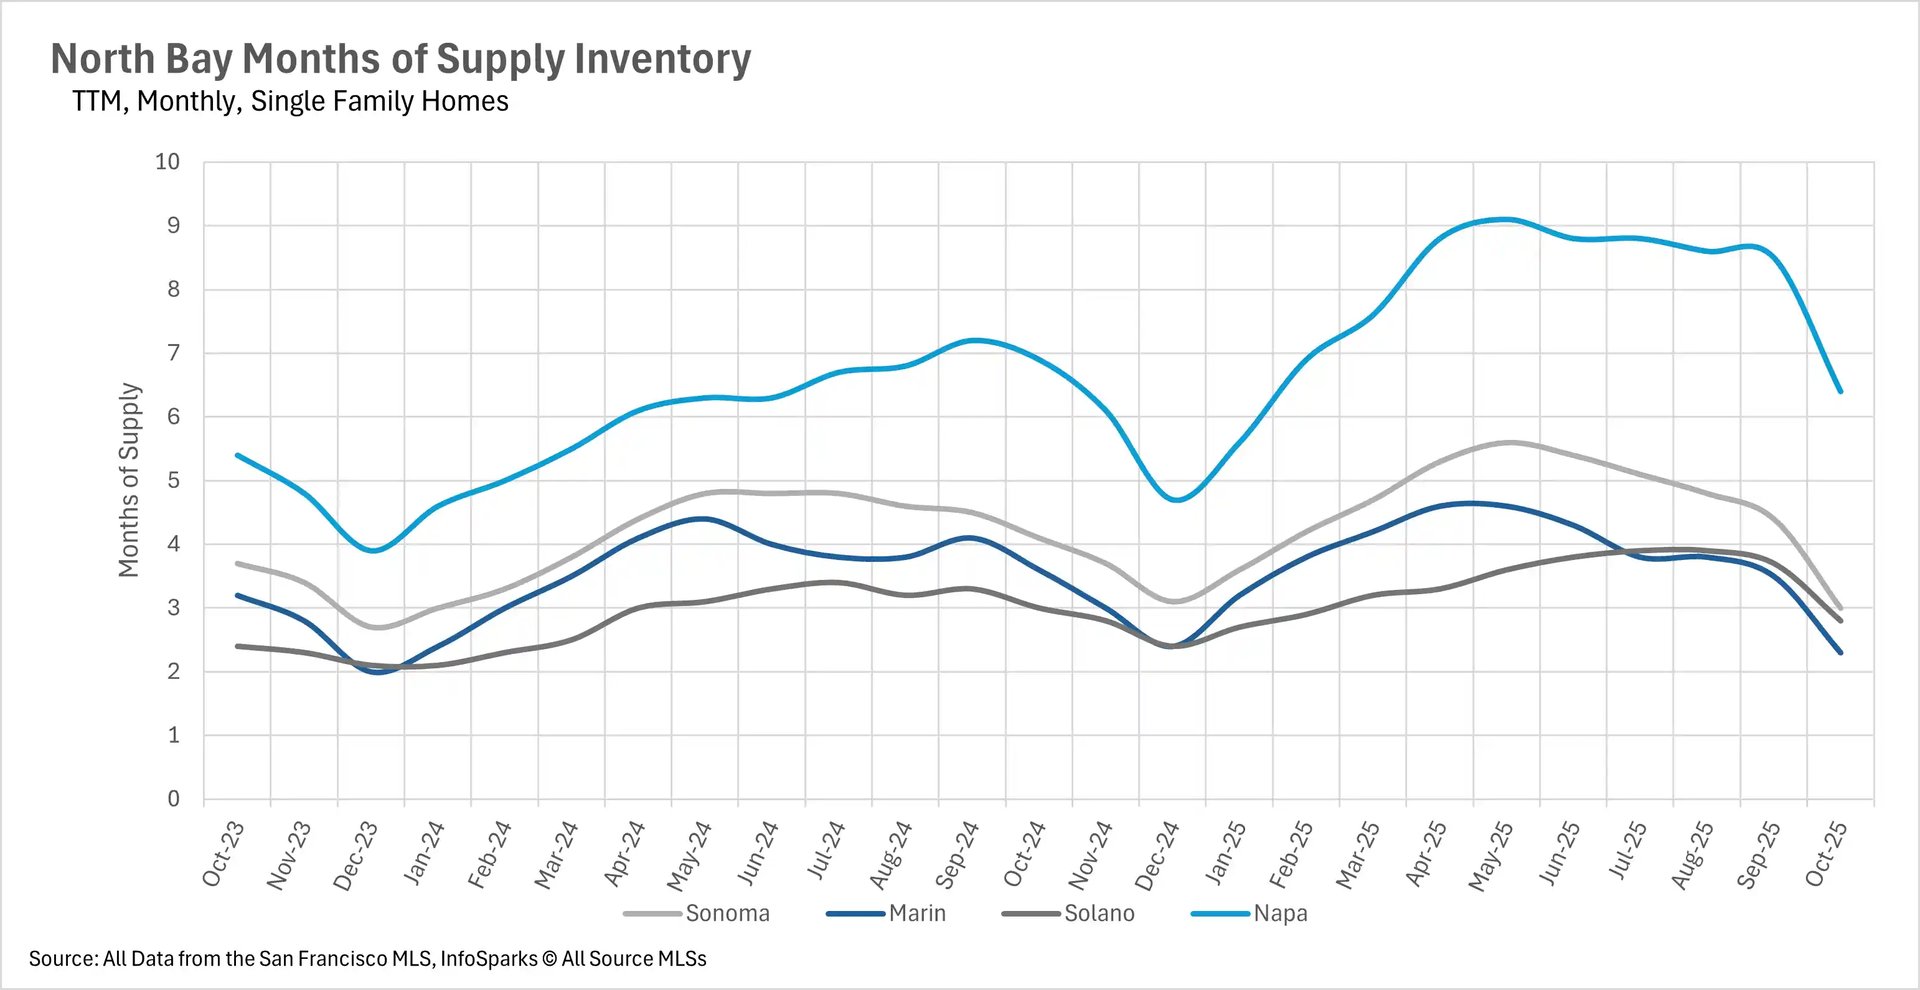
Seller's market momentum reaches new heights across property types
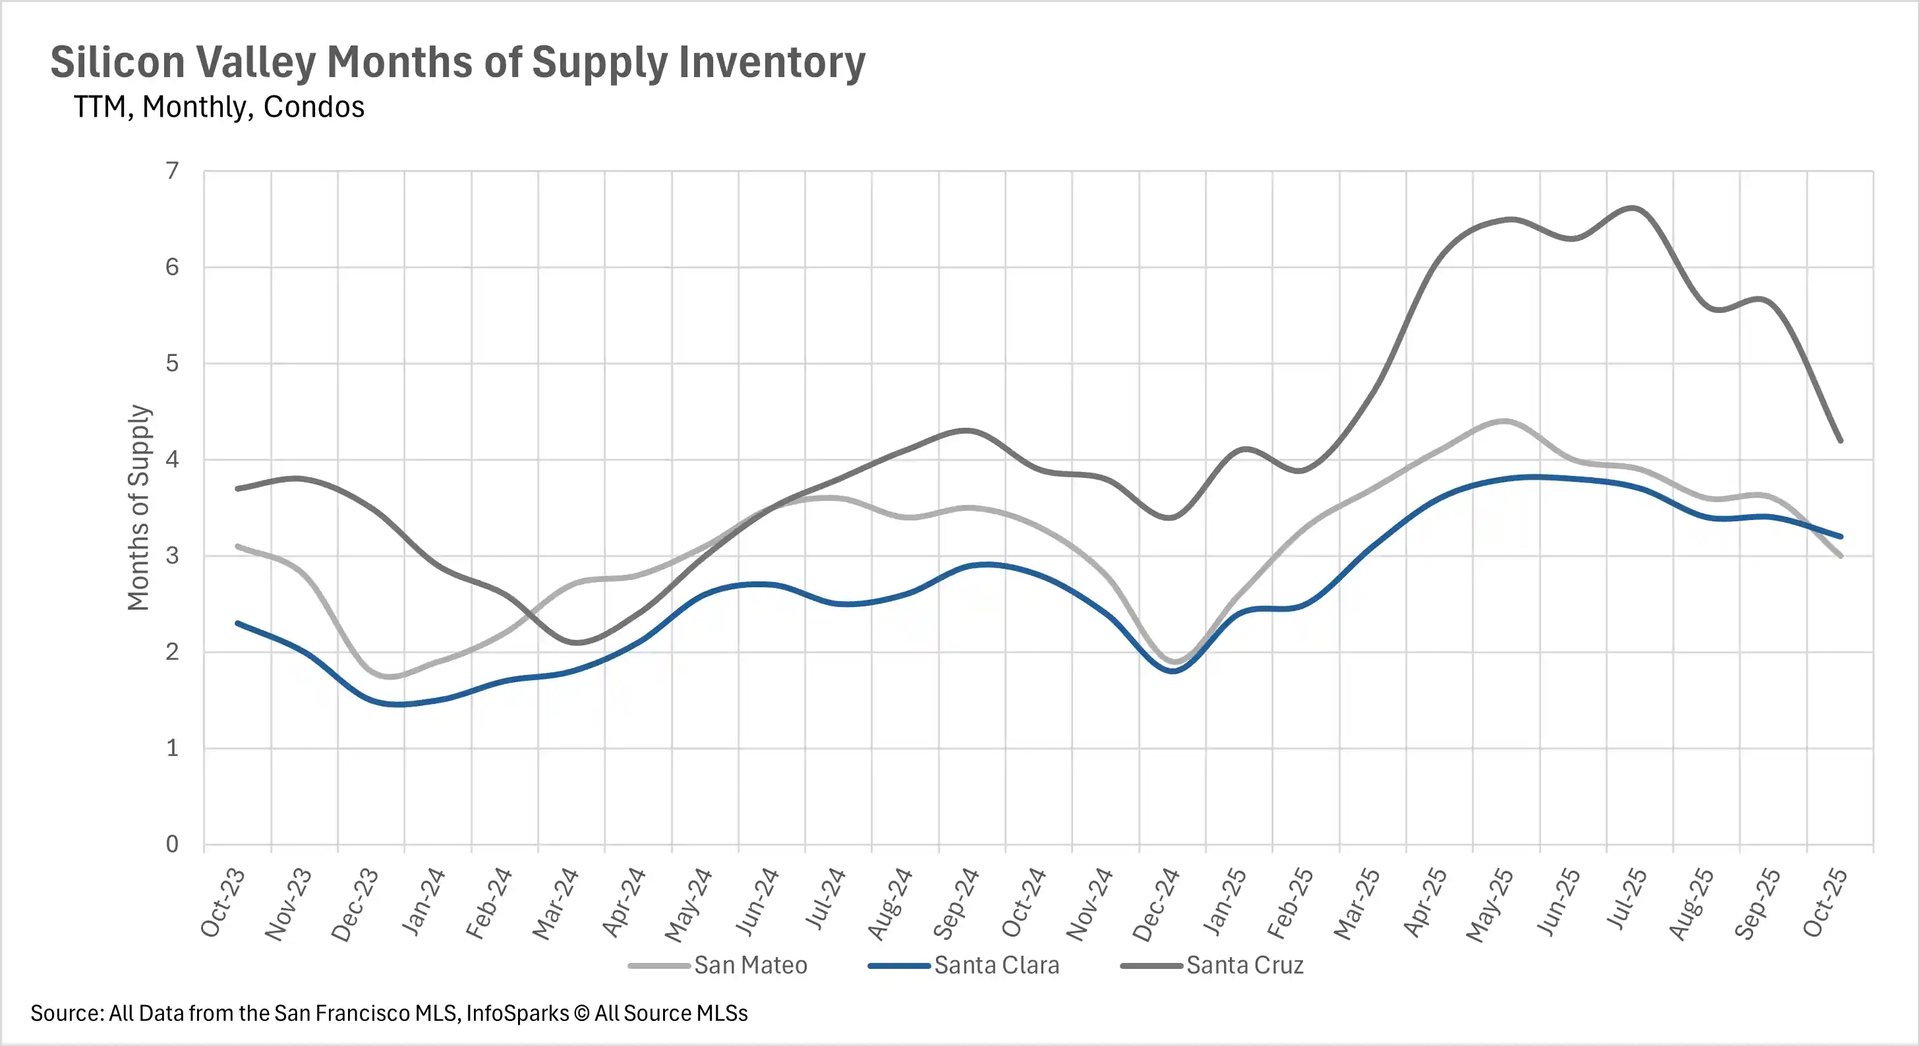
October's inventory overcorrection accelerated the Bay Area's dramatic shift toward seller-dominant markets, with several regions reaching unprecedented levels of supply constraint. San Francisco achieved remarkable status with both property types firmly in seller's market territory - single-family homes at an ultra-low 1.3 months of supply and condos at 2.6 months, representing the tightest condo market San Francisco has seen in recent years. Silicon Valley maintained its traditional ultra-competitive single-family stance with San Mateo at 1.5 months and Santa Clara at an extraordinarily tight 1.3 months, while Santa Cruz continues creeping back toward balanced territory at 3.5 months. The Silicon Valley condo market shows signs of normalization, with San Mateo achieving perfect balance at exactly 3.0 months, while Santa Clara (3.2 months) and Santa Cruz (4.2 months) remain in buyer's territory but trending toward equilibrium.
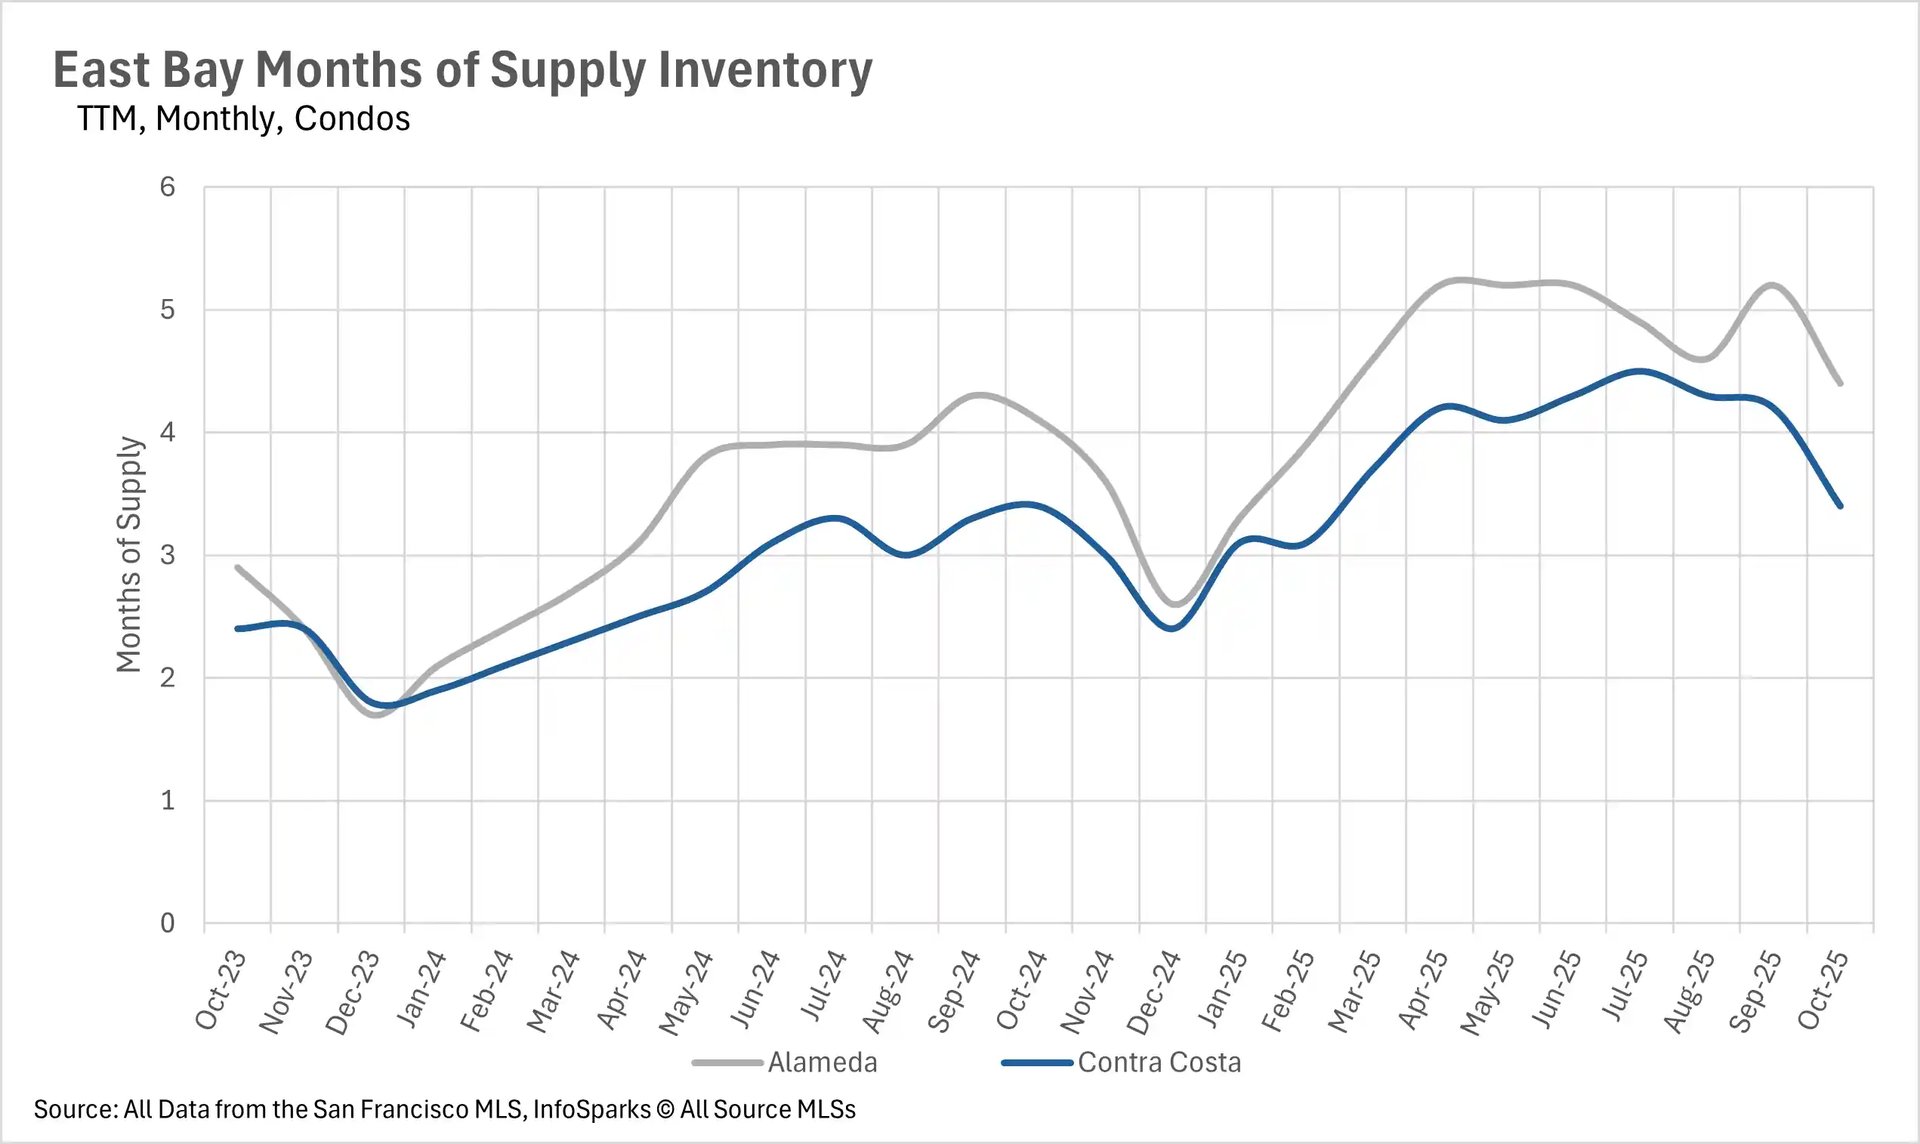
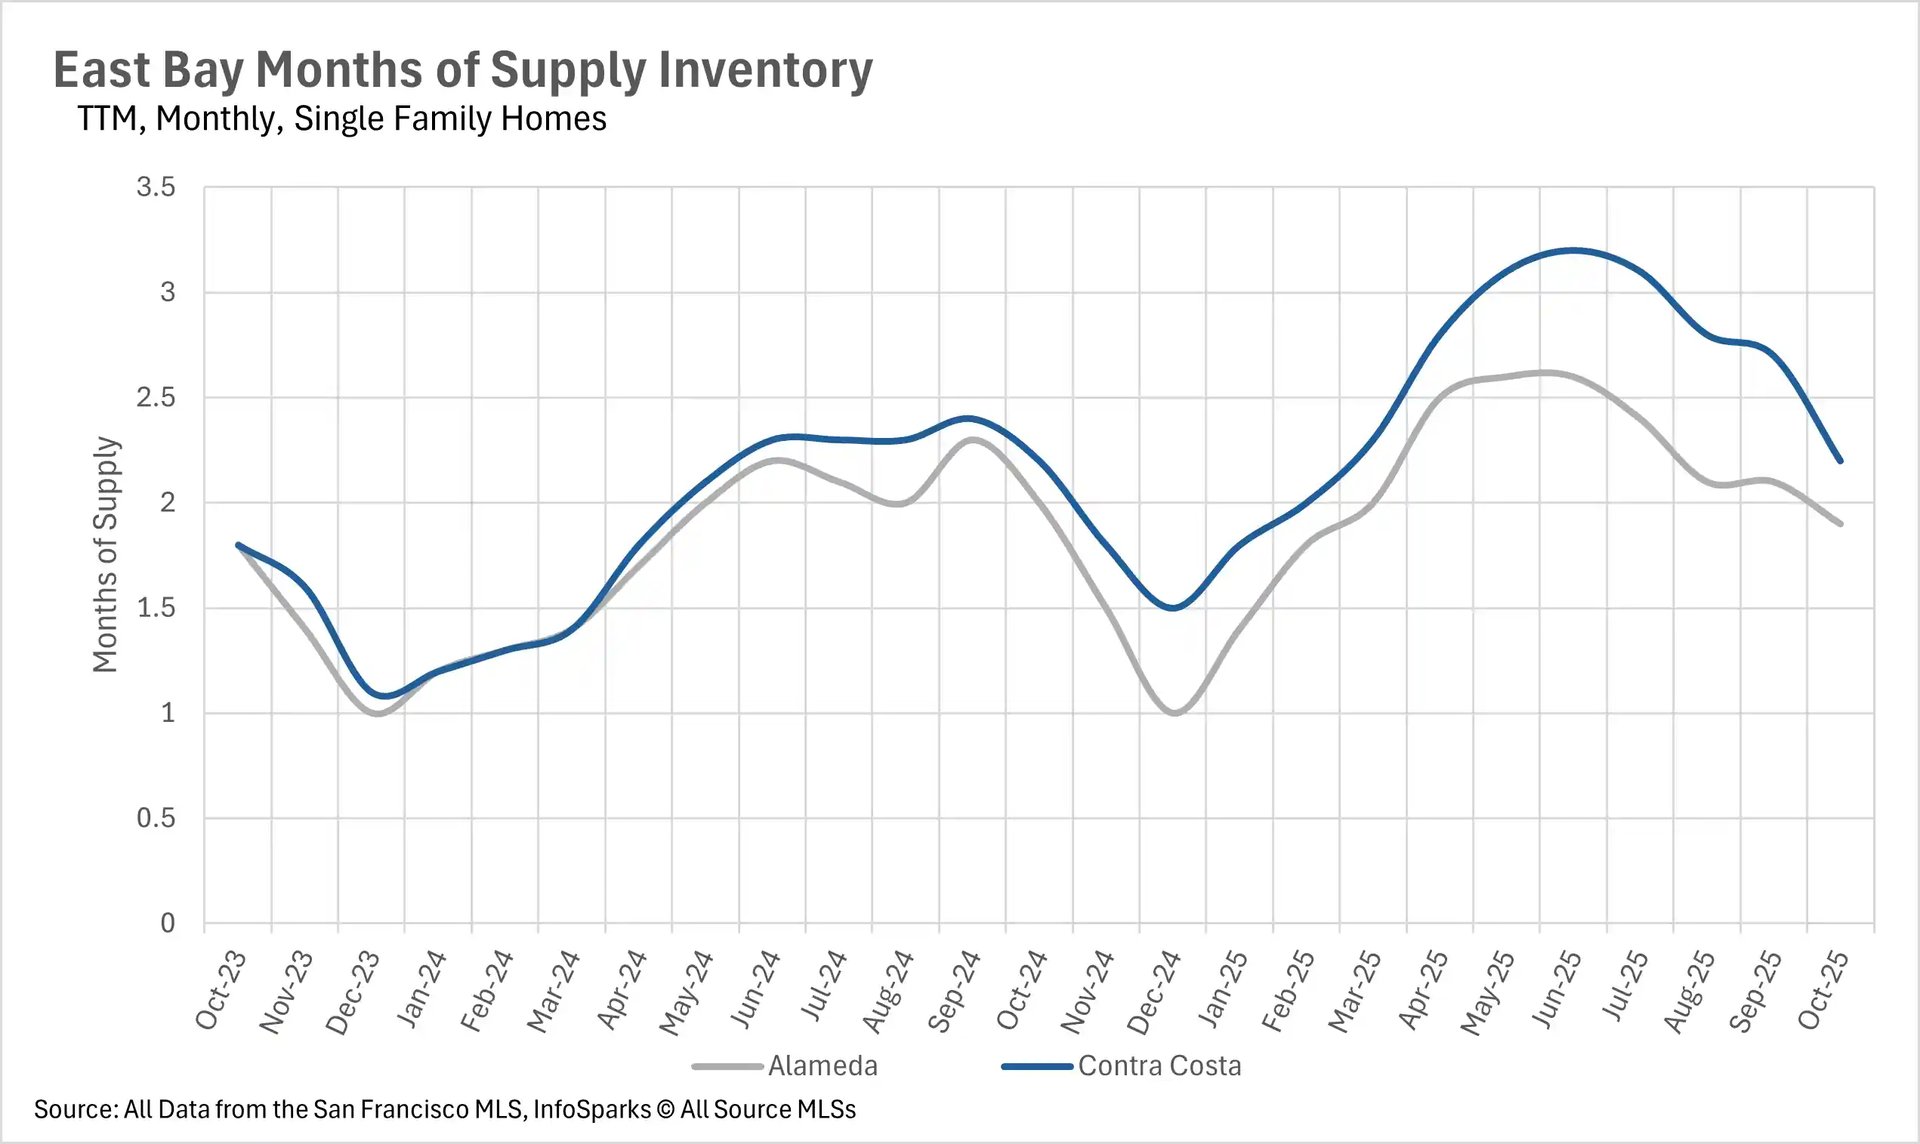
The North Bay achieved the most dramatic transformation, with Marin and Solano Counties' single-family markets flipping to seller's markets at 2.3 and 2.8 months respectively, while Sonoma achieved perfect balance at 3.0 months and Napa continued its march toward balance at 6.4 months. North Bay condos also shifted decisively, with Sonoma reaching perfect balance at 3.0 months and other counties moving steadily in that direction. The East Bay preserved its traditional market structure with single-family homes favoring sellers at 1.9 months in Alameda and 2.2 months in Contra Costa, while condos remained buyer-friendly at 4.4 and 3.4 months respectively. This region-wide pattern suggests the Bay Area has entered a new phase of supply constraint that could persist through the winter months and into 2026.