Select a Market Report to Read:
Welcome to the latest San Francisco Real Estate Market Report from Kinoko Real Estate! As your trusted local Real Estate experts in San Francisco, we're committed to providing you with the most accurate and insightful data to guide your home buying or selling journey in this dynamic city.
The Local Lowdown
Quick Take:
- Single-family median sale prices declined across the board for the first time in more than a year in November!
- Despite declines in price across the board, inventories are down more than 10% year-over-year.
- The average single-family home in Santa Cruz County is spending more than twice as much time on the market when compared to last year.
Note: You can find the charts/graphs for the Local Lowdown at the end of this section.
*National Association of REALTORS® data is released two months behind, so we estimate the most recent month's data when possible and appropriate.
Declines across the board for the first time in more than a year!
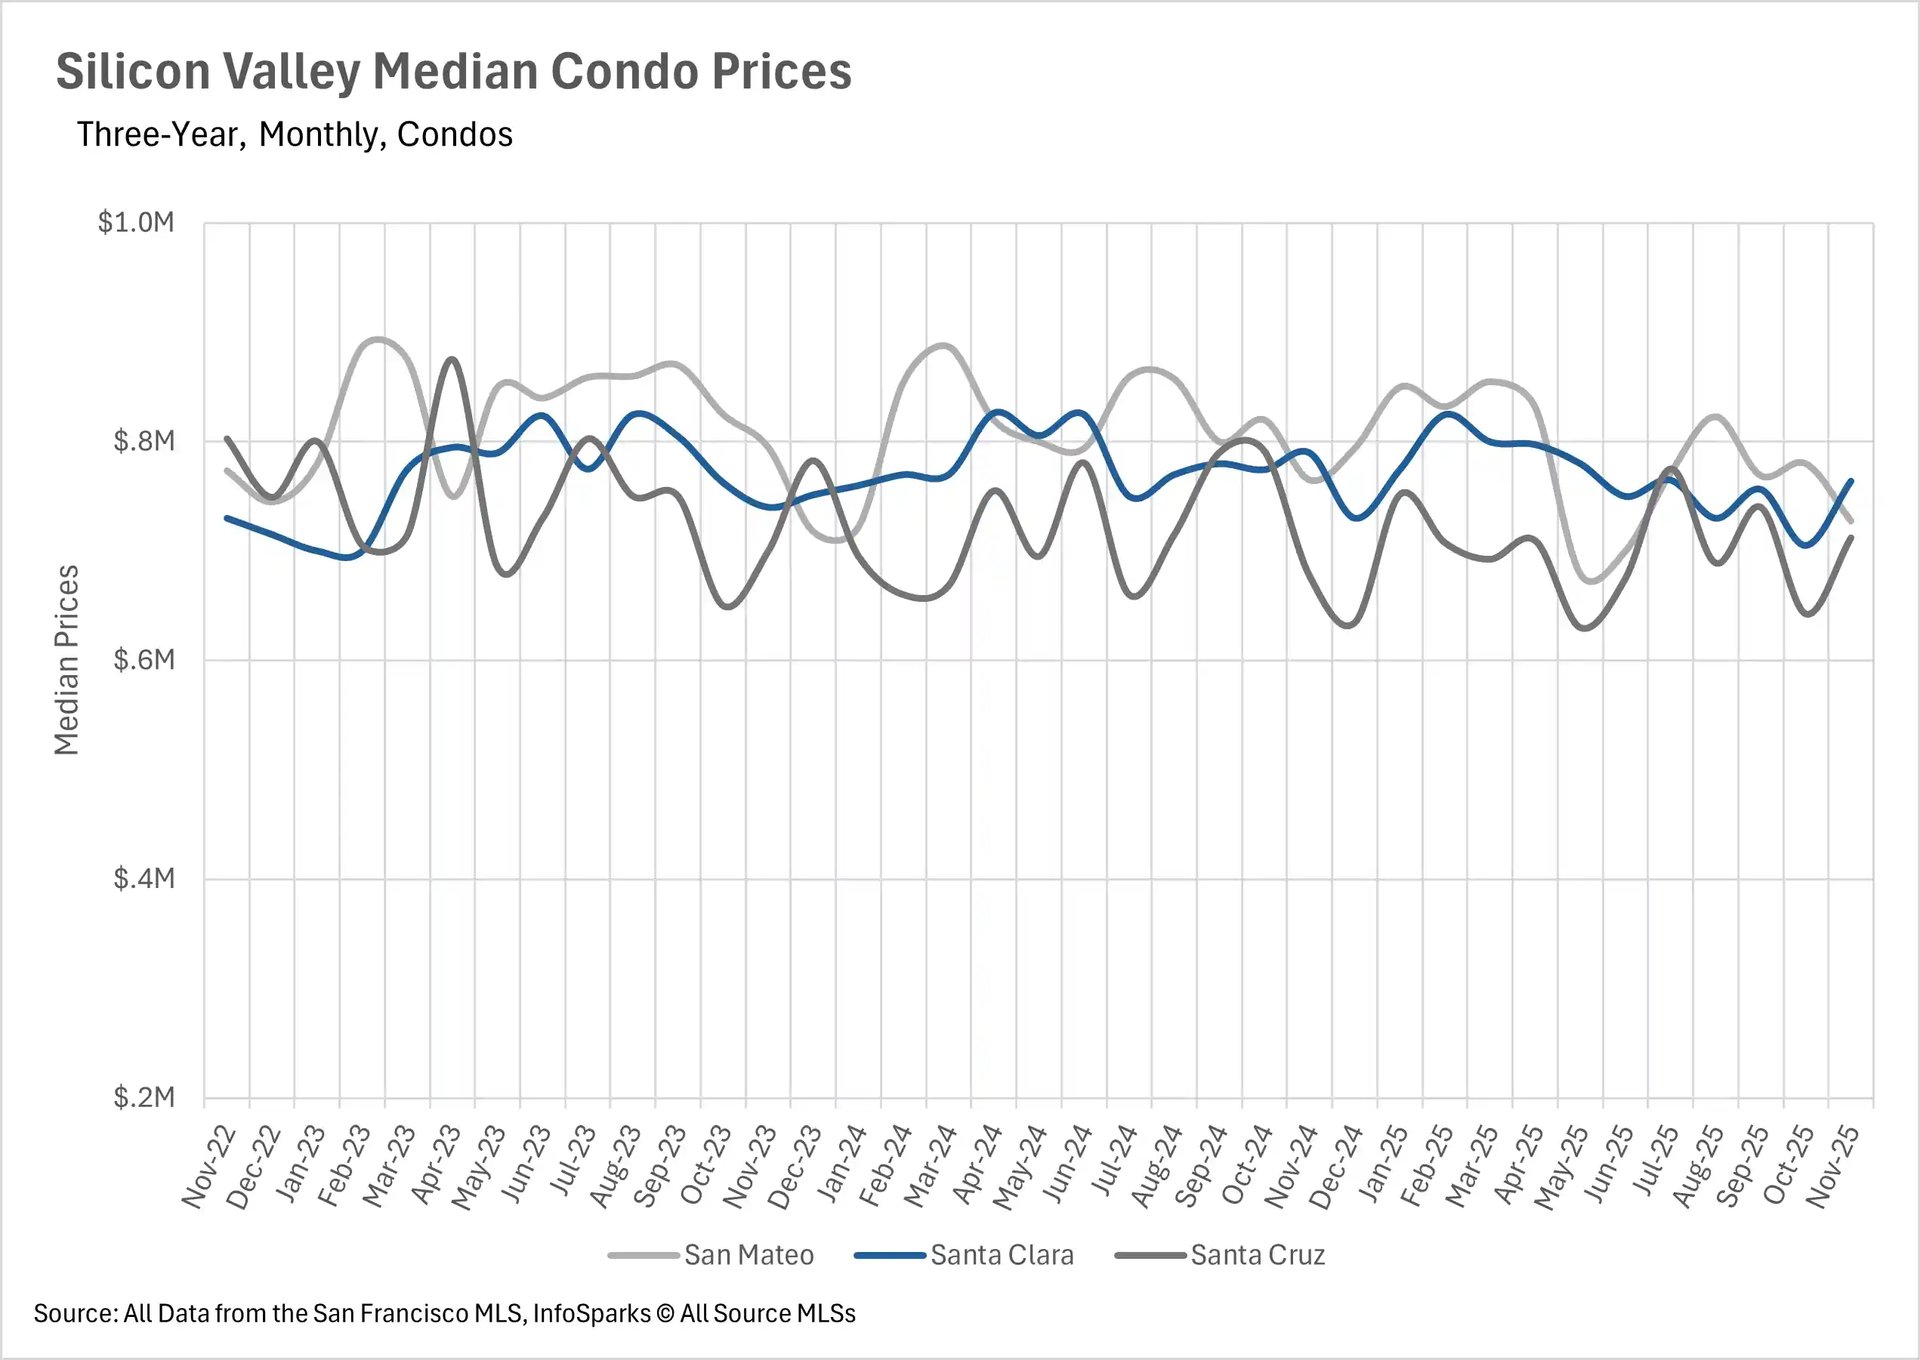
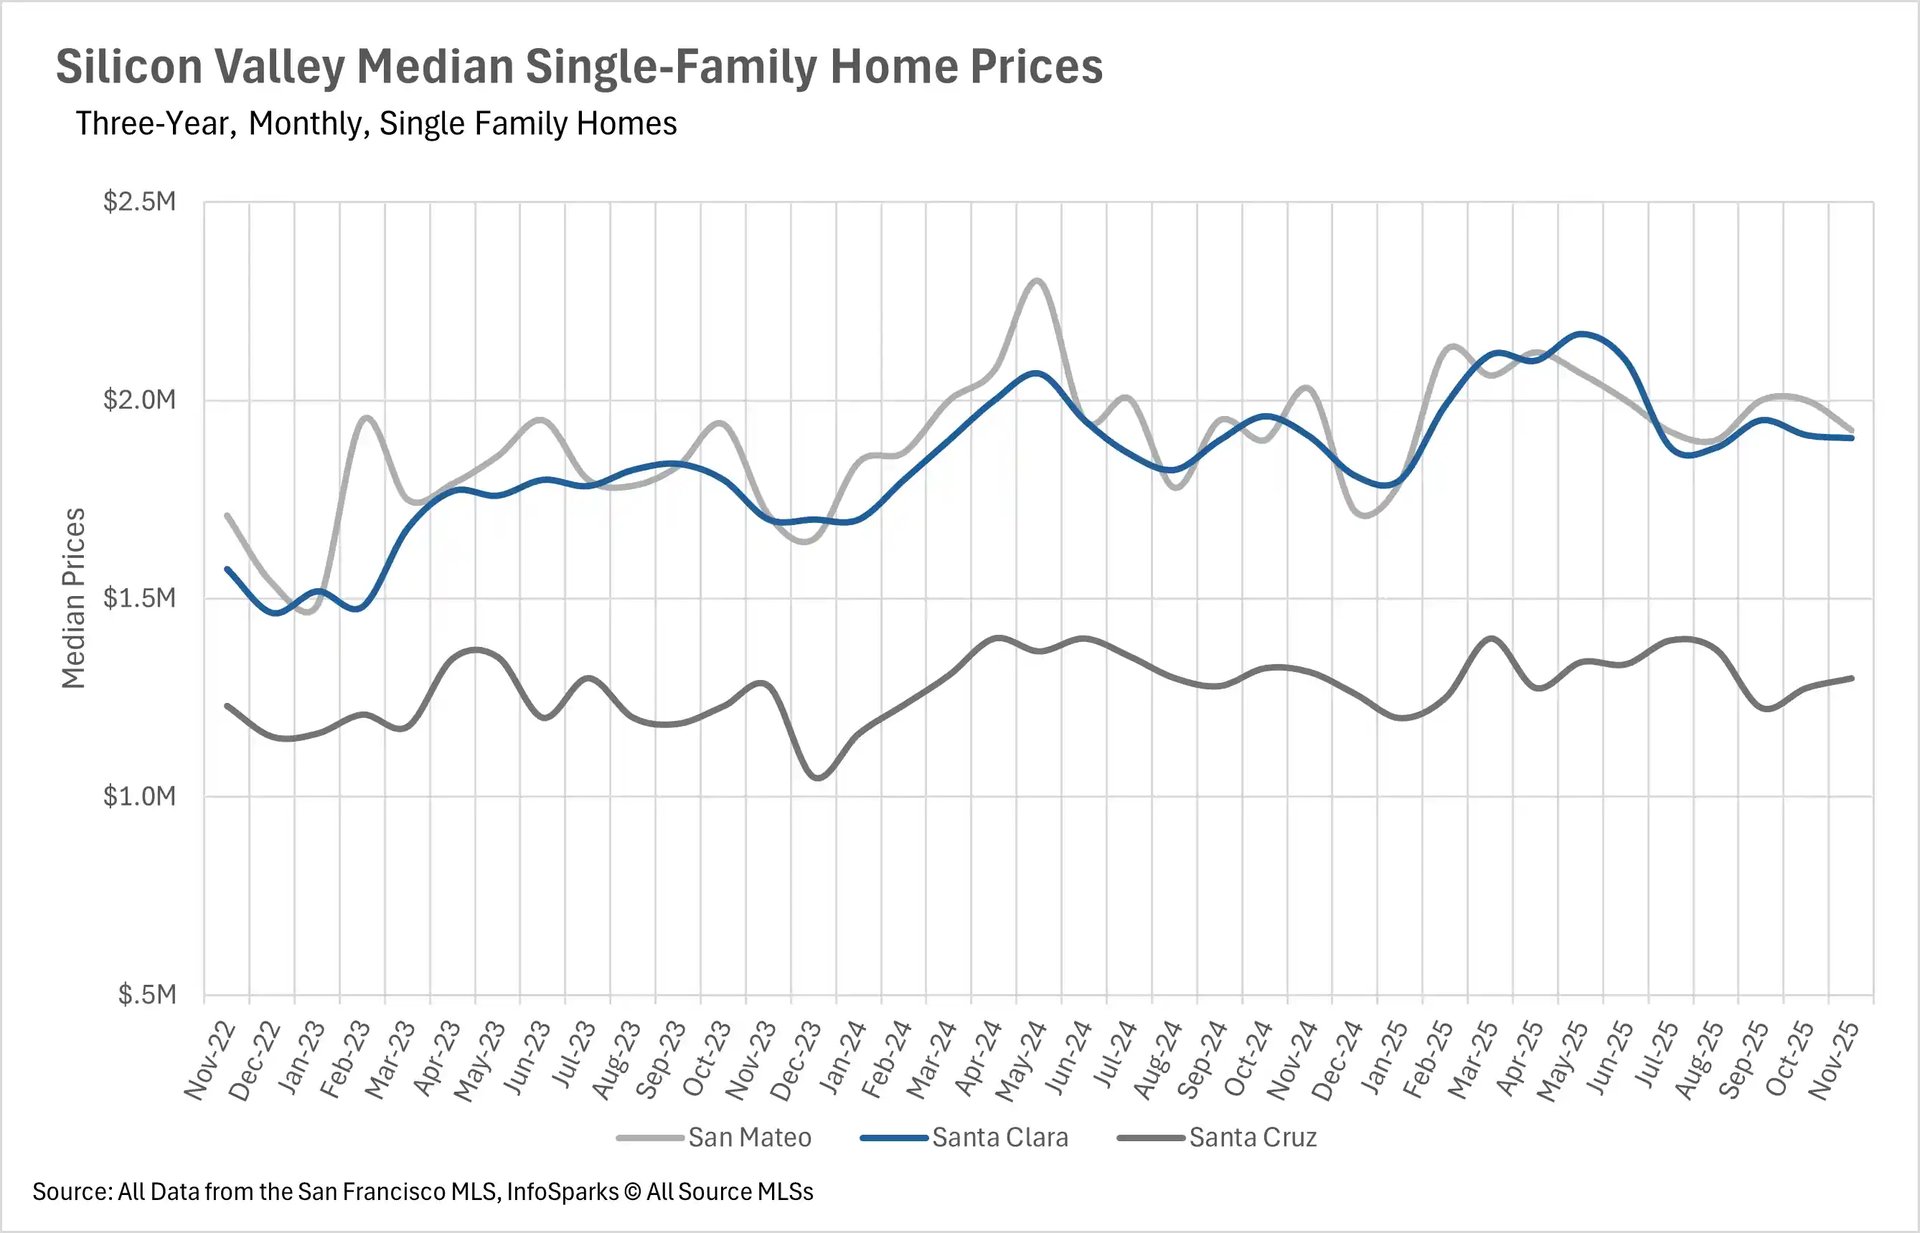
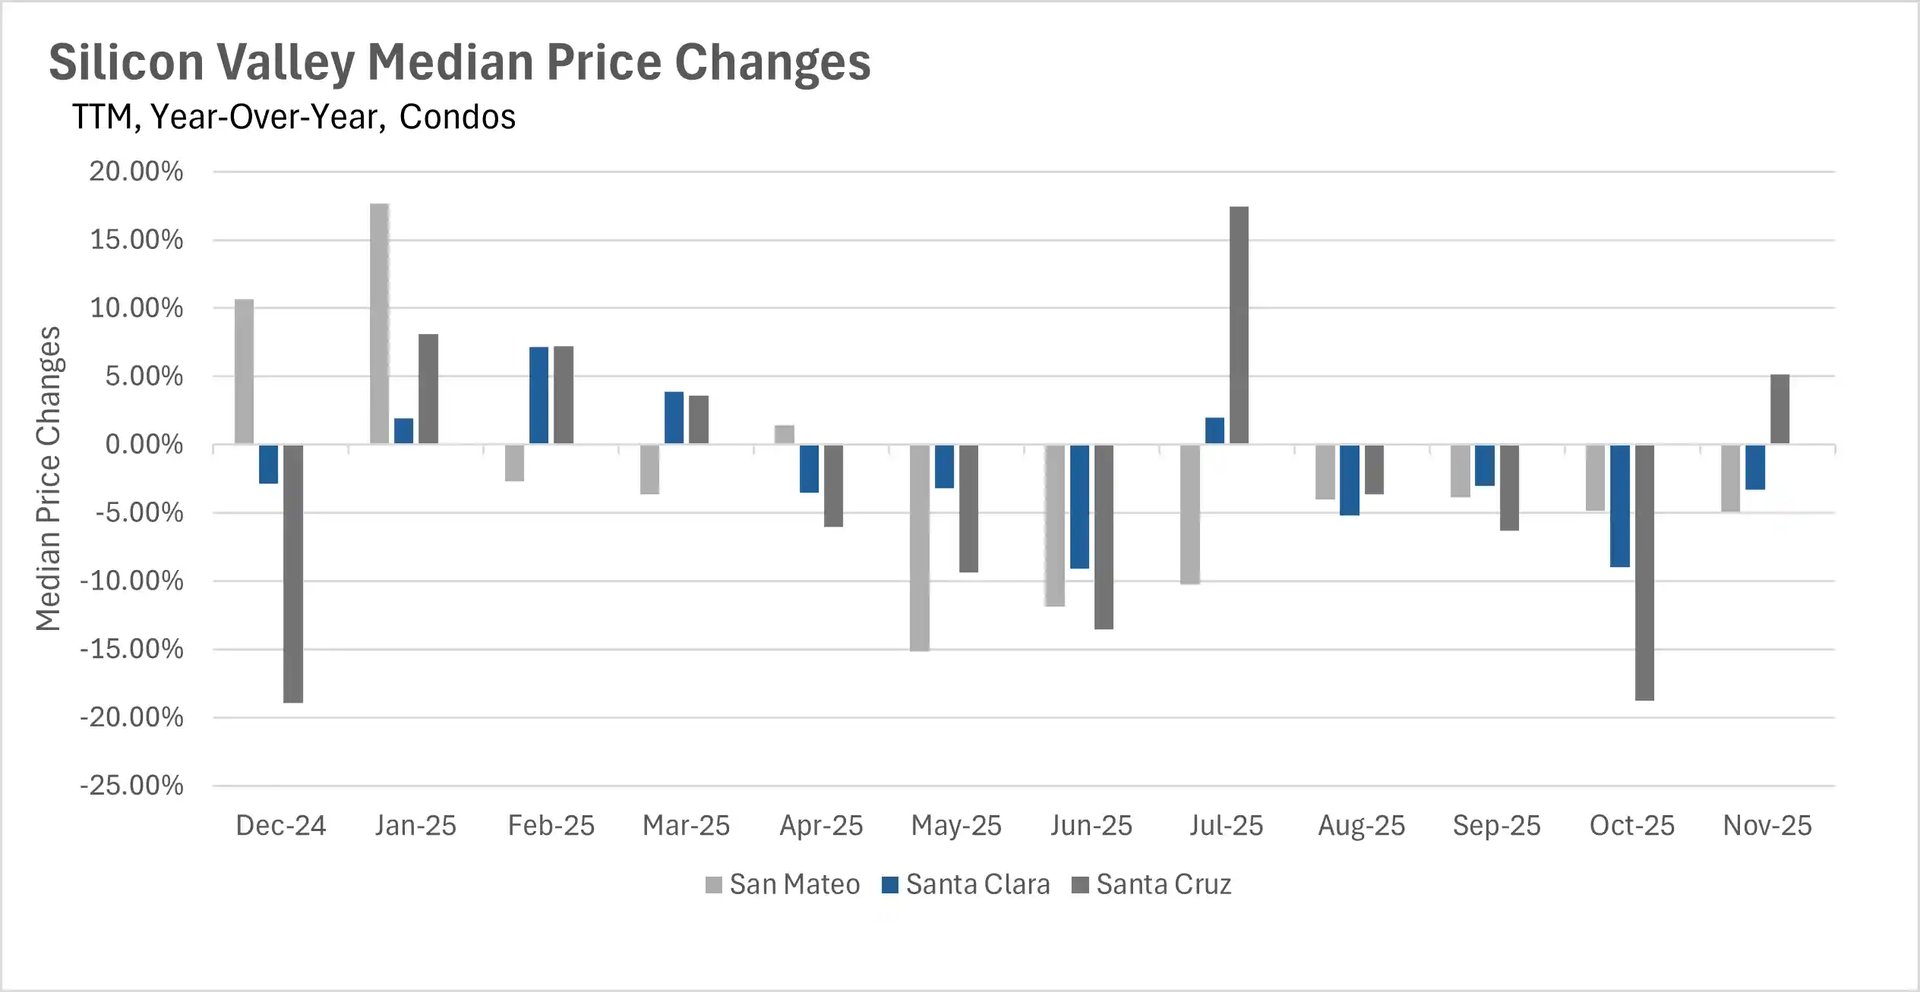
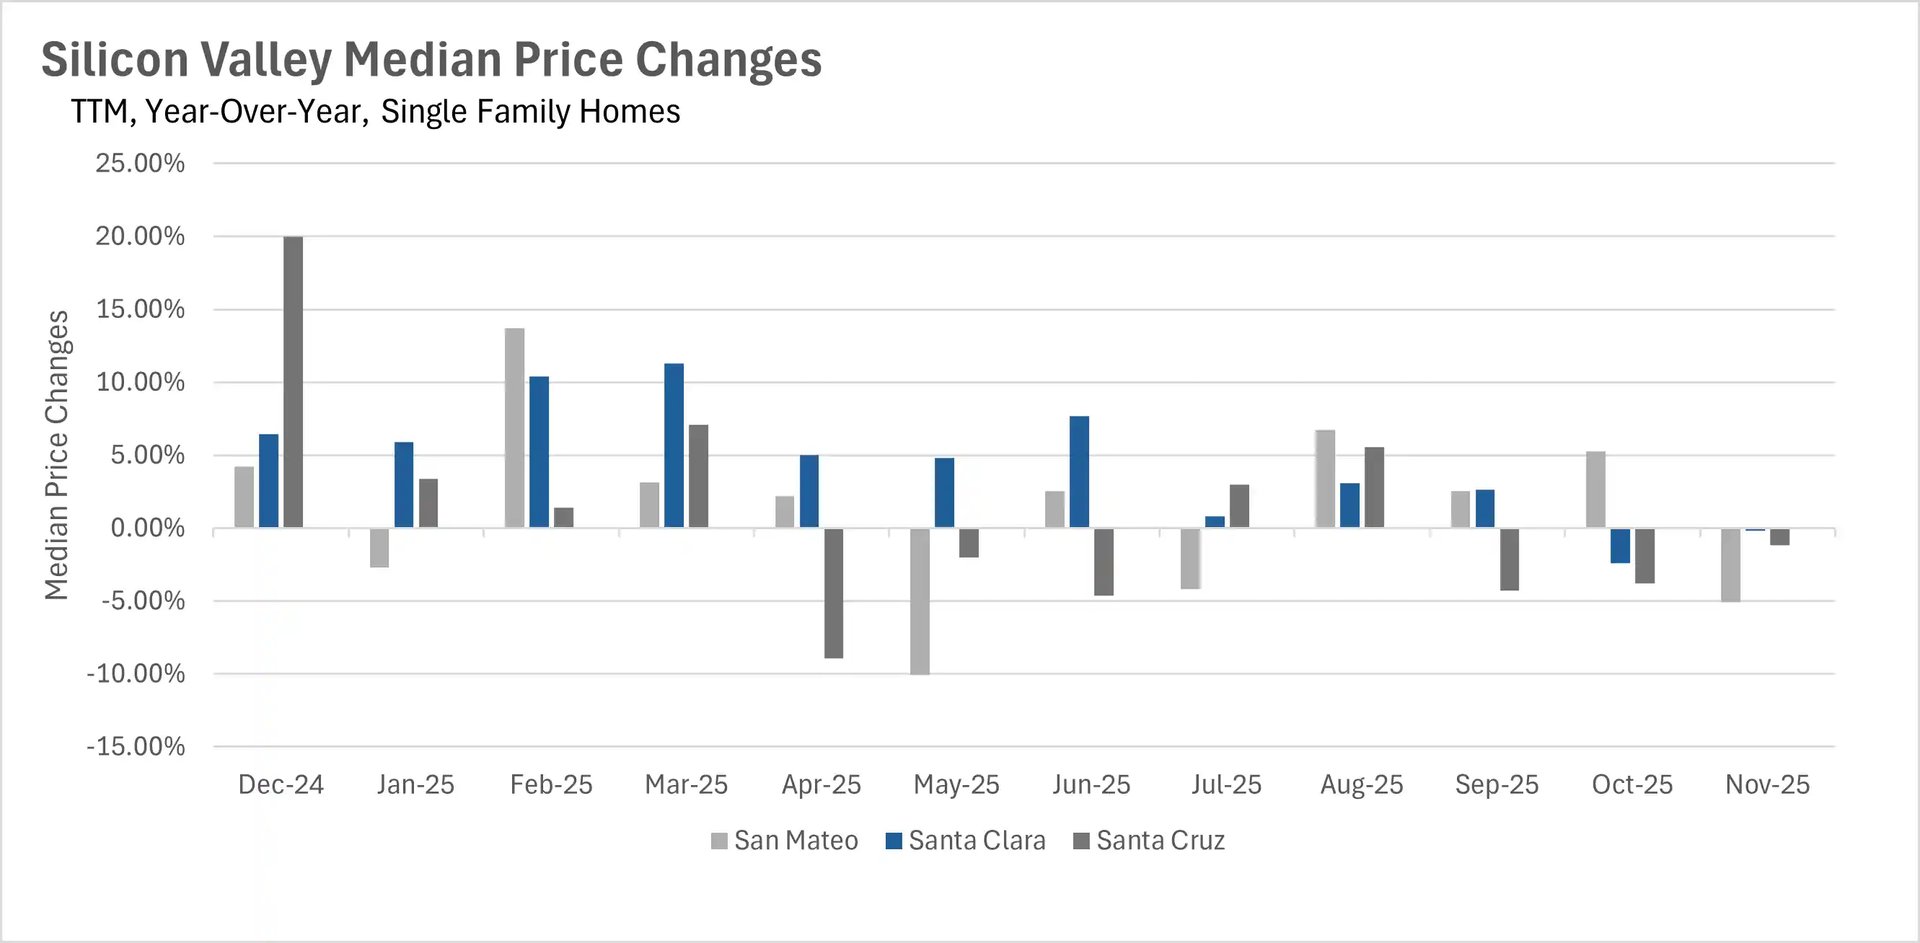
Traditionally, the single-family home market in Silicon Valley is one of the strongest markets in the country! This means that it’s quite rare to see year-over-year price declines in every single county within the region. Unfortunately, though, that’s exactly what we saw this month. Median sale prices decreased by 0.16%, 1.18%, and 5.06% in Santa Clara, Santa Cruz, and San Mateo Counties, respectively. When we turn to the condo market, we saw median sale prices decrease by 3.28% and 4.90% in Santa Clara and San Mateo Counties, while they increased in Santa Cruz County by 5.17% on a year-over-year basis.
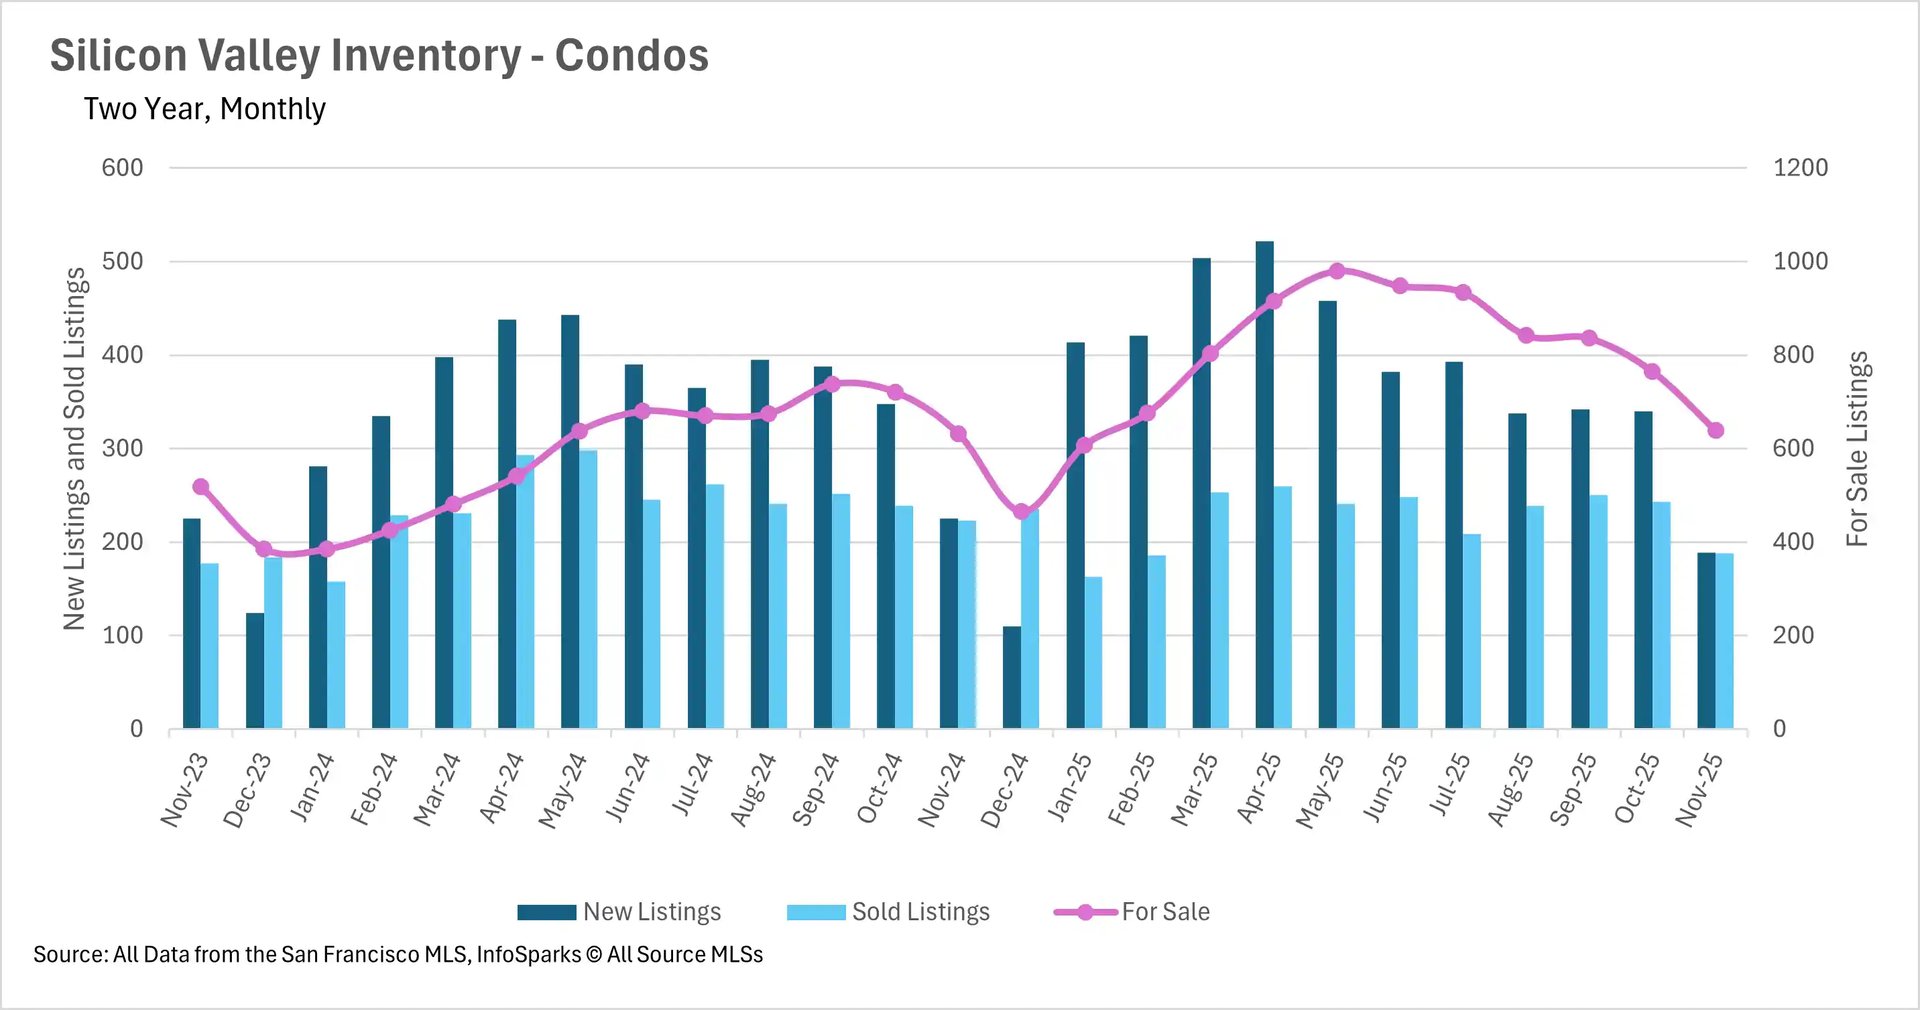
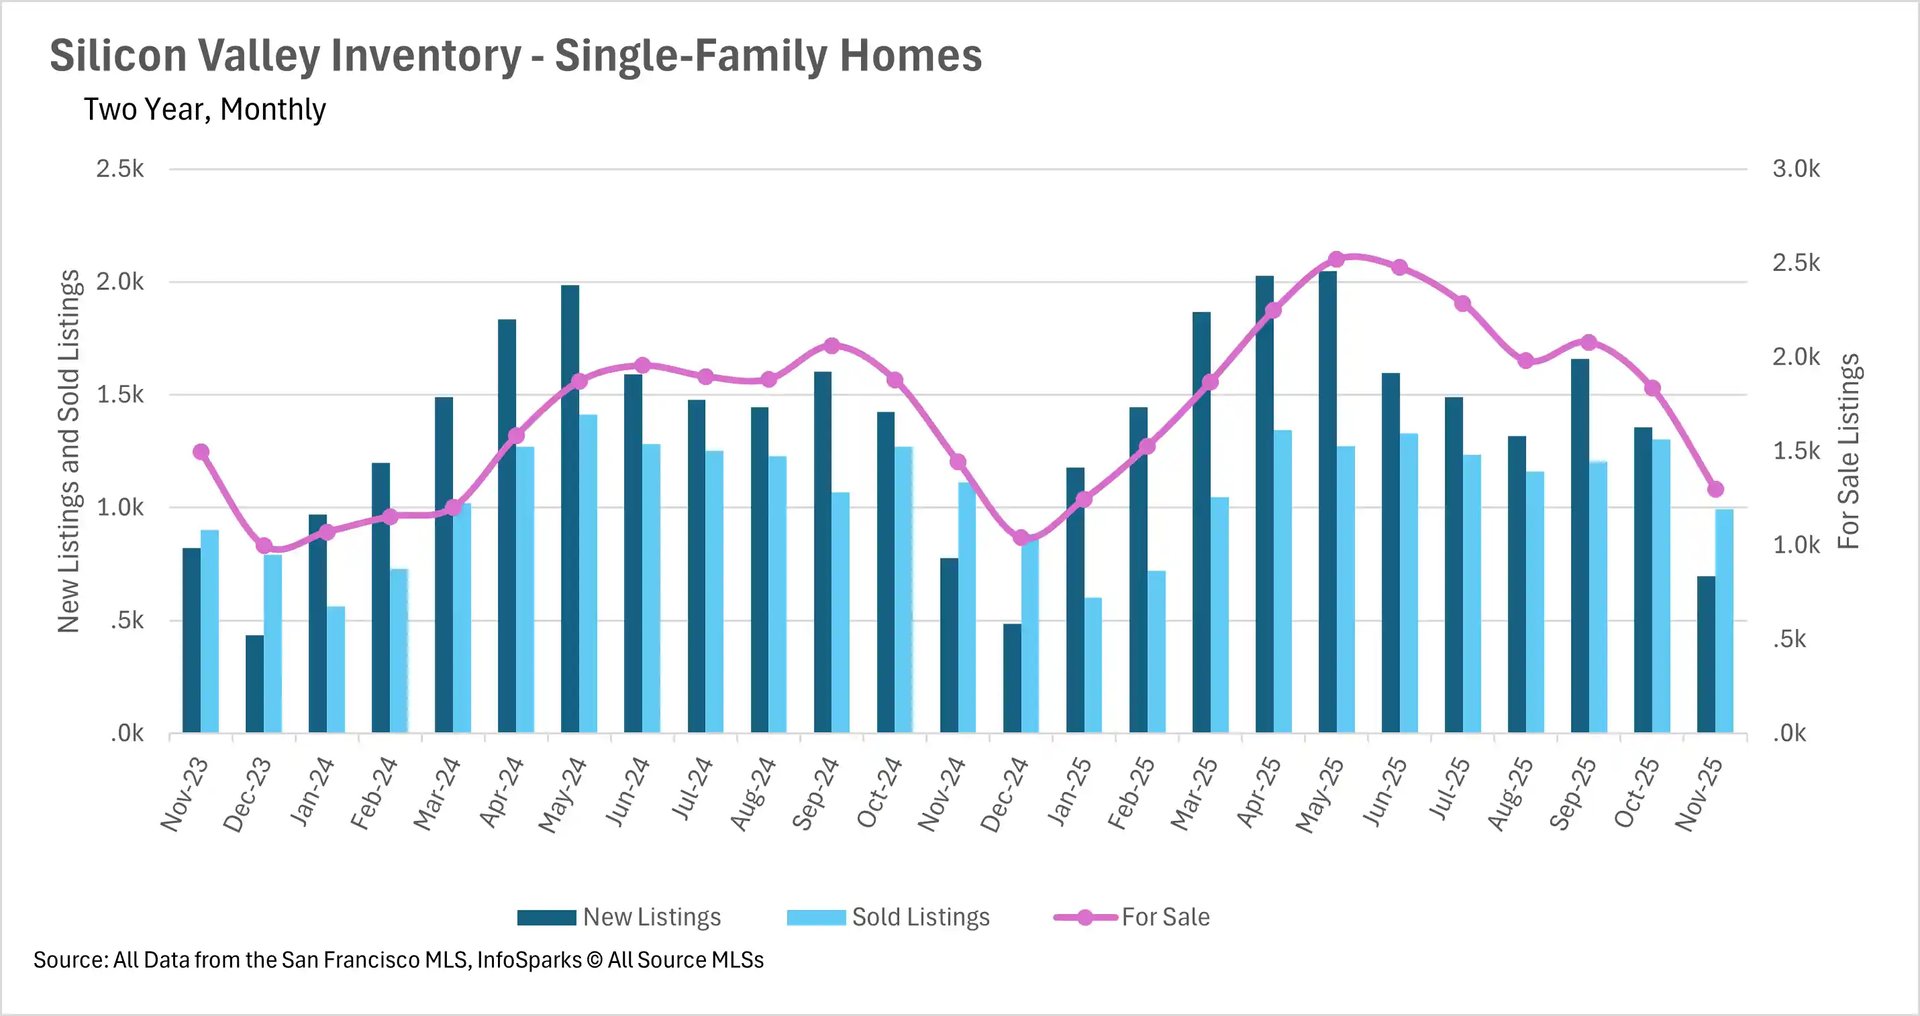
Single-family home inventories have overcorrected since their summer highs
Like much of the state of California, throughout the late spring and early summer, inventories began to build at an incredibly rapid pace in Silicon Valley. While many thought that we may see the market return to healthier levels of inventory in the long term, unfortunately that’s not the case. In the month of November, we saw single-family inventories overcorrect in a huge way, dropping by nearly 30% on a month-over-month basis, and just over 10% on a year-over-year basis. In fact, inventory levels for single-family homes are nearing where they were at the lows of December last year! However, when we turn to the condo market, inventory levels are effectively flat year-over-year, with a slight 1.11% increase.
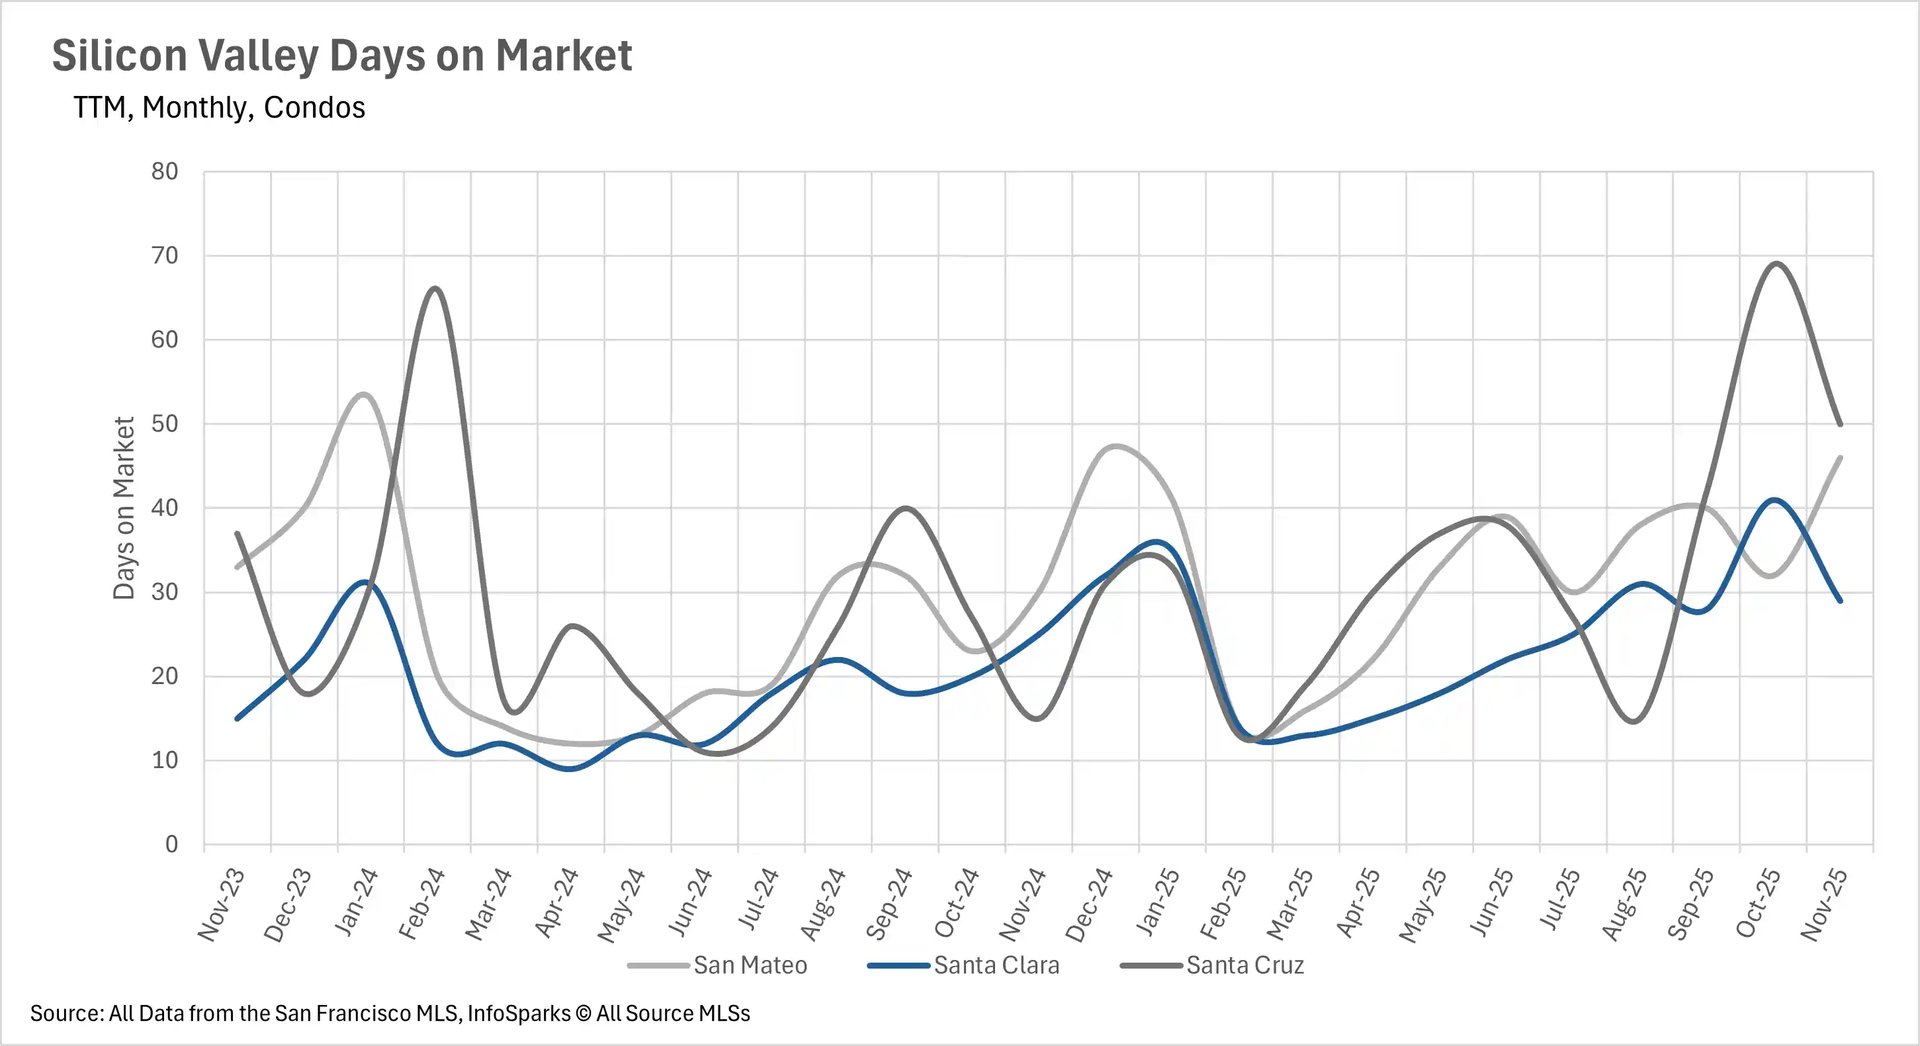
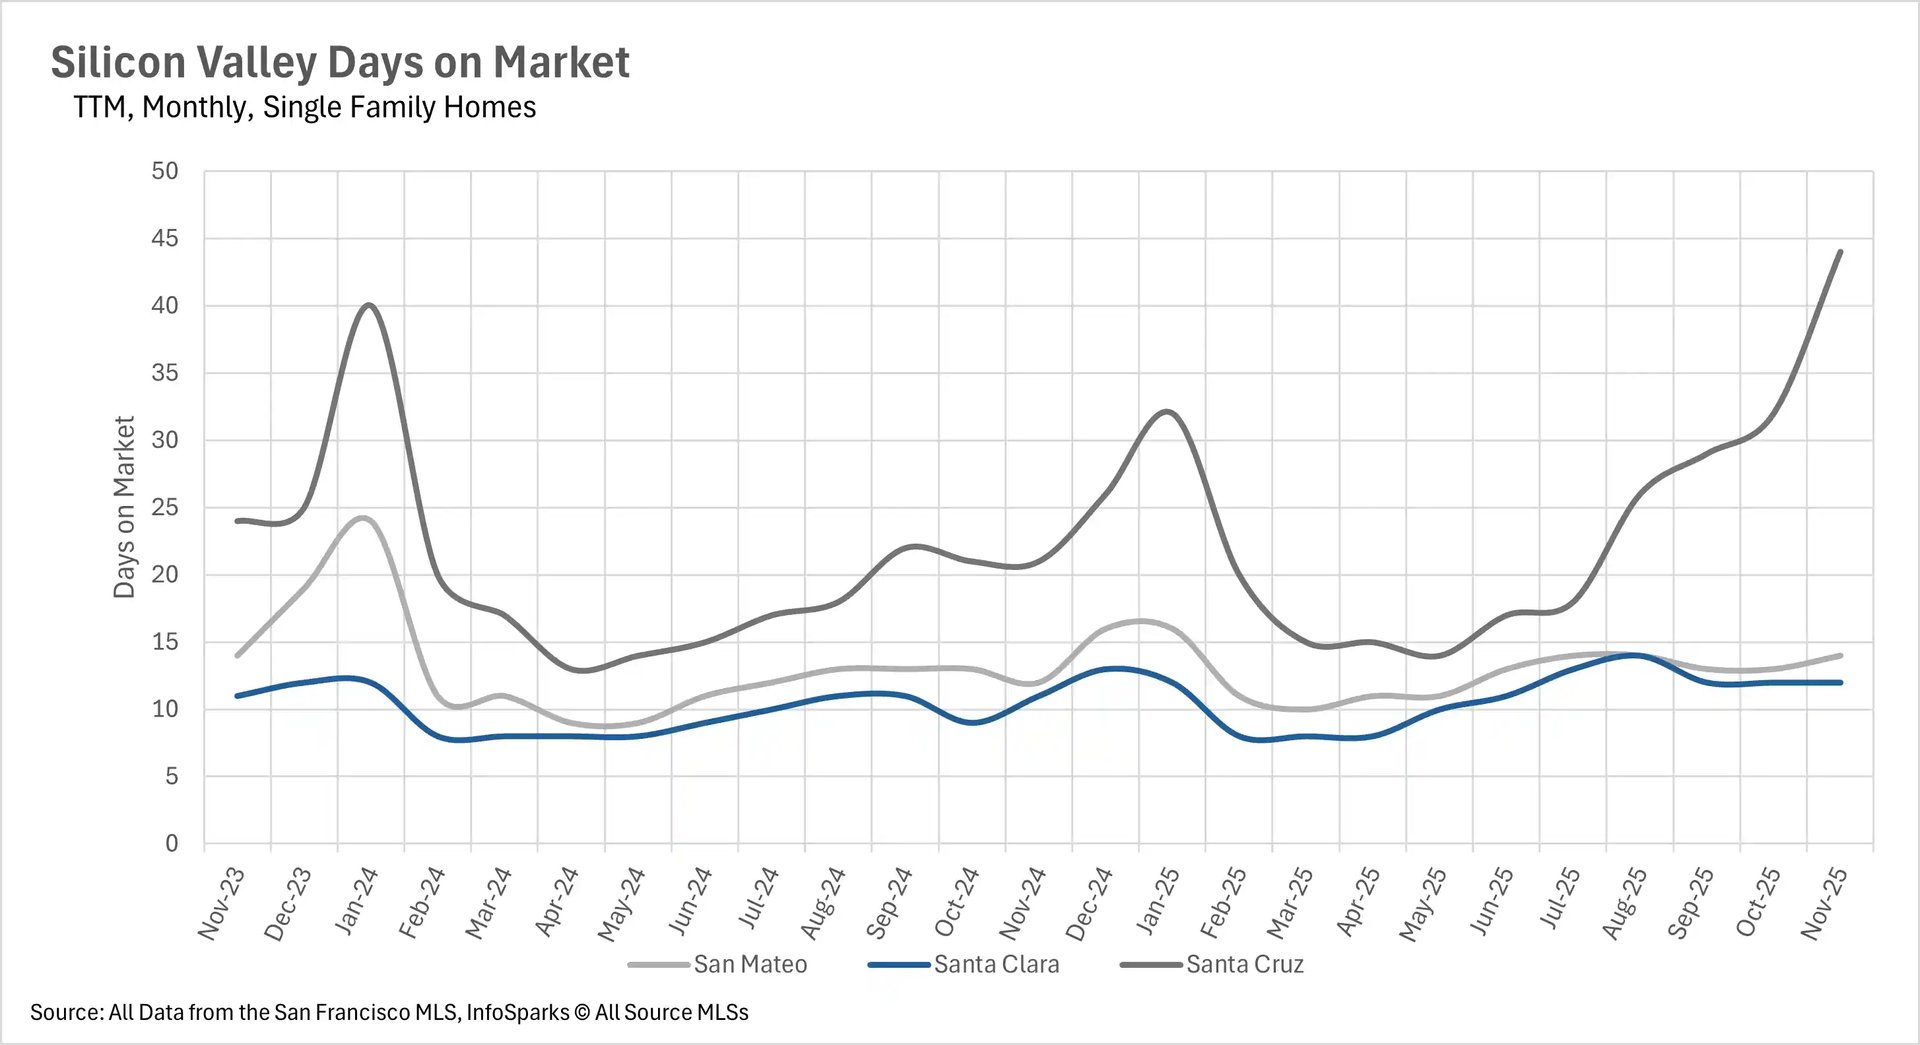
Santa Cruz County single-family homes spent 109.52% more time on the market than last year
While you might expect inventories to move more quickly when there’s a huge dropoff, that wasn’t the case in the single-family home market. Admittedly, it’s very difficult for inventories to move faster than they already are in San Mateo and Santa Clara Counties, as the average home is sold in two weeks or less. However, things seem to have gone sideways in Santa Cruz County, where the average single-family home is spending 109.52% more time on the market than it did this time last year!
The seasonal shift toward a seller's market
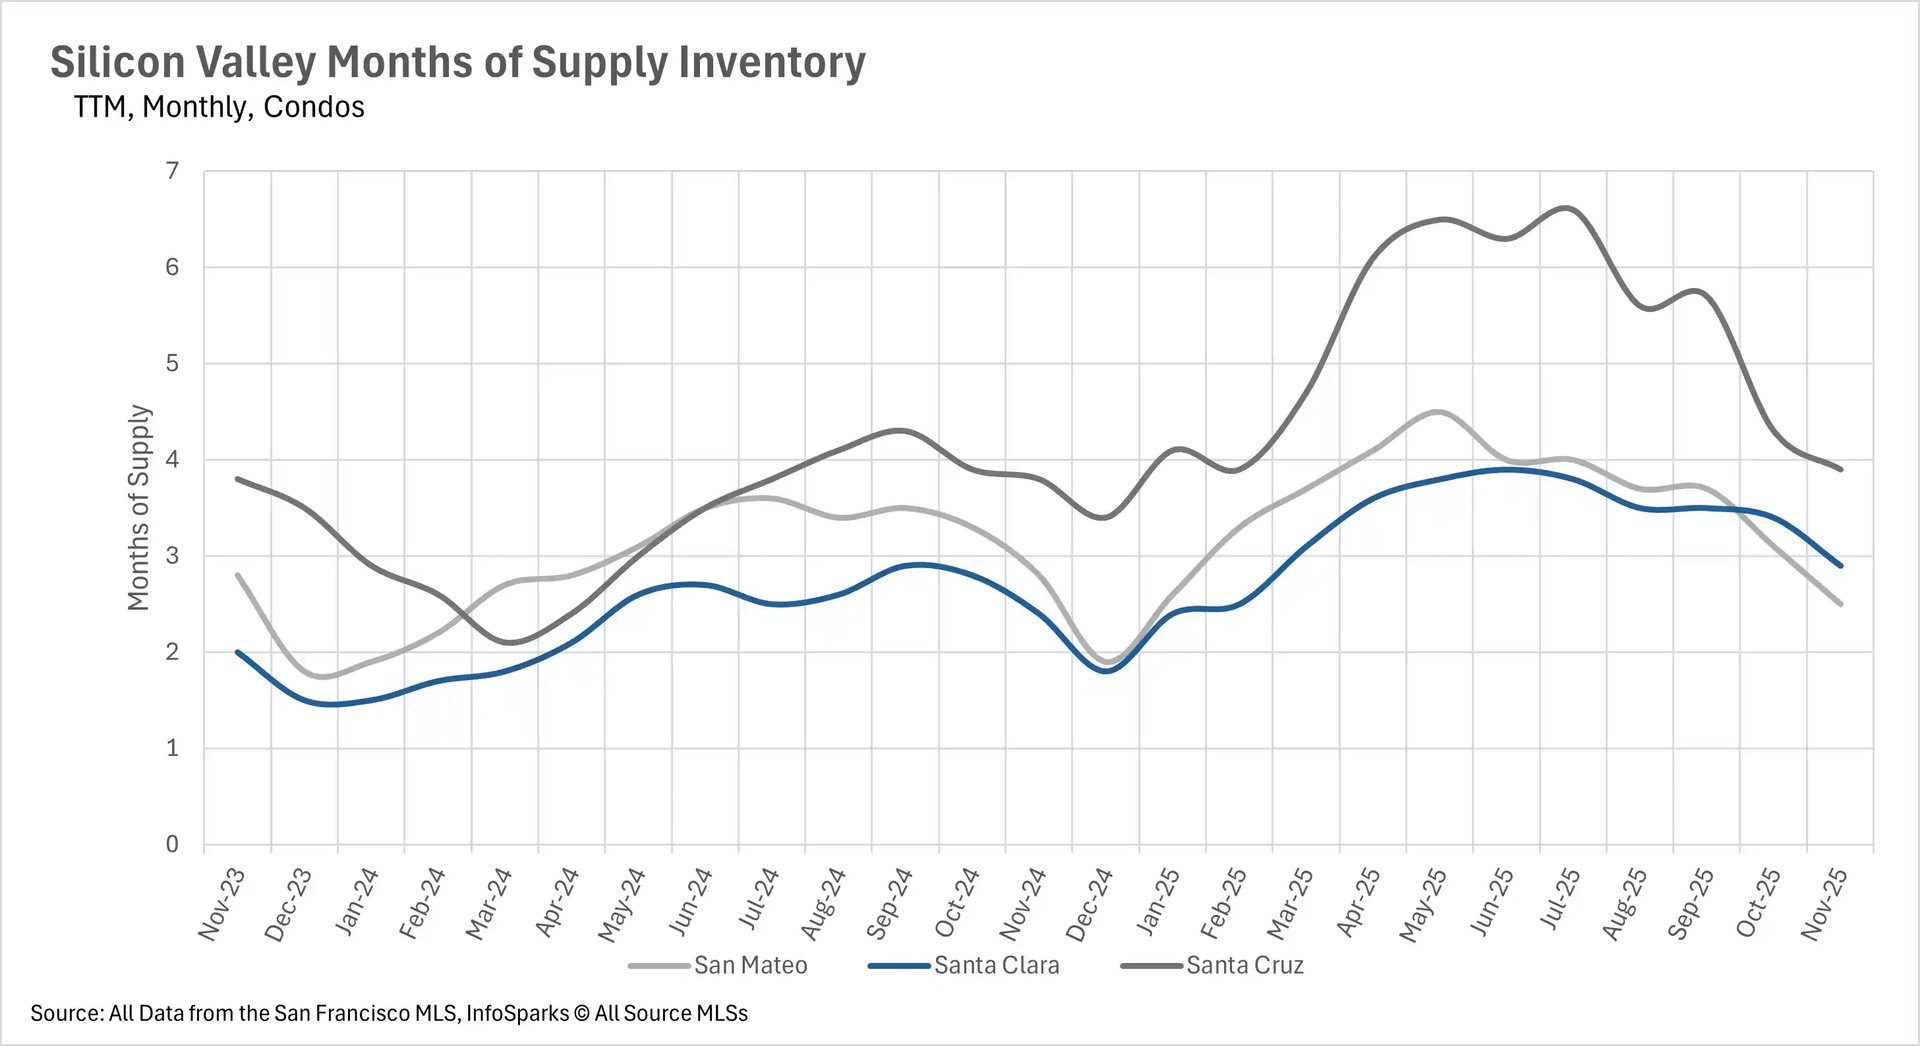
When determining whether a market is a buyers’ market or a sellers’ market, we look to the Months of Supply Inventory (MSI) metric. The state of California has historically averaged around three months of MSI, so any area with at or around three months of MSI is considered a balanced market. Any market that has lower than three months of MSI is considered a sellers’ market, whereas markets with more than three months of MSI are considered buyers’ markets.
Seasonally, we always see a shift toward a seller's market as we near winter, as fewer people want to move in colder months or during the holidays, and this year is certainly no exception. The single-family home market has 1.1, 0.9, and 3 months of inventory in San Mateo, Santa Clara, and Santa Cruz Counties, respectively. Whereas the condo market has 2.5, 2.9, and 3.9 months of inventory on the market in San Mateo, Santa Clara, and Santa Cruz Counties, respectively.