Select a Market Report to Read:
Welcome to the latest San Francisco Real Estate Market Report from Kinoko Real Estate! As your trusted local Real Estate experts in San Francisco, we're committed to providing you with the most accurate and insightful data to guide your home buying or selling journey in this dynamic city.
The Local Lowdown
Quick Take:
- Median sale prices skyrocketed in San Francisco on a year-over-year basis in November.
- Inventories declined by more than 40% across the board in San Francisco.
- The average single-family home sold for in just 13 days.
Note: You can find the charts/graphs for the Local Lowdown at the end of this section.
*National Association of REALTORS® data is released two months behind, so we estimate the most recent month's data when possible and appropriate.
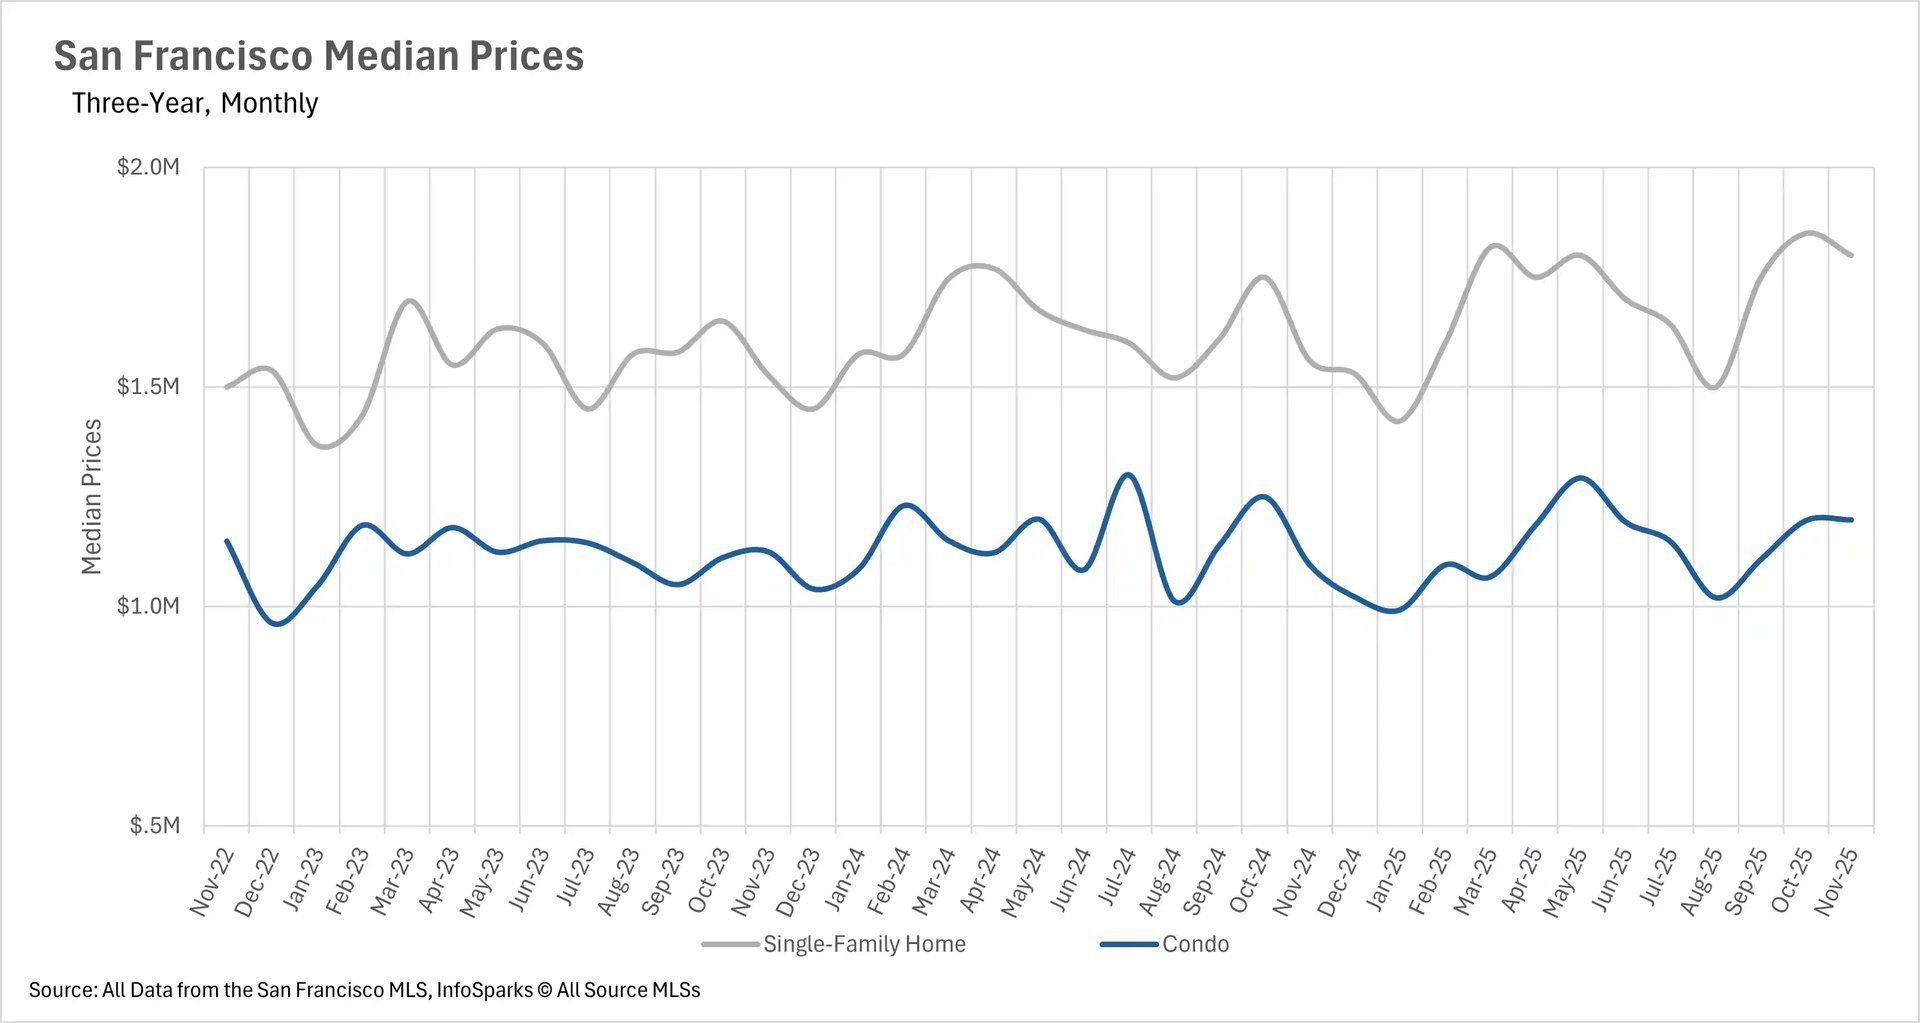
The median single-family home sold for 15.82% more than it did last year
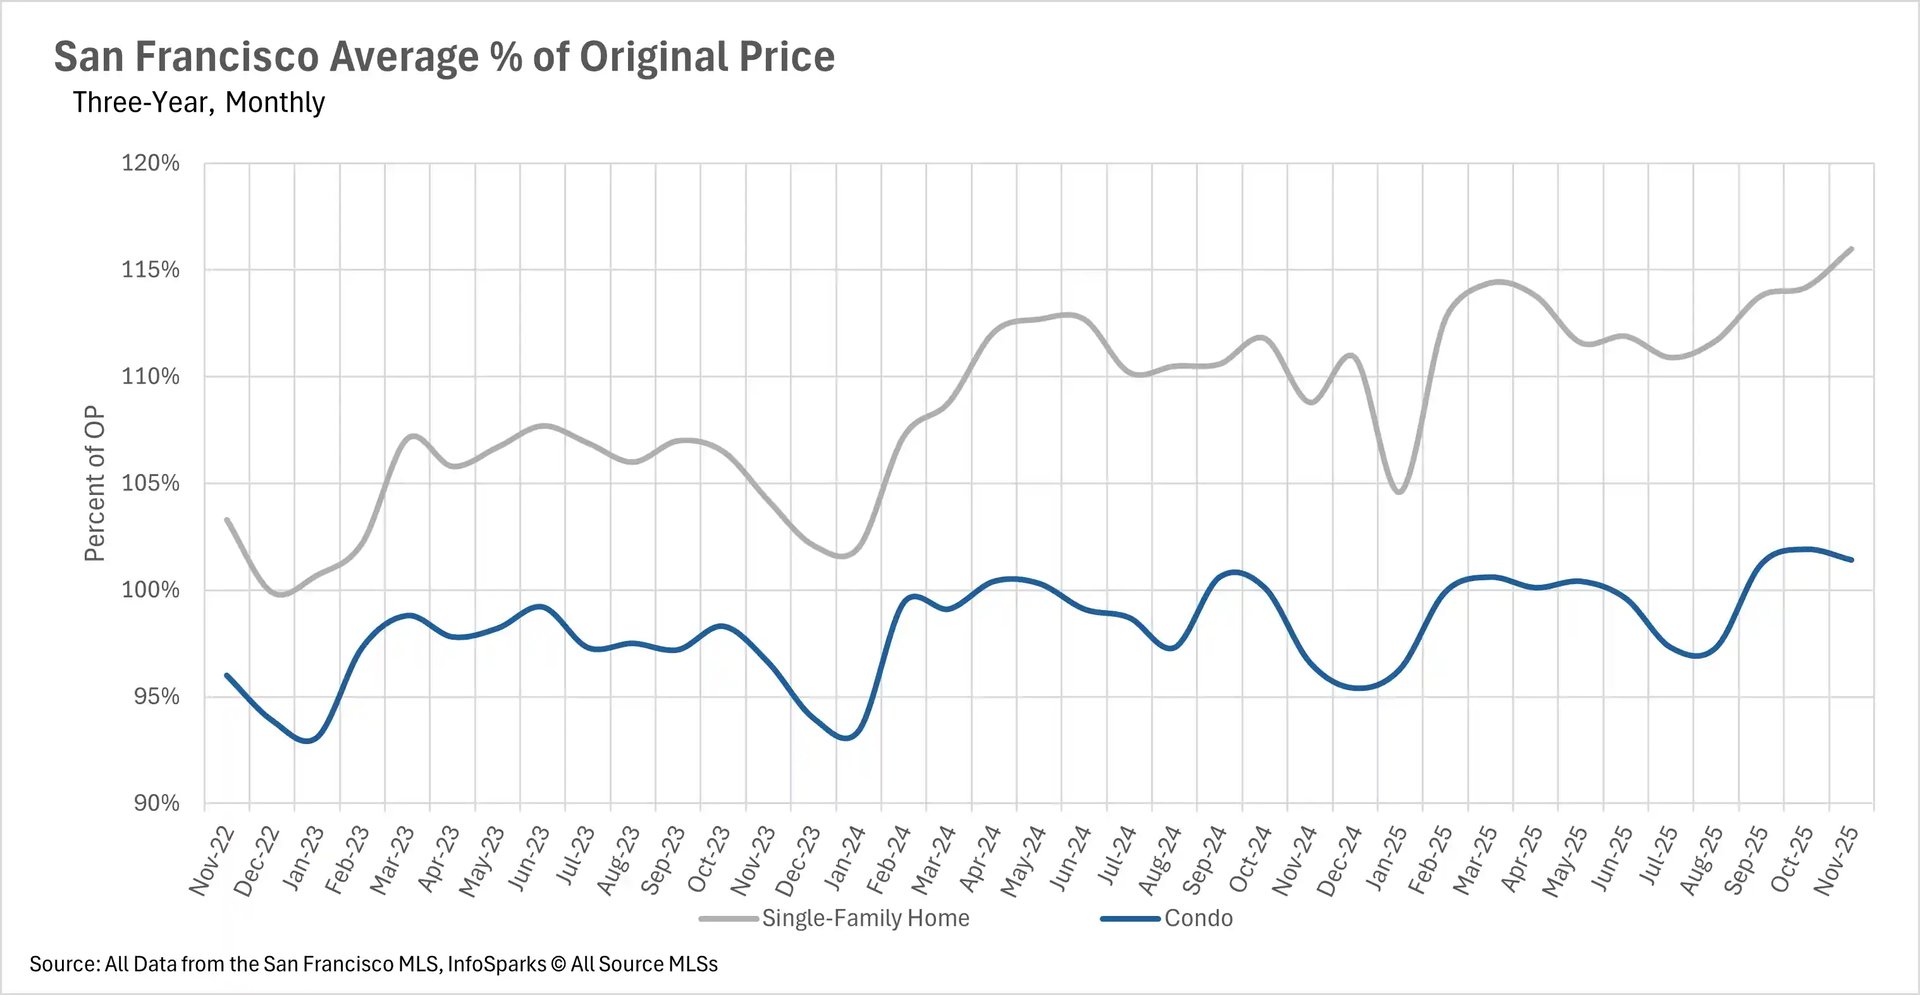
In the month of November, we saw median sale prices soar on a year-over-year basis. Typically, we see a drastic decline in median sale price from October to November, but we didn’t see that this year. The decrease in median sale price was very modest, which resulted in the median sale price of single-family homes increasing by 15.82%, and the median sale price of condos increasing by 9.36% year-over-year. Additionally, single-family homes are selling for the highest premium that we’ve seen in the past three years, with the average home selling for 16% over the original asking price!
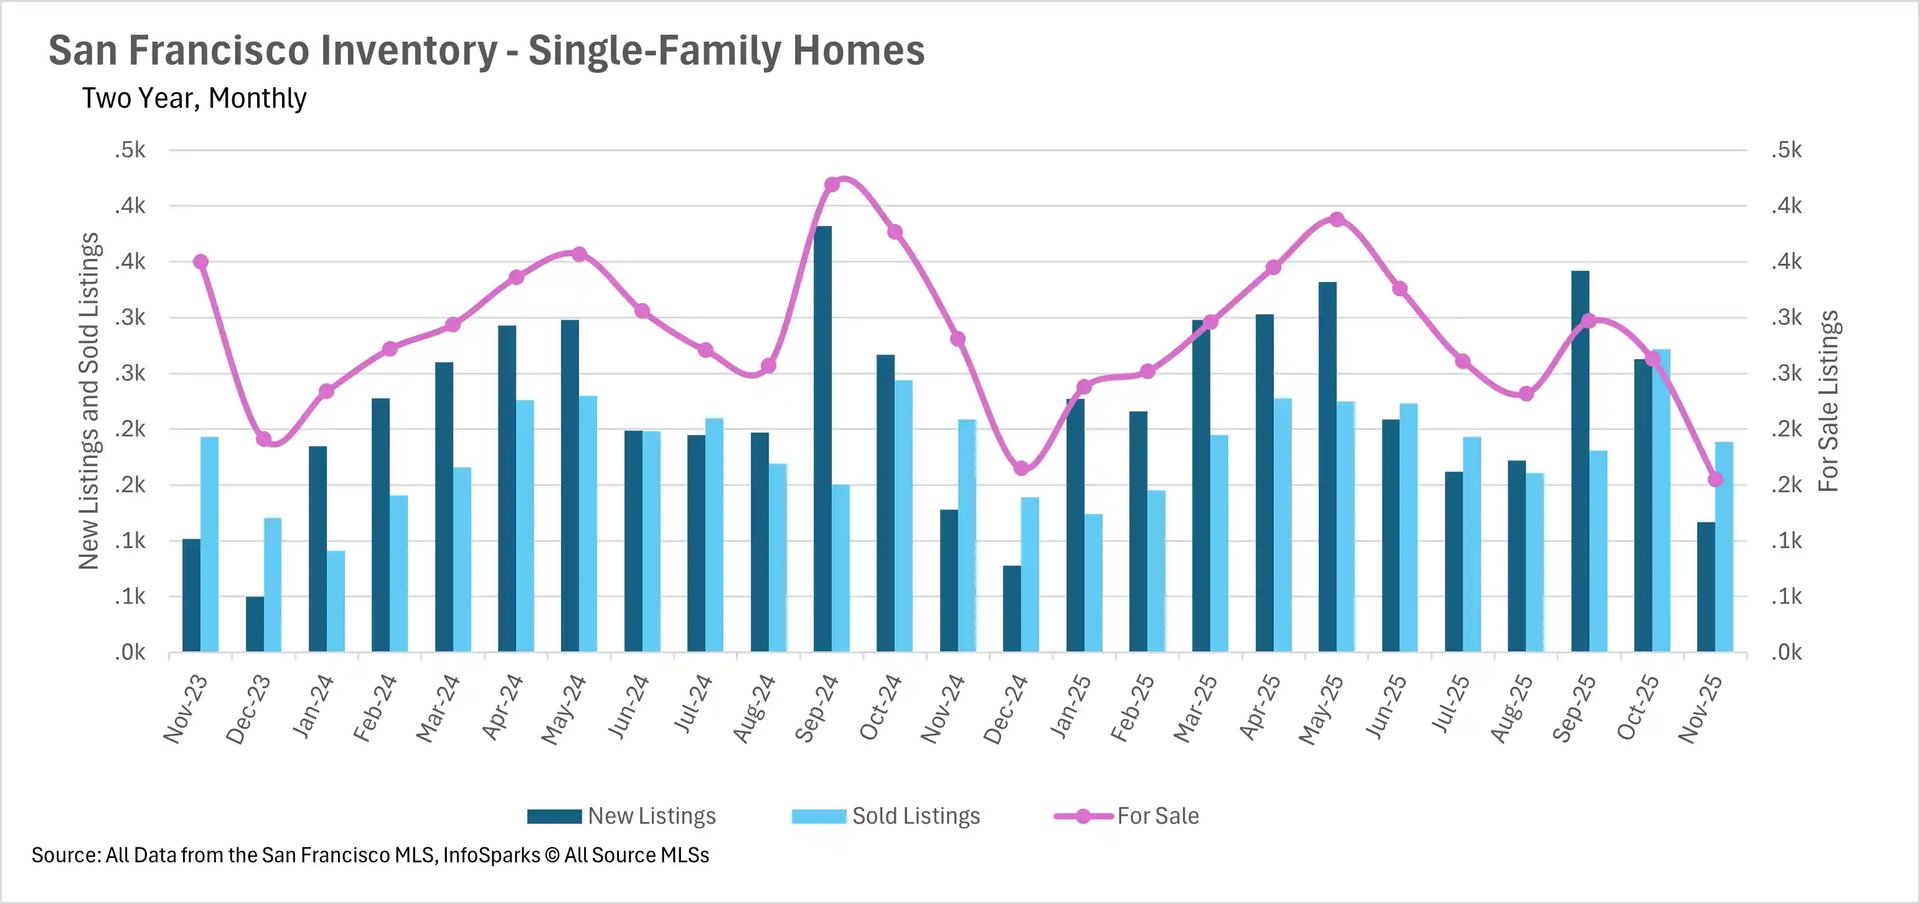
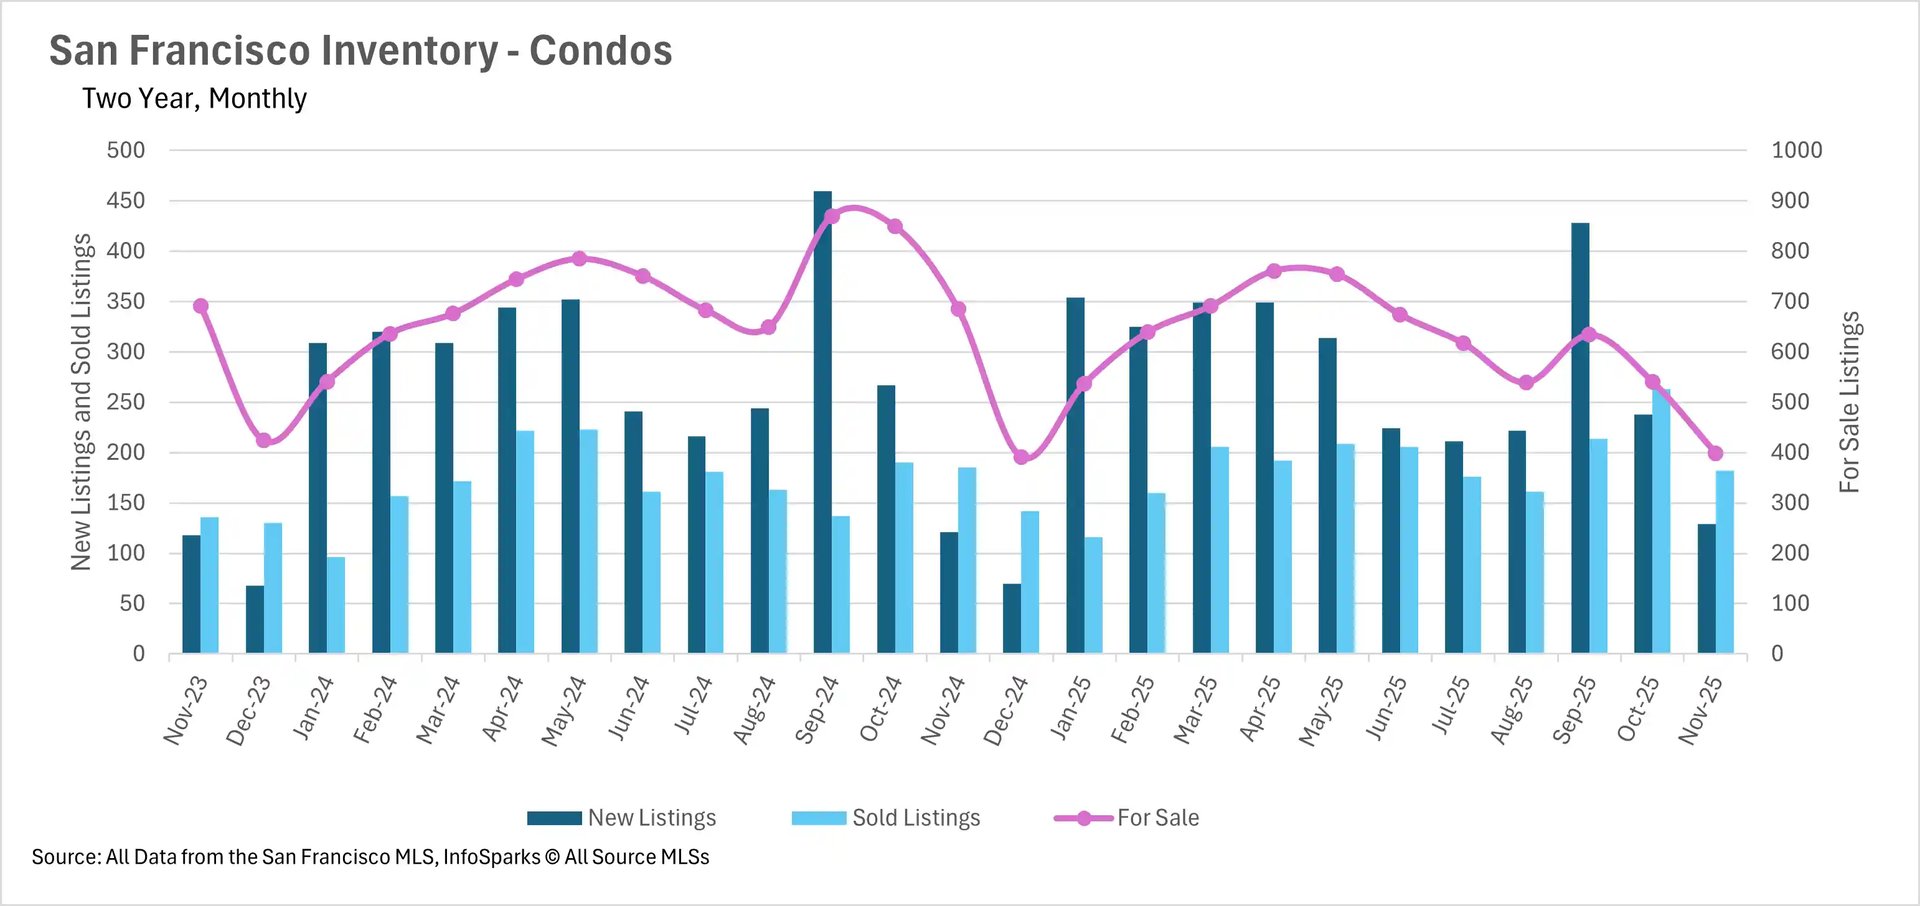
There are only 553 homes for sale in San Francisco
Inventory levels have reached the lowest levels we’ve seen in the past three years, which is concerning, as we typically see further declines in inventory in December. On a year-over-year basis, single-family home inventories declined by 44.84%, and condo inventories declined by 41.90%. Unfortunately, there is no end in sight for the inventory glut that we’ve been experiencing over the past couple of years. If there are further rate cuts in the future, that may incentivize people to move, which would give the market some much-needed fresh inventory!
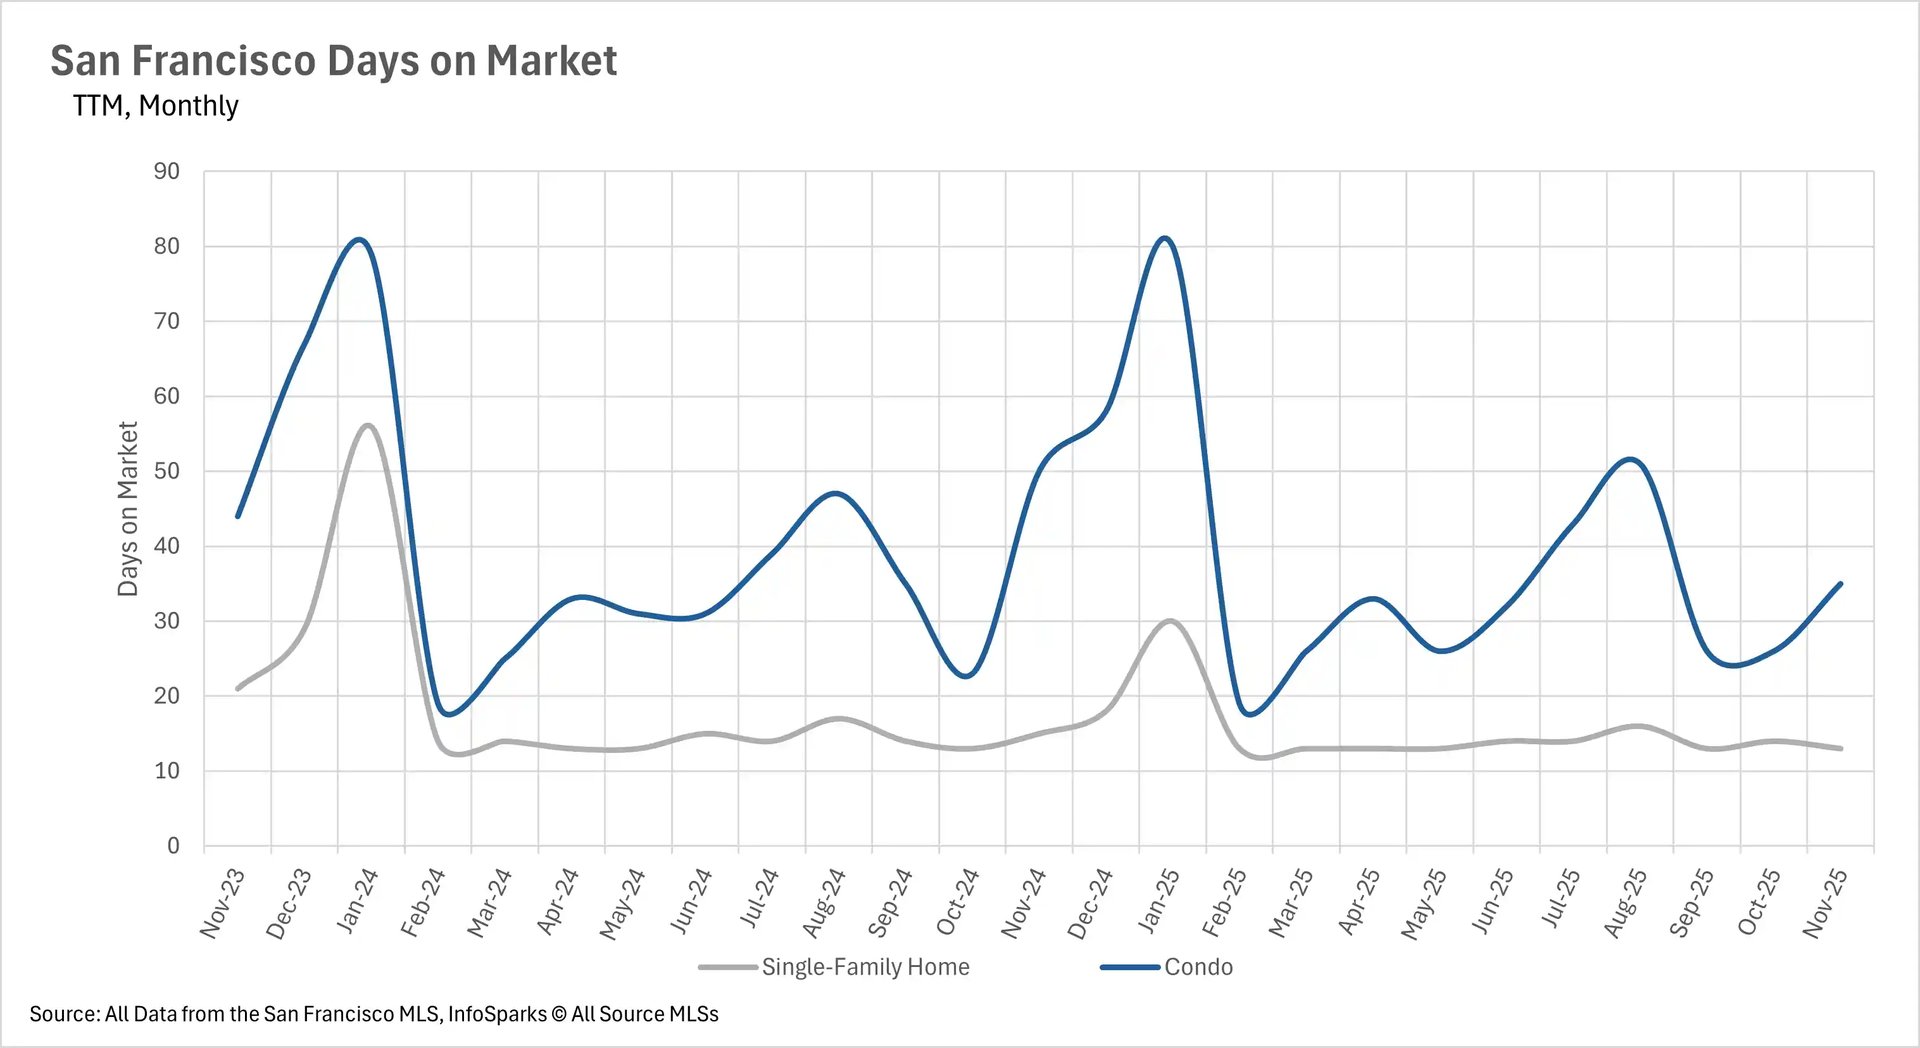
As inventories dwindle away, listings are getting bought up at a breakneck pace
Since inventories are declining steadily over time, listings are spending less and less time on the market. The average single-family home in San Francisco is selling in just 13 days. This represents a 13.33% year-over-year decrease. Likewise, condos are moving incredibly quickly as well, with the average condo selling in just 35 days, representing a 30% year-over-year decline. Unfortunately, this means that buyers don’t have time to ponder an offer before they make it, and this issue won’t resolve itself until the market is able to absorb some inventory!
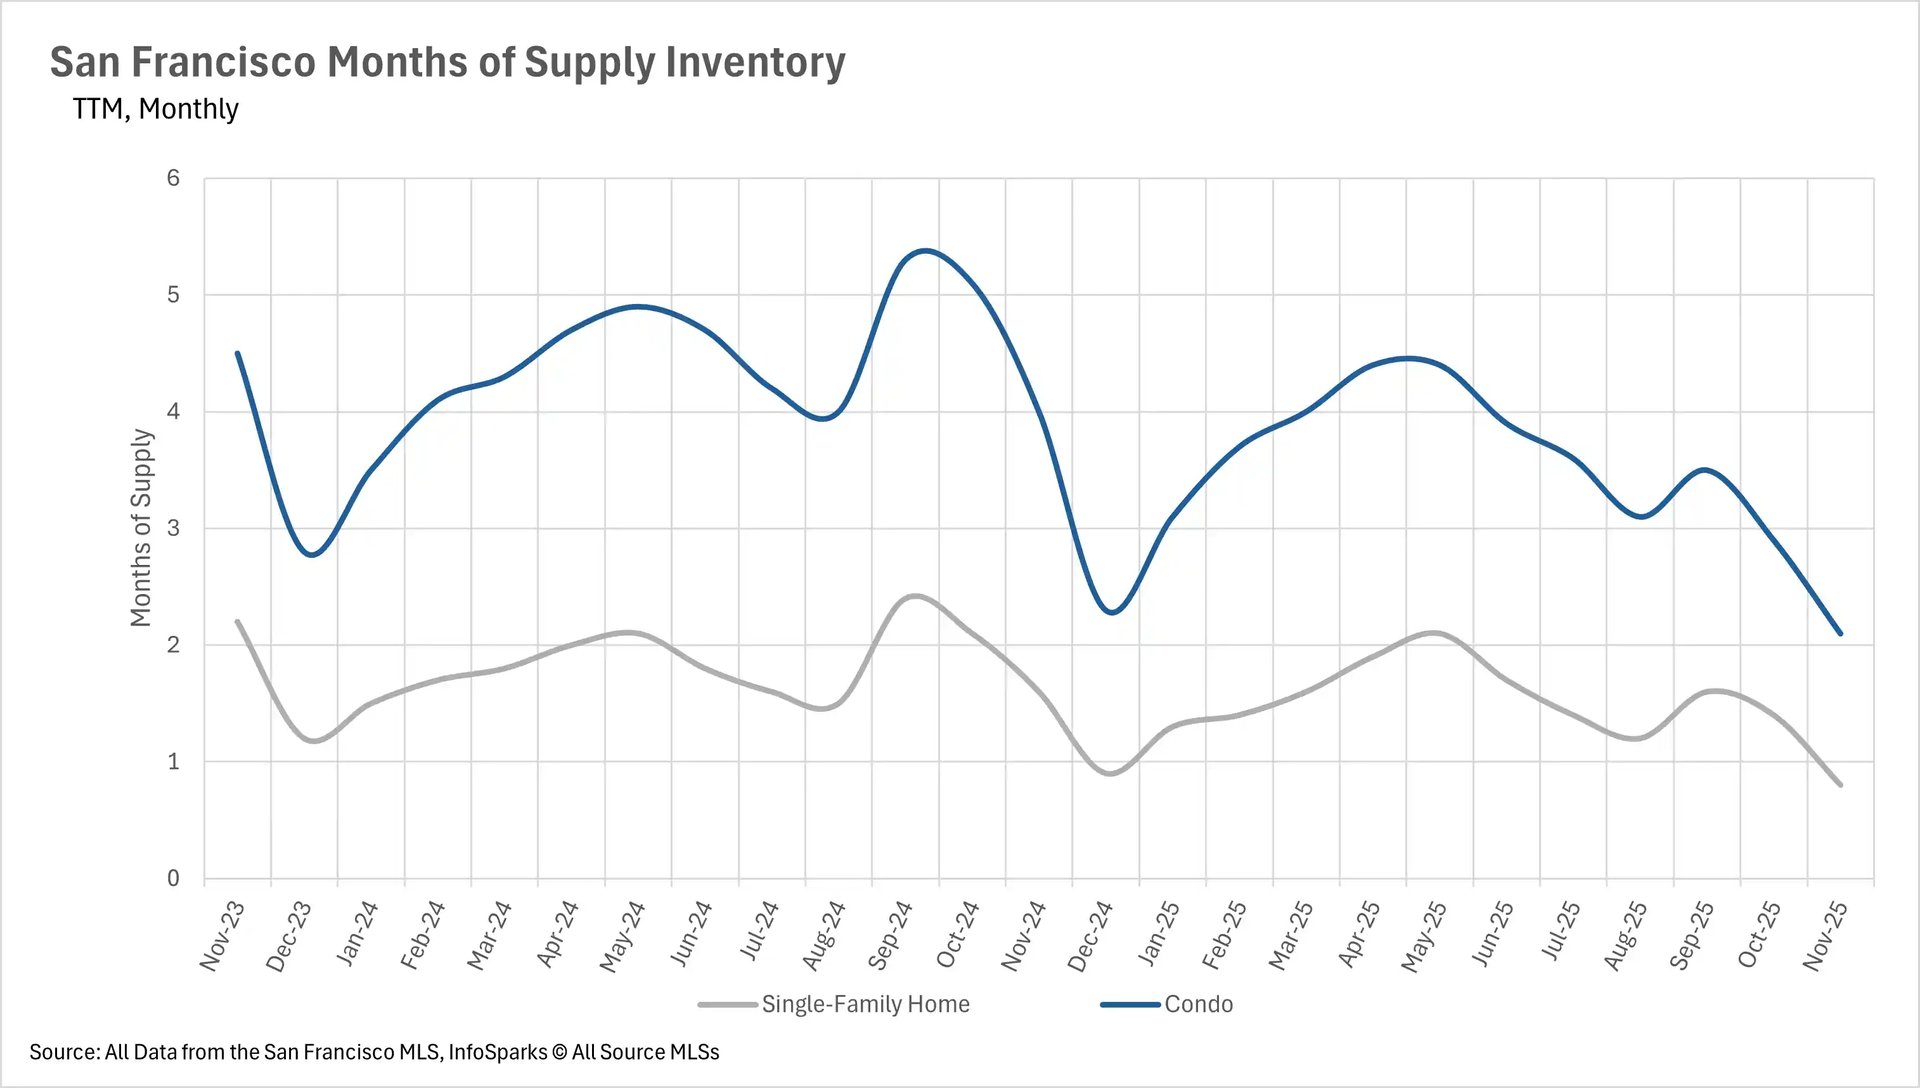
The entire San Francisco market is a sellers market
When determining whether a market is a buyers’ market or a sellers’ market, we look to the Months of Supply Inventory (MSI) metric. The state of California has historically averaged around three months of MSI, so any area with at or around three months of MSI is considered a balanced market. Any market that has lower than three months of MSI is considered a sellers’ market, whereas markets with more than three months of MSI are considered buyers’ markets.
With just 0.8 months of single-family home inventory and 2.1 months of condo inventory on the market, the entire San Francisco market has become a deeply entrenched seller's market. It does not appear that this will change any time soon!