Select a Market Report to Read:
Welcome to the latest San Francisco Real Estate Market Report from Kinoko Real Estate! As your trusted local Real Estate experts in San Francisco, we're committed to providing you with the most accurate and insightful data to guide your home buying or selling journey in this dynamic city.
The Local Lowdown
Quick Take:
- San Francisco experiences explosive growth with single-family homes surging 15.82% and inventory cratering over 40%, creating the tightest market conditions in three years with just 0.8 months of supply.
- The Bay Area undergoes dramatic inventory contraction in November, with most regions seeing 20-30% month-over-month declines as the market enters its seasonal winter slowdown.
- Price trends diverge sharply across regions, with San Francisco soaring to new highs while Silicon Valley experiences its first across-the-board single-family declines in over a year and the East Bay sees significant softness in Alameda County.
- Days on market metrics show extreme regional variation, with San Francisco accelerating dramatically as inventory tightens, while other regions experience substantial slowdowns despite lower inventory levels.
Note: You can find the charts/graphs for the Local Lowdown at the end of this section.
*National Association of REALTORS® data is released two months behind, so we estimate the most recent month's data when possible and appropriate.
San Francisco surges while other regions show widespread price weakness
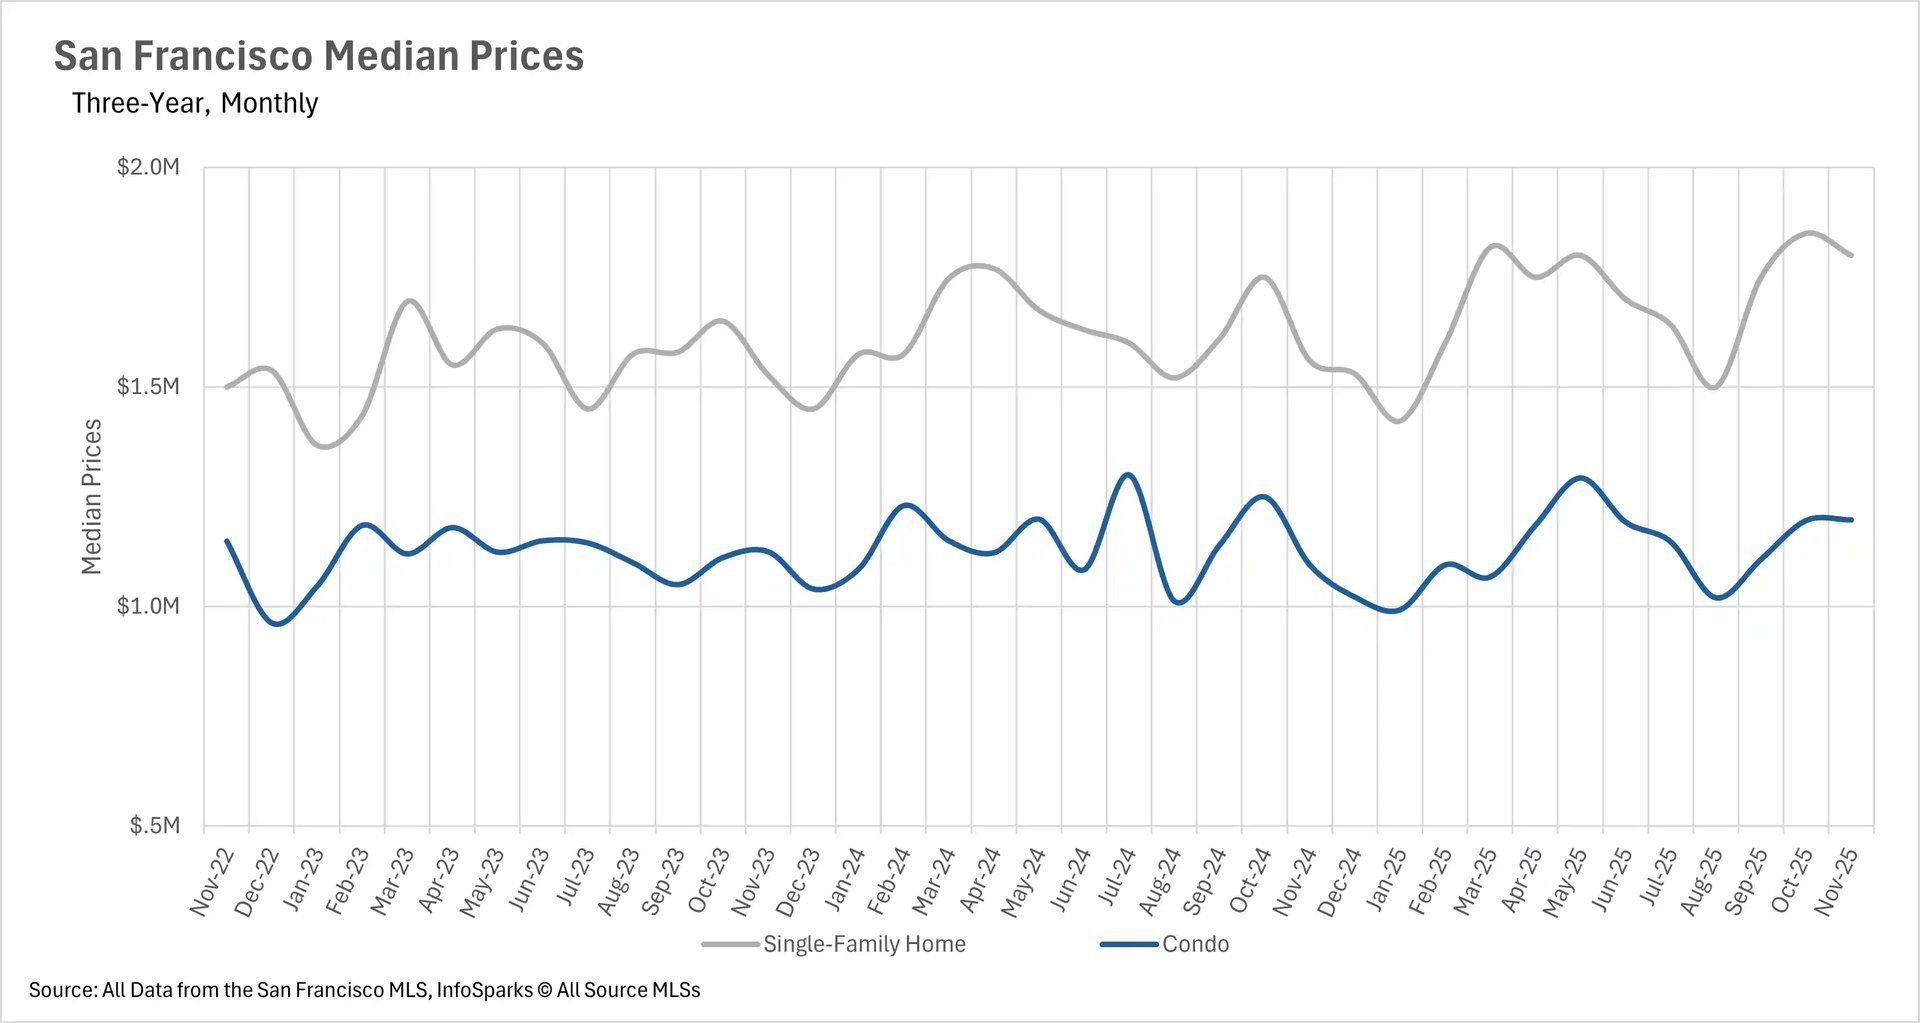
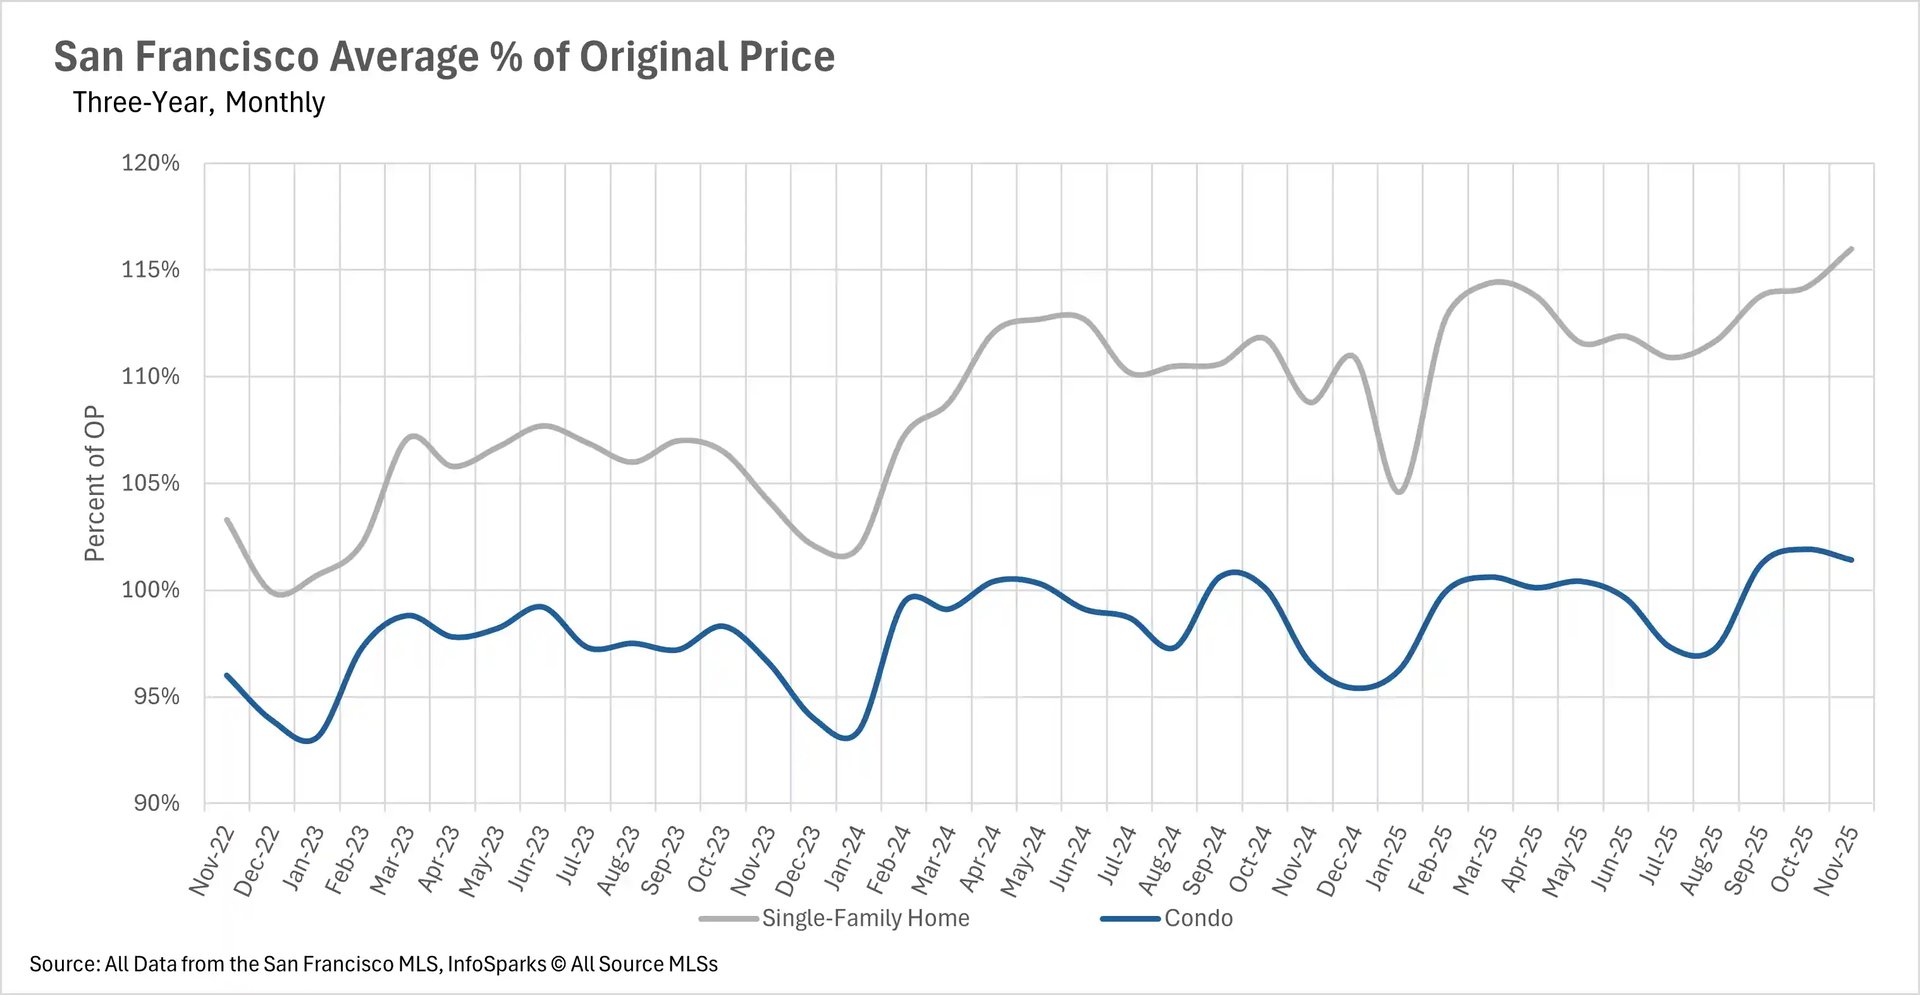
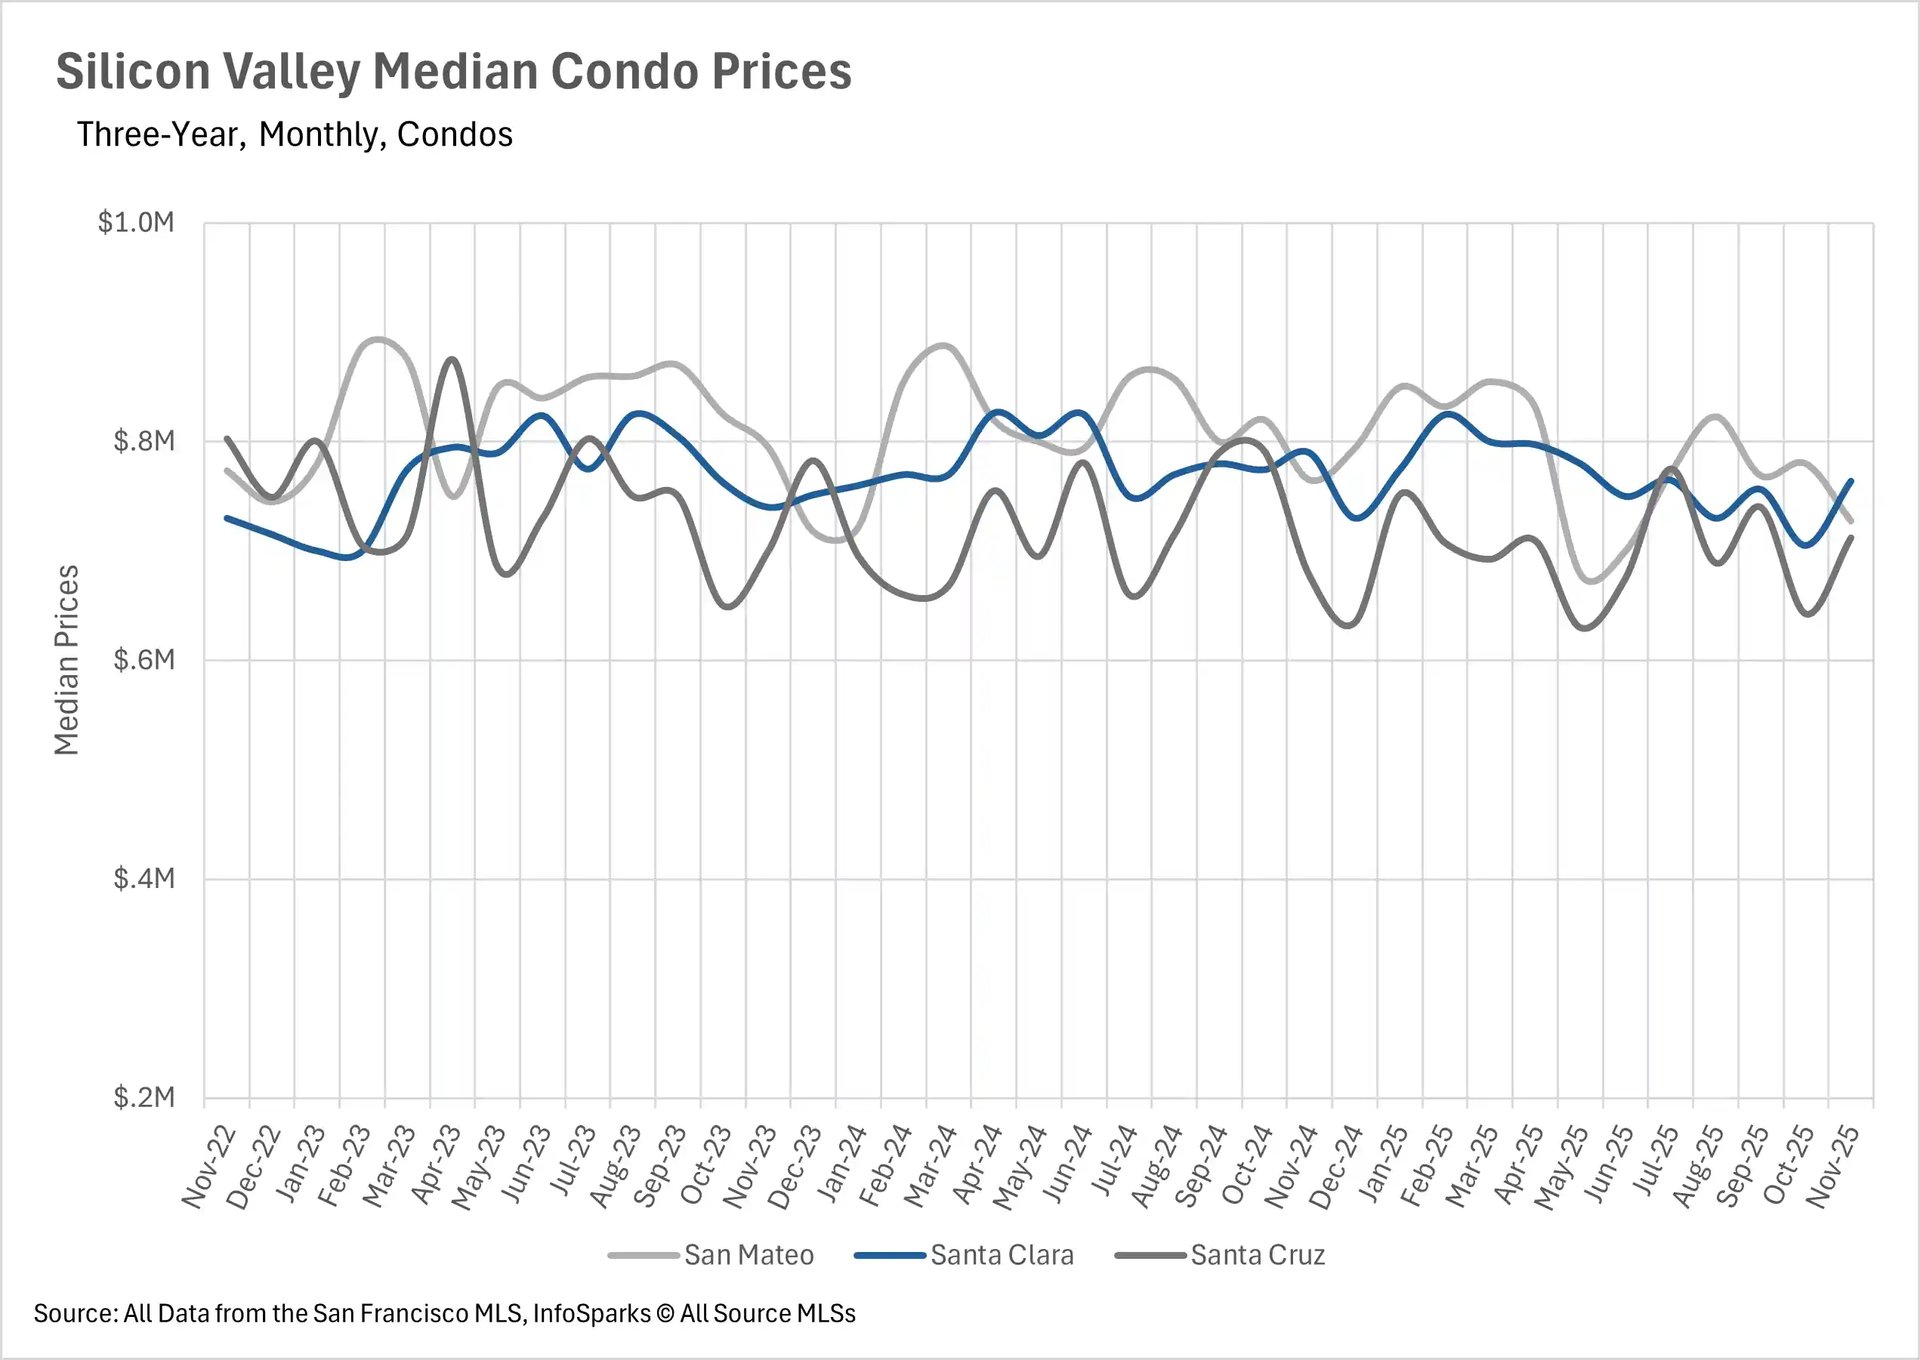
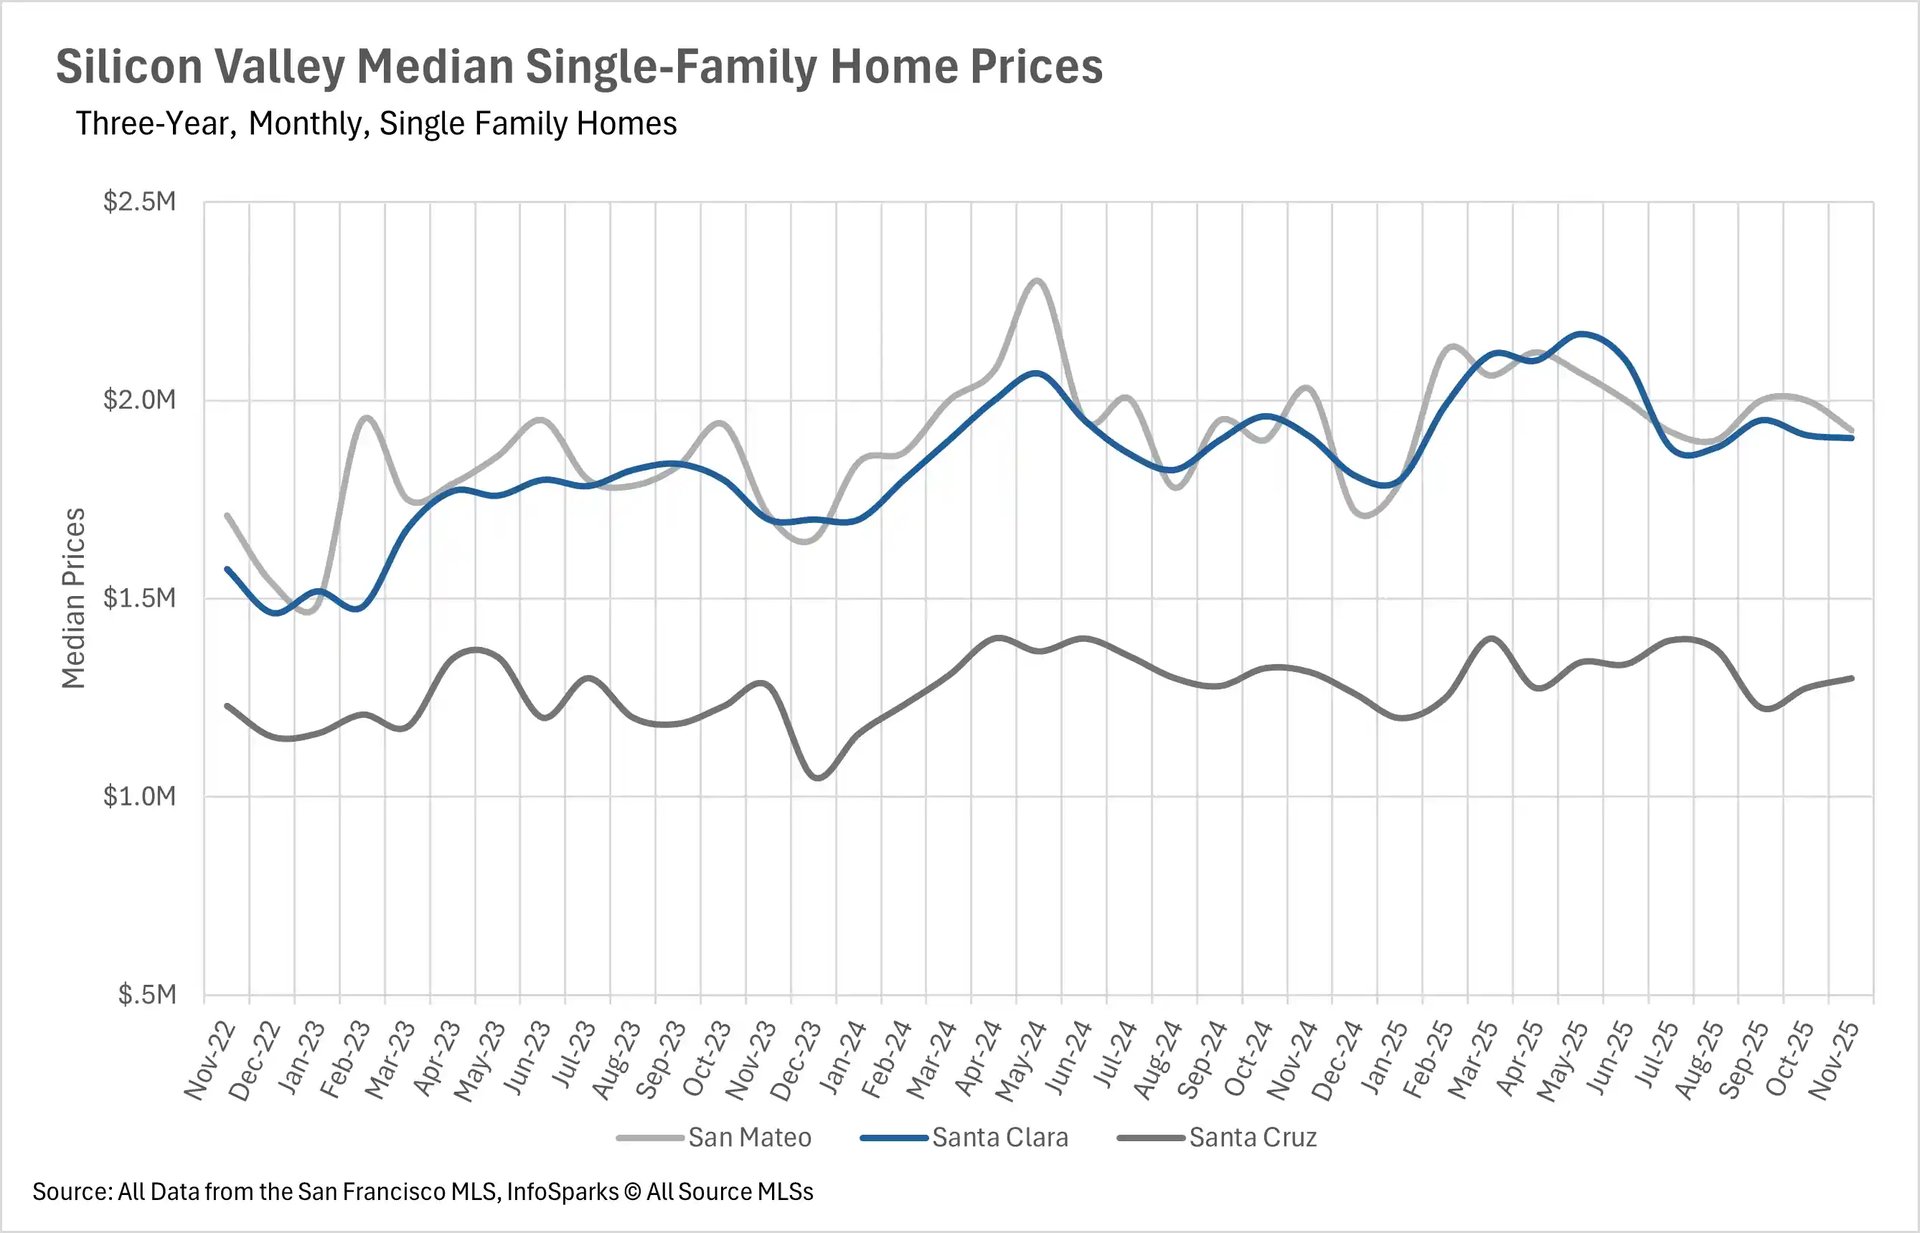
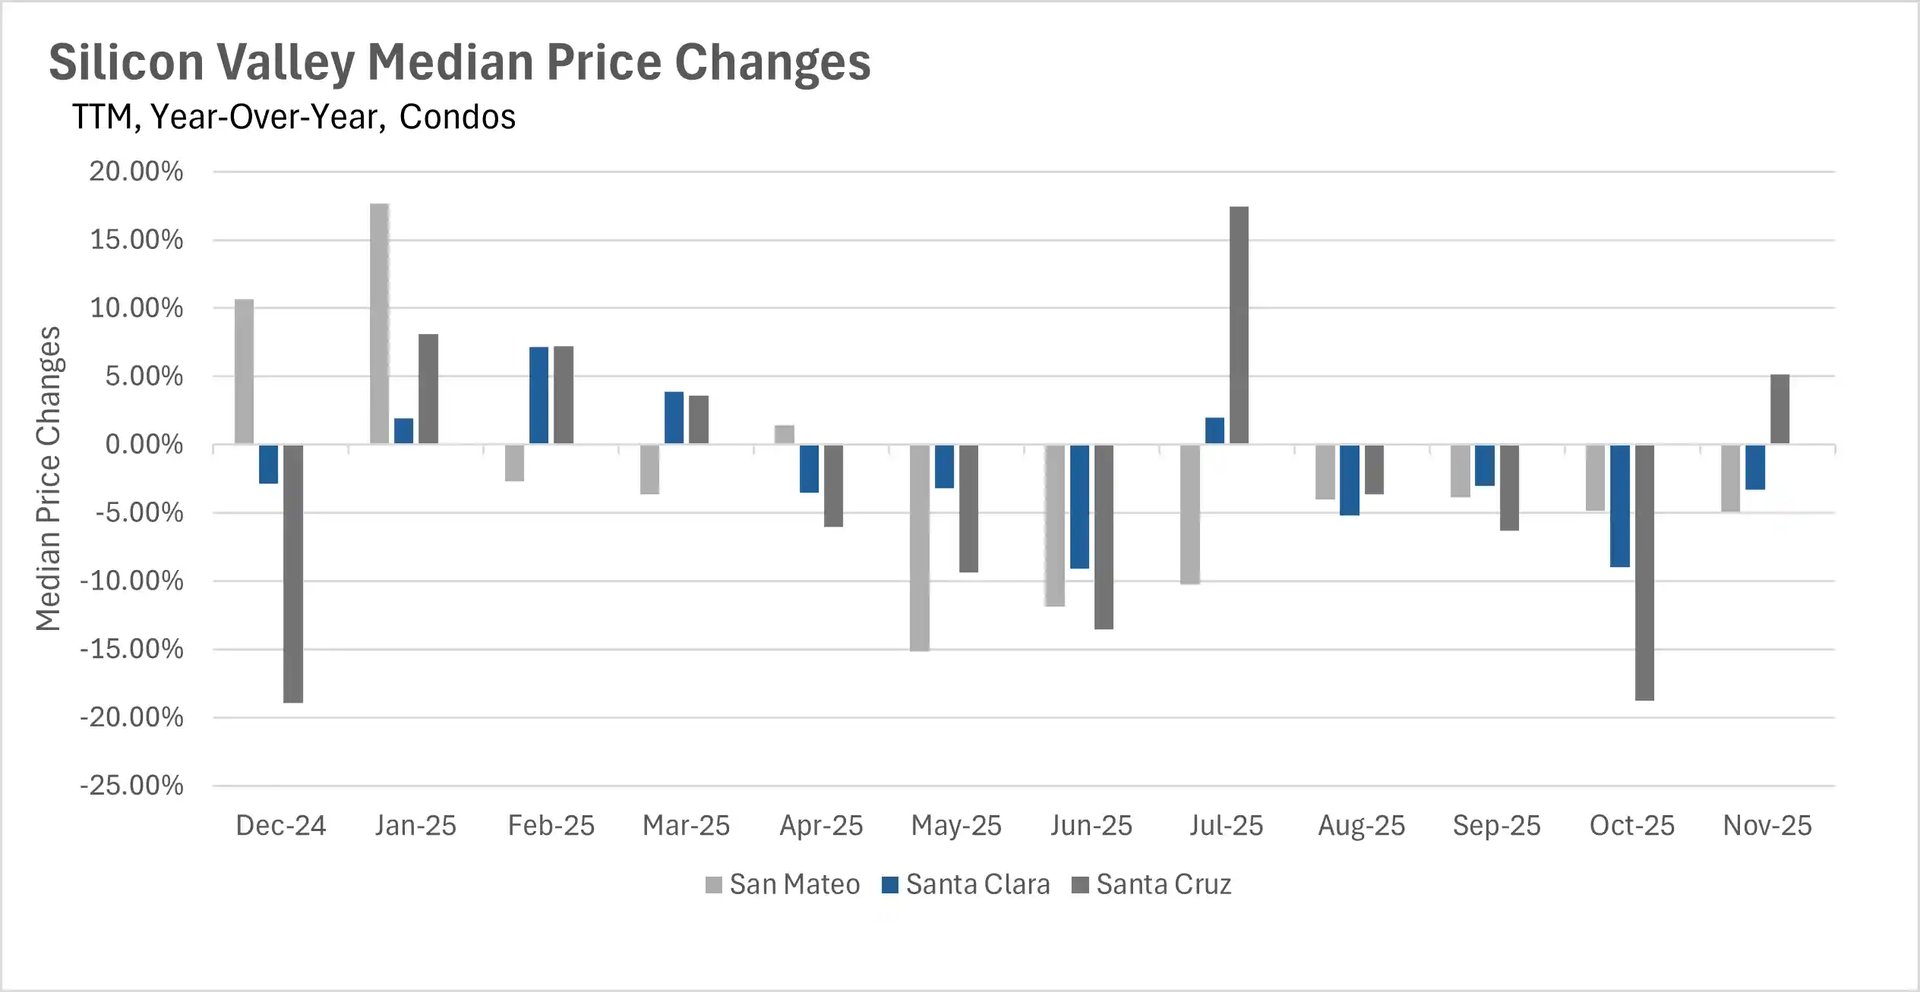
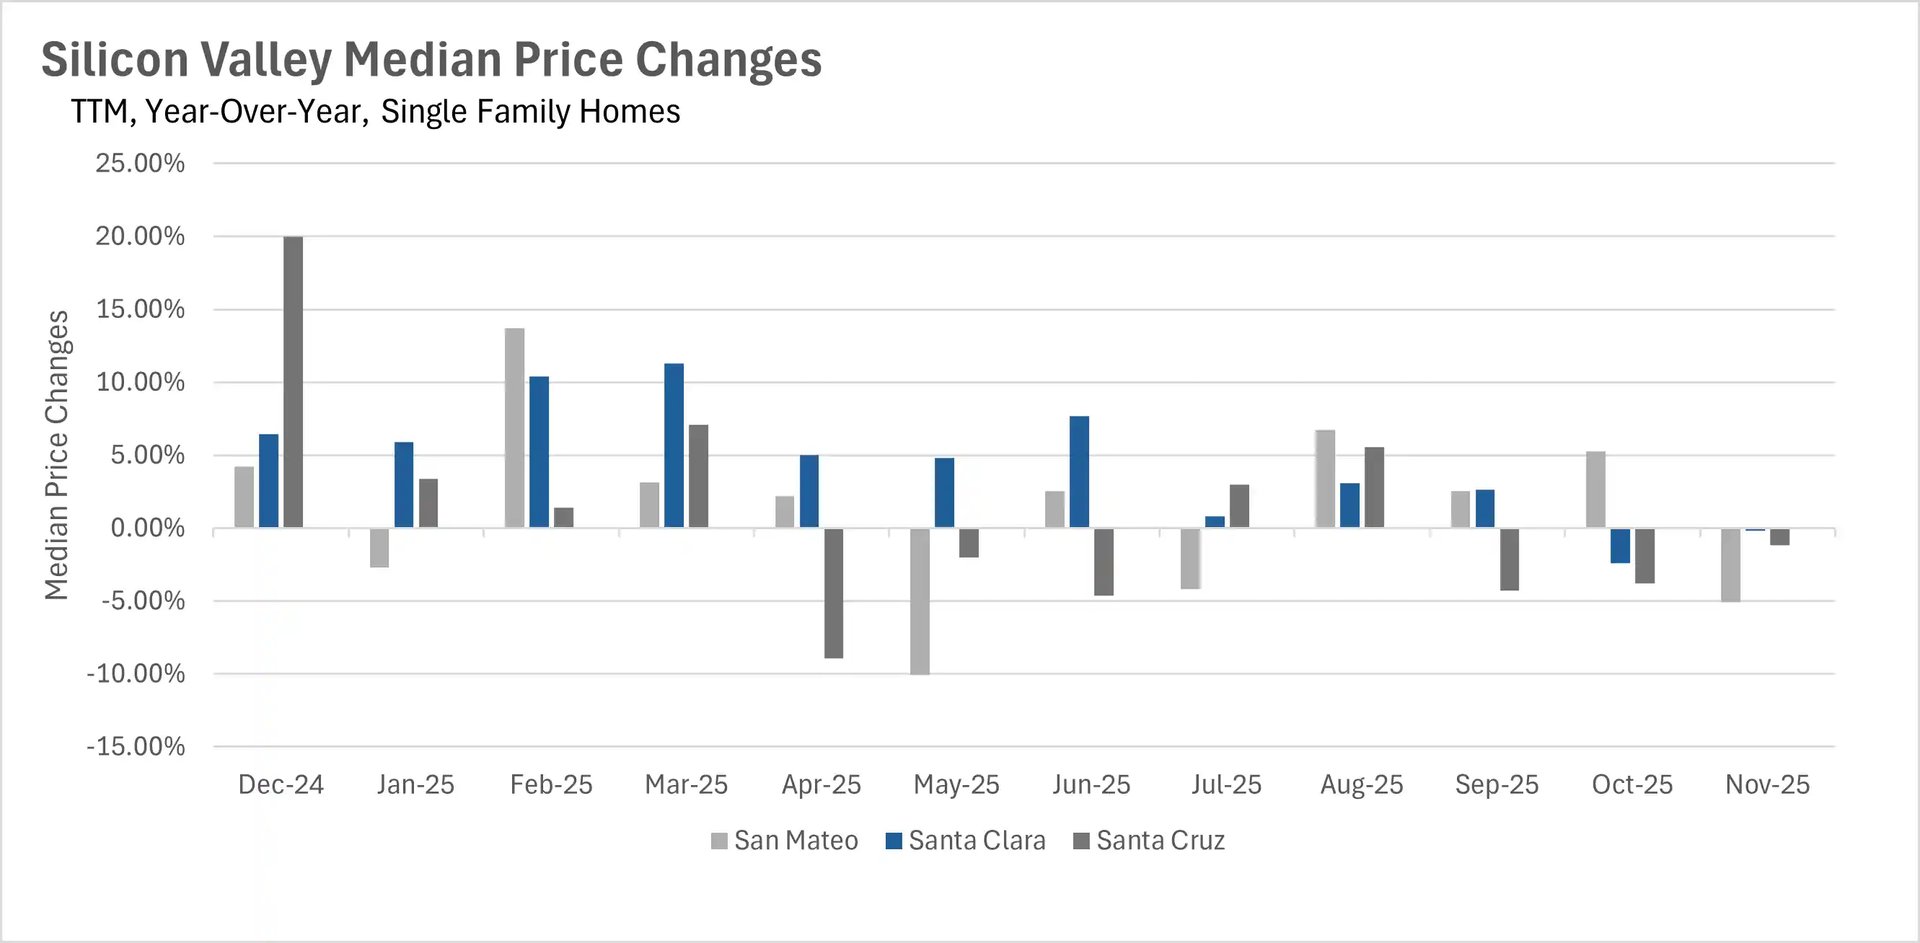
November revealed stark regional disparities in Bay Area pricing trends. San Francisco experienced explosive growth with single-family homes jumping 15.82% year-over-year and condos rising 9.36%, defying typical seasonal patterns with only modest month-over-month declines. Single-family homes are now selling for an extraordinary 16% above asking price - the highest premium in three years. This stands in dramatic contrast to Silicon Valley, which recorded its first across-the-board single-family price declines in over a year, with San Mateo down 5.06%, Santa Cruz falling 1.18%, and Santa Clara declining 0.16%. Silicon Valley condos also weakened with San Mateo and Santa Clara down 4.90% and 3.28% respectively, though Santa Cruz bucked the trend with a 5.17% increase.
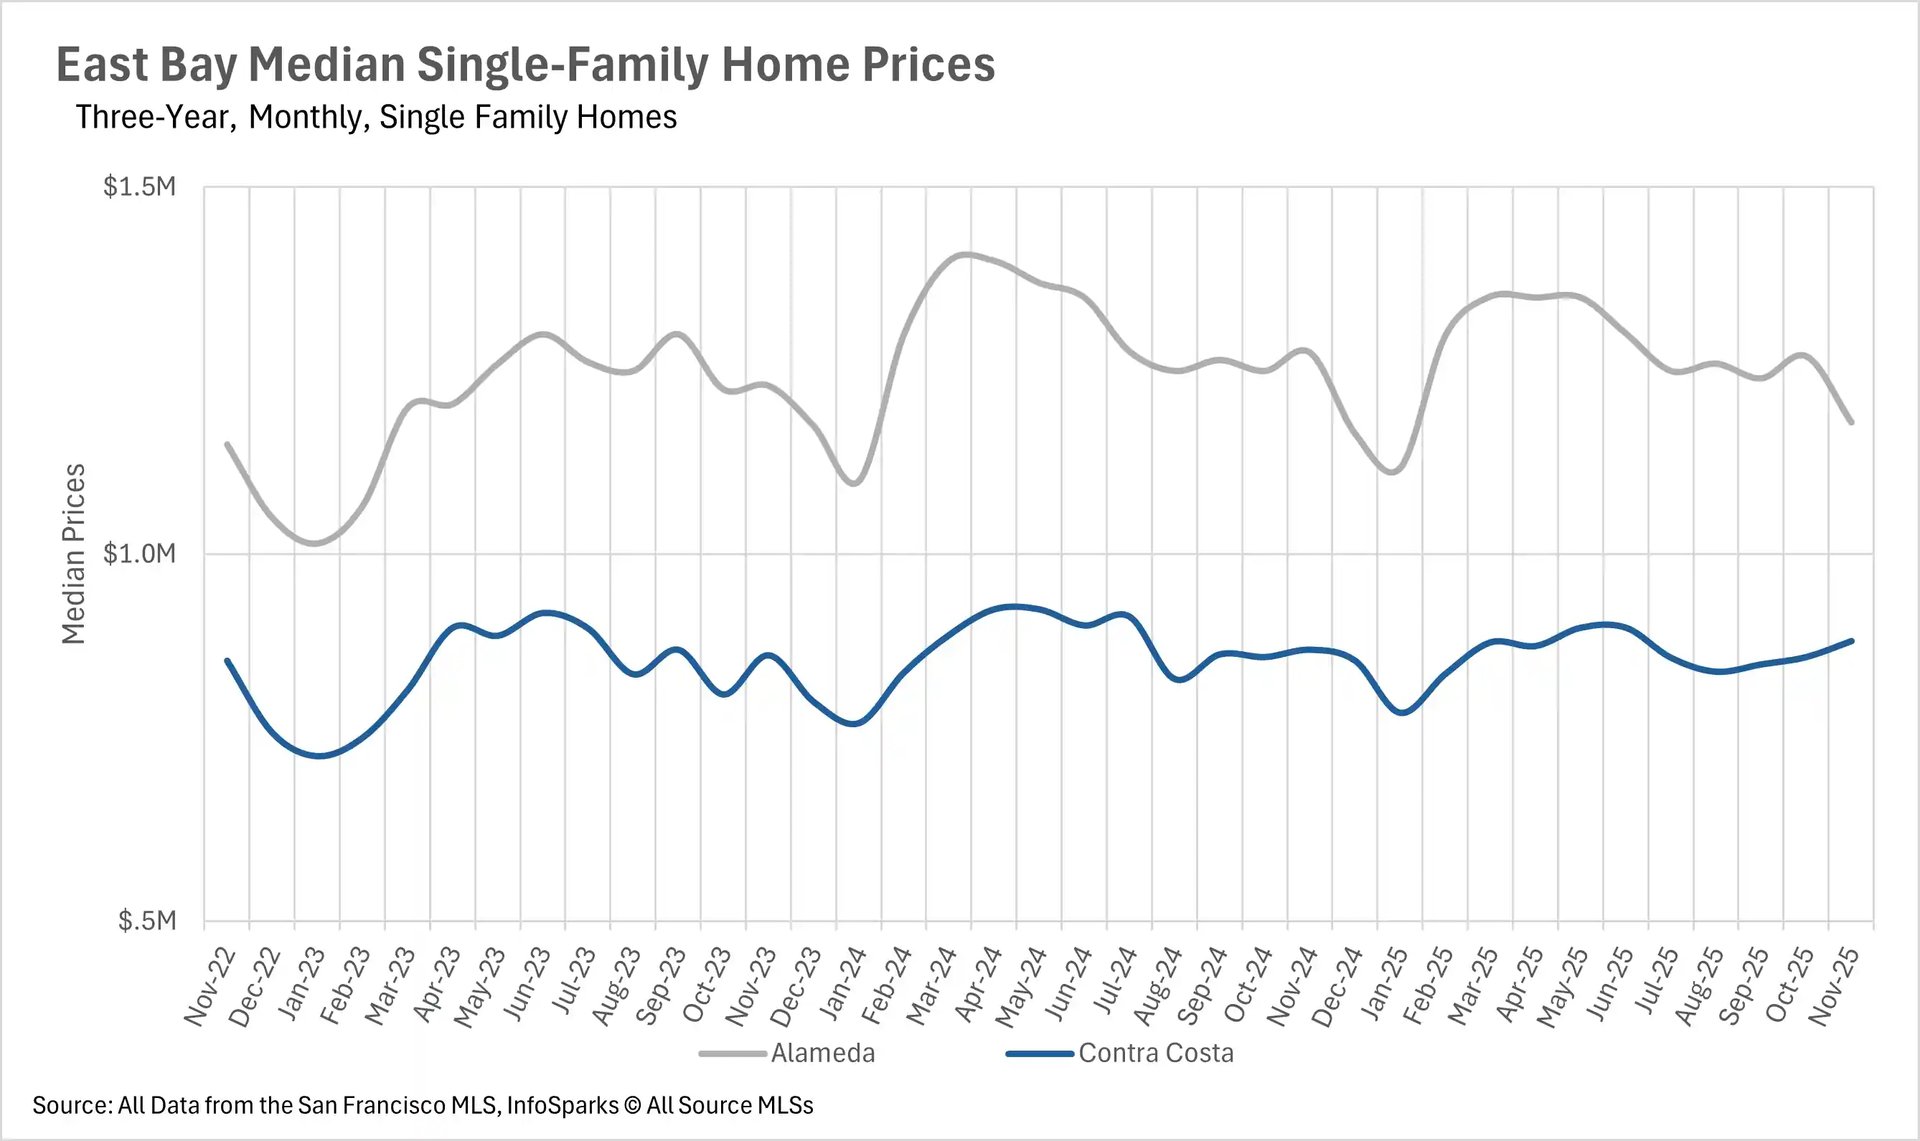
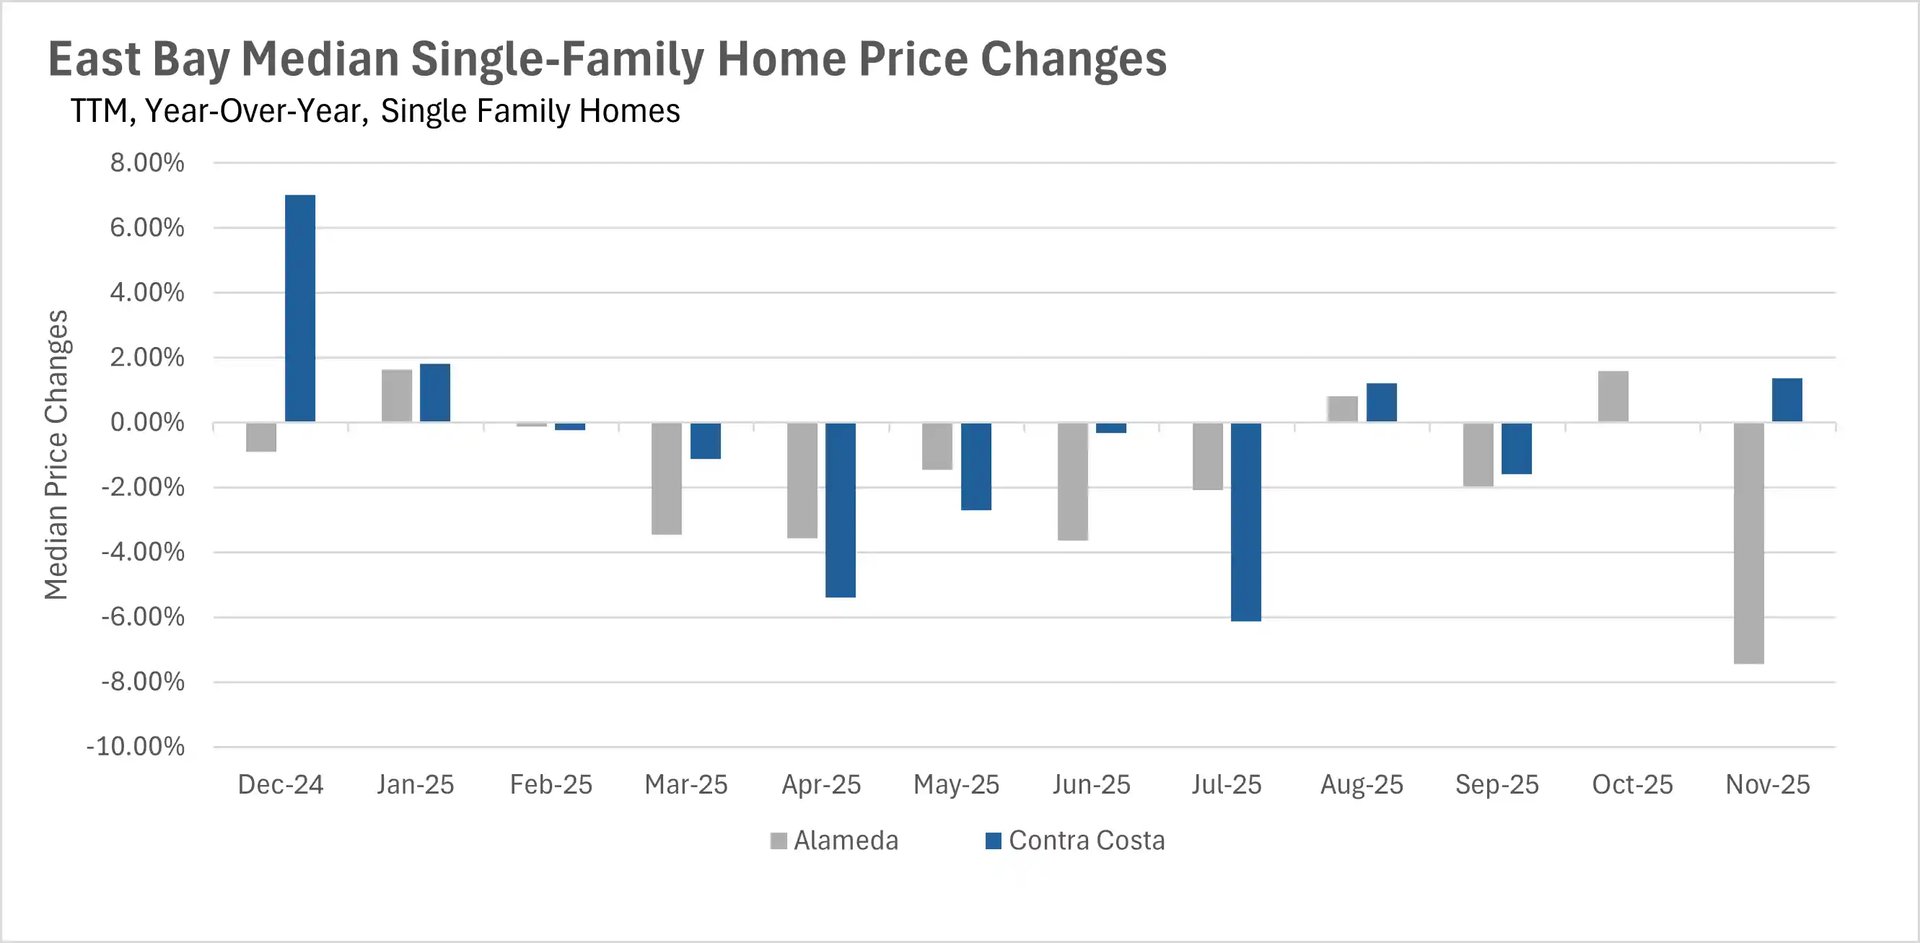
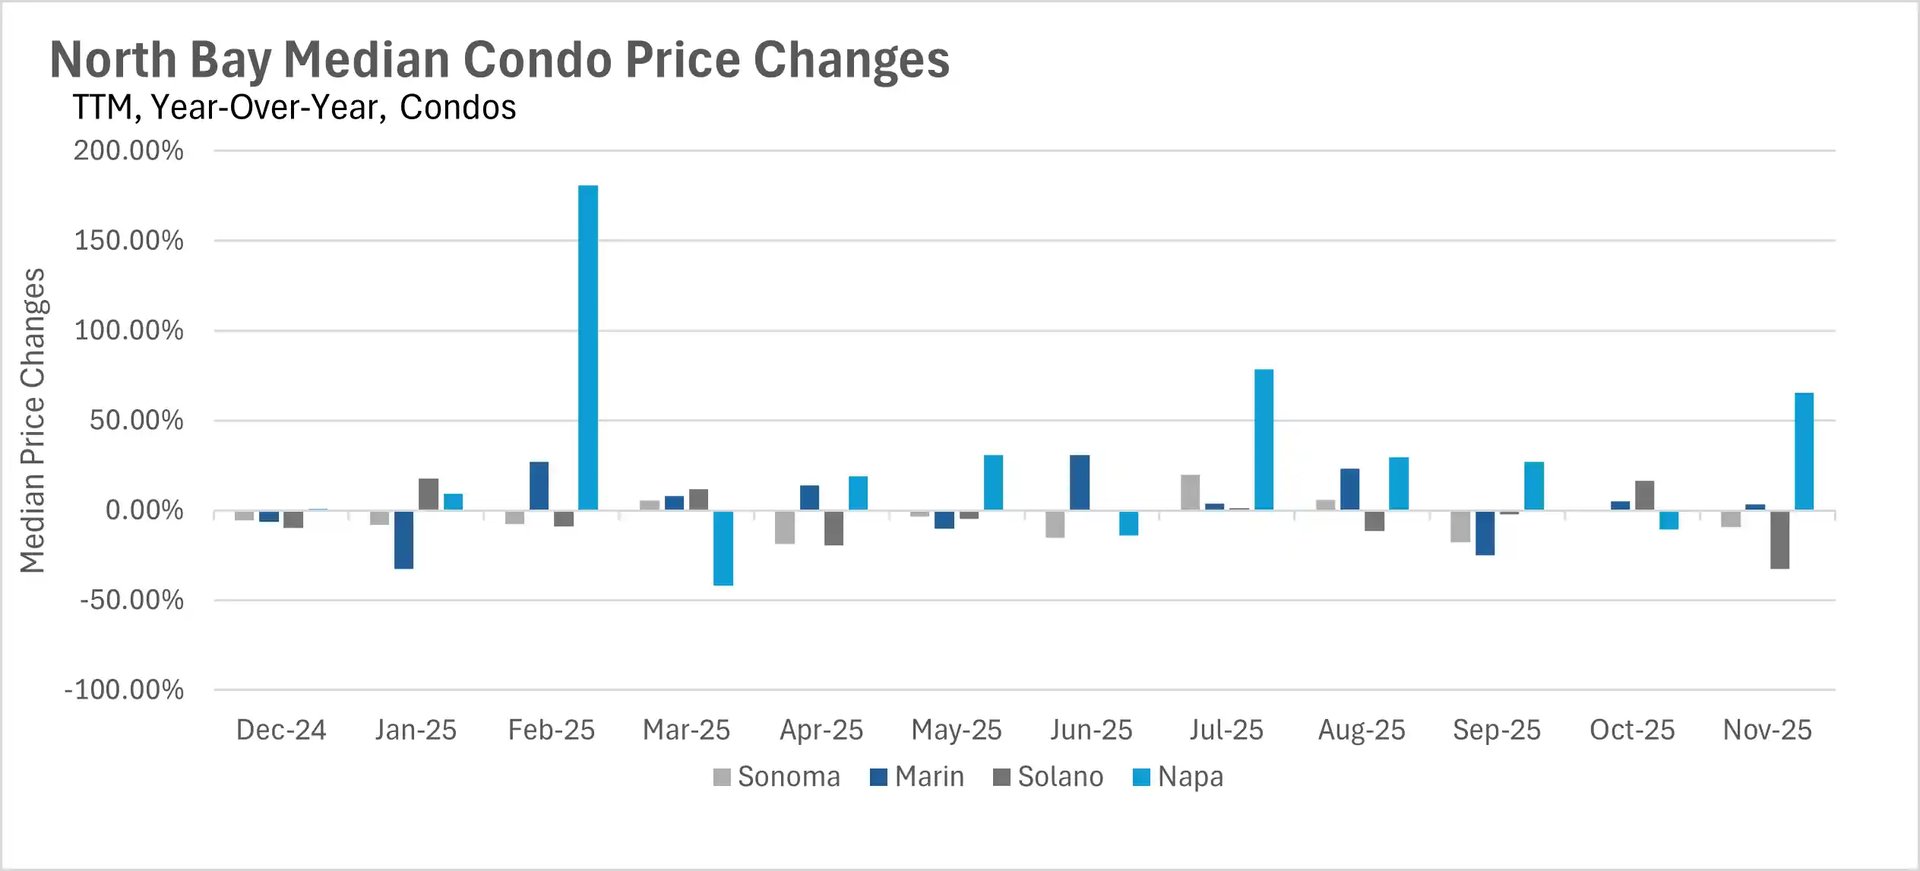
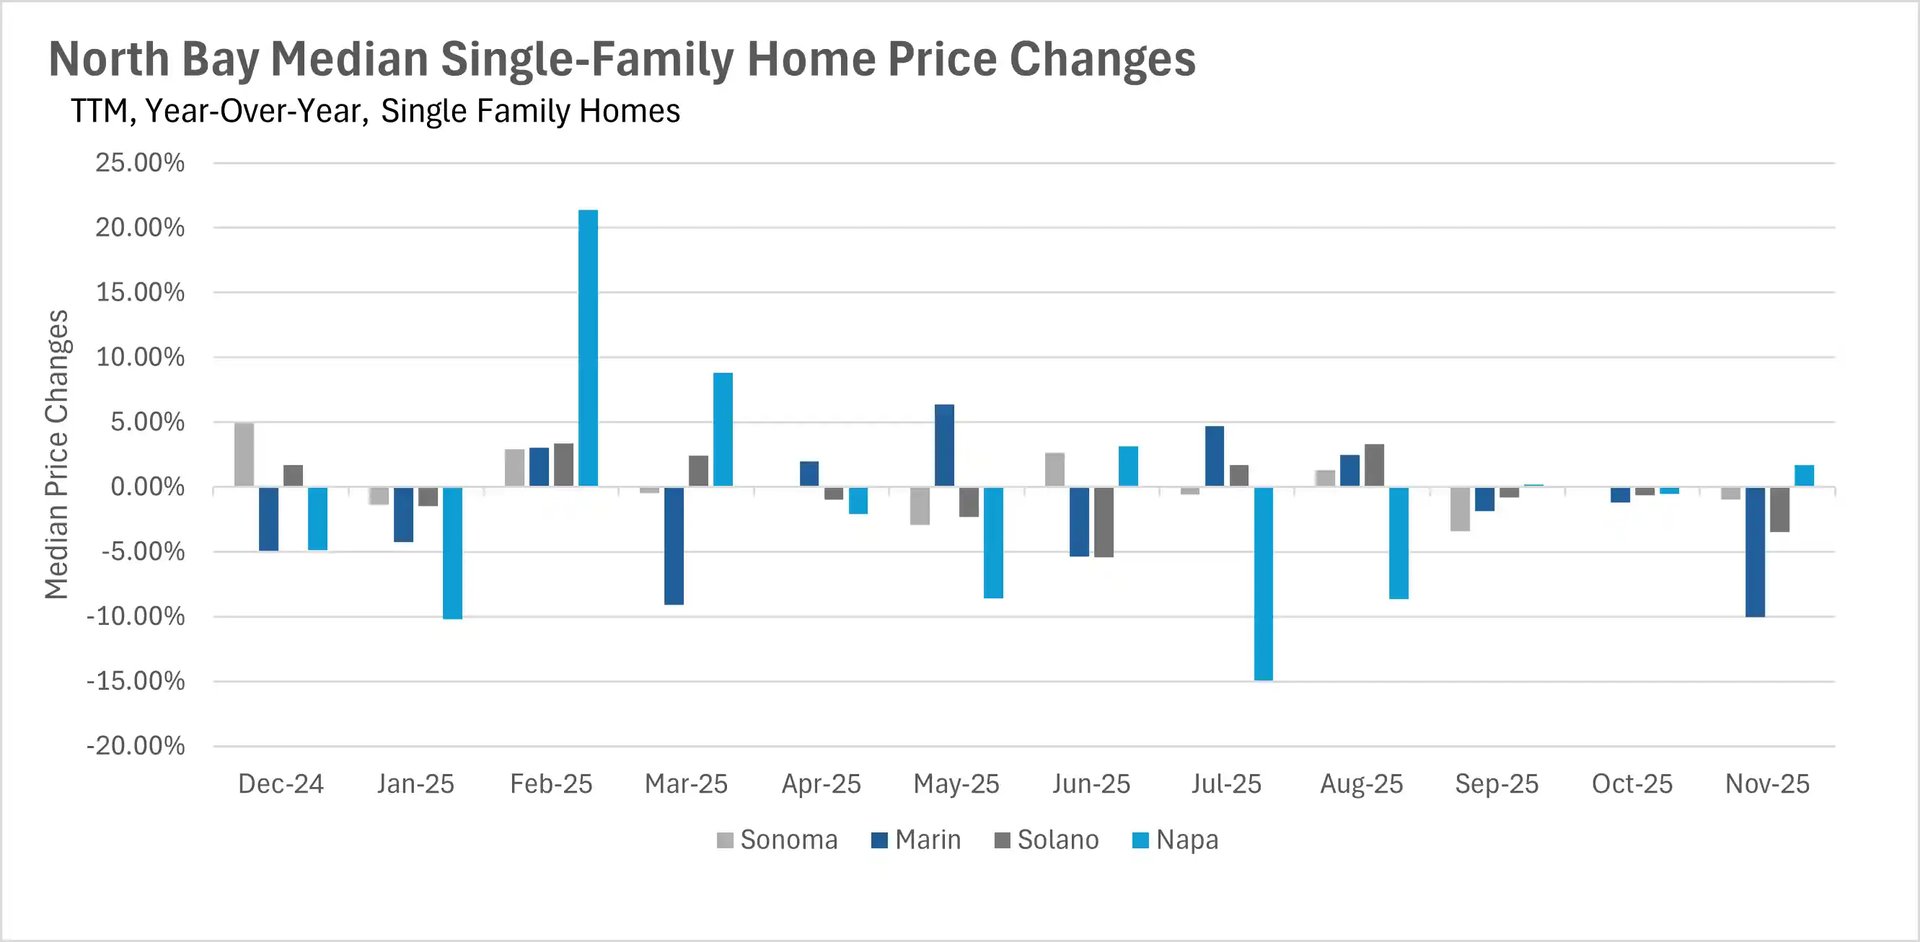
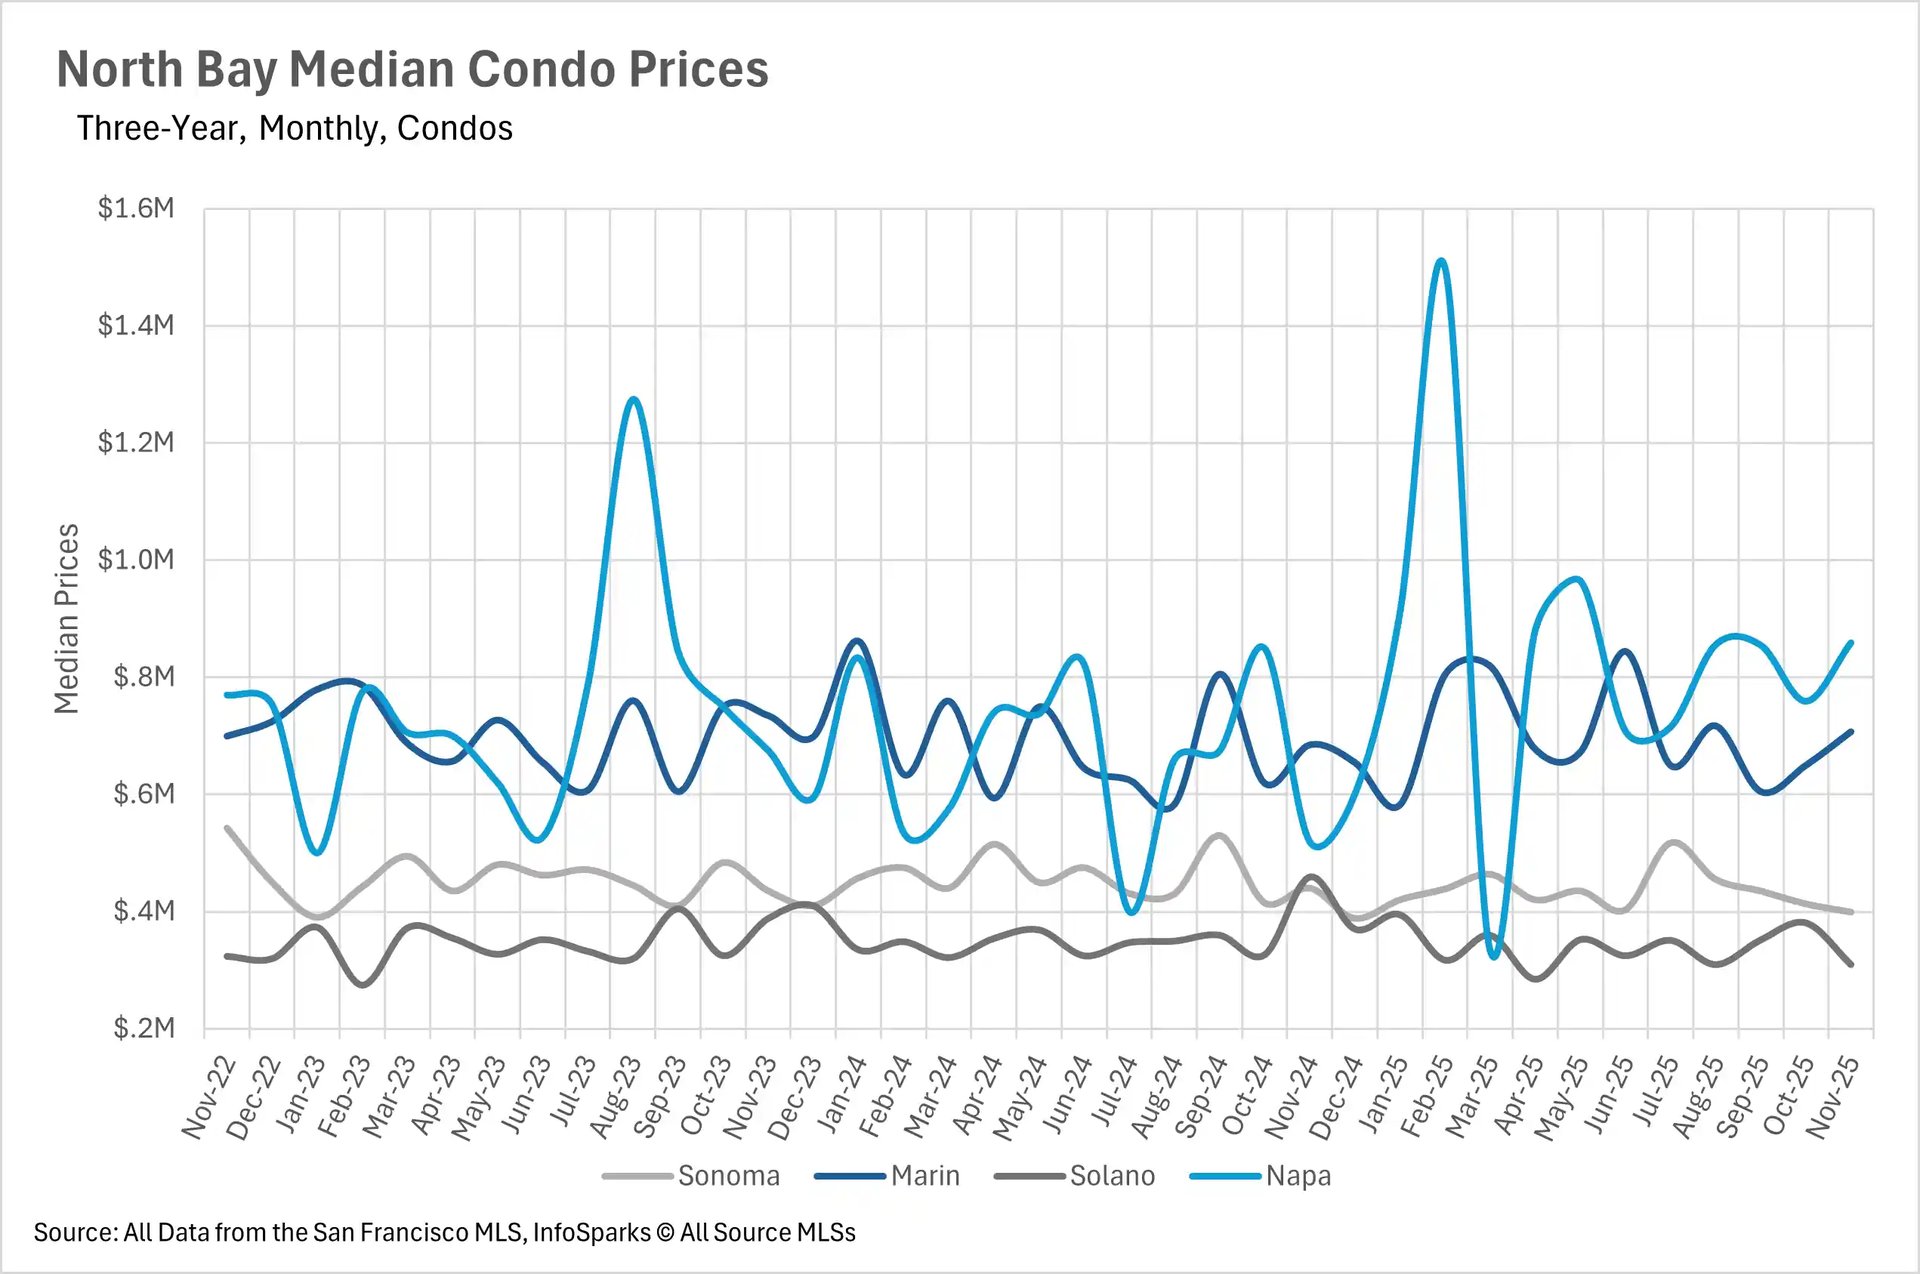
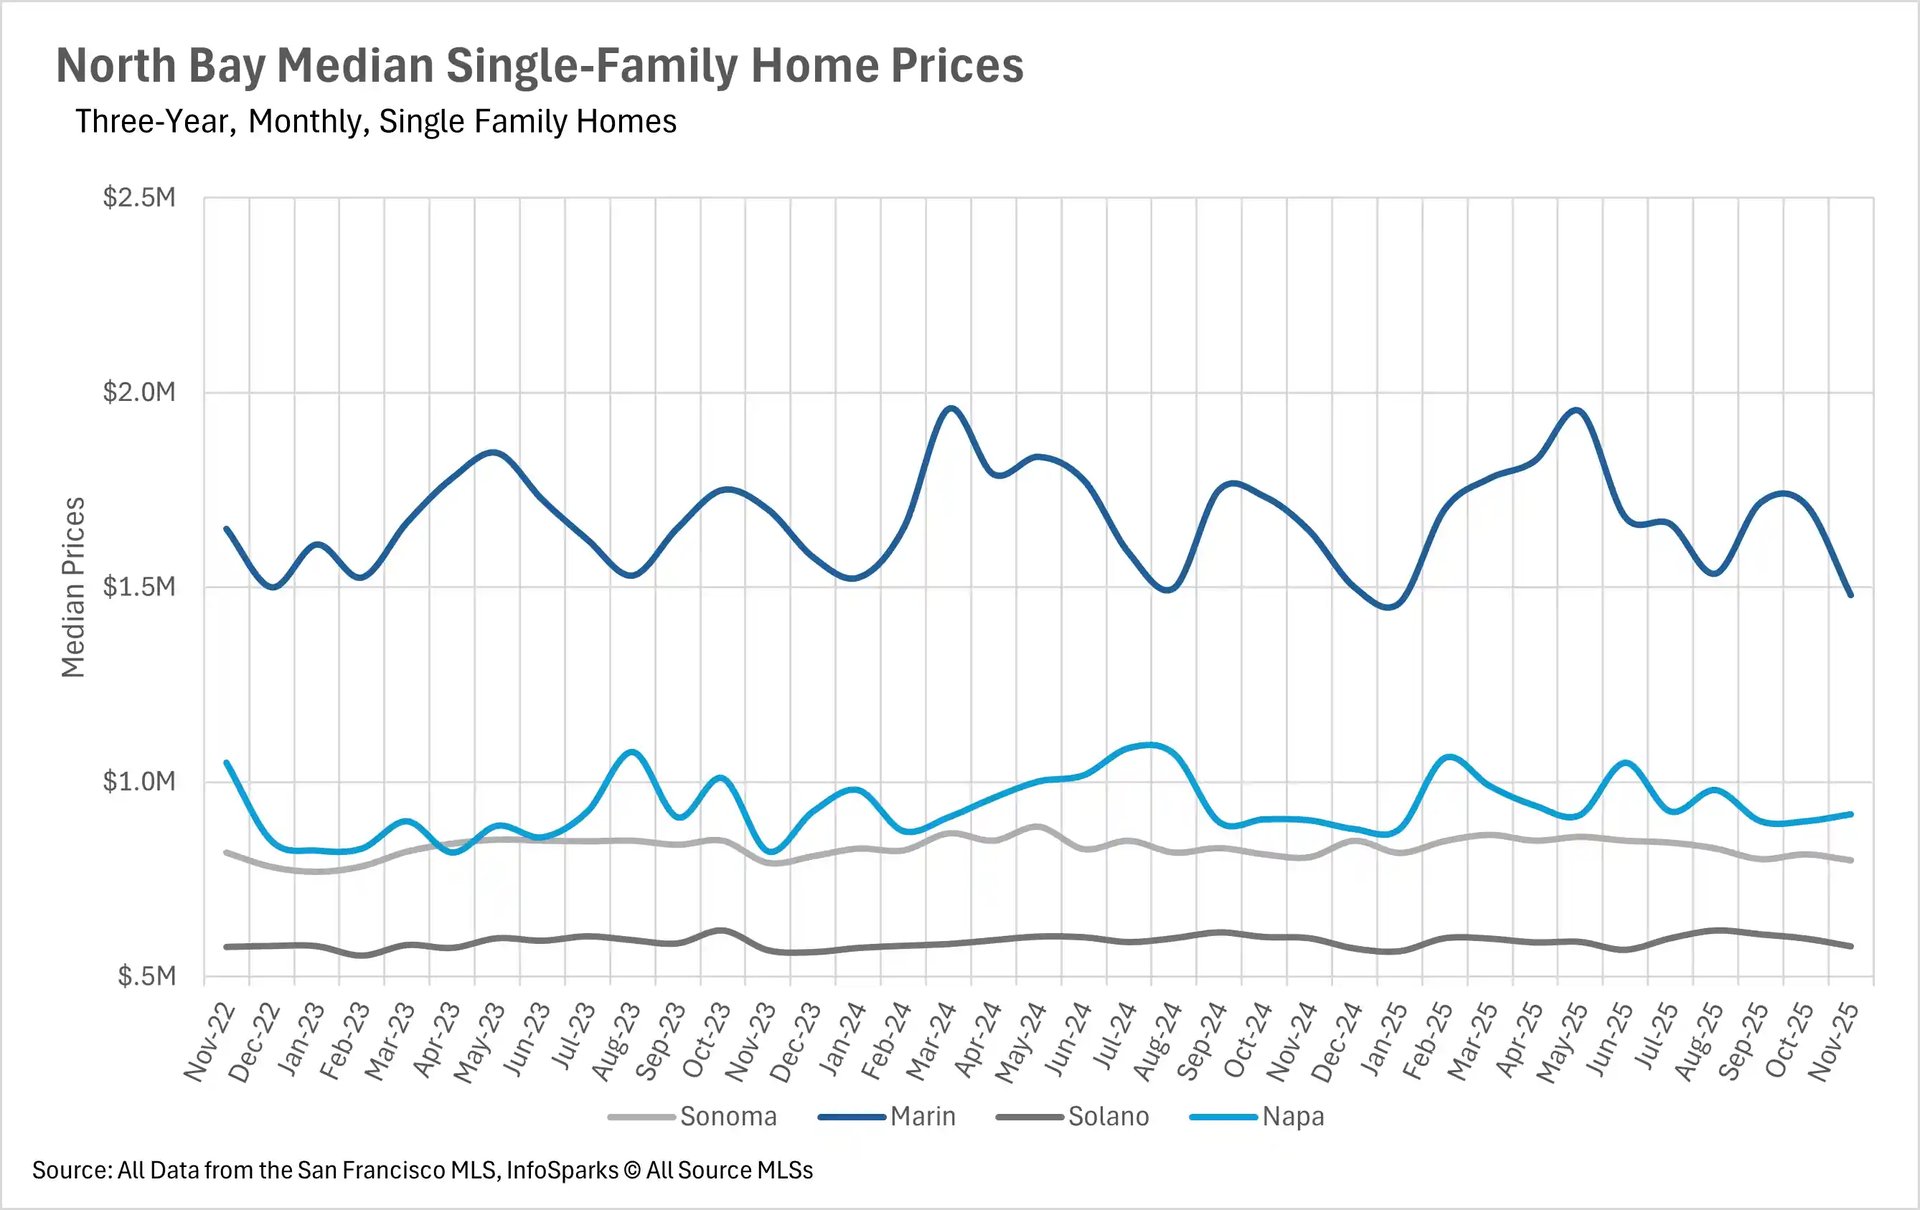
The East Bay displayed significant volatility, with Alameda County single-family homes plummeting 7.45% year-over-year while Contra Costa managed a modest 1.36% gain. East Bay condos declined across the board by 4.98% in Alameda and 8.14% in Contra Costa. The North Bay showed more muted movements overall, with single-family homes in Sonoma and Napa relatively stable at -0.99% and +1.72% respectively, though Marin County experienced a substantial 10.03% decline and Solano dropped 3.50%. North Bay condos demonstrated extreme volatility with Solano collapsing 32.46% while Napa surged an extraordinary 65.35%.
Dramatic inventory contraction intensifies across most regions
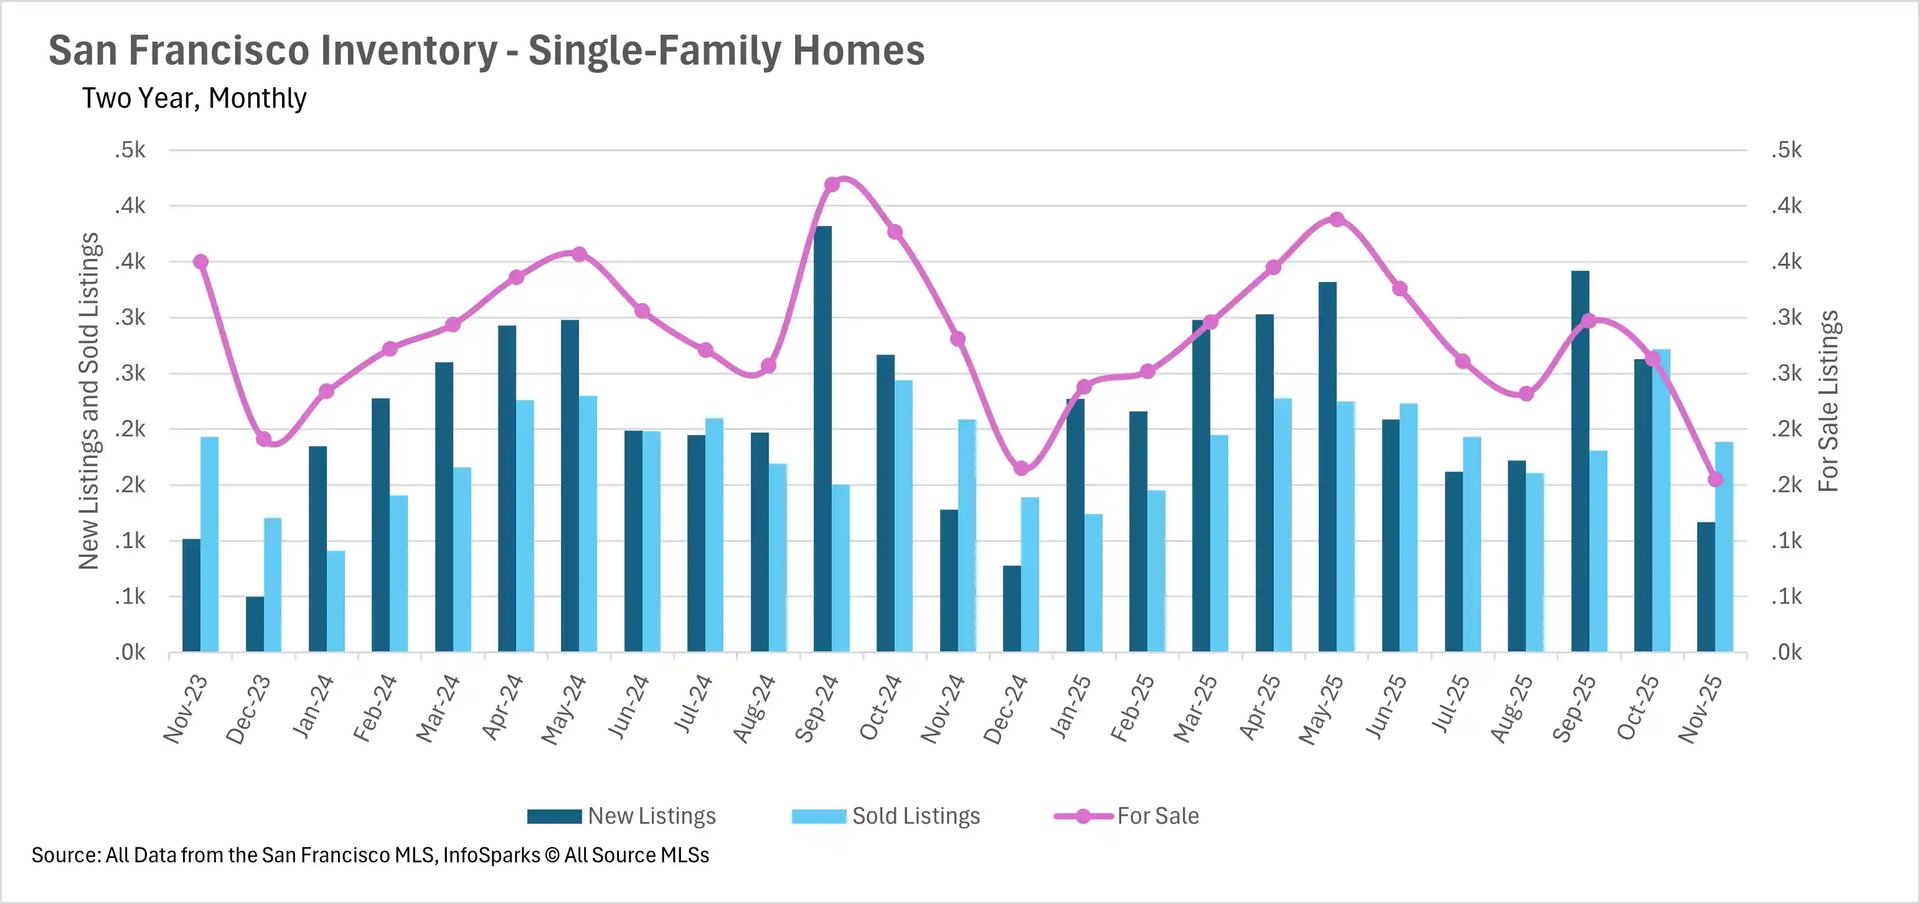
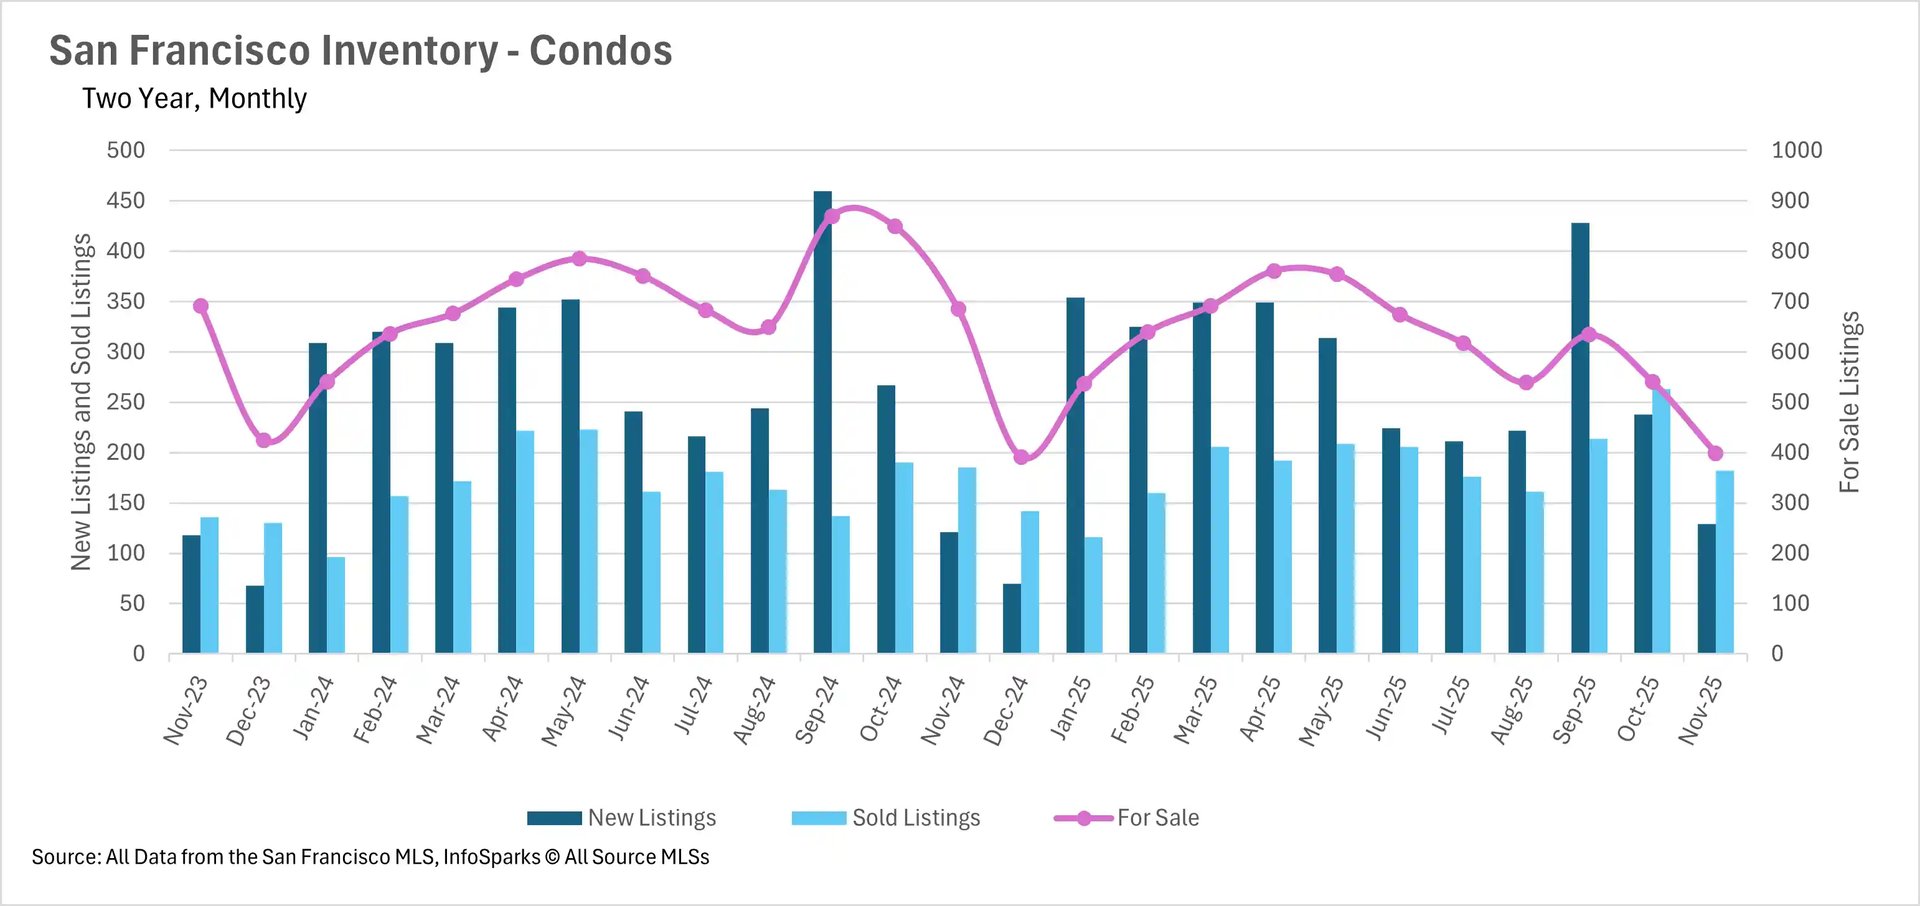
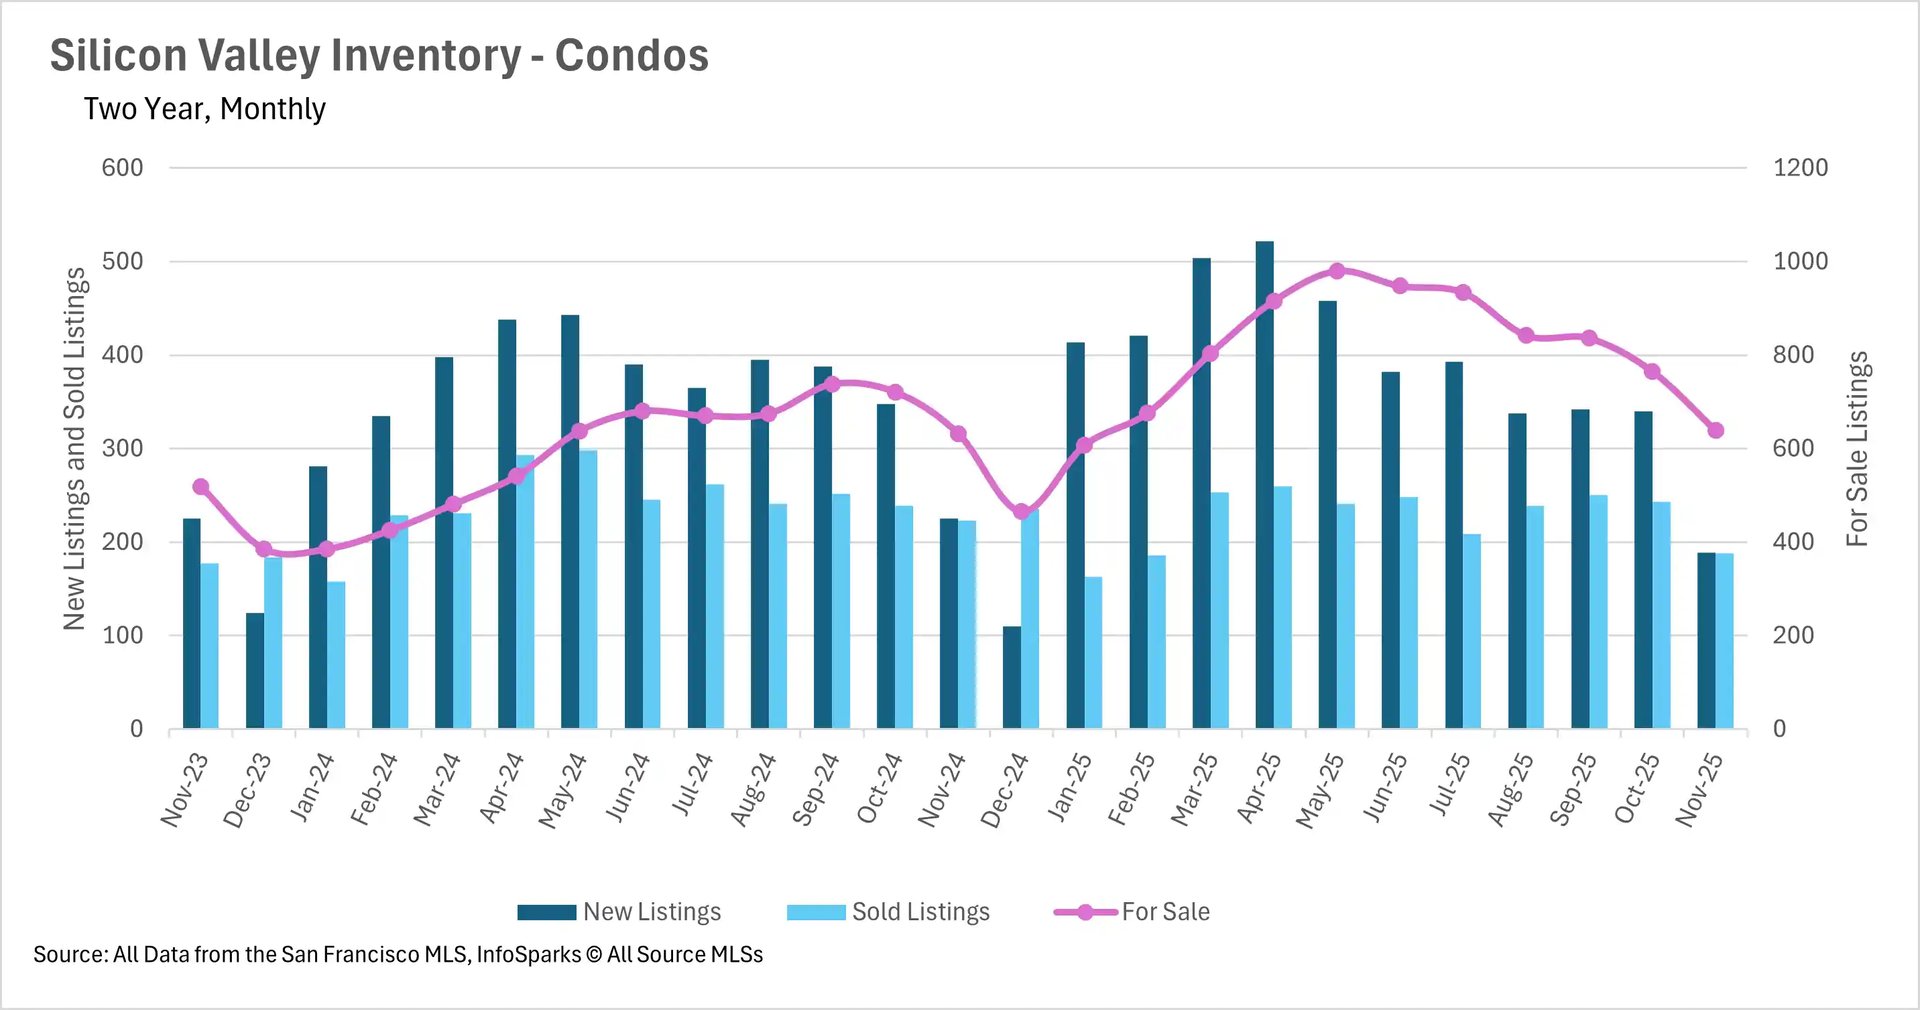
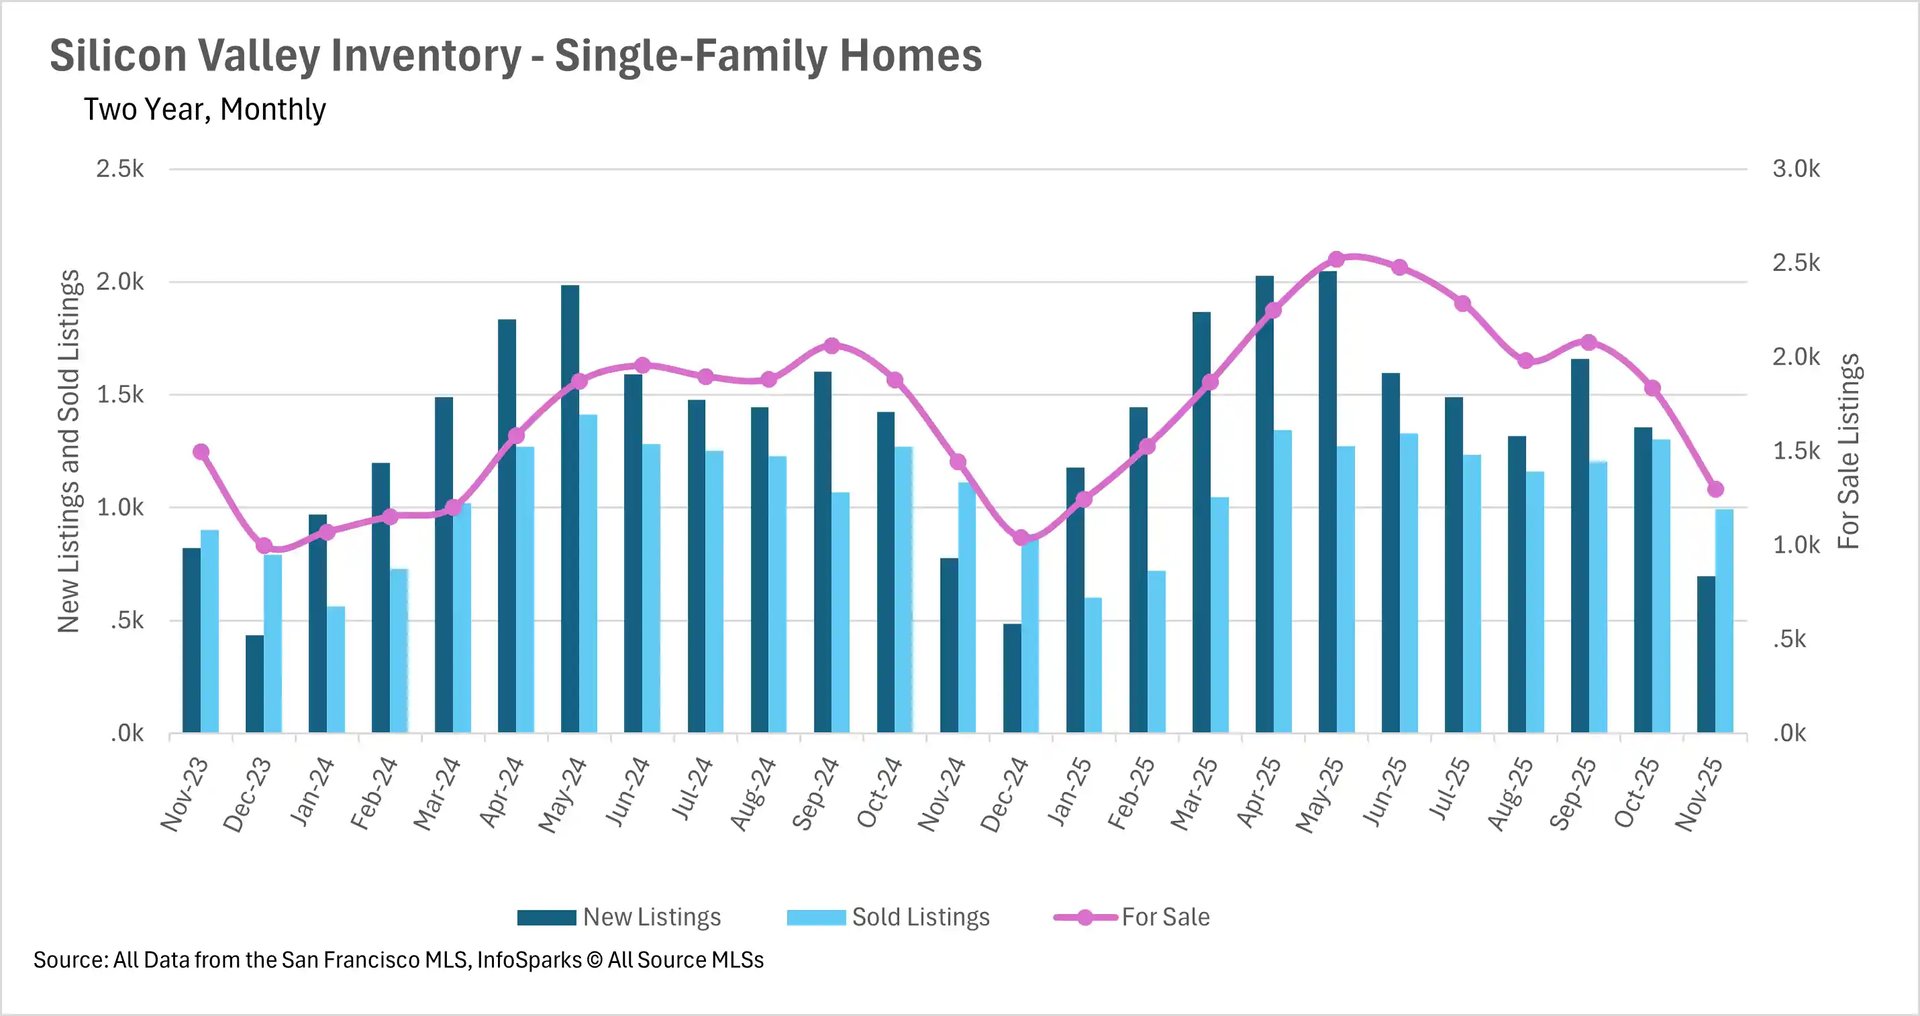
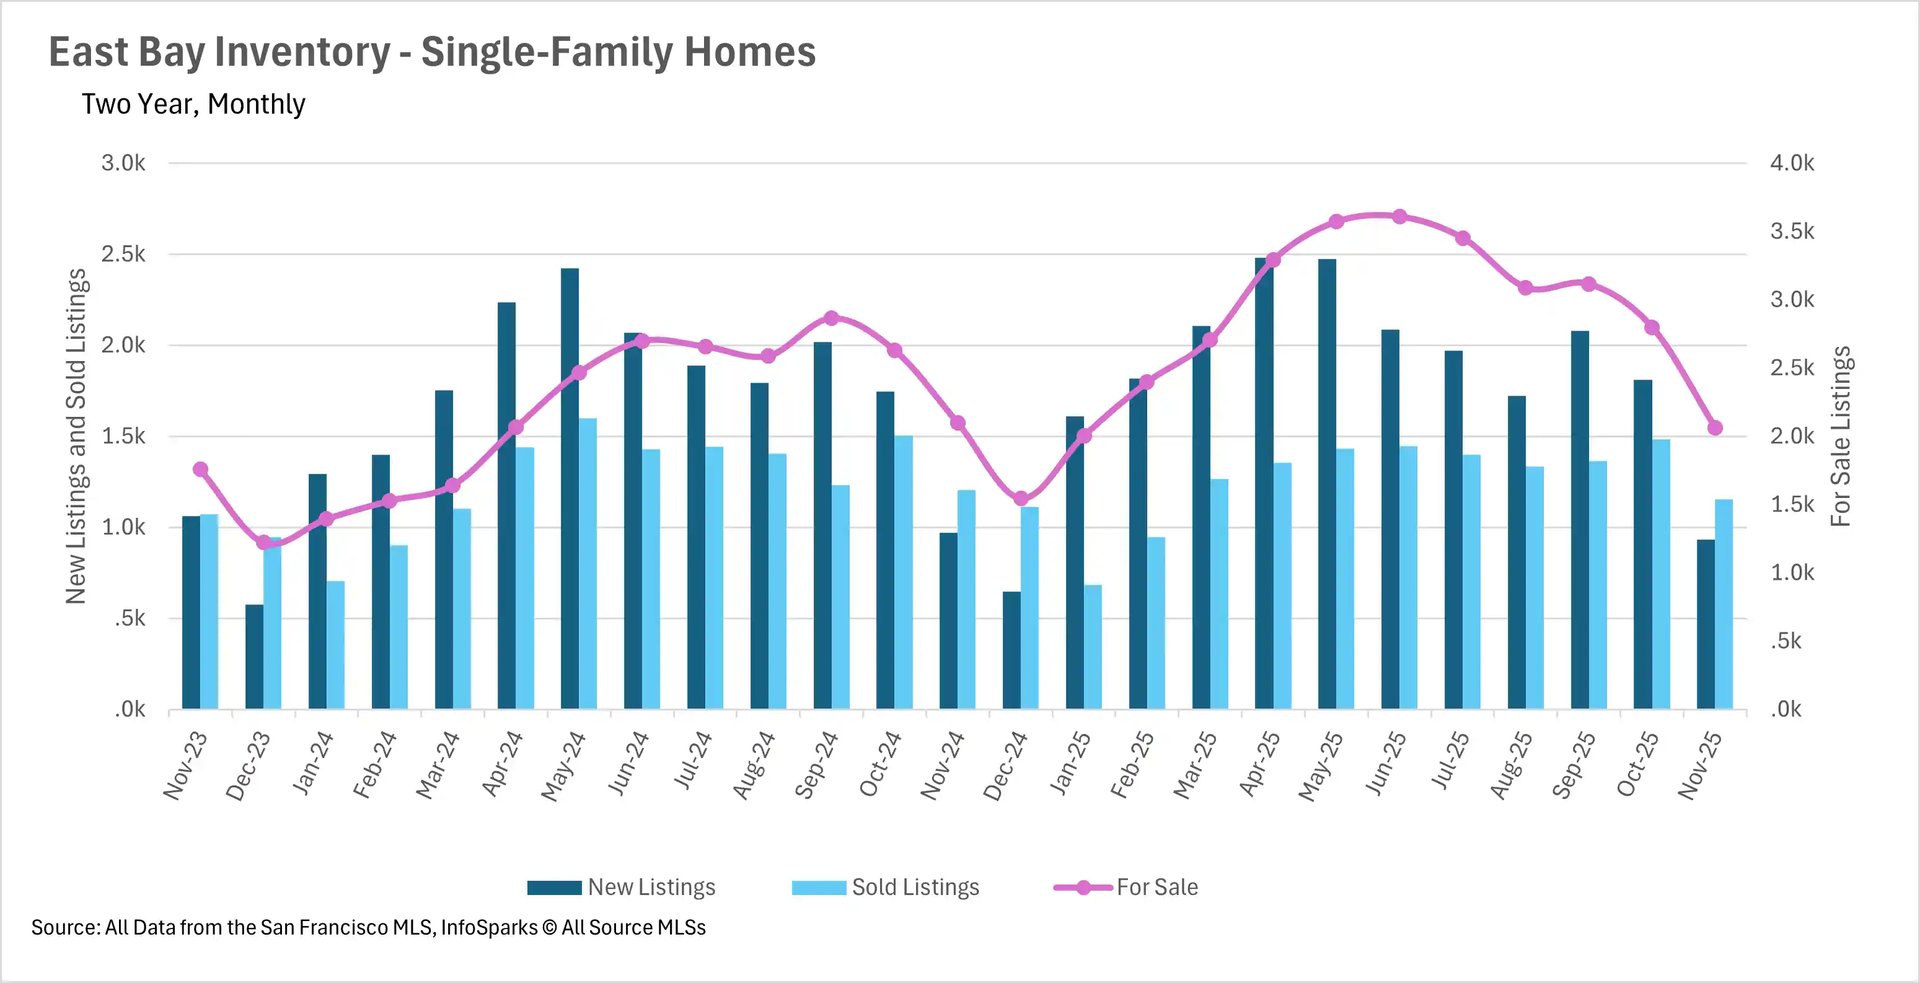
November marked an extraordinary inventory contraction across the Bay Area, with most regions experiencing steep month-over-month declines as the market entered its seasonal winter slowdown. San Francisco led with the most severe contraction, as total inventory reached just 553 homes for sale - the lowest level in three years. Single-family inventory crashed 44.84% year-over-year while condos fell 41.90%, creating unprecedented supply constraints. Silicon Valley's single-family market experienced a dramatic "overcorrection," with inventory plunging nearly 30% month-over-month and 10% year-over-year, approaching the extreme lows last seen in December 2024. The condo market showed more stability with inventory effectively flat at just 1.11% above last year.
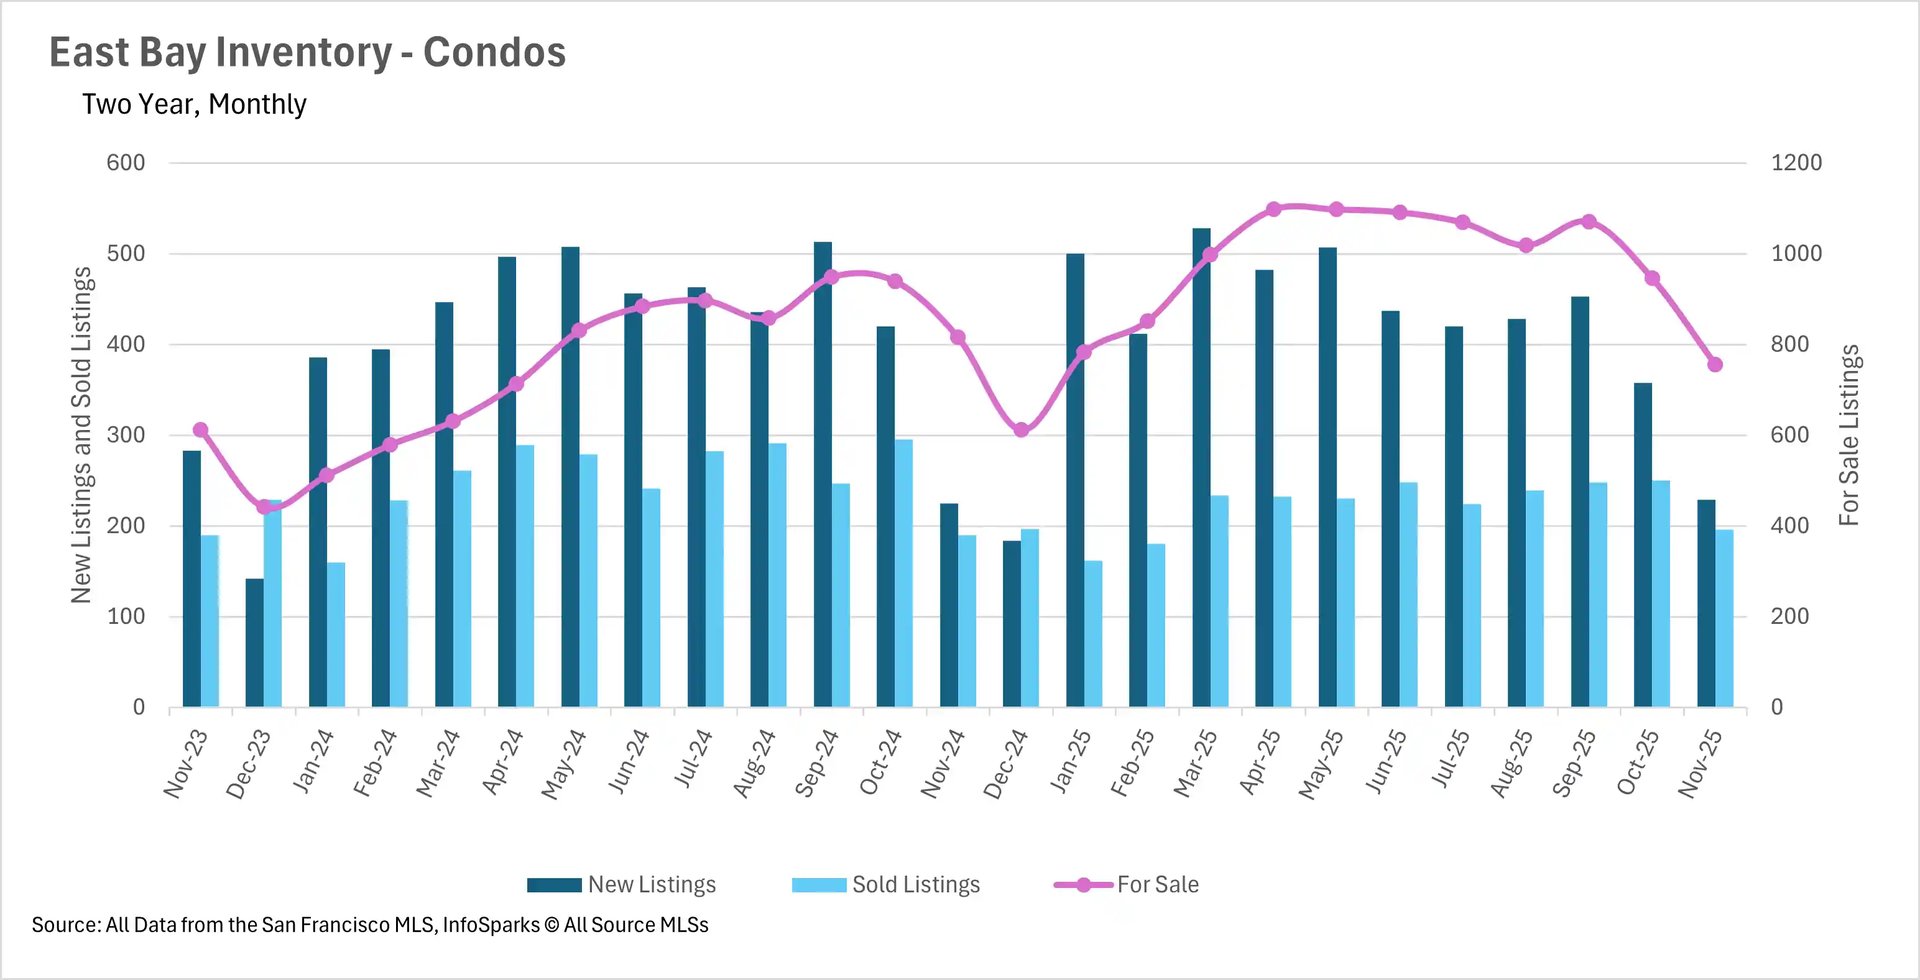
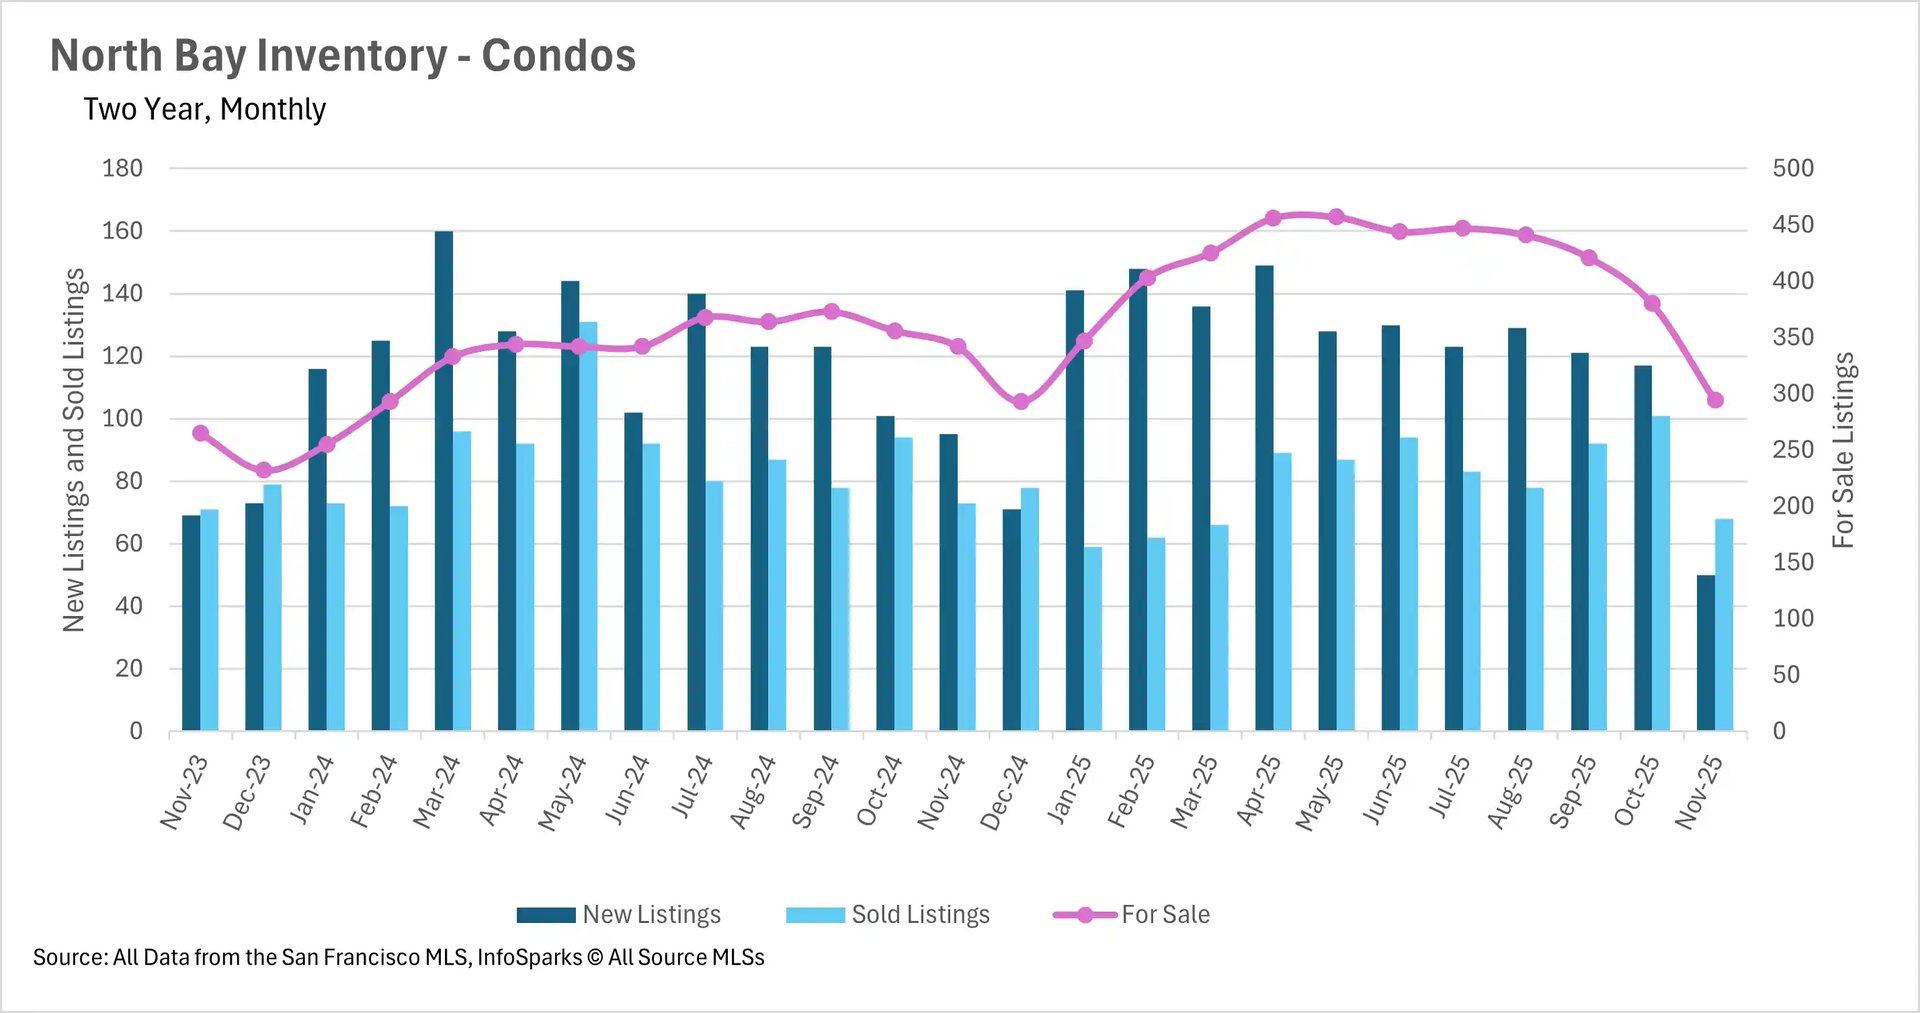
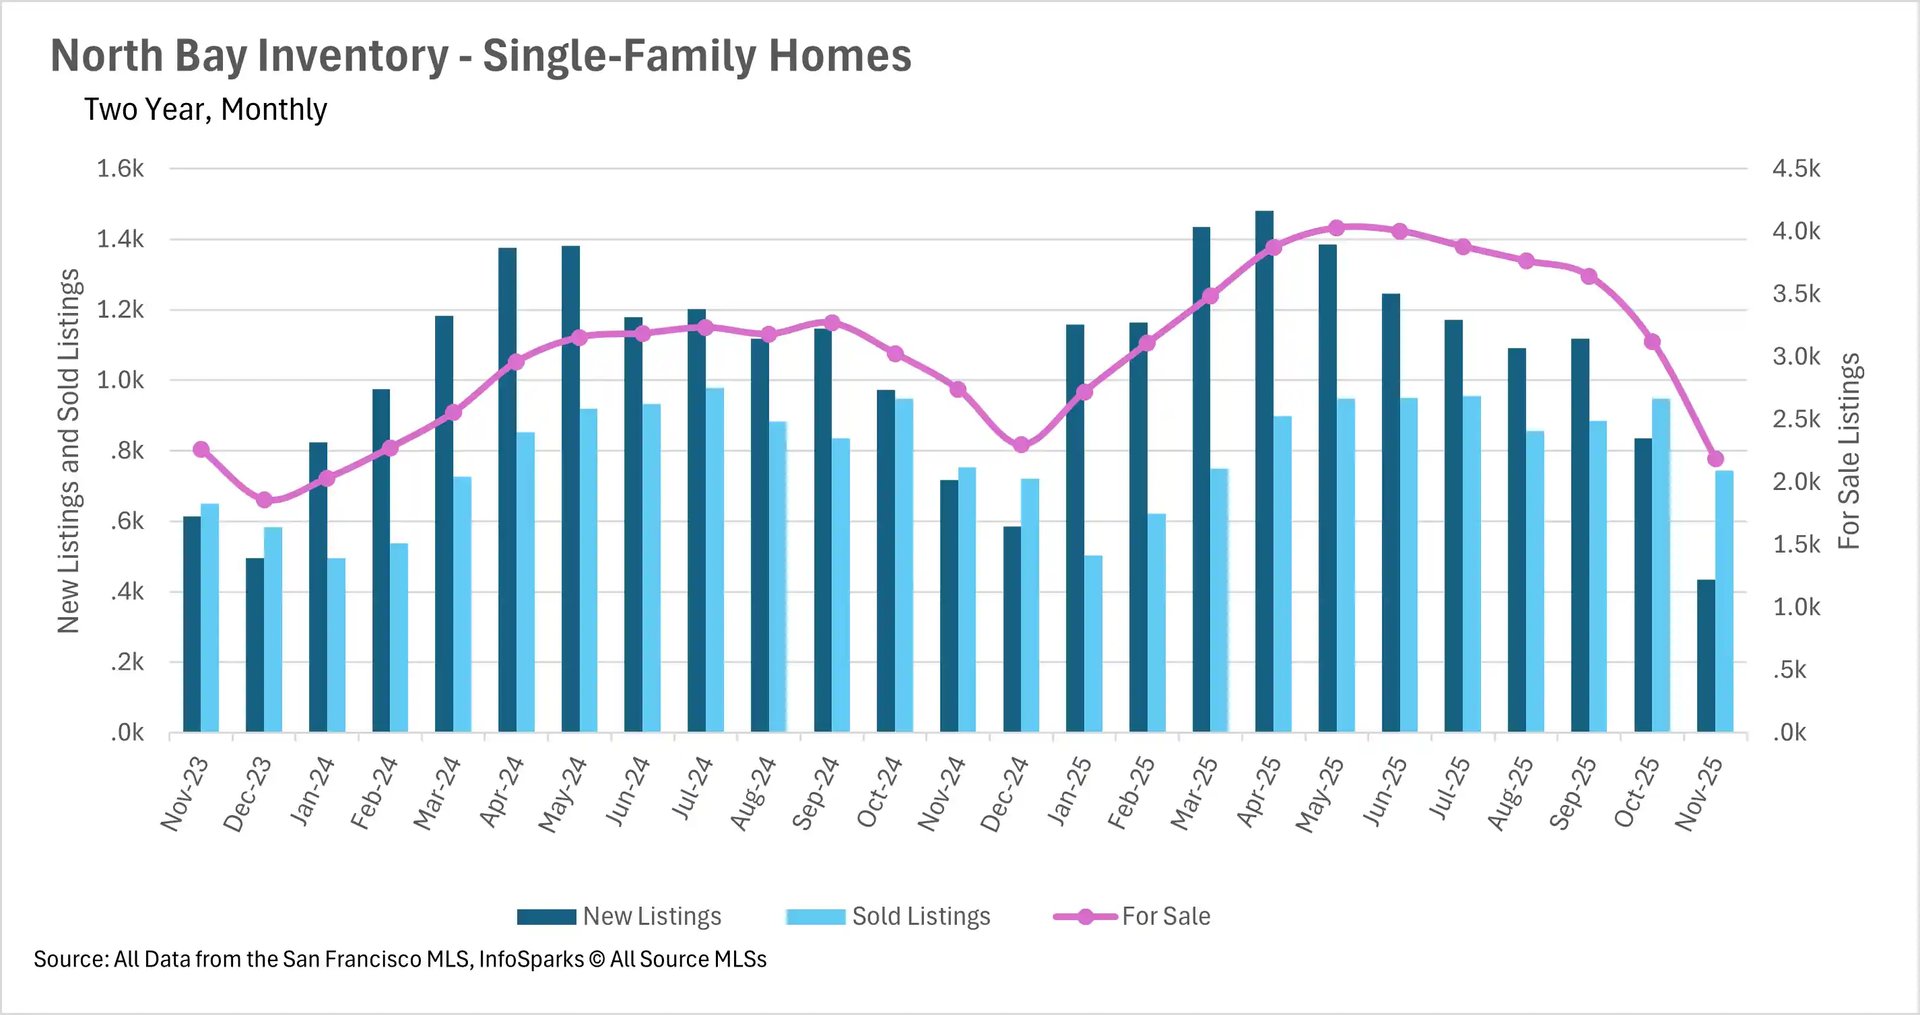
The North Bay saw similarly dramatic declines with single-family inventory dropping 29.93% month-over-month and 20.14% year-over-year, while condos fell 22.63% month-over-month and 14.04% year-over-year. Notably, North Bay inventory levels are now lower than December 2024, suggesting even steeper declines may be forthcoming. The East Bay stood as the lone exception to this trend, showing remarkable resilience with inventory levels roughly flat year-over-year despite the dramatic corrections seen elsewhere. This stability is particularly noteworthy given the substantial inventory buildups the region experienced during late spring and early summer.
Market velocity shows extreme divergence between accelerating and decelerating regions
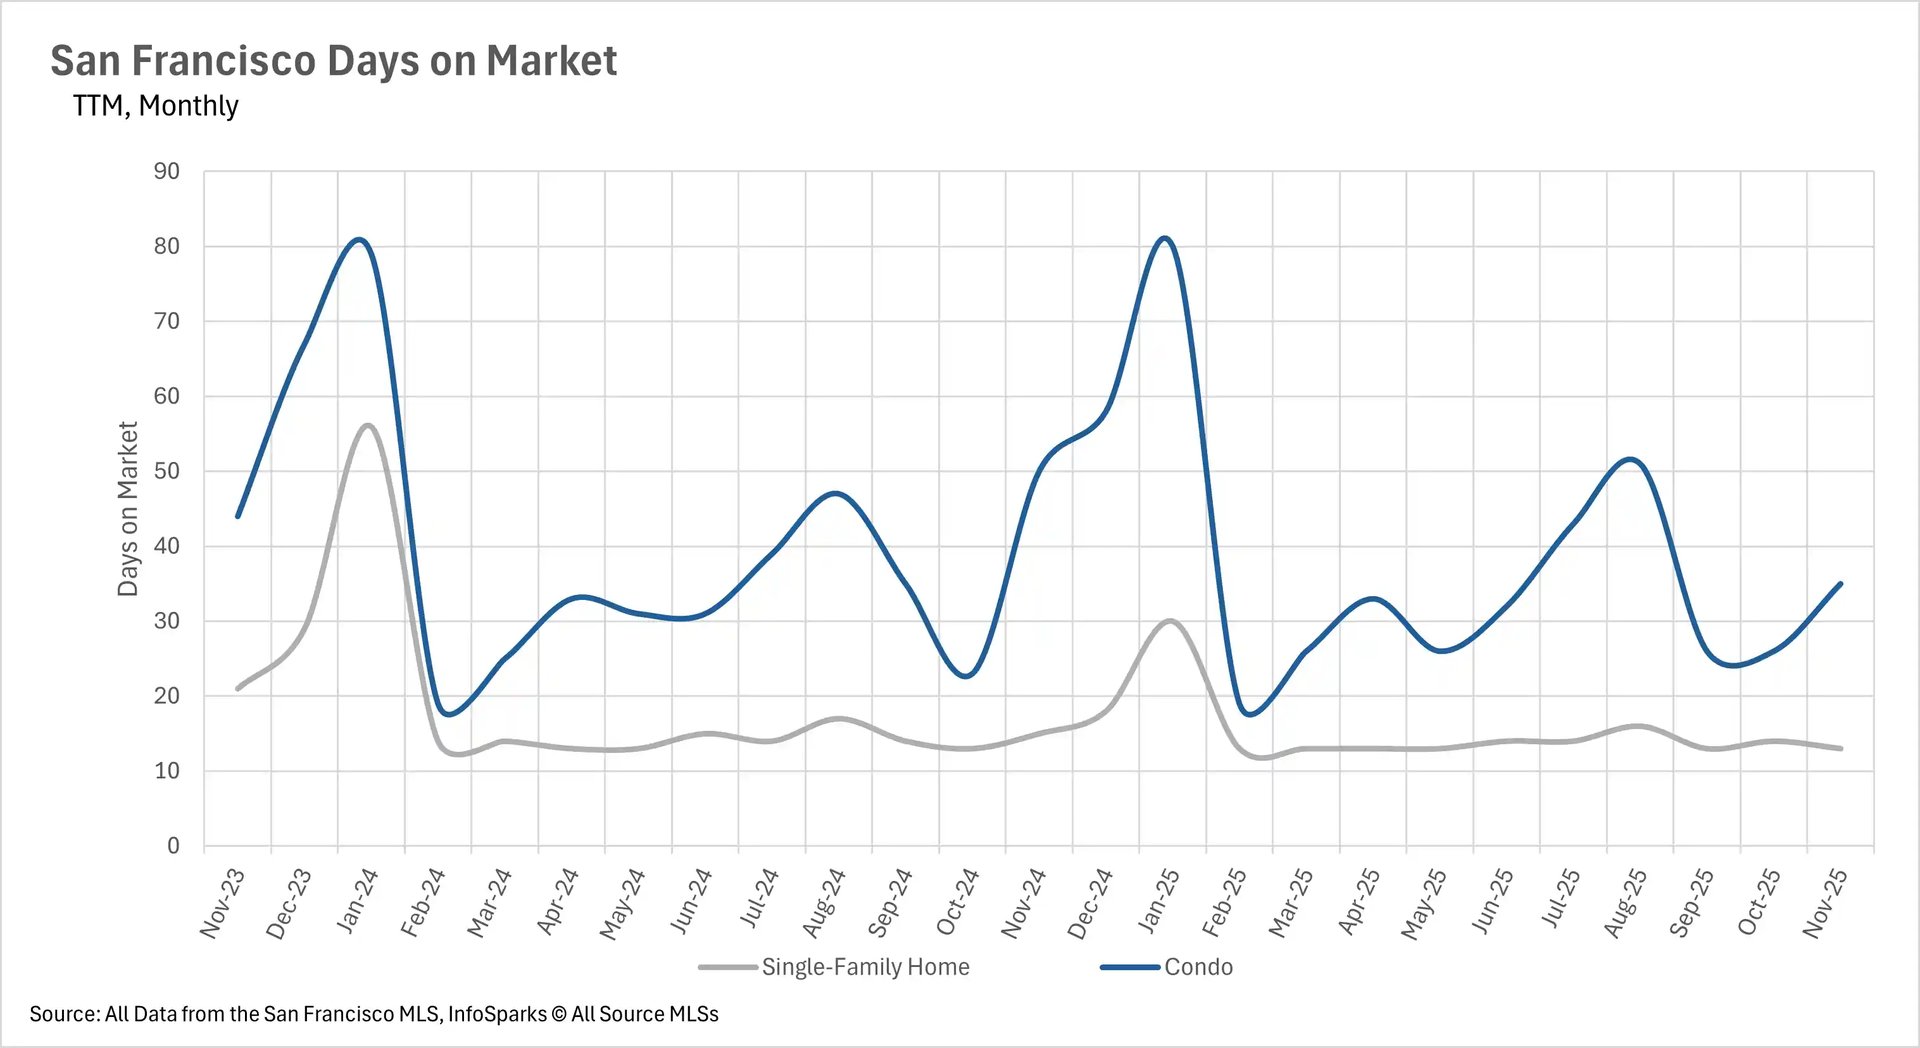
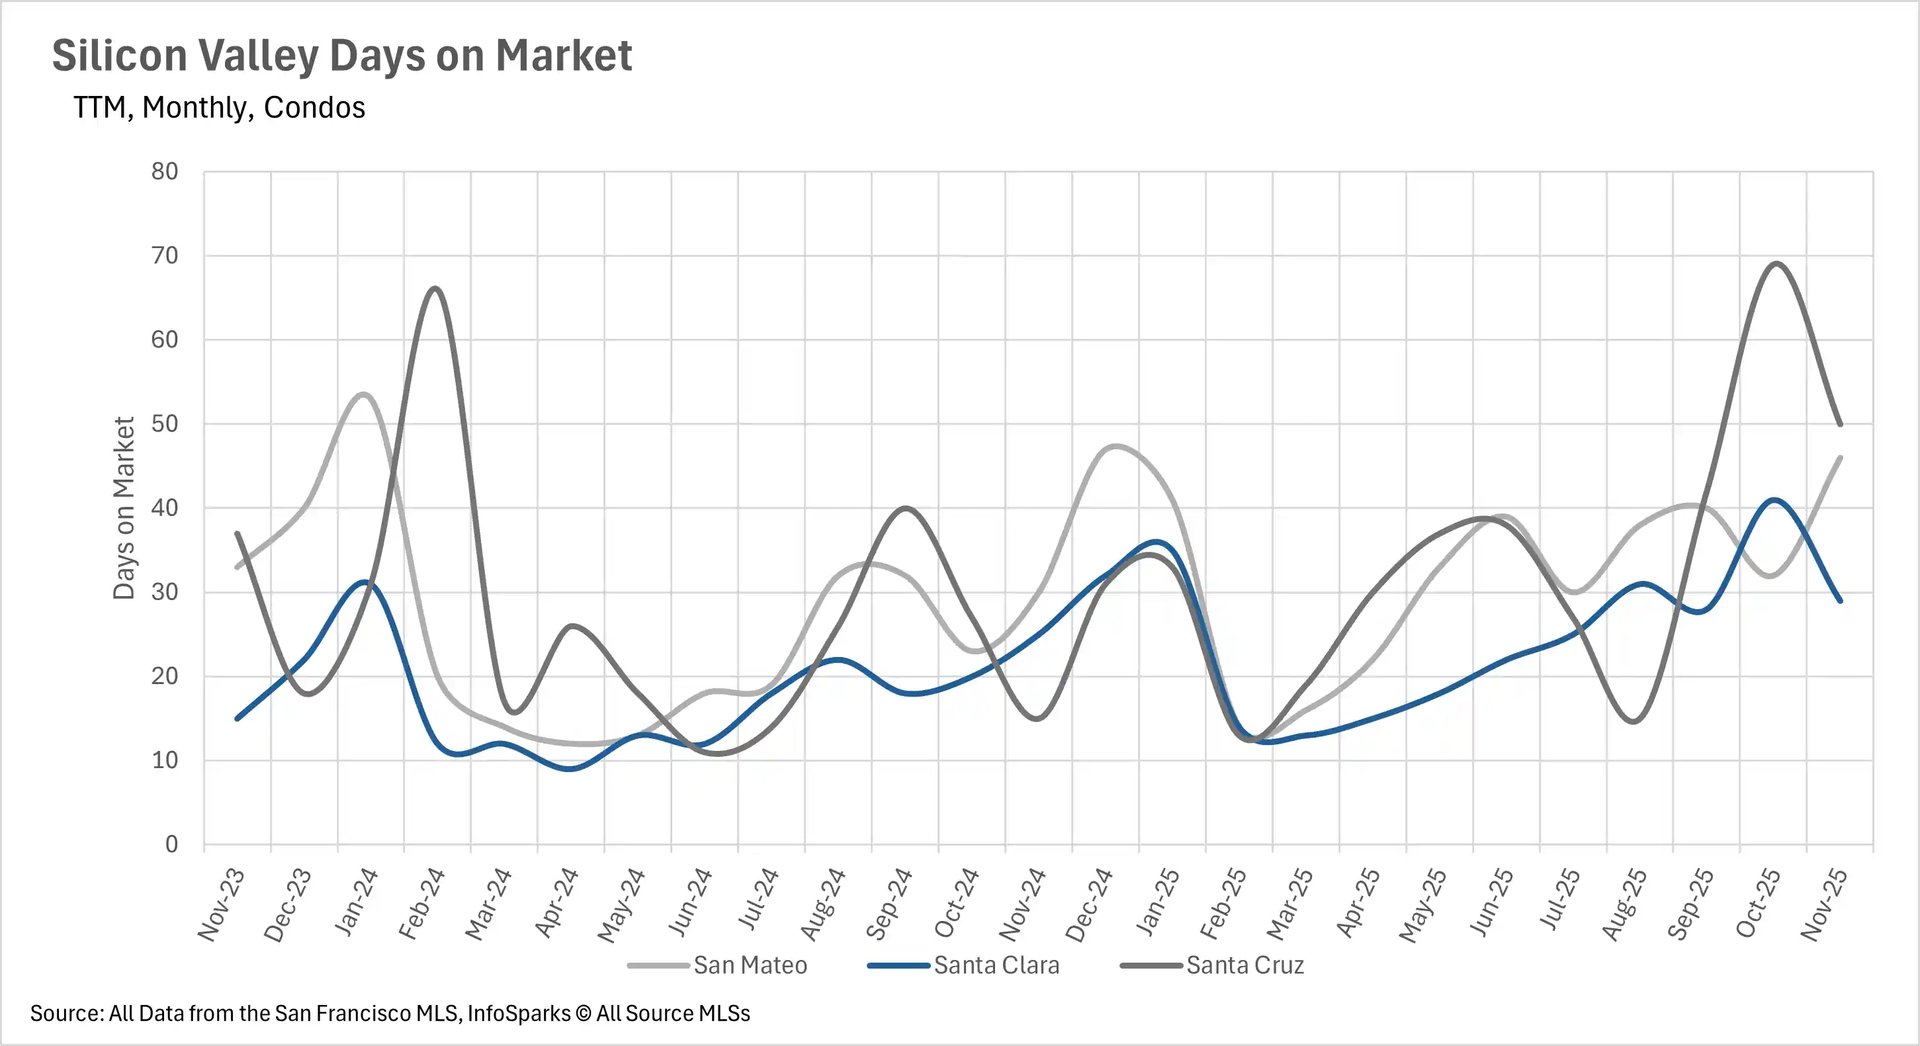
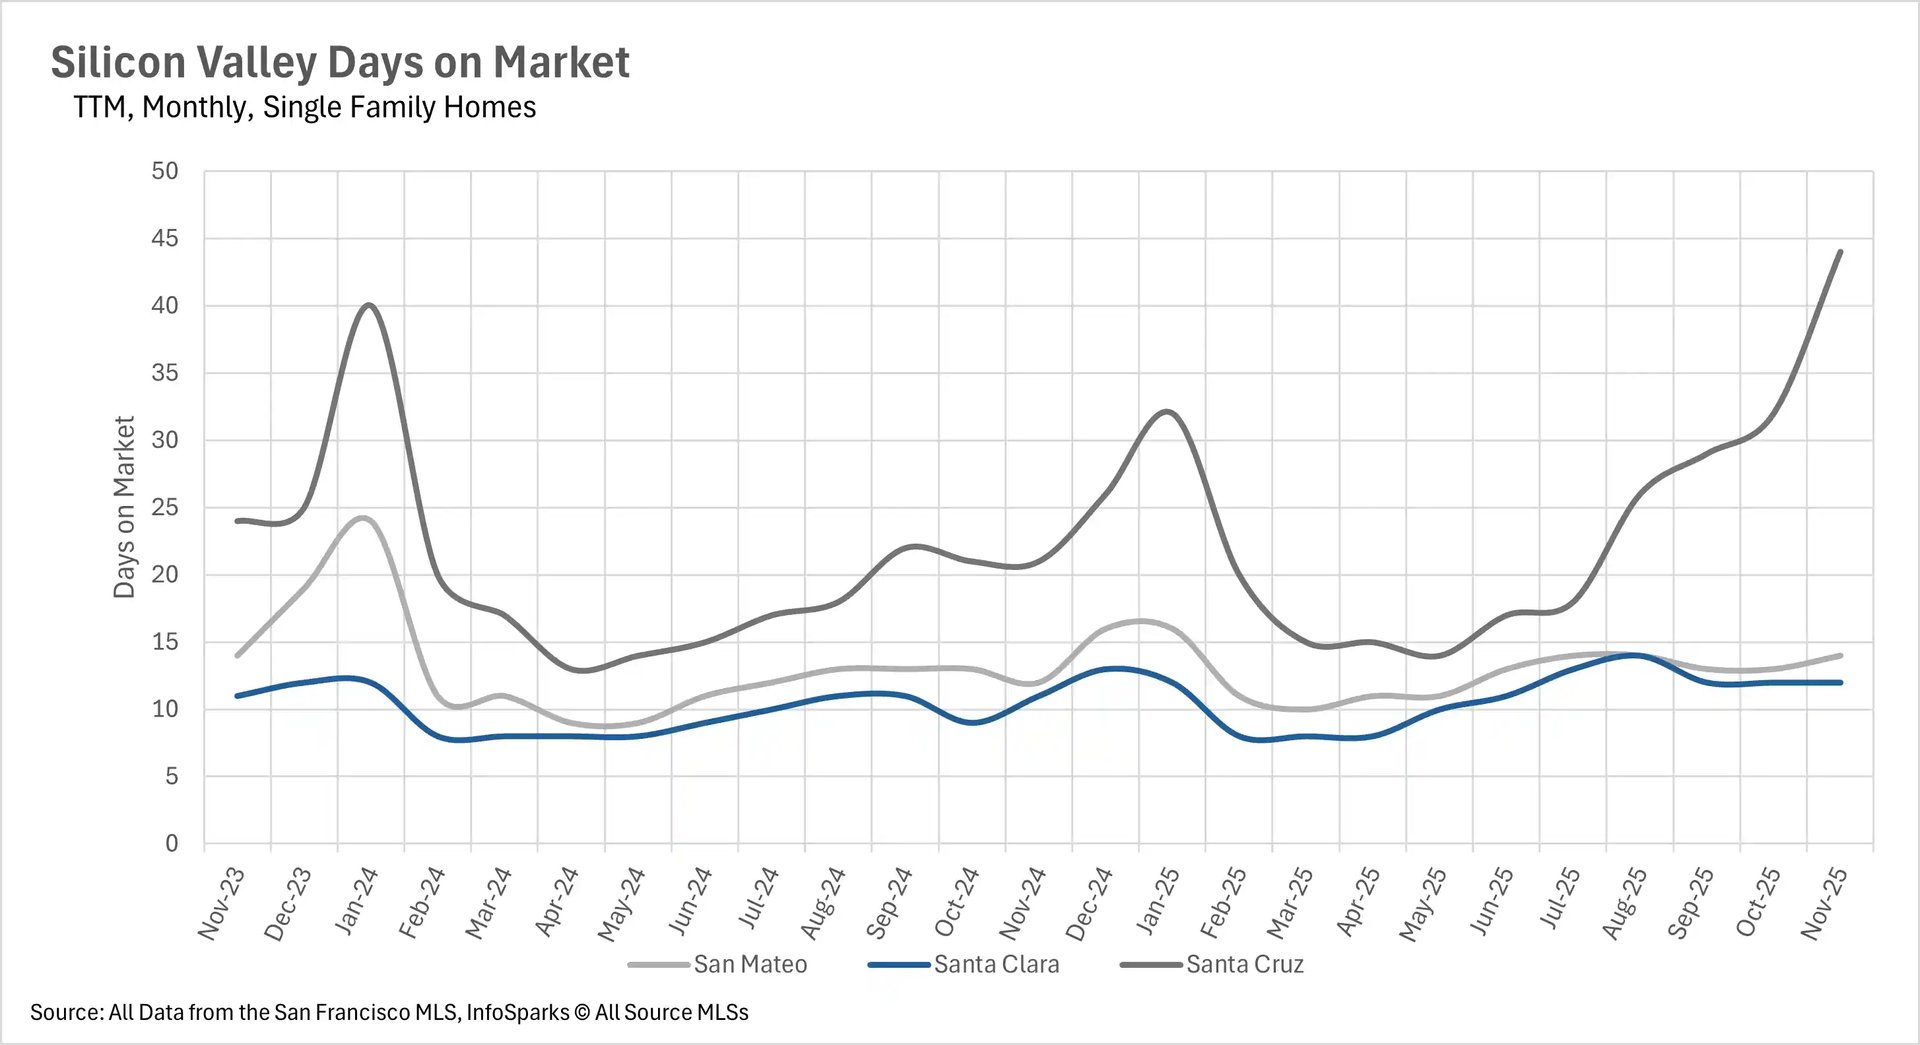
November's days on market data revealed extreme divergence across the Bay Area, with San Francisco accelerating dramatically while most other regions experienced significant slowdowns. San Francisco's market velocity intensified as inventory tightened, with single-family homes now selling in just 13 days (down 13.33% year-over-year) and condos moving in 35 days (down 30% year-over-year). This acceleration means buyers have virtually no time to deliberate before making offers. Silicon Valley presented a mixed picture - San Mateo and Santa Clara Counties maintained their ultra-fast pace with single-family homes selling in two weeks or less, but Santa Cruz County experienced a dramatic slowdown with single-family homes spending 109.52% more time on market than last year. Silicon Valley condo markets remained challenging across the board.
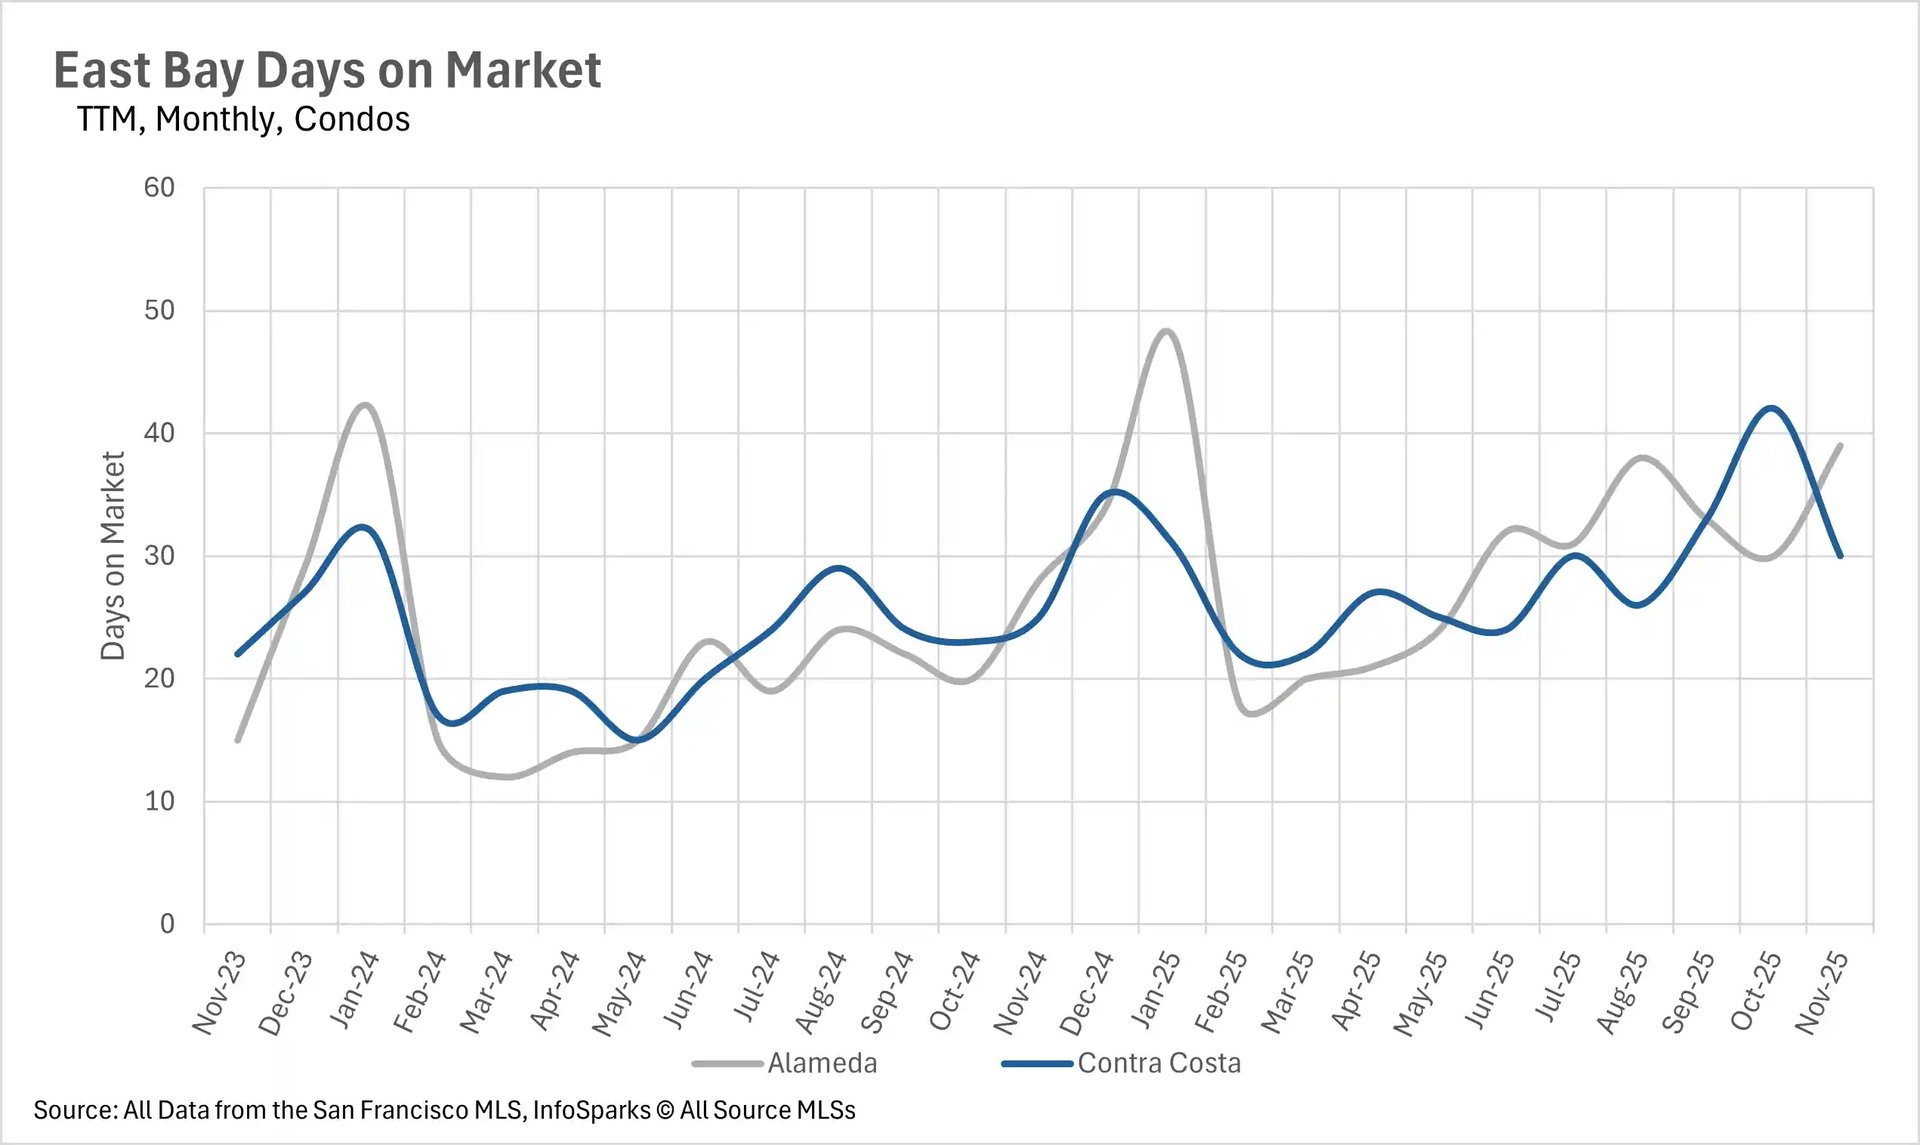
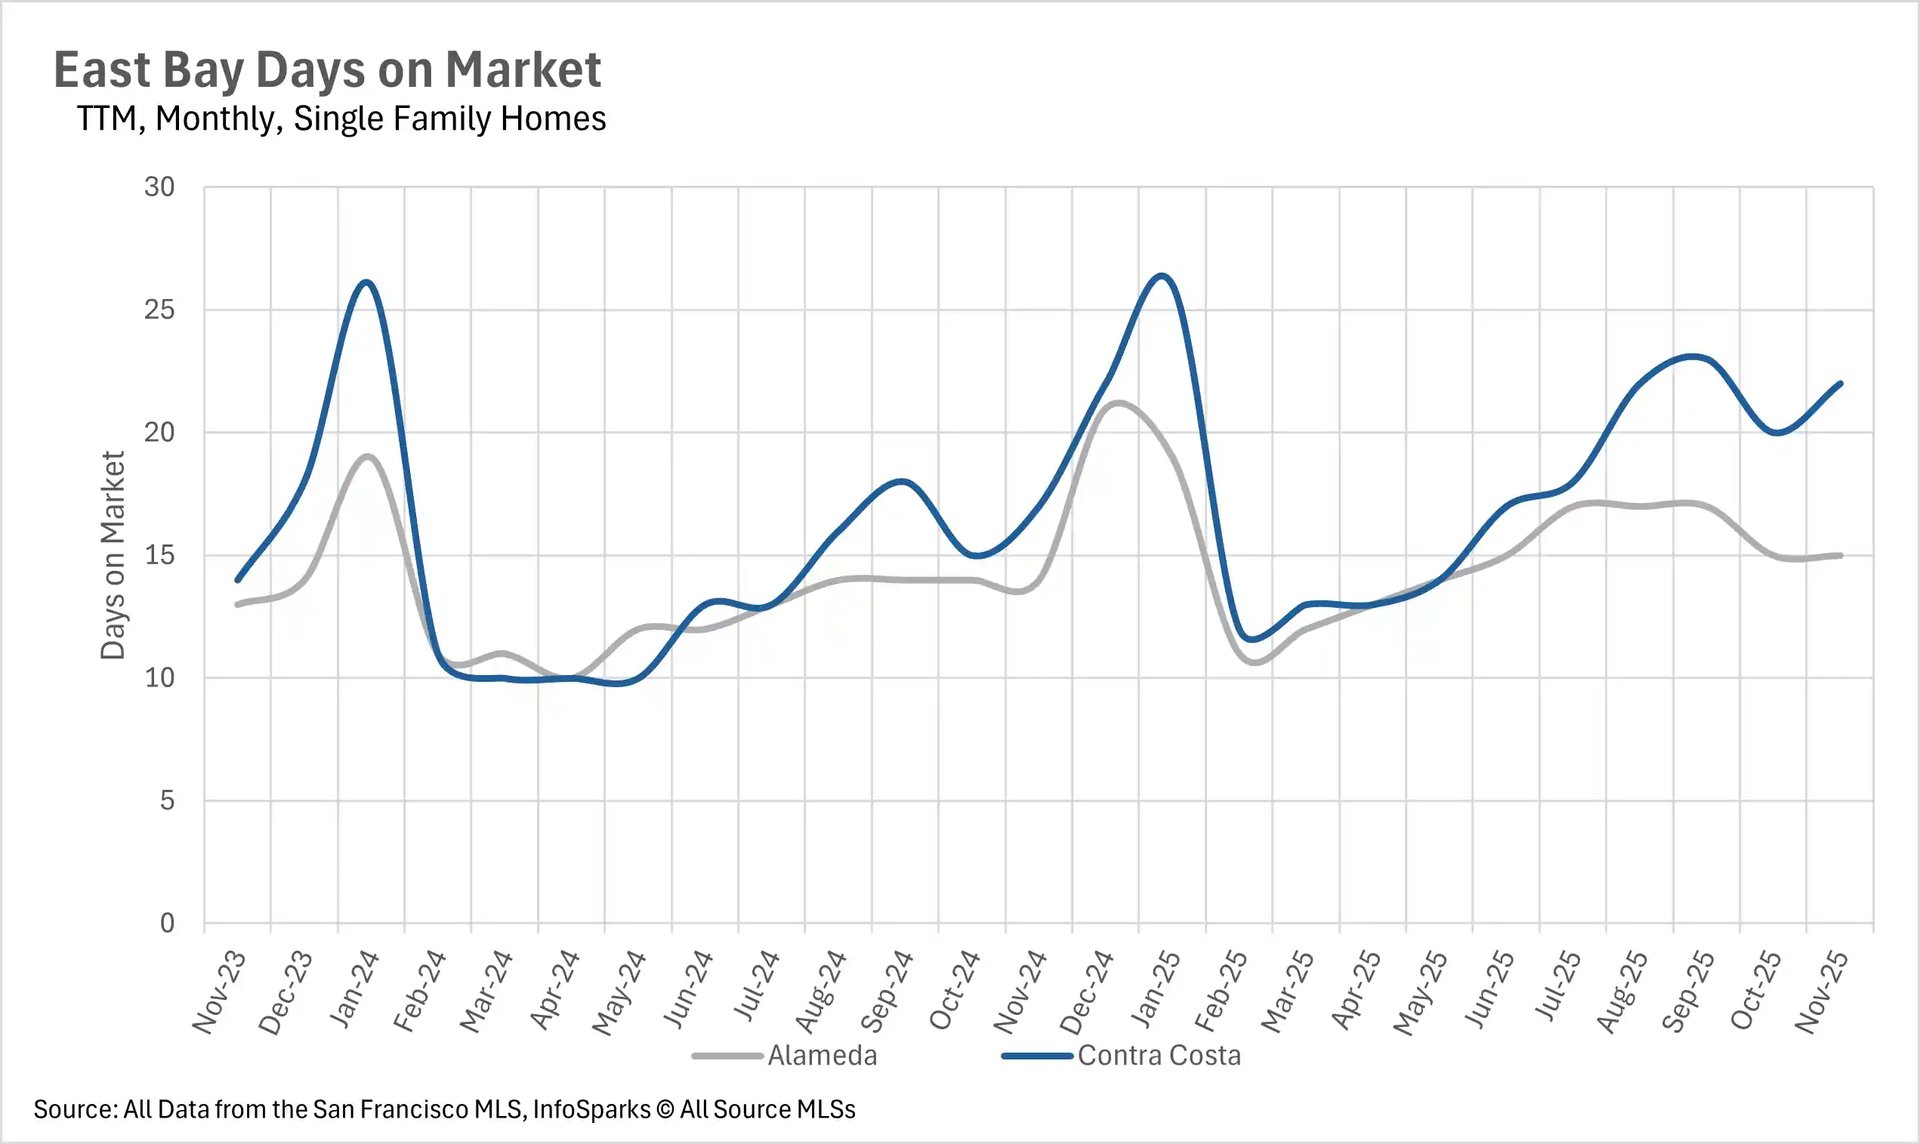
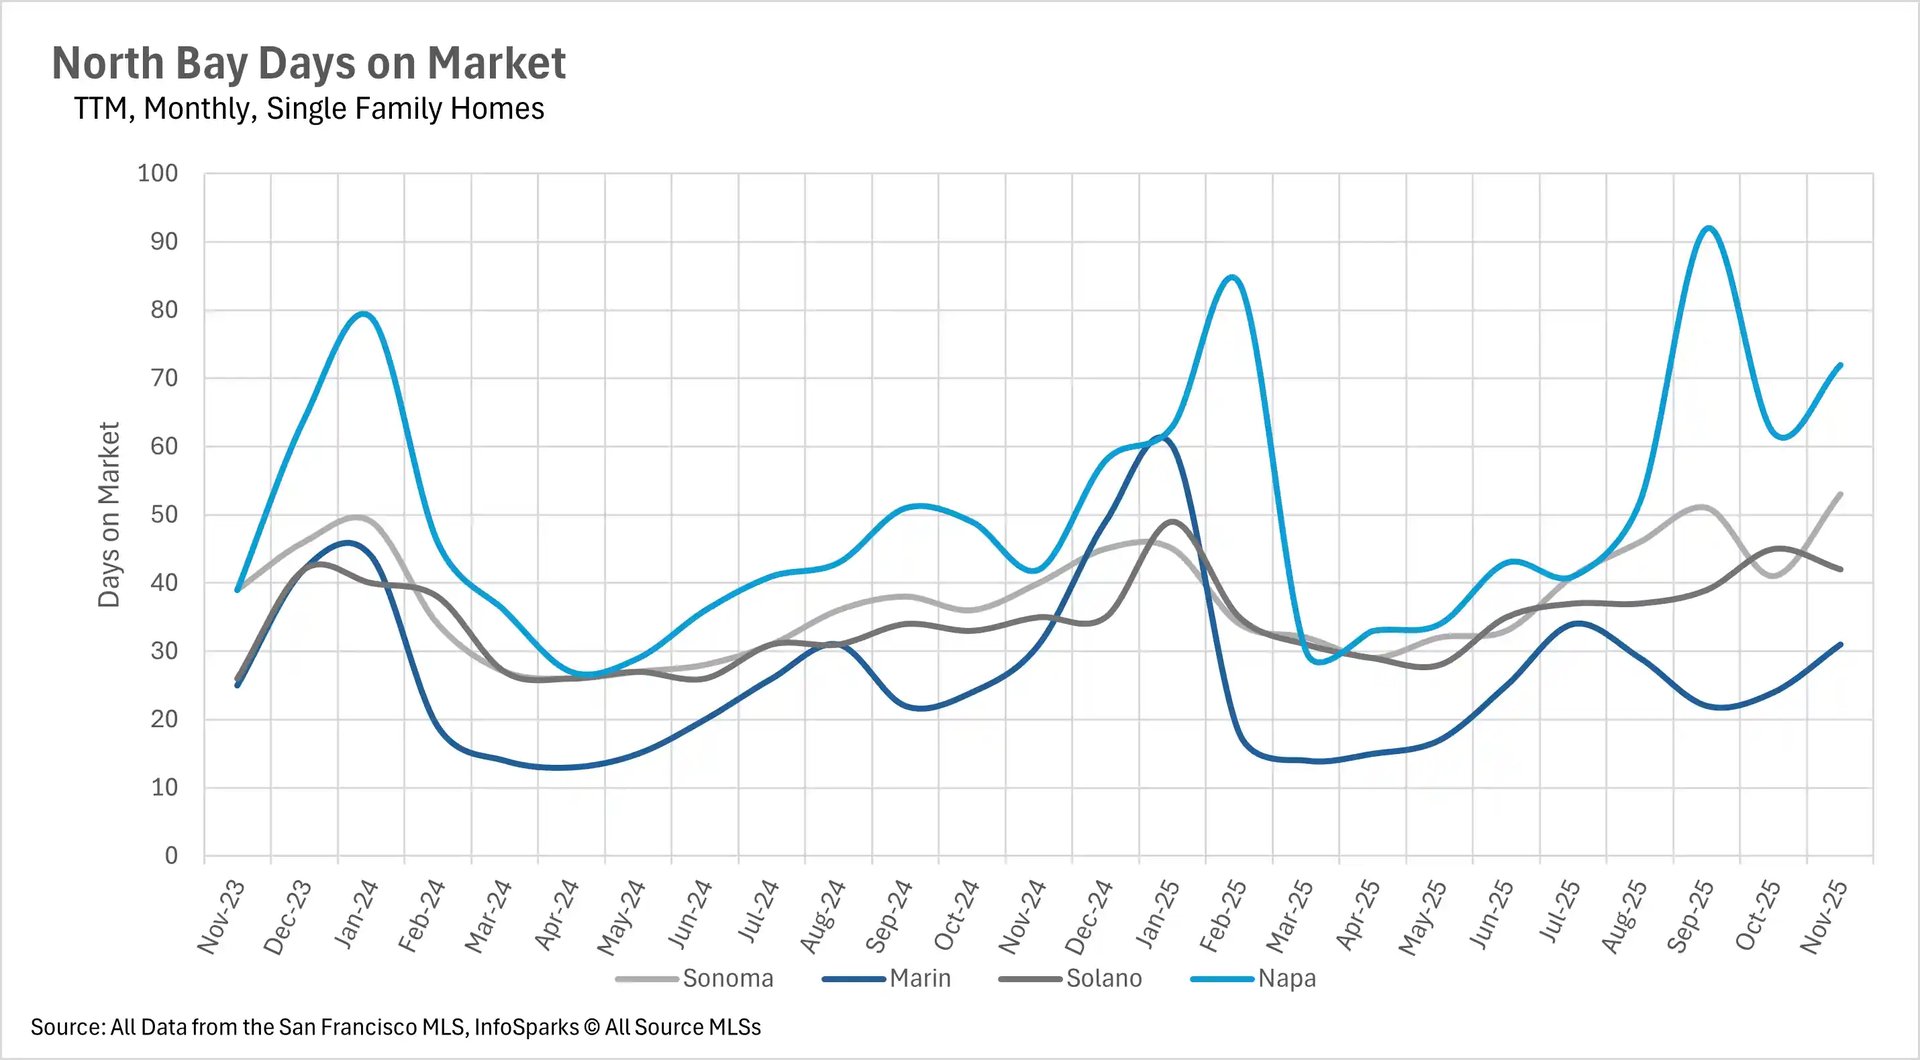
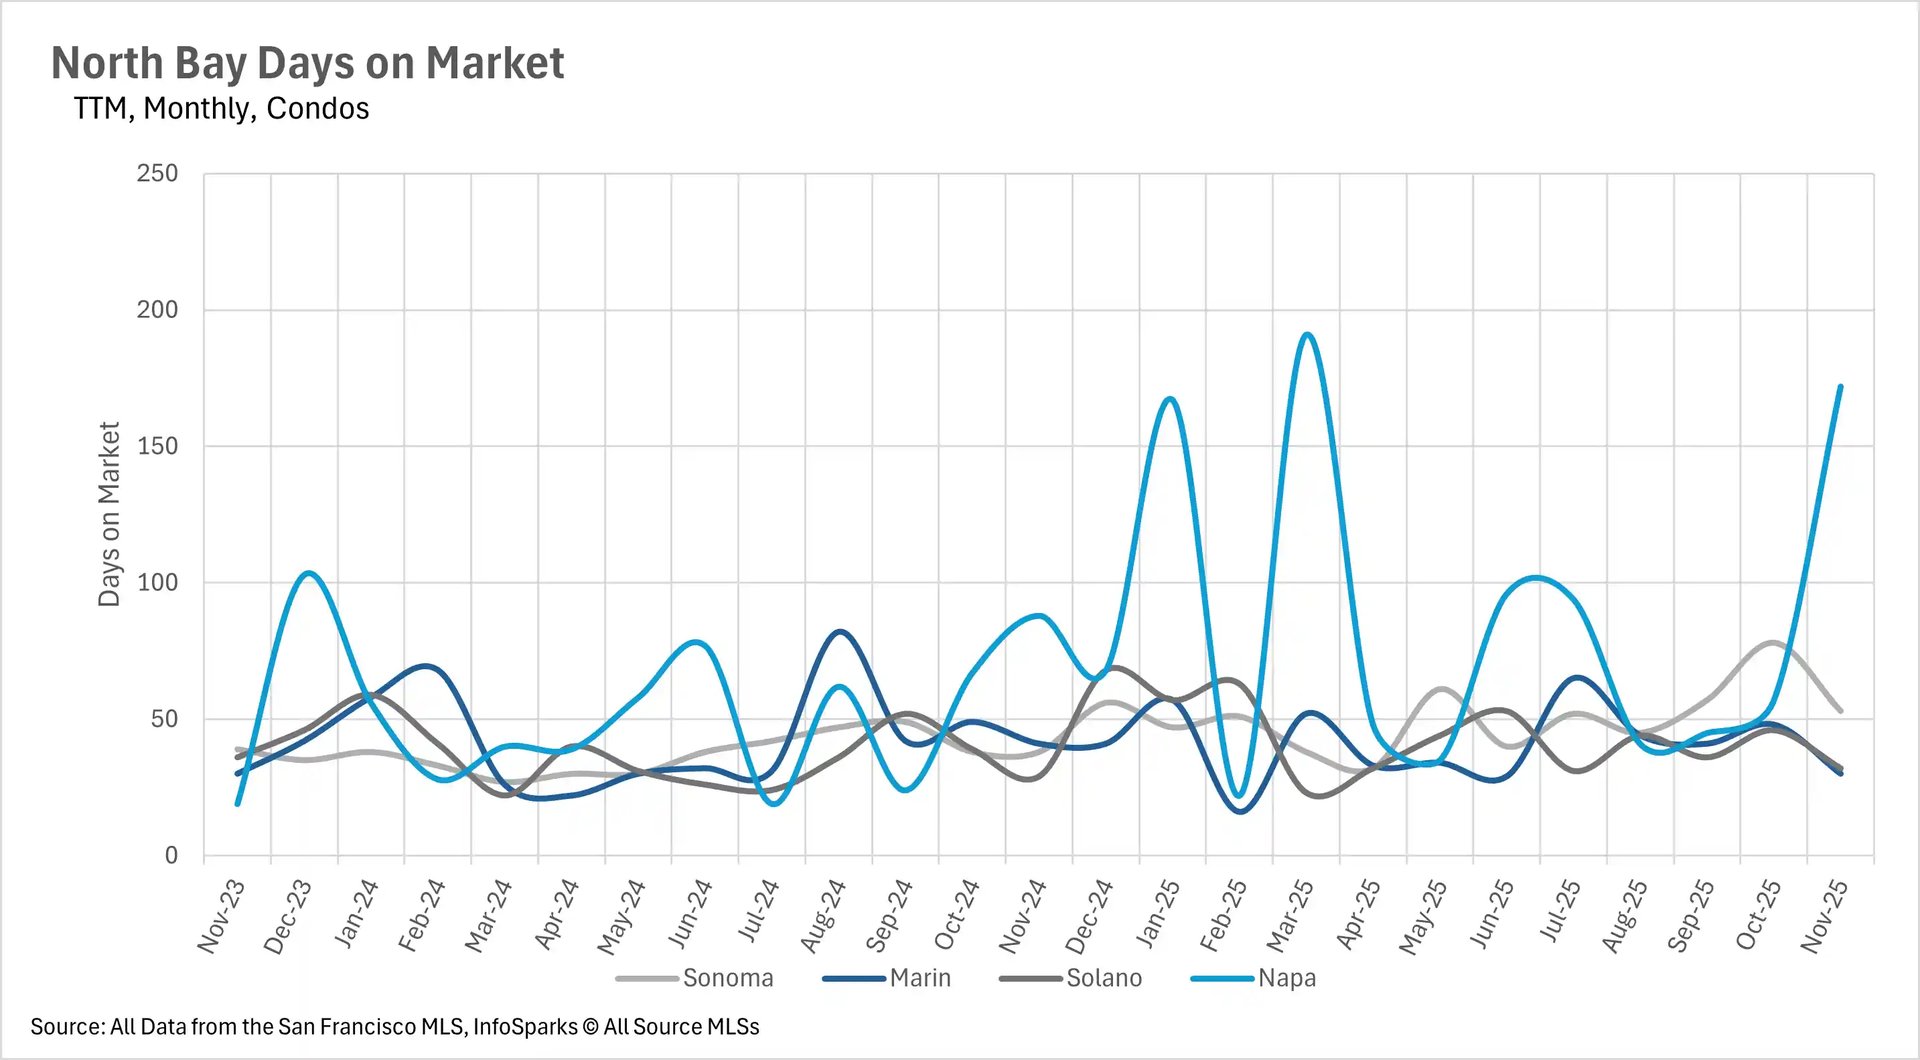
The North Bay showed substantial year-over-year increases in most counties, with single-family homes spending 32.50%, 20%, and 71.46% longer on market in Sonoma, Solano, and Napa Counties respectively, though Marin County remained perfectly stable at 31 days in both November 2024 and 2025. Interestingly, Marin condos actually accelerated with a 26.83% year-over-year decrease in market time, while the average Napa County condo spent nearly half a year (approximately 180 days) on market. The East Bay continued its year-long pattern of percentage increases masking relatively fast absolute times for single-family homes, while condos experienced more substantial slowdowns with 39.29% and 20.00% increases in Alameda and Contra Costa Counties respectively.
Winter inventory contraction pushes entire Bay Area toward seller's markets
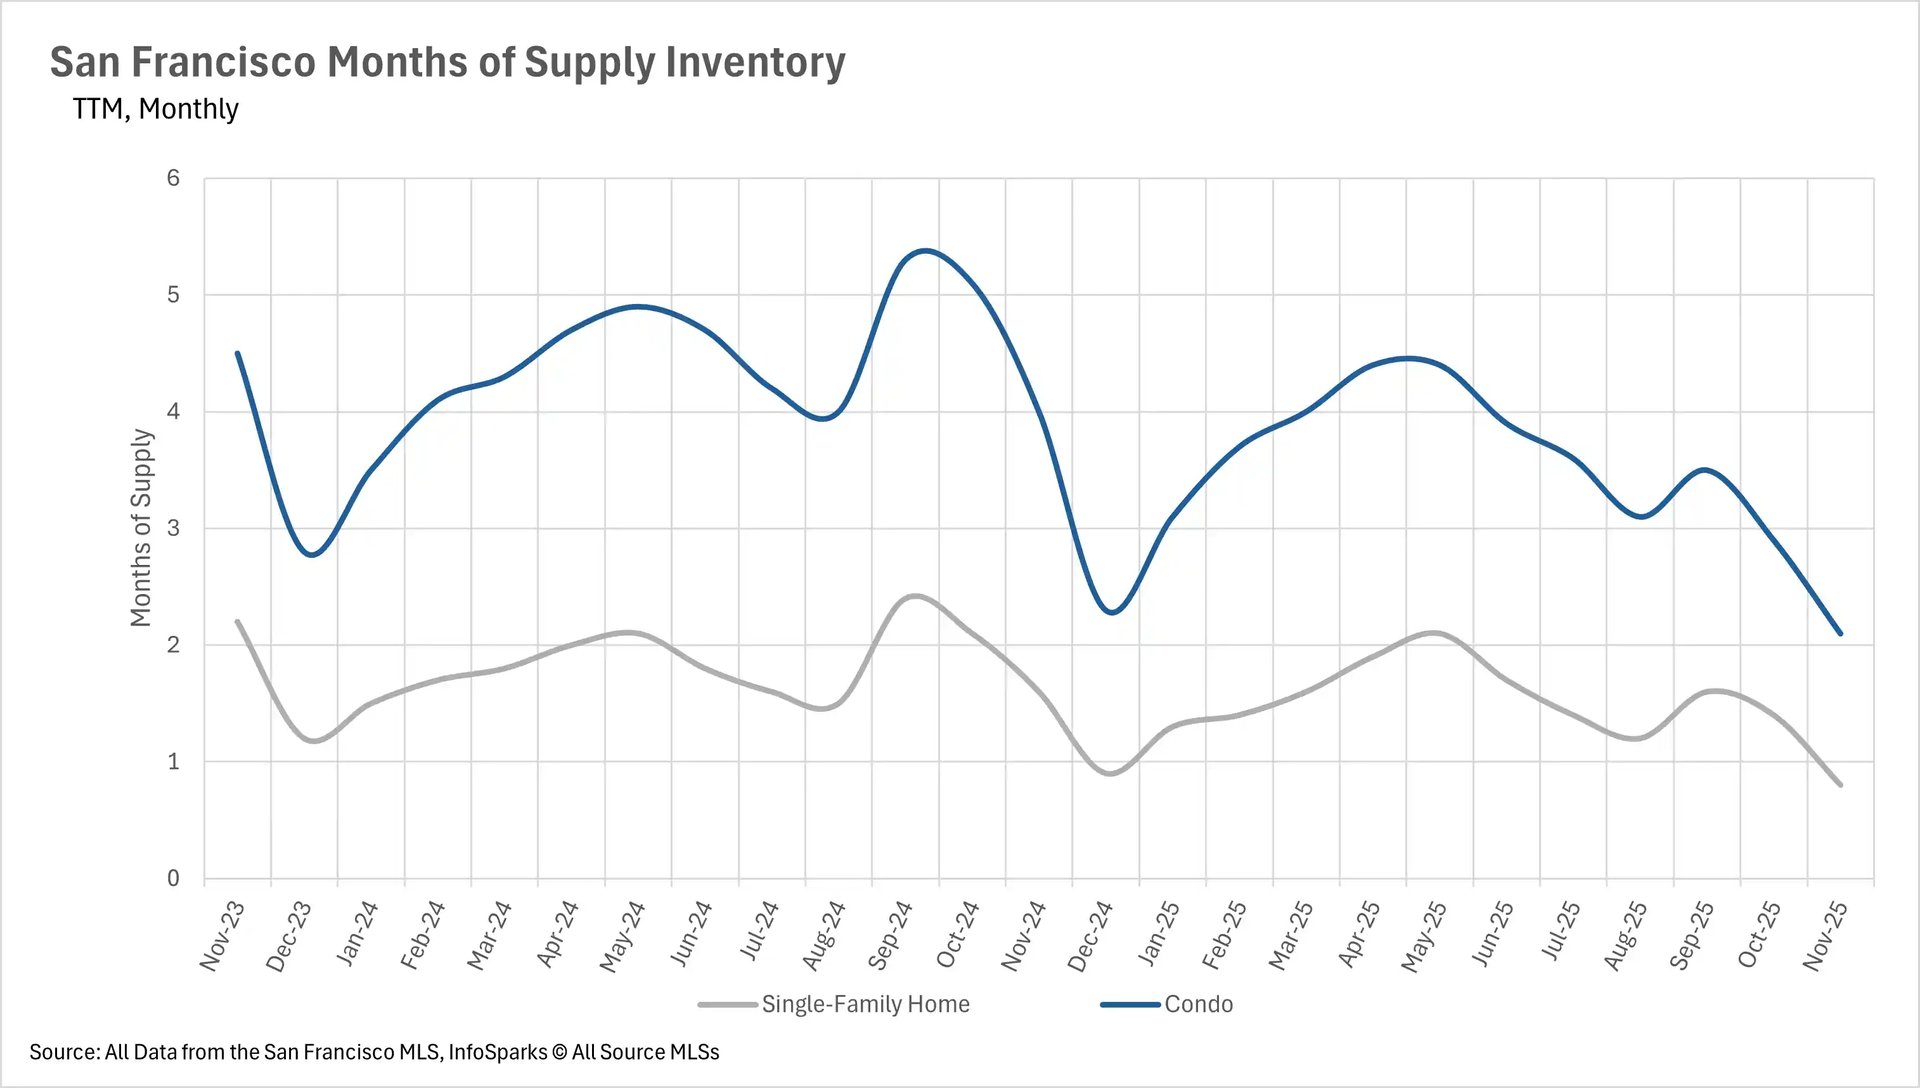
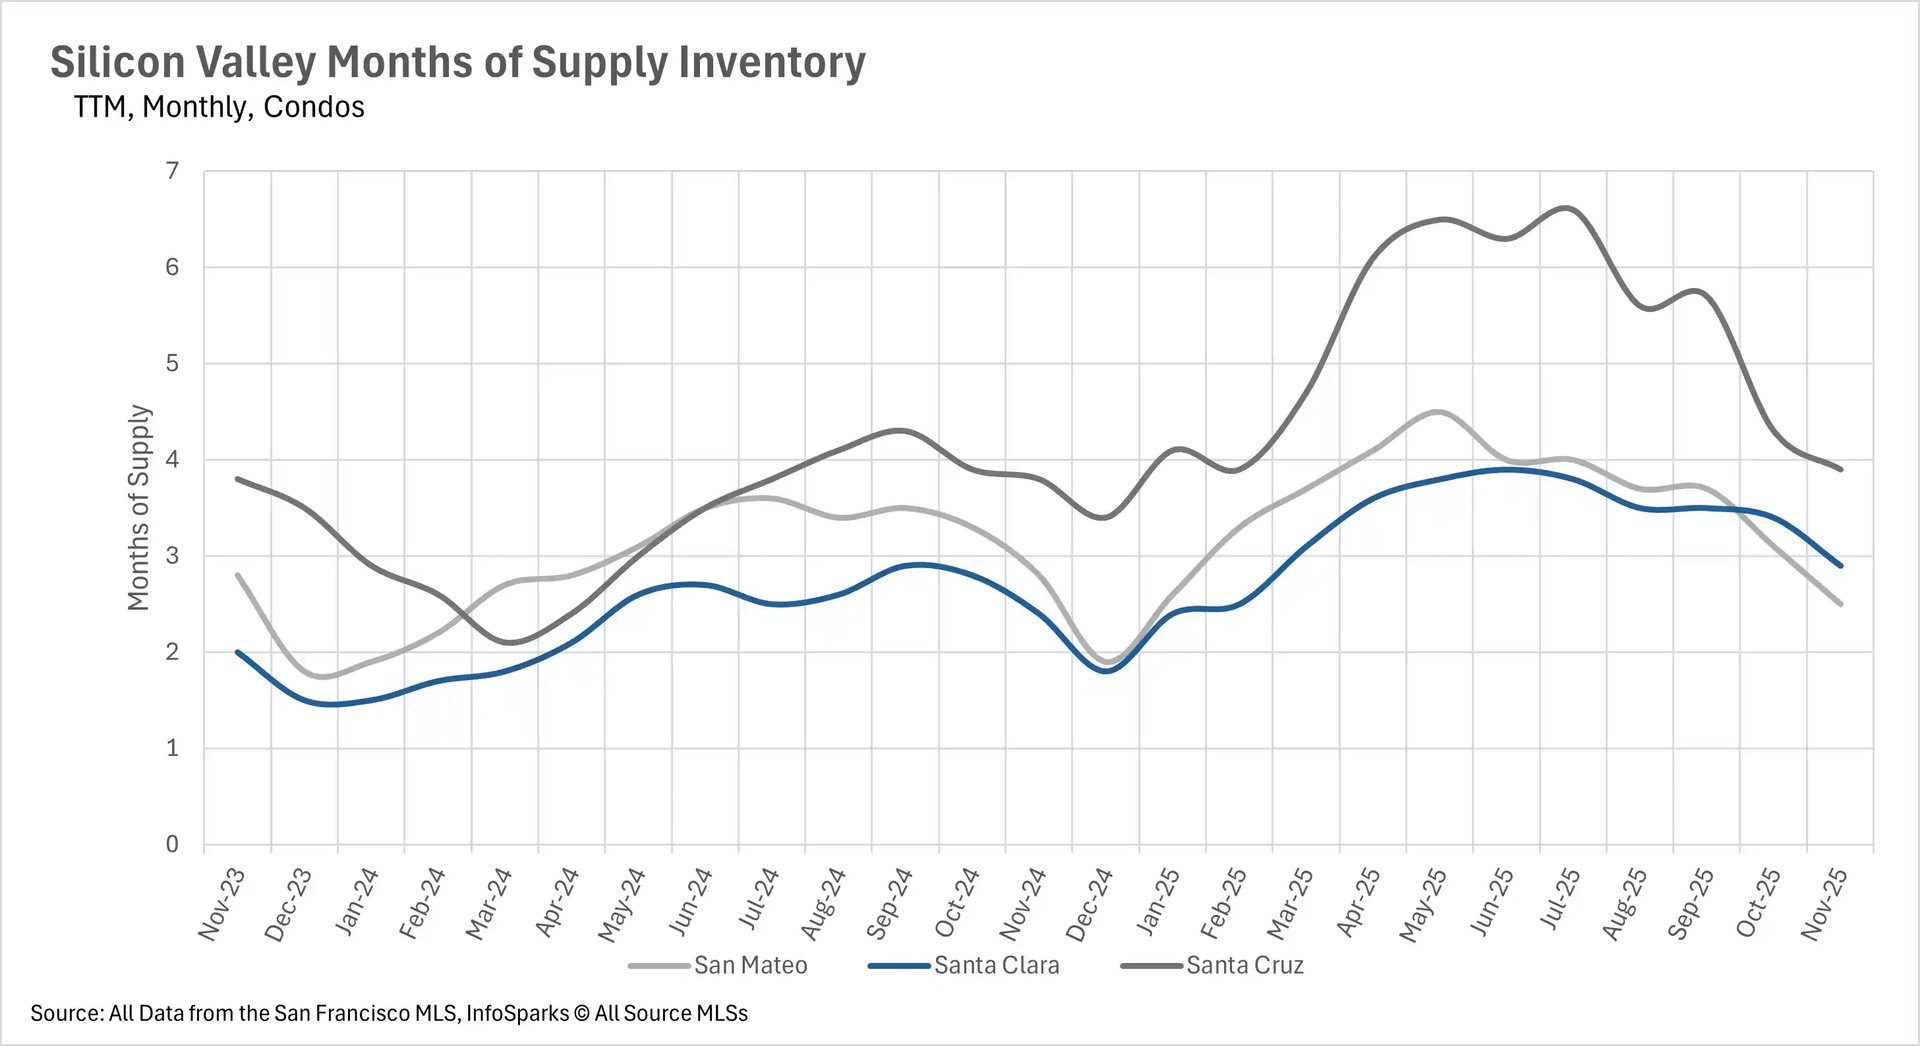
November's dramatic inventory declines accelerated the Bay Area's shift toward seller-dominant conditions across nearly all property types and regions. San Francisco achieved the most extreme seller's market status in the region, with single-family homes at an unprecedented 0.8 months of supply and condos at just 2.1 months - both representing deeply entrenched seller's markets with no relief in sight. Silicon Valley experienced the expected seasonal shift toward seller's markets, with single-family homes in San Mateo and Santa Clara Counties reaching ultra-low 1.1 and 0.9 months of supply respectively, while Santa Cruz remained balanced at exactly 3.0 months. Silicon Valley condos moved decisively toward seller's territory with San Mateo at 2.5 months, Santa Clara at 2.9 months (both approaching seller's market thresholds), and Santa Cruz at 3.9 months still favoring buyers.
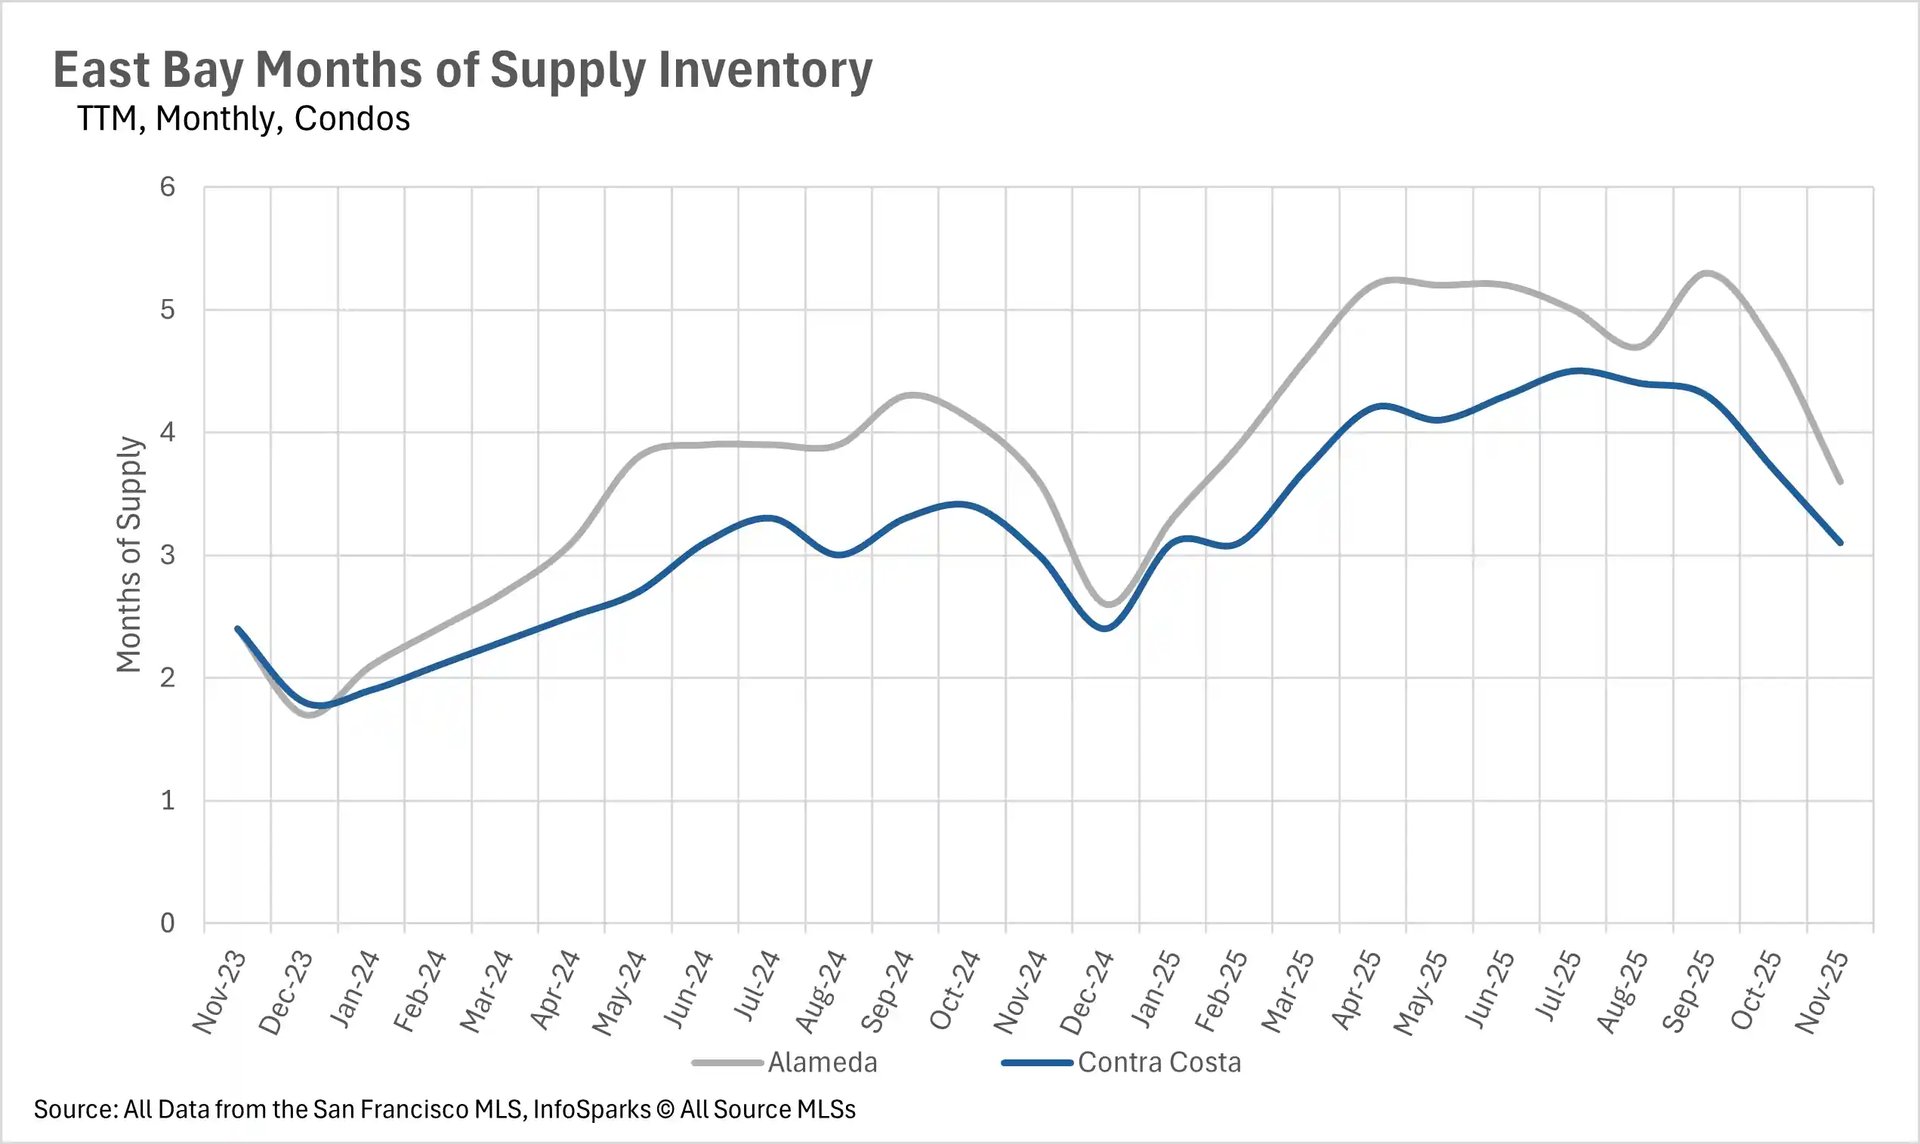
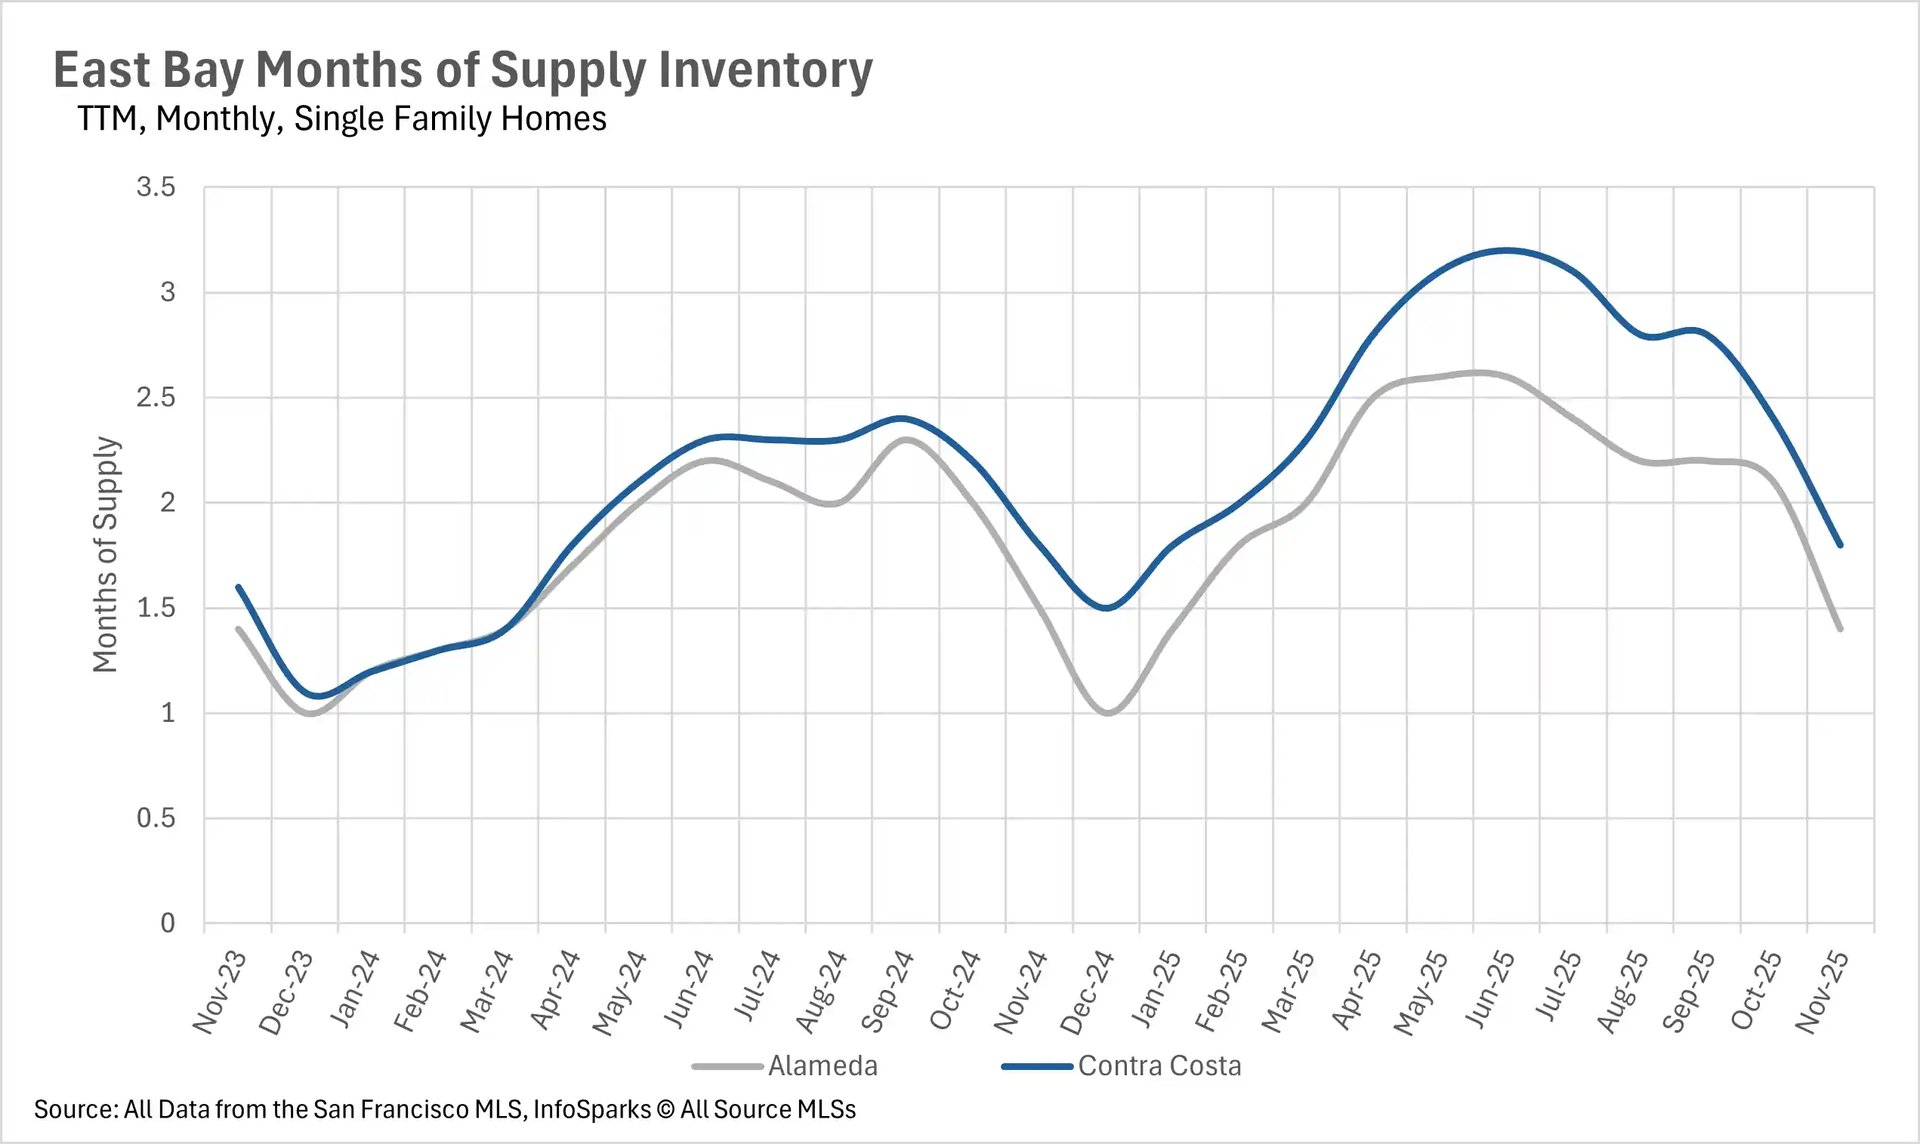
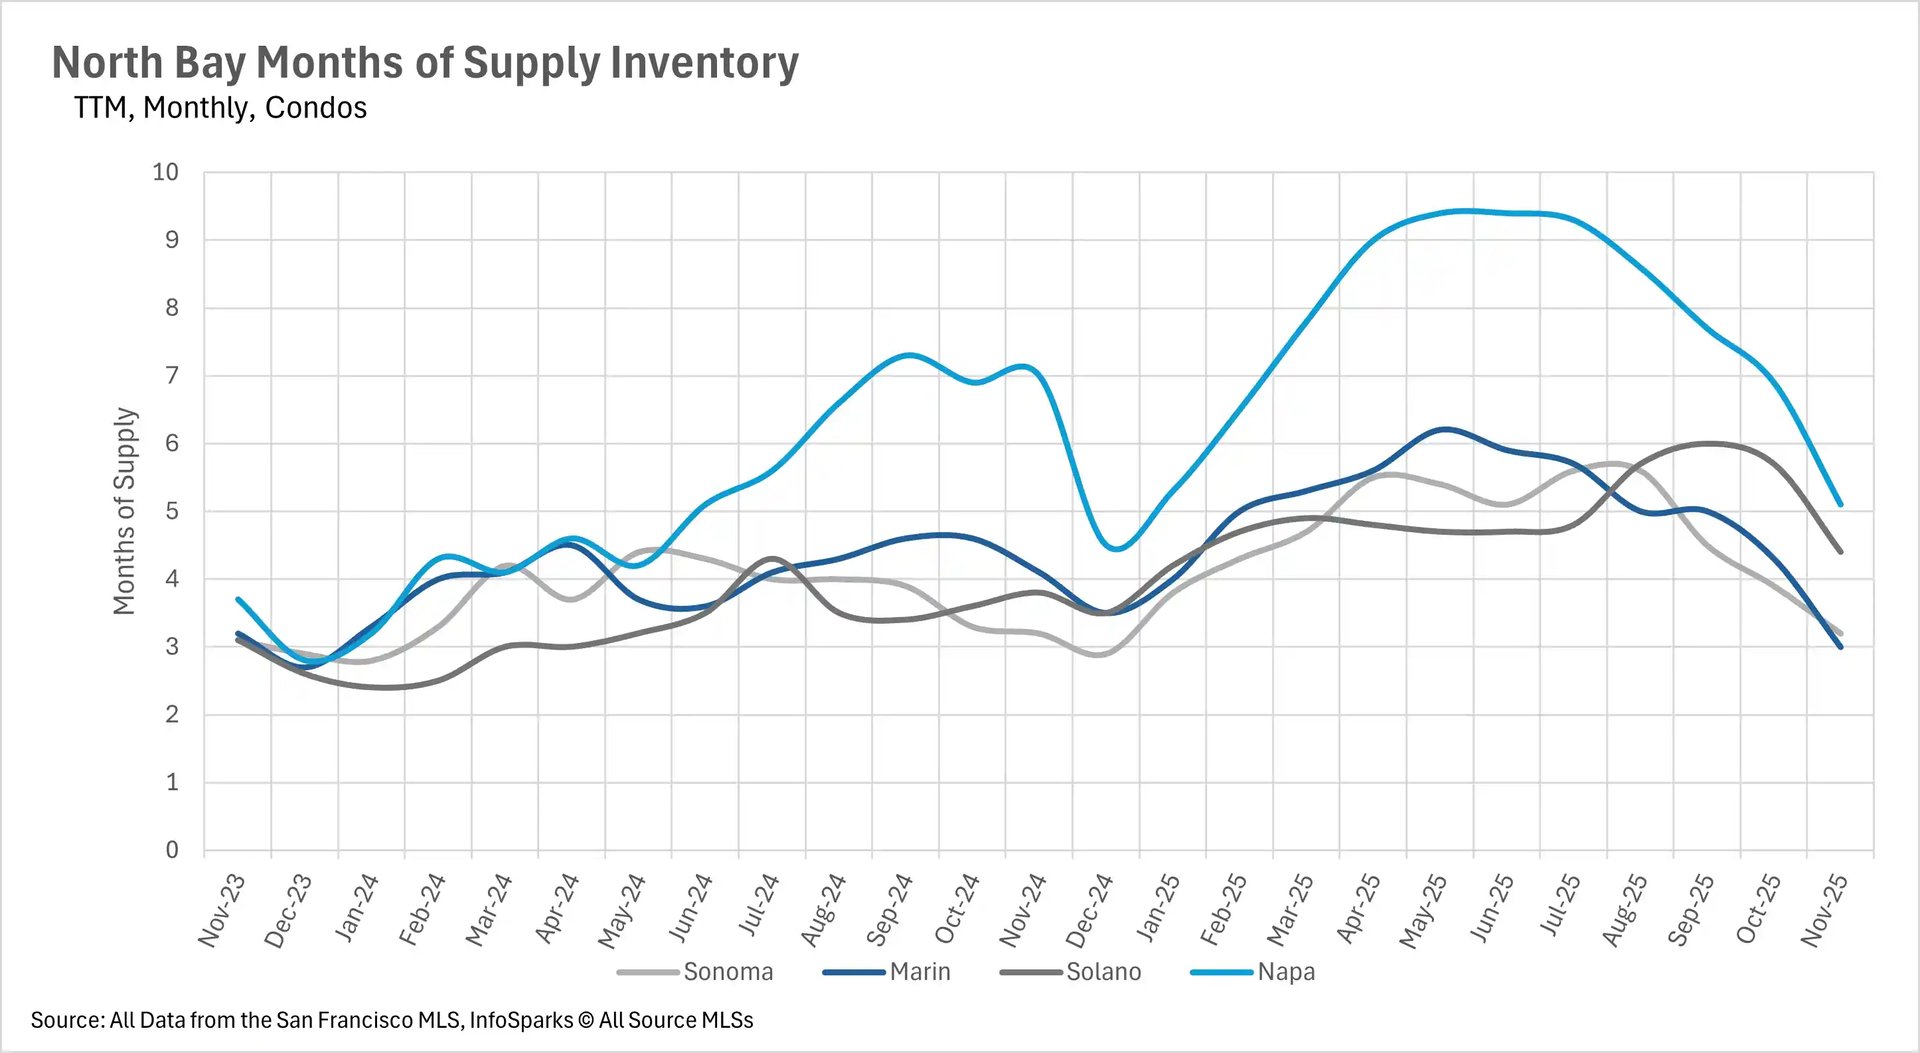
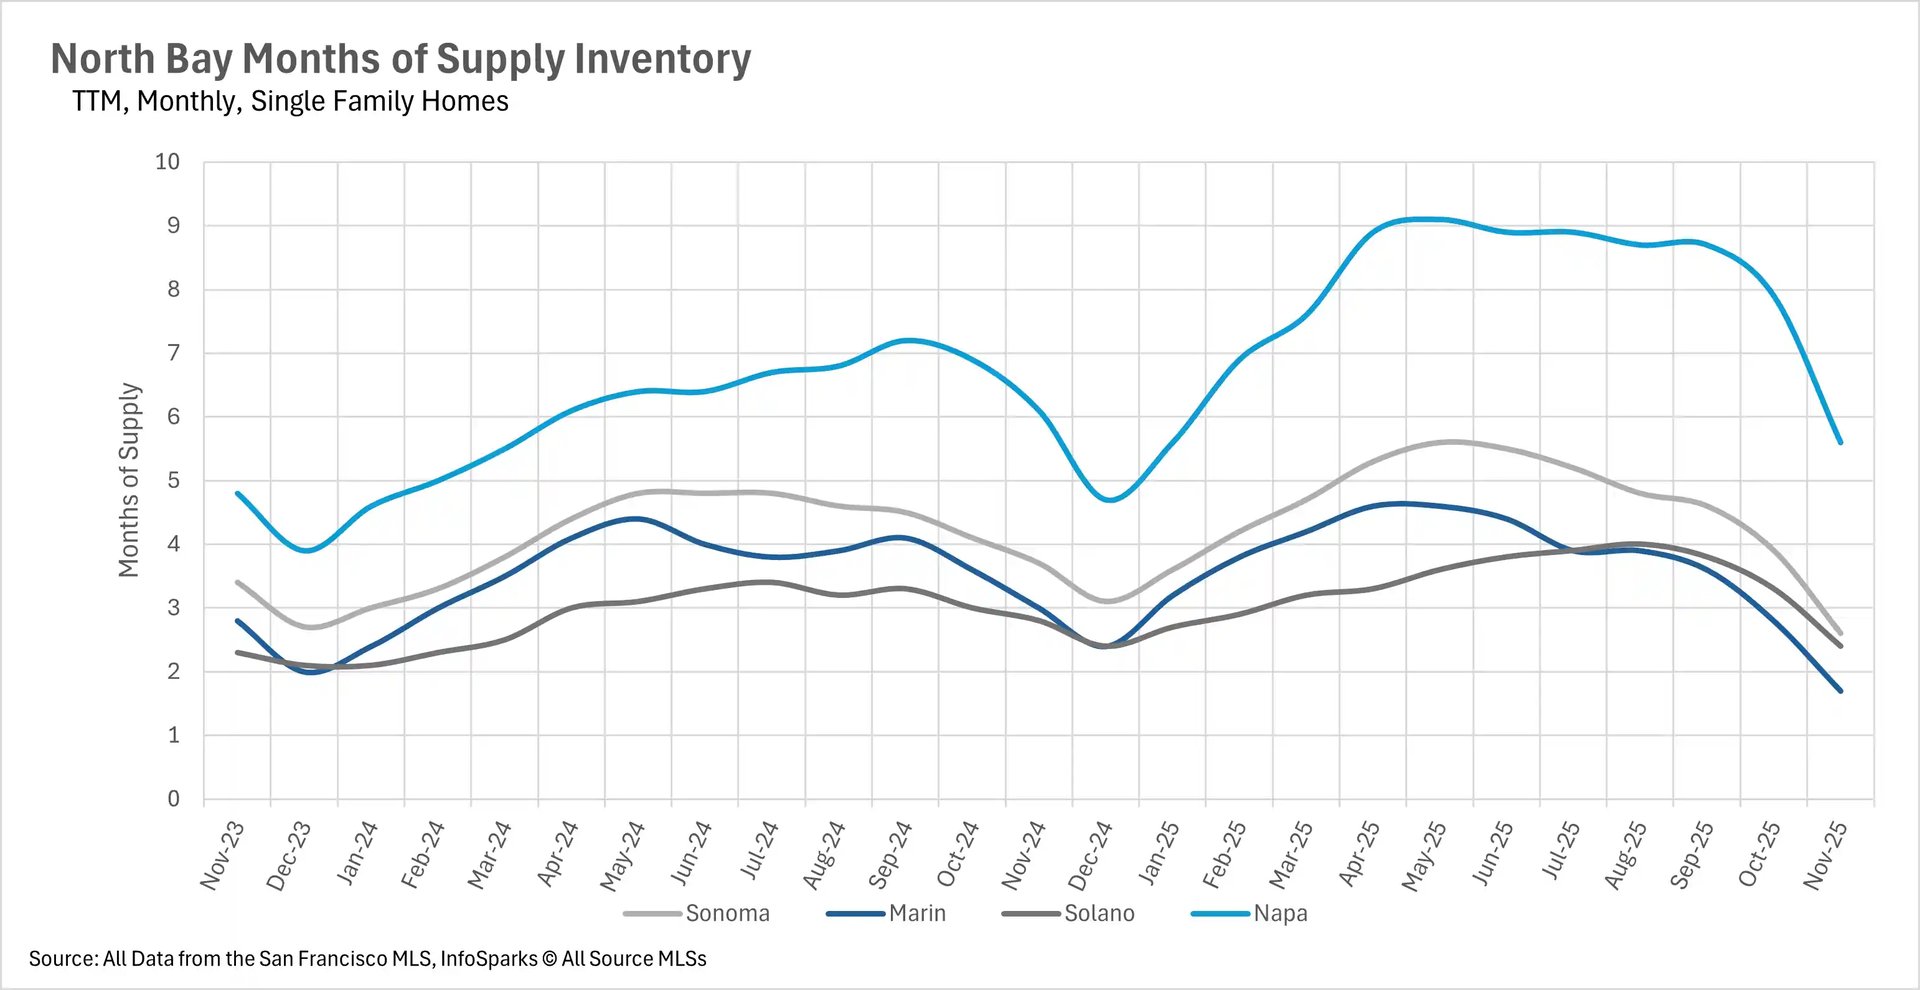
The East Bay maintained its traditional market structure but with intensifying seller advantage, as single-family homes reached extremely tight 1.4 months in Alameda and 1.8 months in Contra Costa, while condos remained in buyer's territory at 3.6 and 3.1 months respectively. The North Bay demonstrated clear seasonal movement toward seller's markets across all property types, with single-family homes in Marin achieving strong seller's market status at 1.7 months, Sonoma and Solano at 2.6 and 2.4 months respectively (seller's markets), and even Napa trending toward balance at 5.6 months. North Bay condos showed similar movement with Marin at 3.0 months (balanced), Sonoma at 3.2 months (approaching balanced), and Solano and Napa at 4.4 and 5.1 months respectively (buyer's markets trending toward balance). This region-wide pattern suggests the Bay Area has entered a period of extreme supply constraint that will likely intensify through December's typically low-inventory holiday season.