Select a Market Report to Read:
Welcome to the latest San Francisco Real Estate Market Report from Kinoko Real Estate! As your trusted local Real Estate experts in San Francisco, we're committed to providing you with the most accurate and insightful data to guide your home buying or selling journey in this dynamic city.
The Local Lowdown
Quick Take:
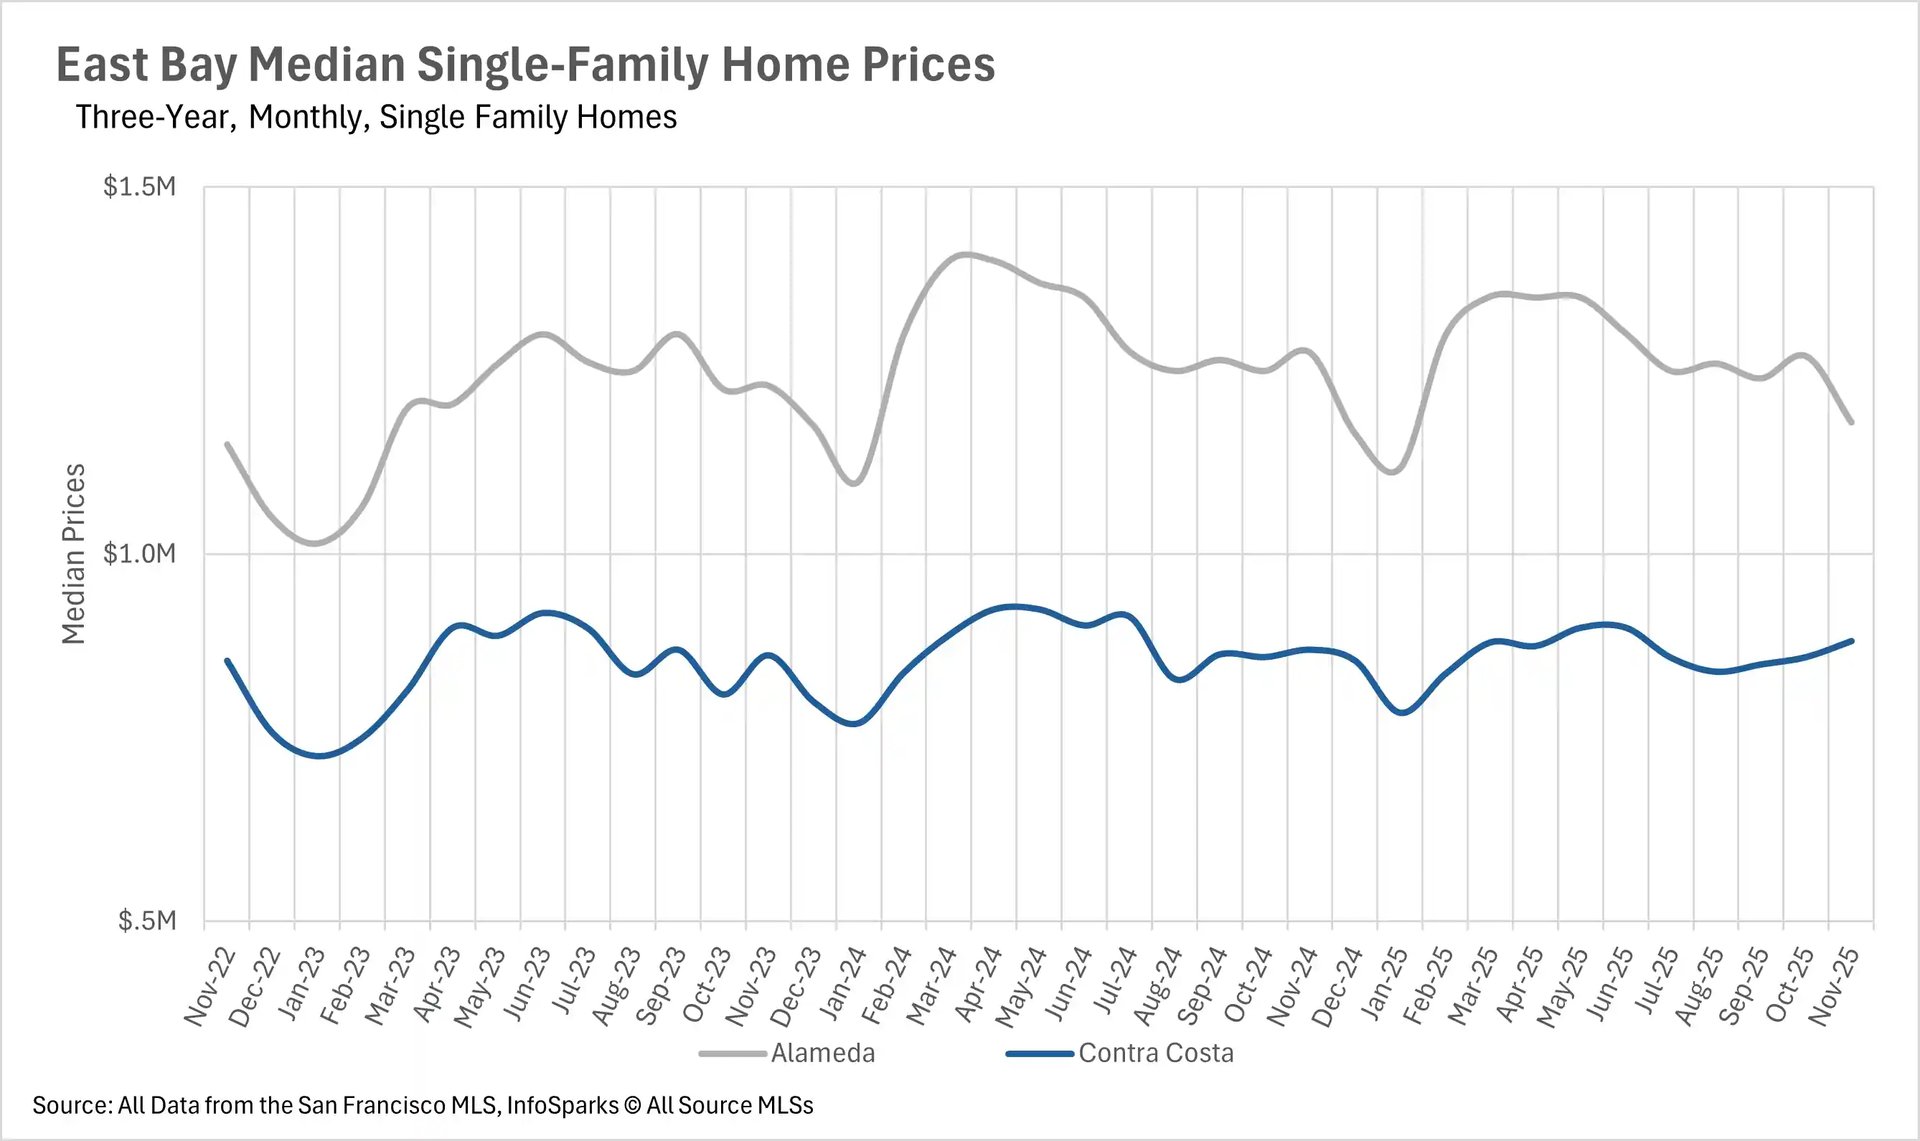
- Median sale prices are largely on the decline throughout the East Bay.
- The East Bay has continued to buck the trend, as inventories are roughly flat on a year-over-year basis.
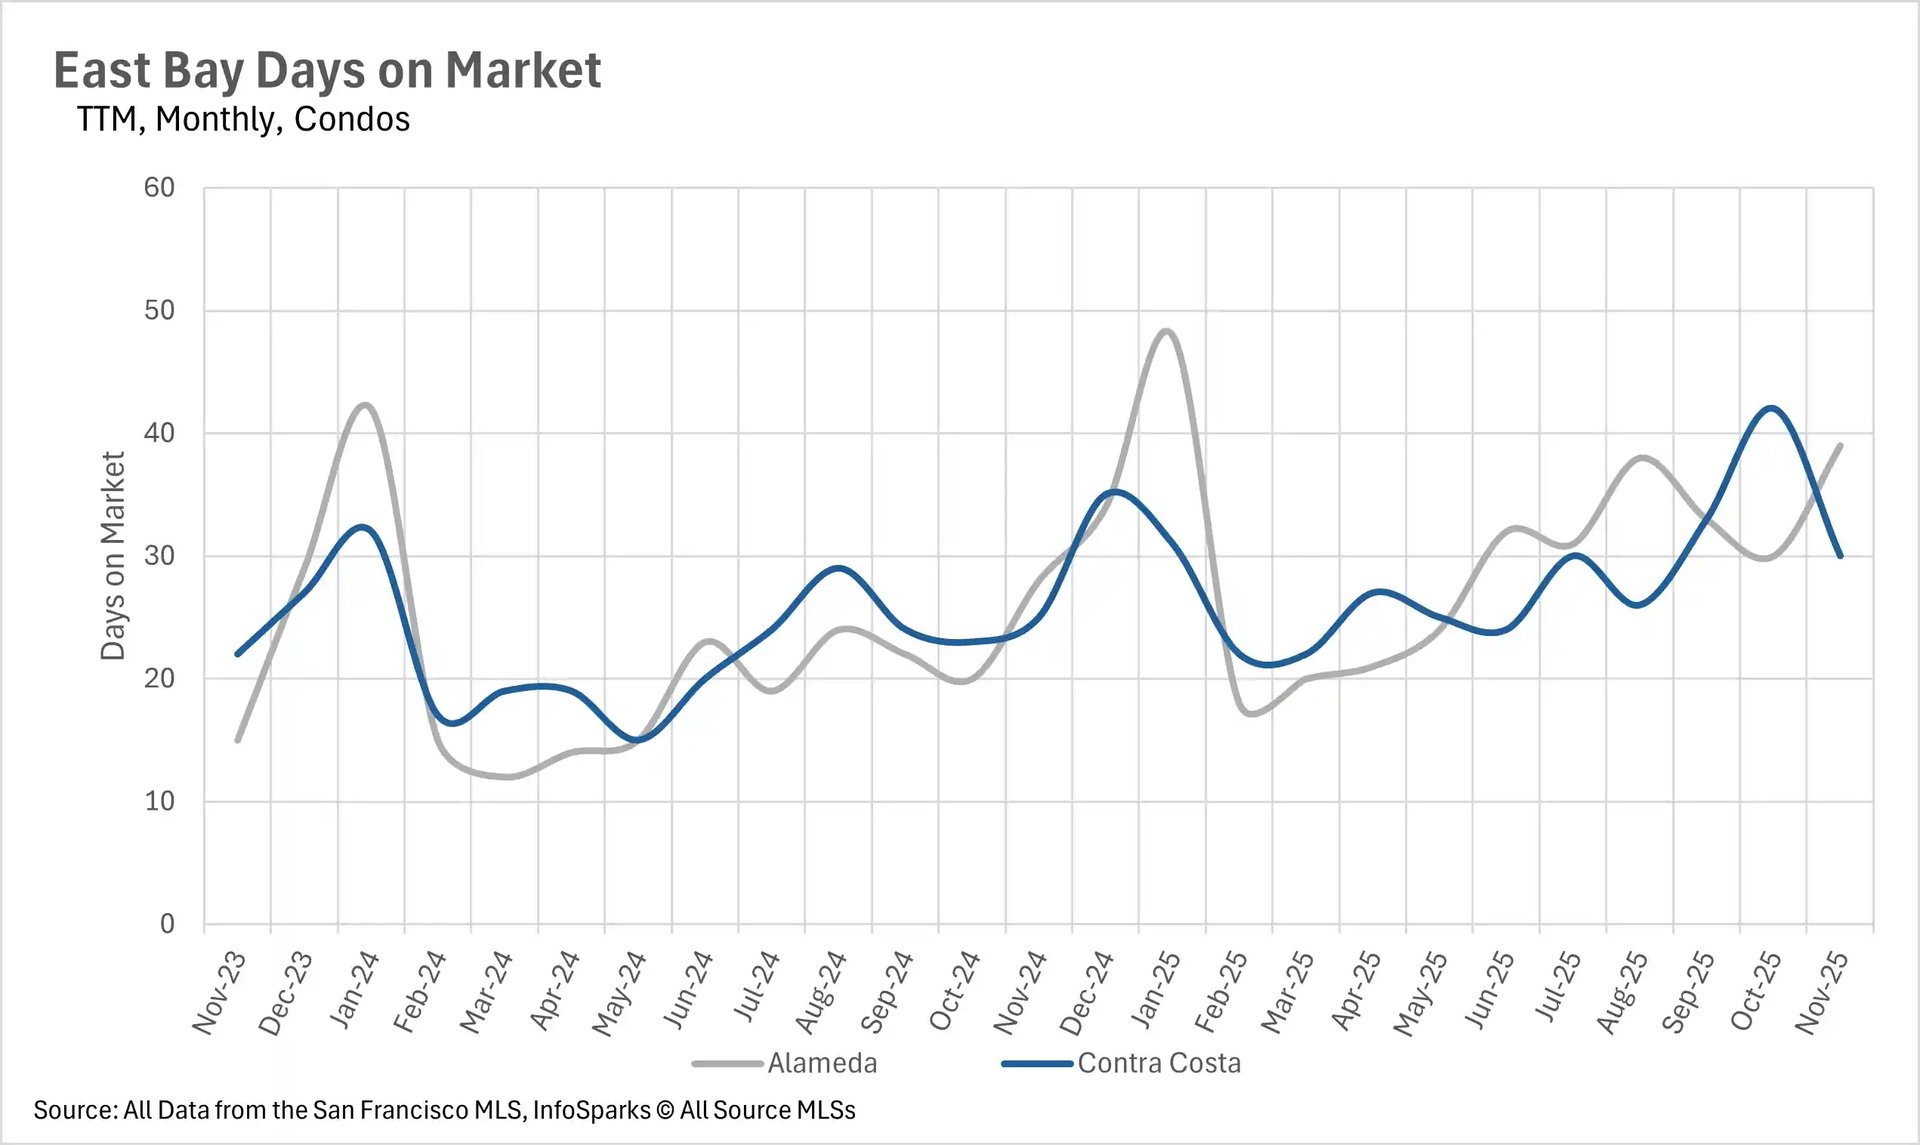
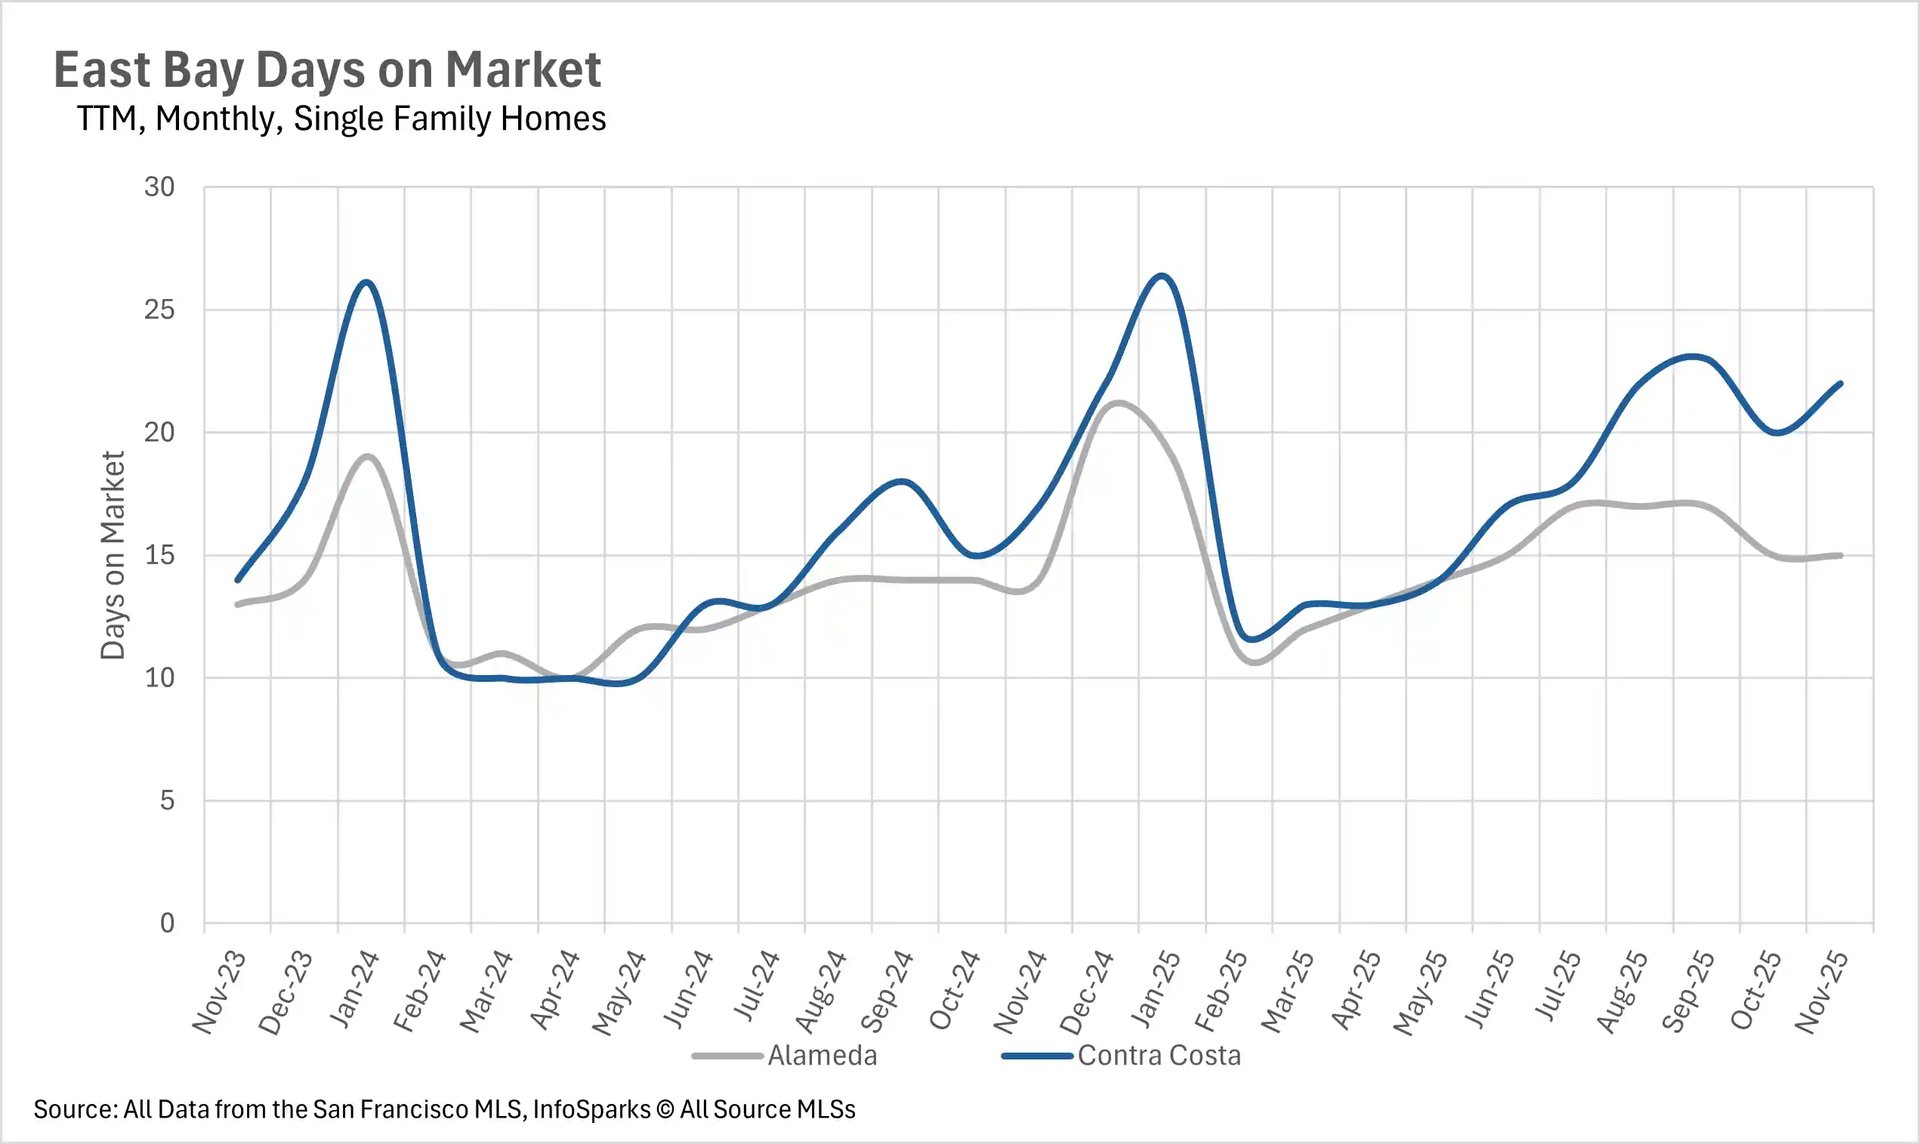
- As inventories remain flat, listings are spending more time on the market.
Note: You can find the charts/graphs for the Local Lowdown at the end of this section.
*National Association of REALTORS® data is released two months behind, so we estimate the most recent month's data when possible and appropriate.
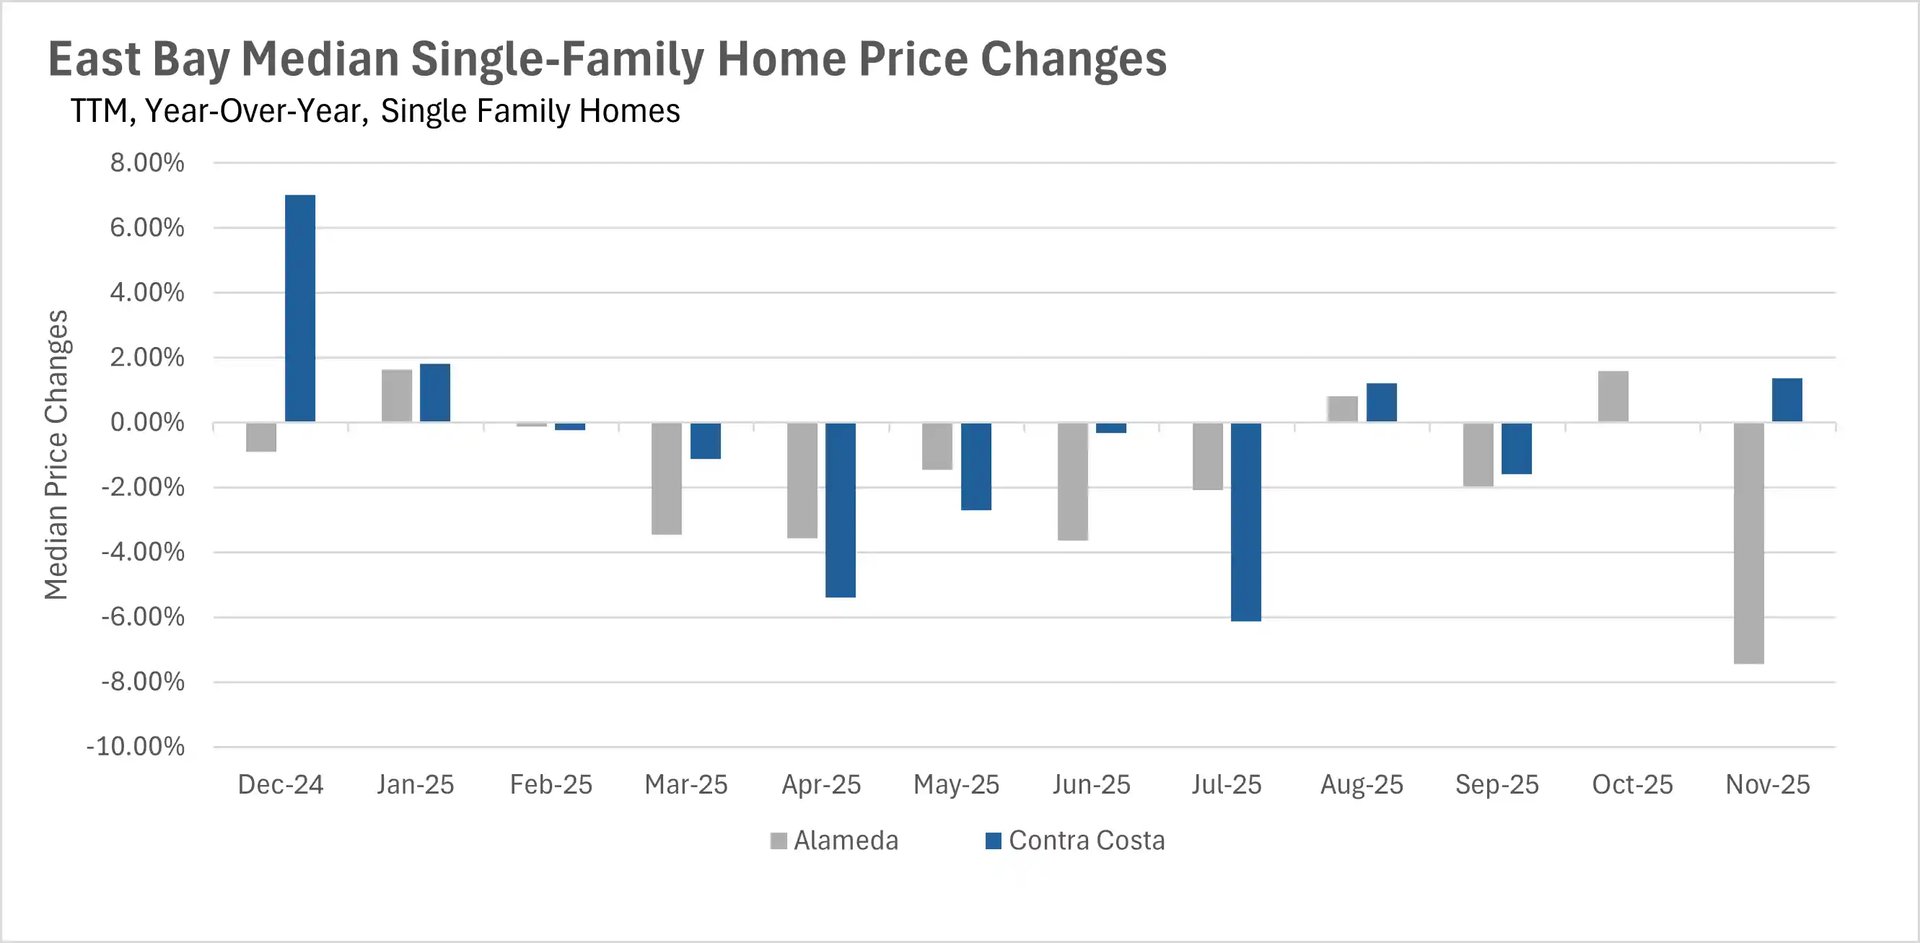
Alameda single-family homes sold for 7.45% less when compared to last year
Although price movements have been fairly muted in the East Bay over the past couple of months, we saw some pretty big swings (mostly to the downside) this month! The median single-family home sold for 7.45% less on a year-over-year basis in Alameda County, whereas it sold for 1.36% more in Contra Costa County. When we turn to the condo market, there were declines in median sale price across the board, with the median condo selling for 4.98% less in Alameda County and 8.14% less in Contra Costa County.
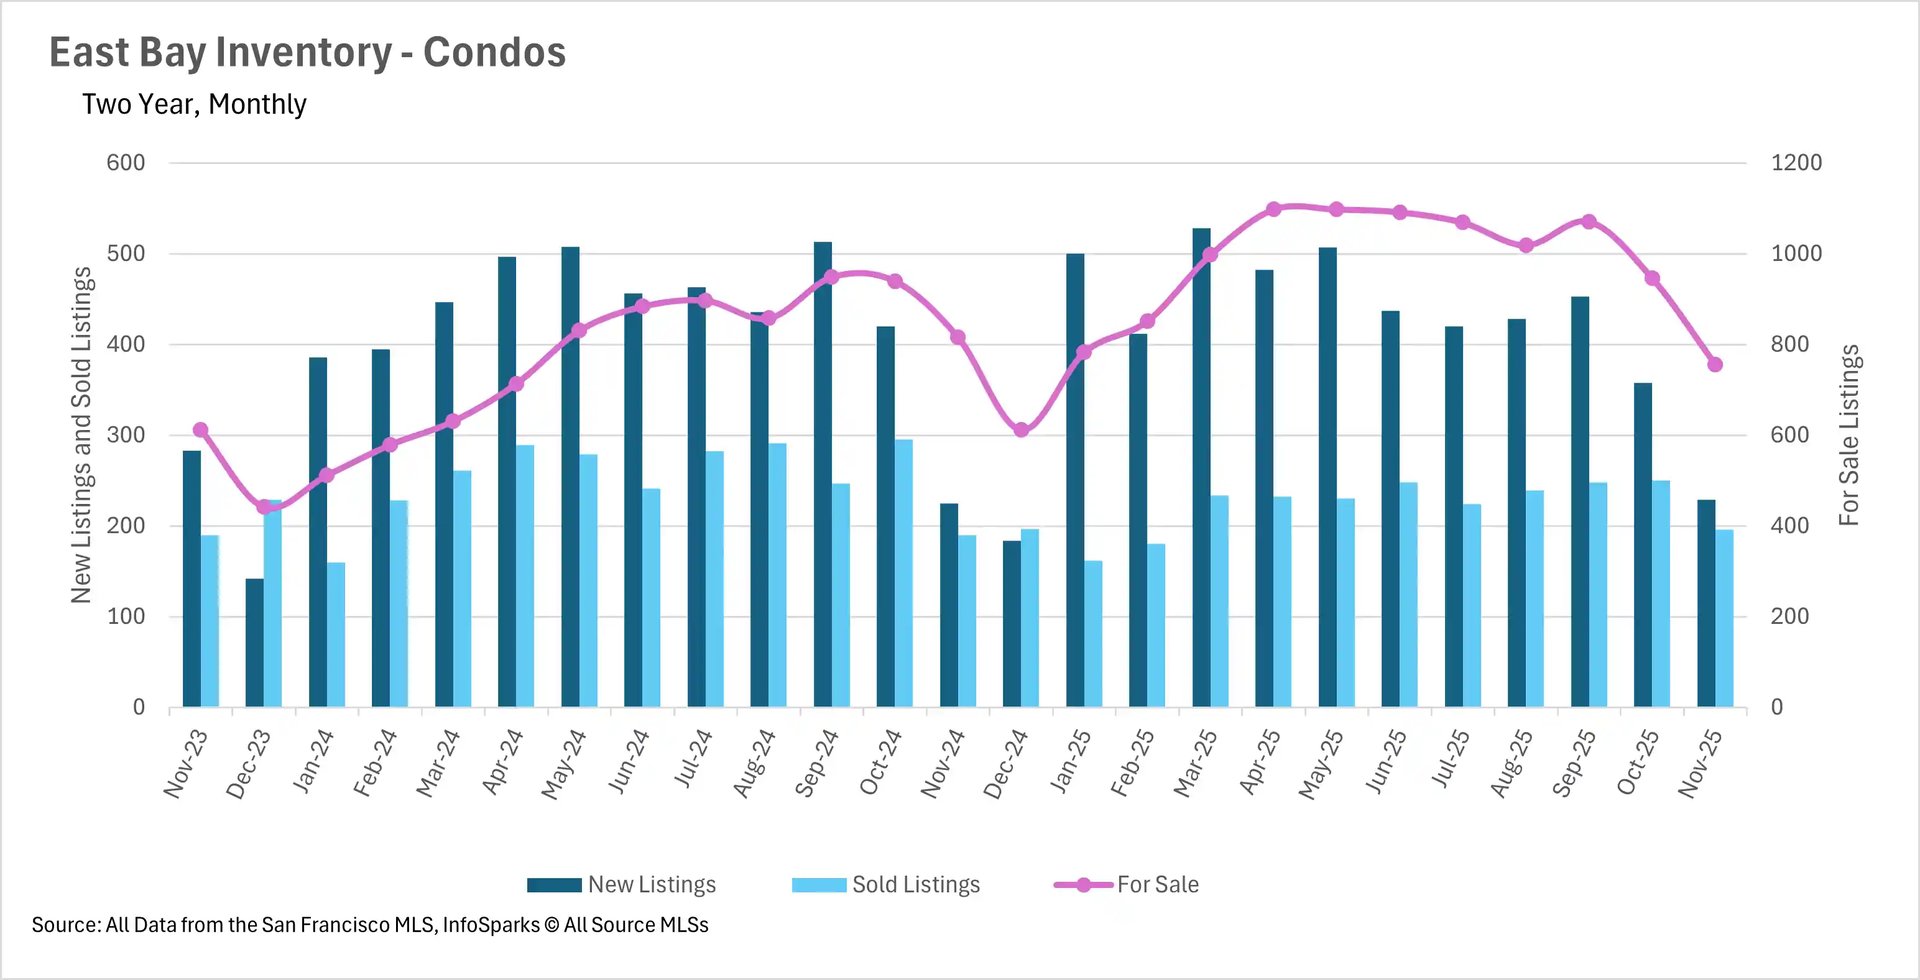
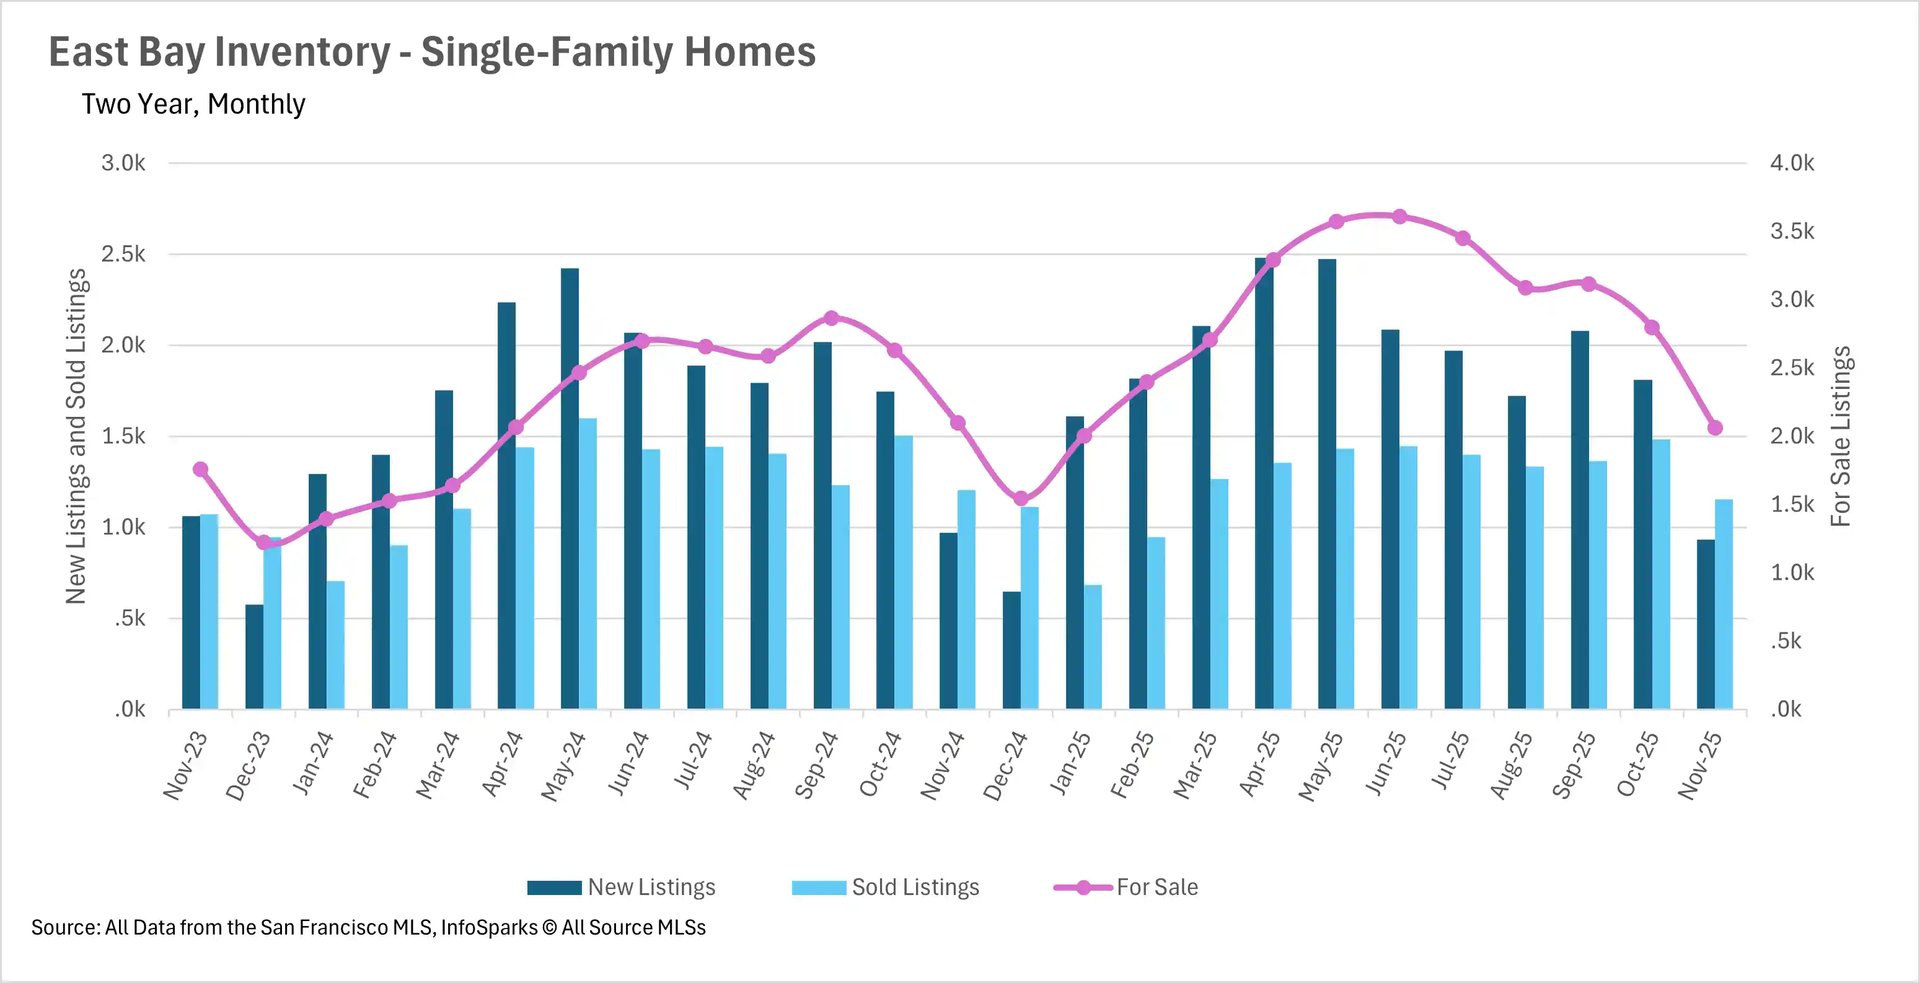
East Bay inventories have remained incredibly resilient
Throughout the late spring and early summer, we saw inventories build throughout California at an incredible rate. Since the beginning of the fall, we’ve seen some pretty big corrections throughout most of the state, as these built-up inventories sell off. However, the East Bay seems to have bucked the trend a bit here, as there hasn’t been a dramatic sell-off. Instead, we’re seeing inventories roughly in line with where they were just a year ago, which is quite remarkable, especially considering the inventory levels we were seeing just a couple of months ago.
Although inventories are flat, days on the market have increased considerably
Although inventories are roughly in line with where they were last year, we’re seeing the average listing spend quite a bit more time on the market. The average condo spent 39.29% and 20.00% more time on the market in Alameda and Contra Costa Counties, respectively. When we turn to the single-family market, we did see some large percentage jumps on a year-over-year basis, but when you look at the total number of days, listings are still moving relatively quickly. However, this is nothing new, as this has largely been the story in the East Bay single-family home market throughout the entire year!
It’s business as usual in the East Bay
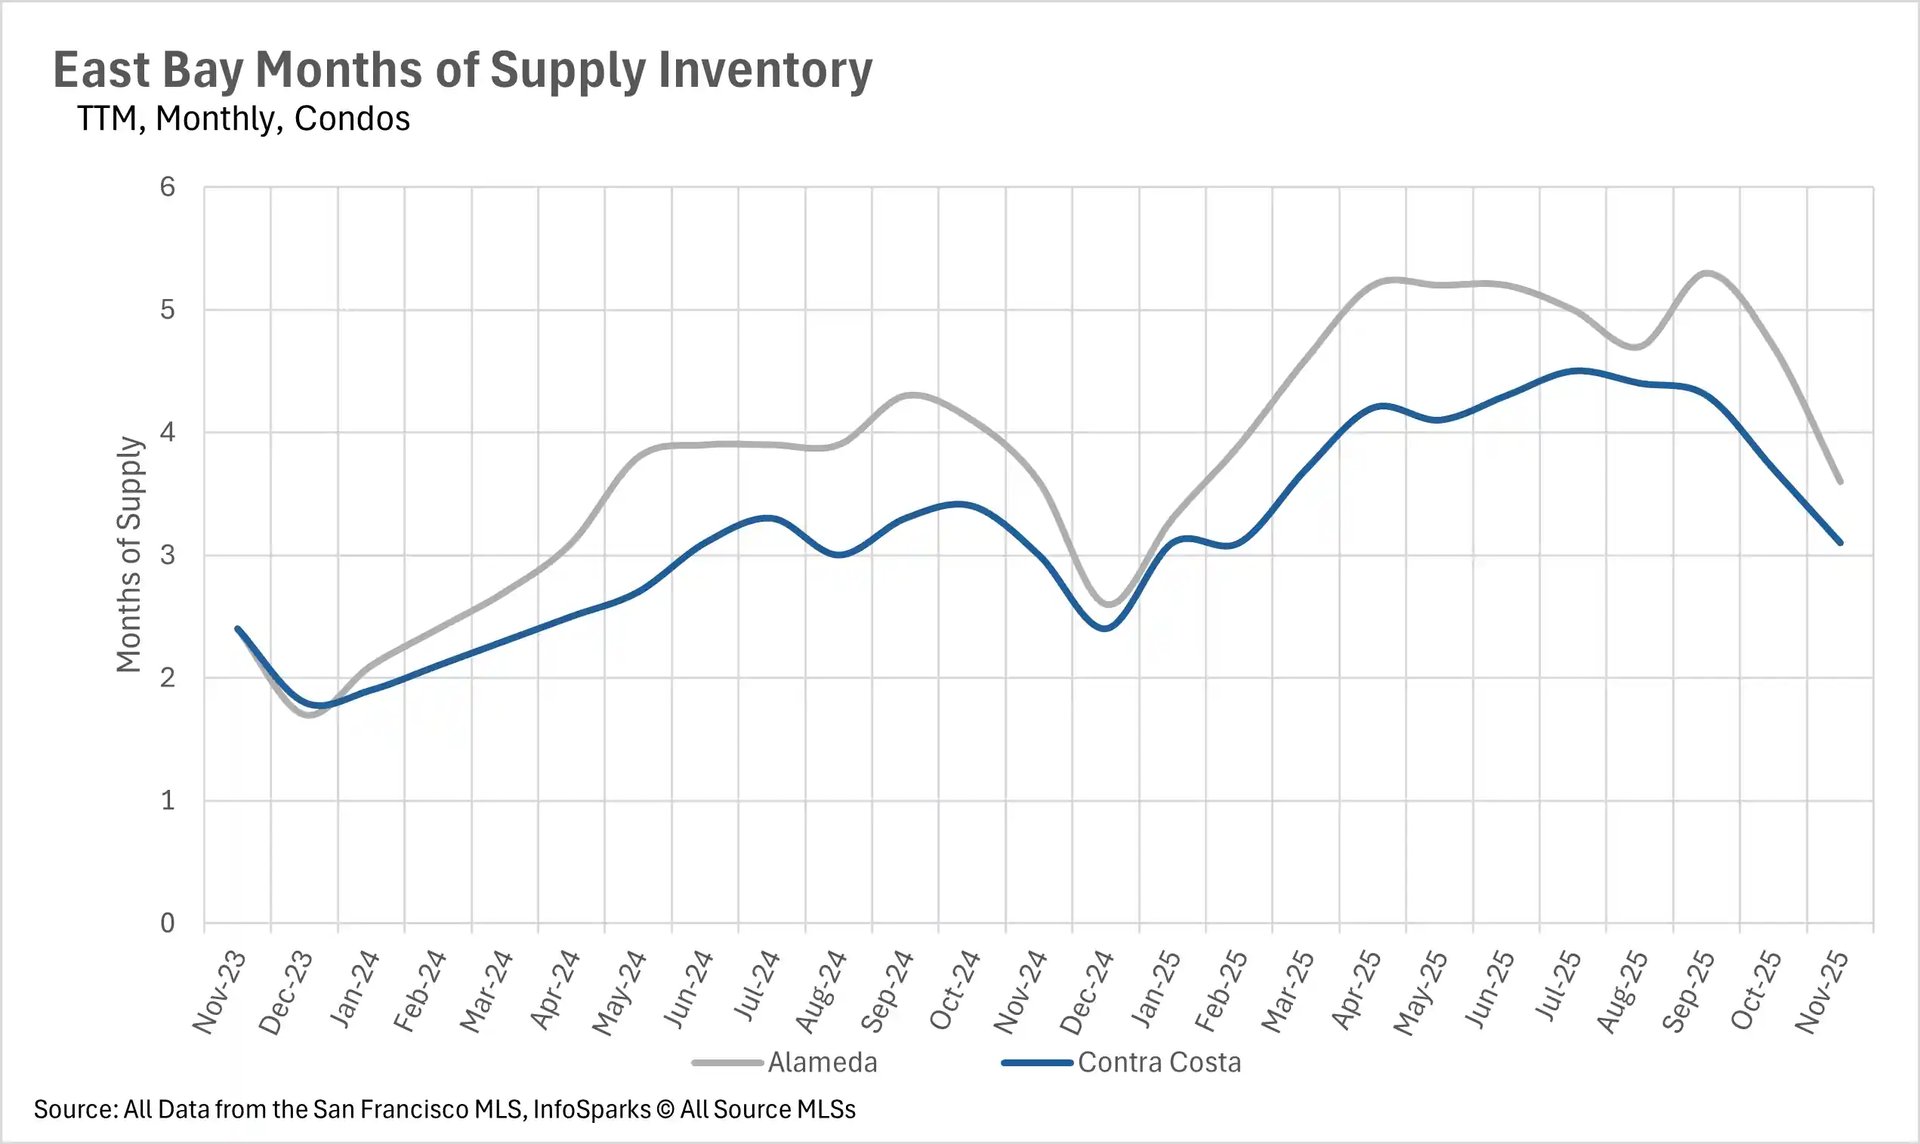
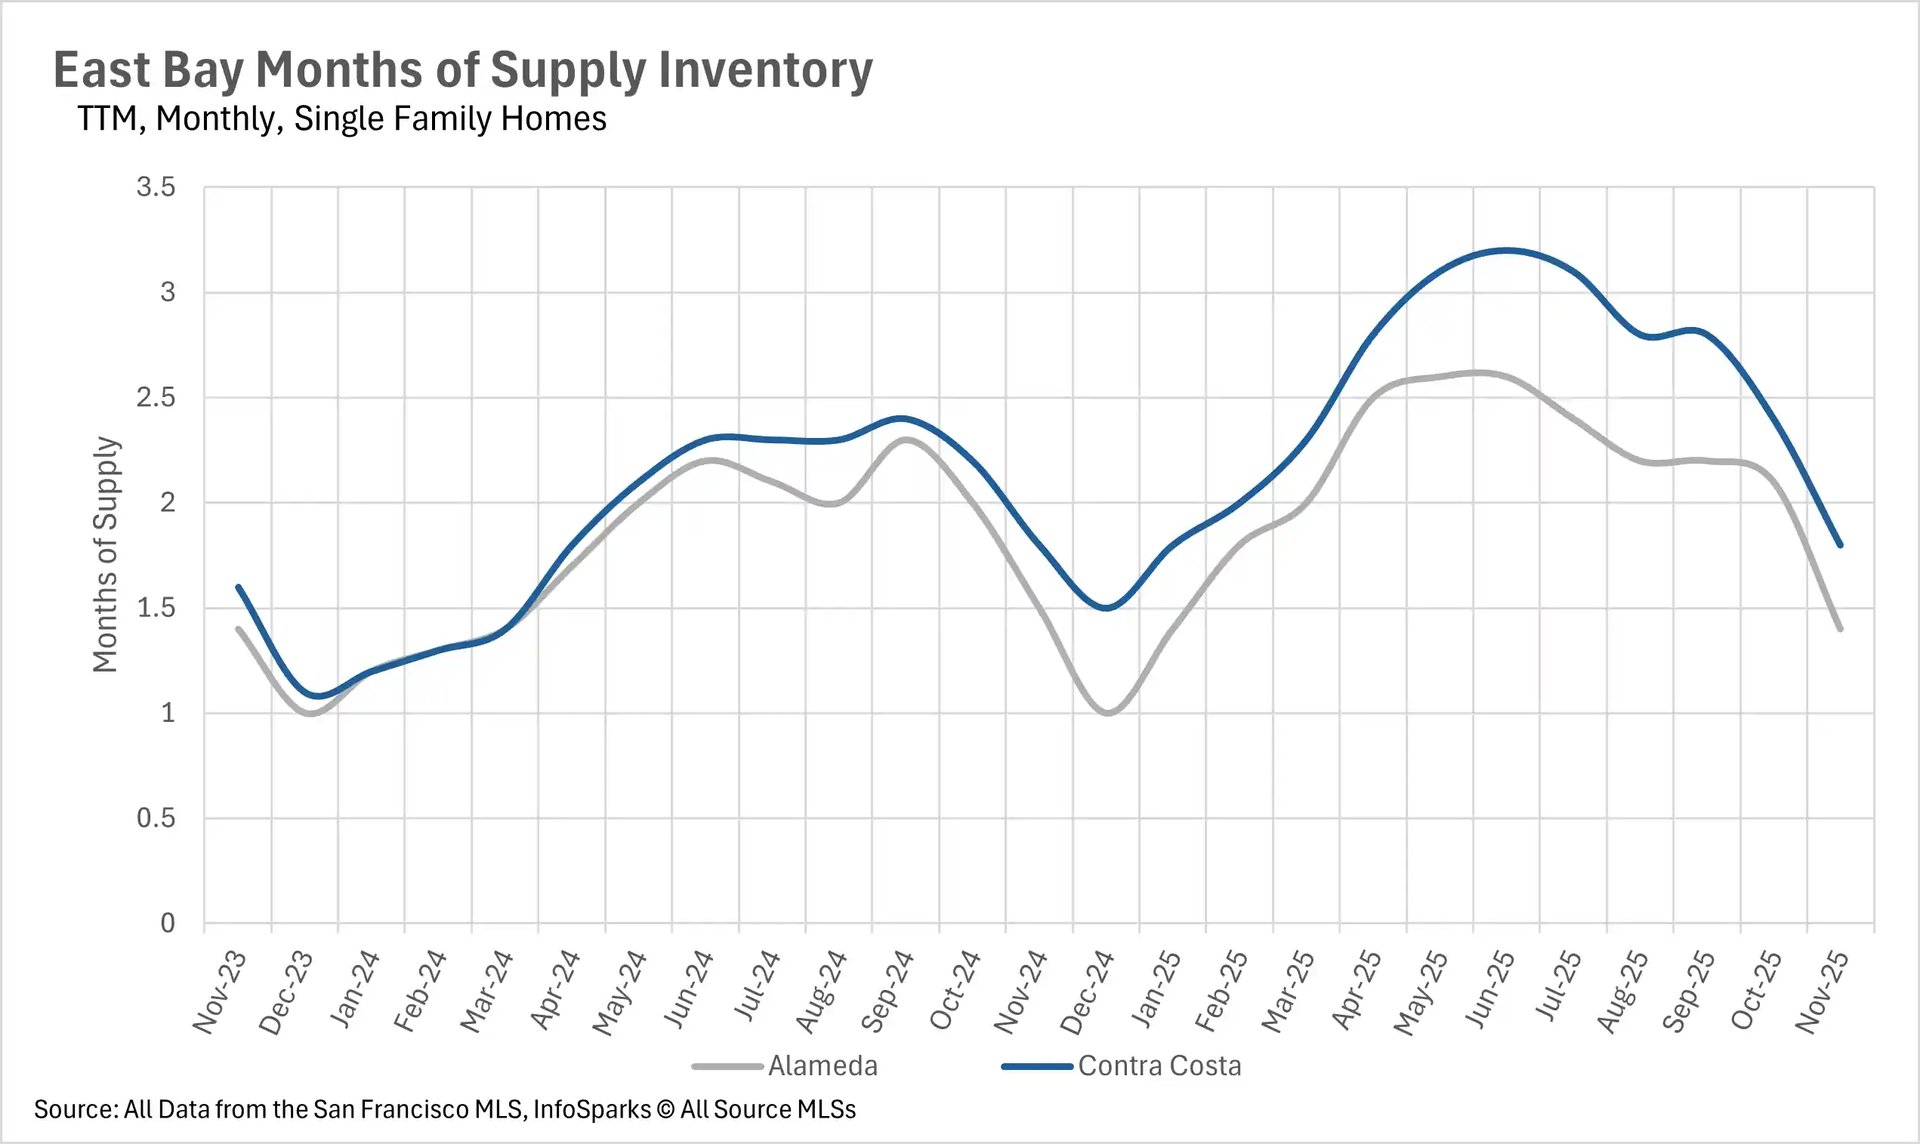
When determining whether a market is a buyers’ market or a sellers’ market, we look to the Months of Supply Inventory (MSI) metric. The state of California has historically averaged around three months of MSI, so any area with at or around three months of MSI is considered a balanced market. Any market that has lower than three months of MSI is considered a sellers’ market, whereas markets with more than three months of MSI are considered buyers’ markets.
In the month of November, we saw very little movement on a year-over-year basis in terms of months of supply on the market. There were 1.4 and 1.8 months of single-family inventory on the market in Alameda and Contra Costa Counties, respectively, putting it firmly into sellers market territory. Whereas the condo market is a buyers market, as there were 3.6 and 3.1 months of inventory on the market in Alameda and Contra Costa Counties, respectively.