Select a Market Report to Read:
The Local Lowdown
Quick Take:
- Median sale prices increased across the board in the single-family home market in August.
- Single-family home inventory levels are actually lower on a year-over-year basis for the first time in months.
- Single-family home listings continue to be snapped up at a breakneck pace.
Note: You can find the charts/graphs for the Local Lowdown at the end of this section.
*National Association of REALTORS® data is released two months behind, so we estimate the most recent month's data when possible and appropriate.
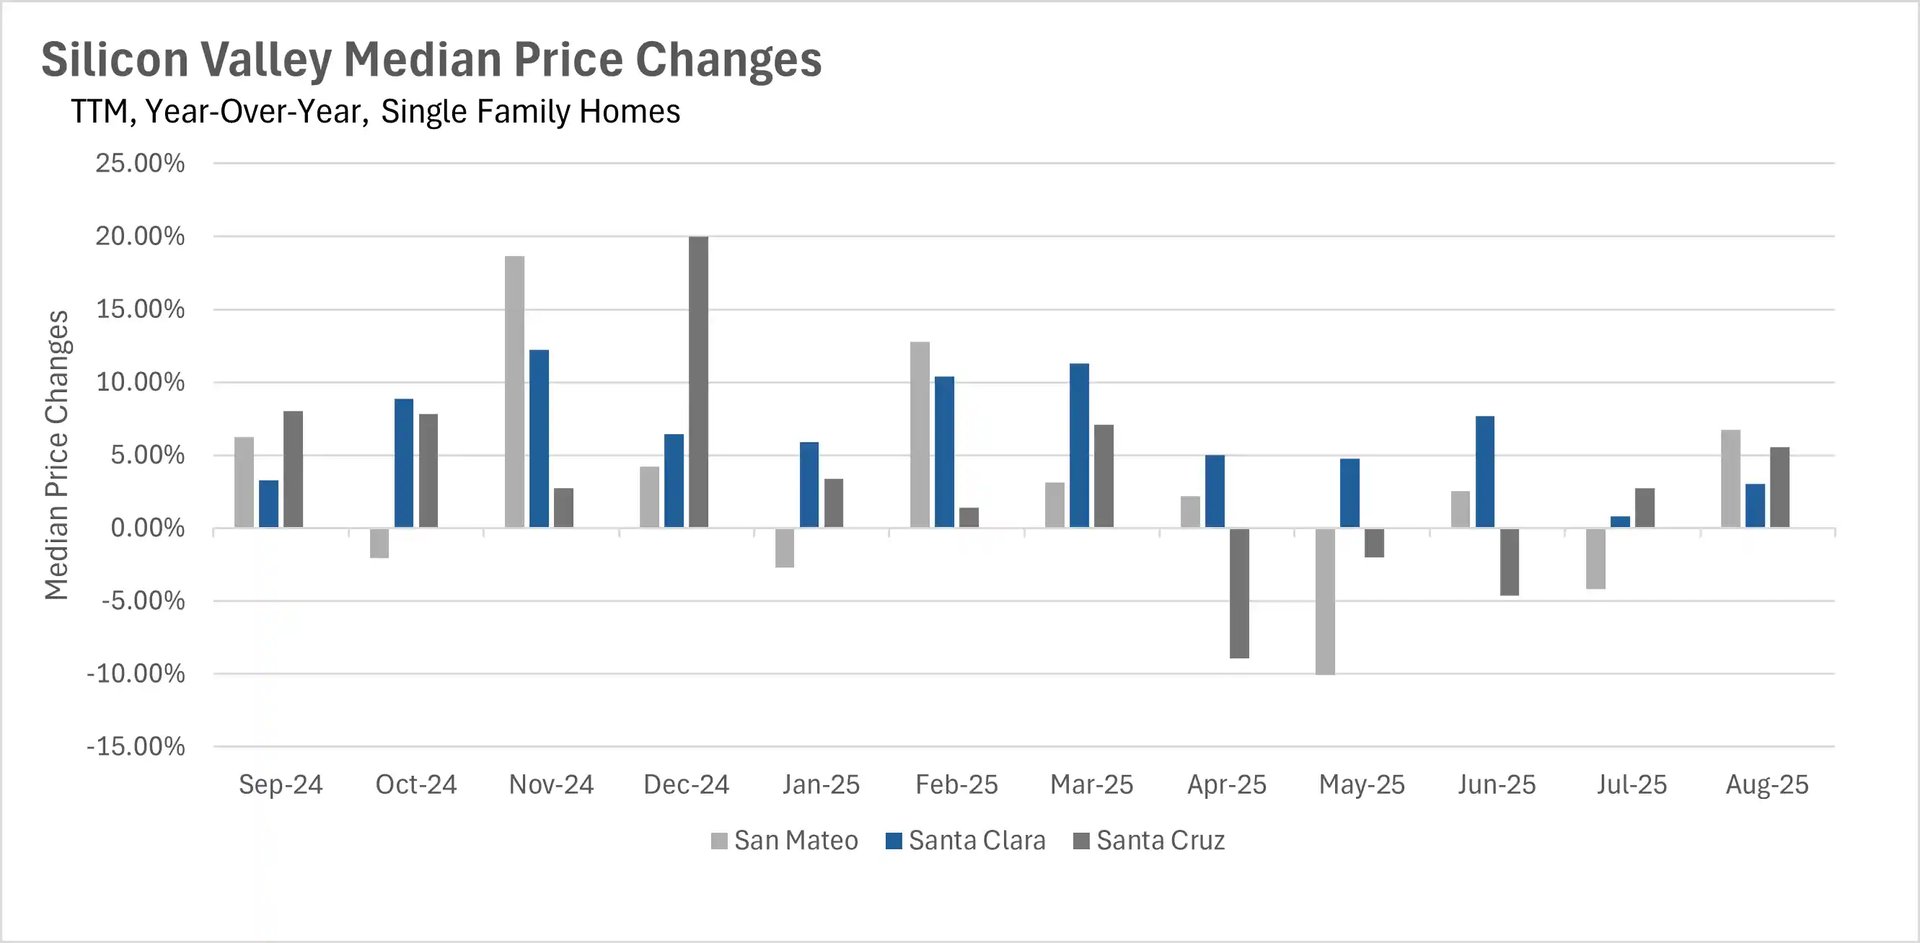
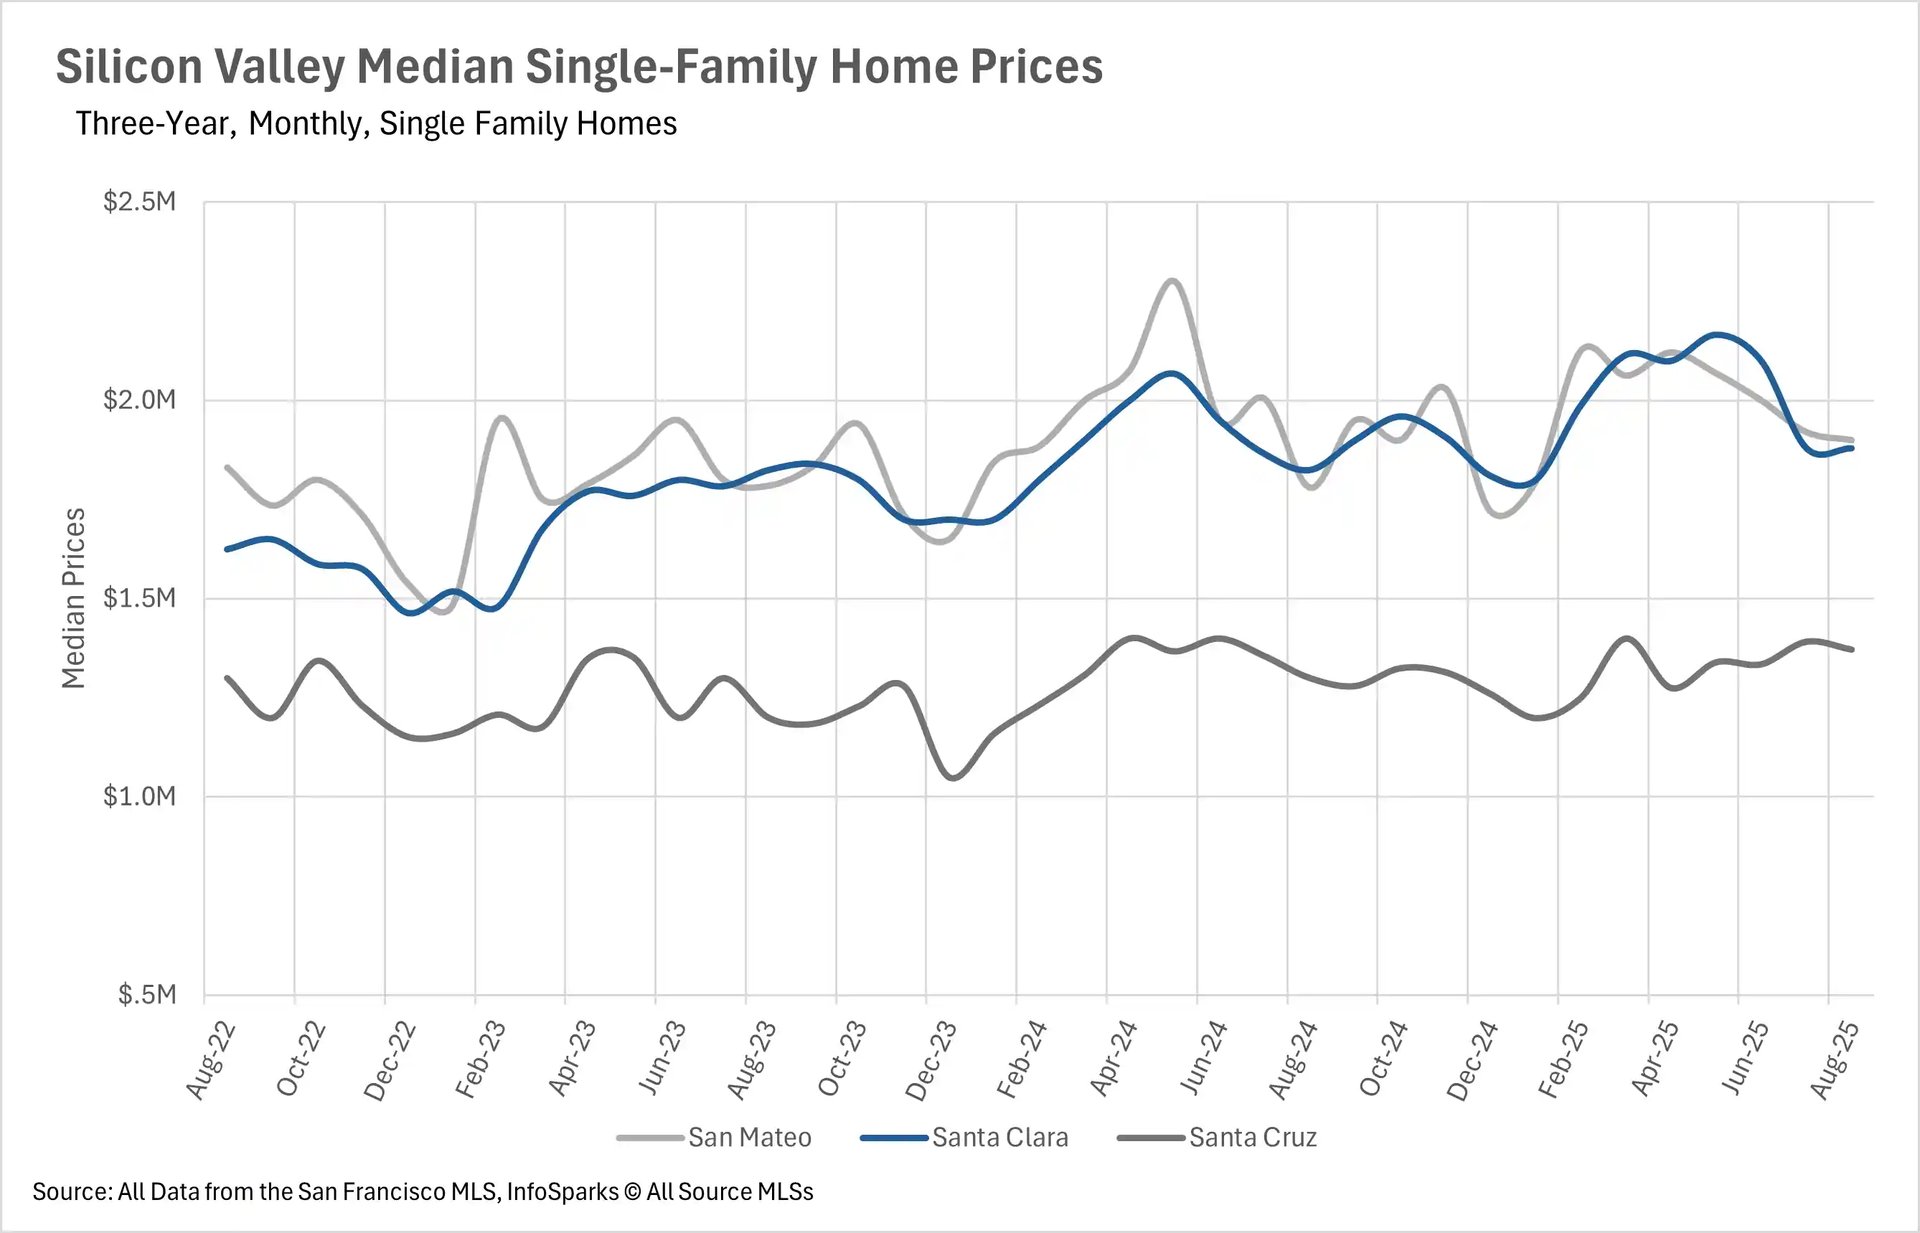
Single-family median sale prices increased across the board for the first time in four months
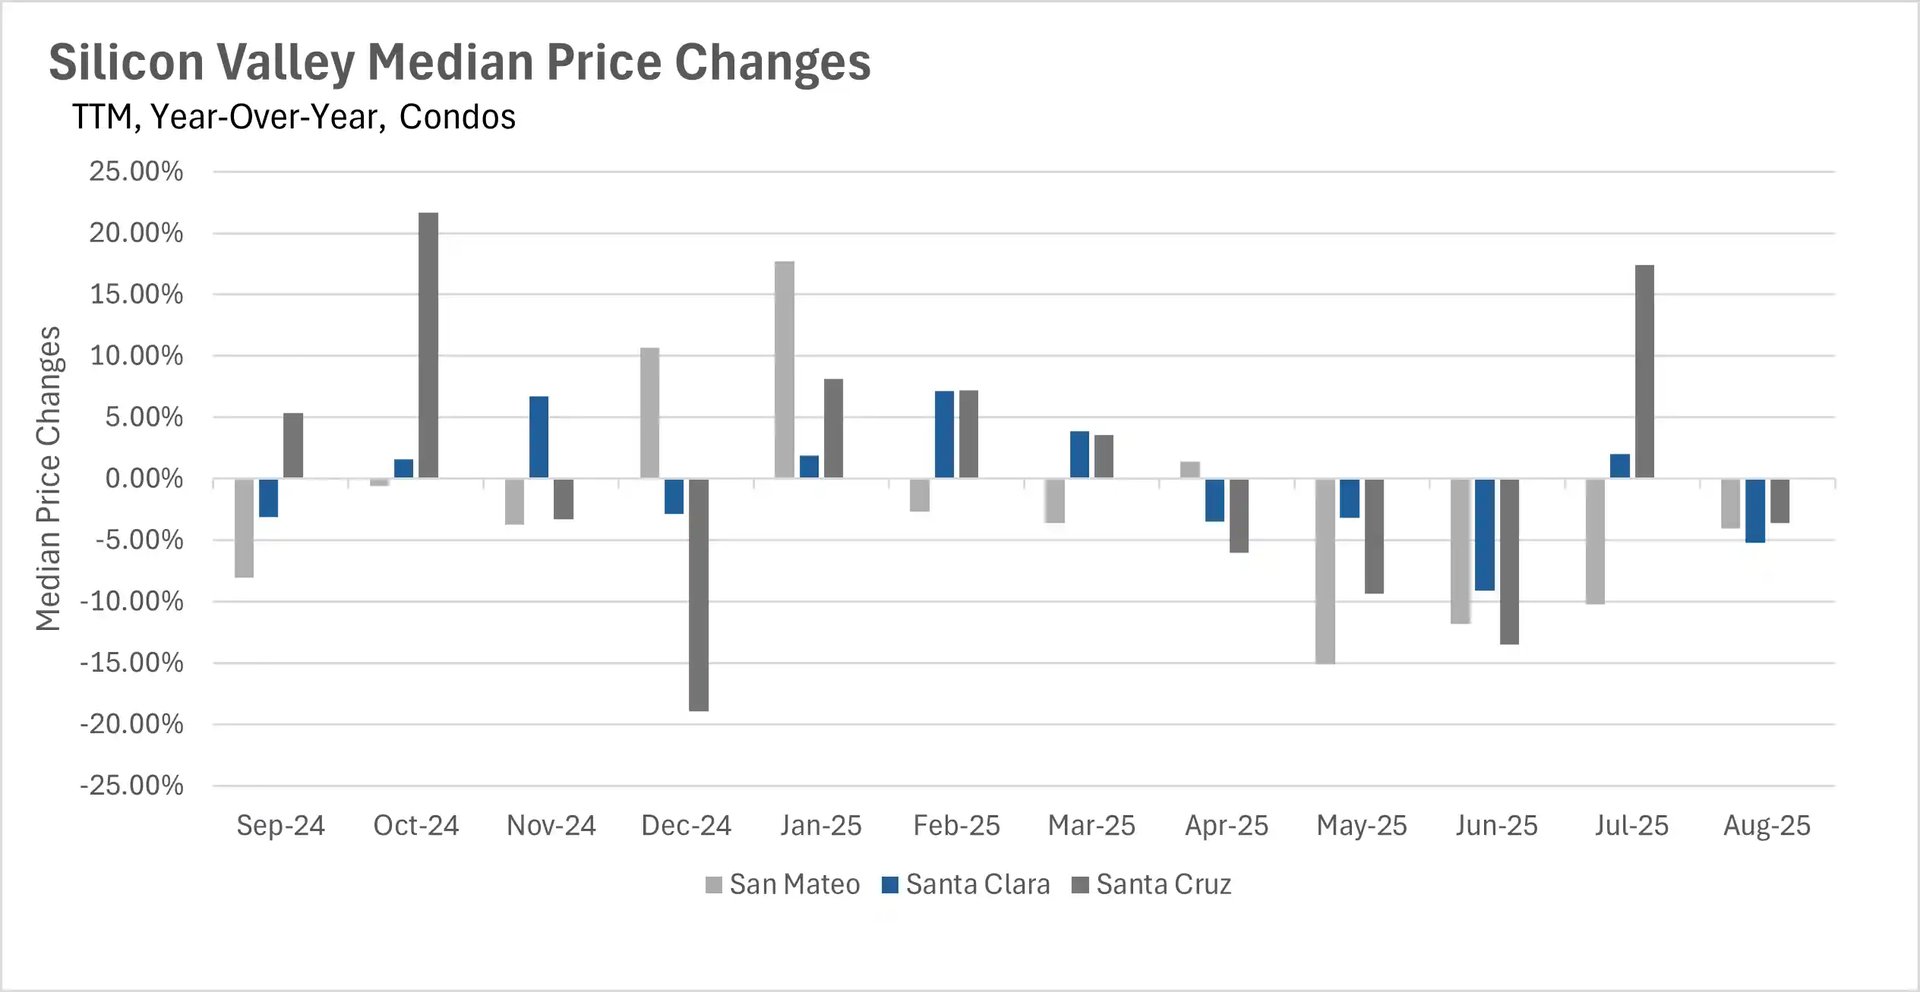
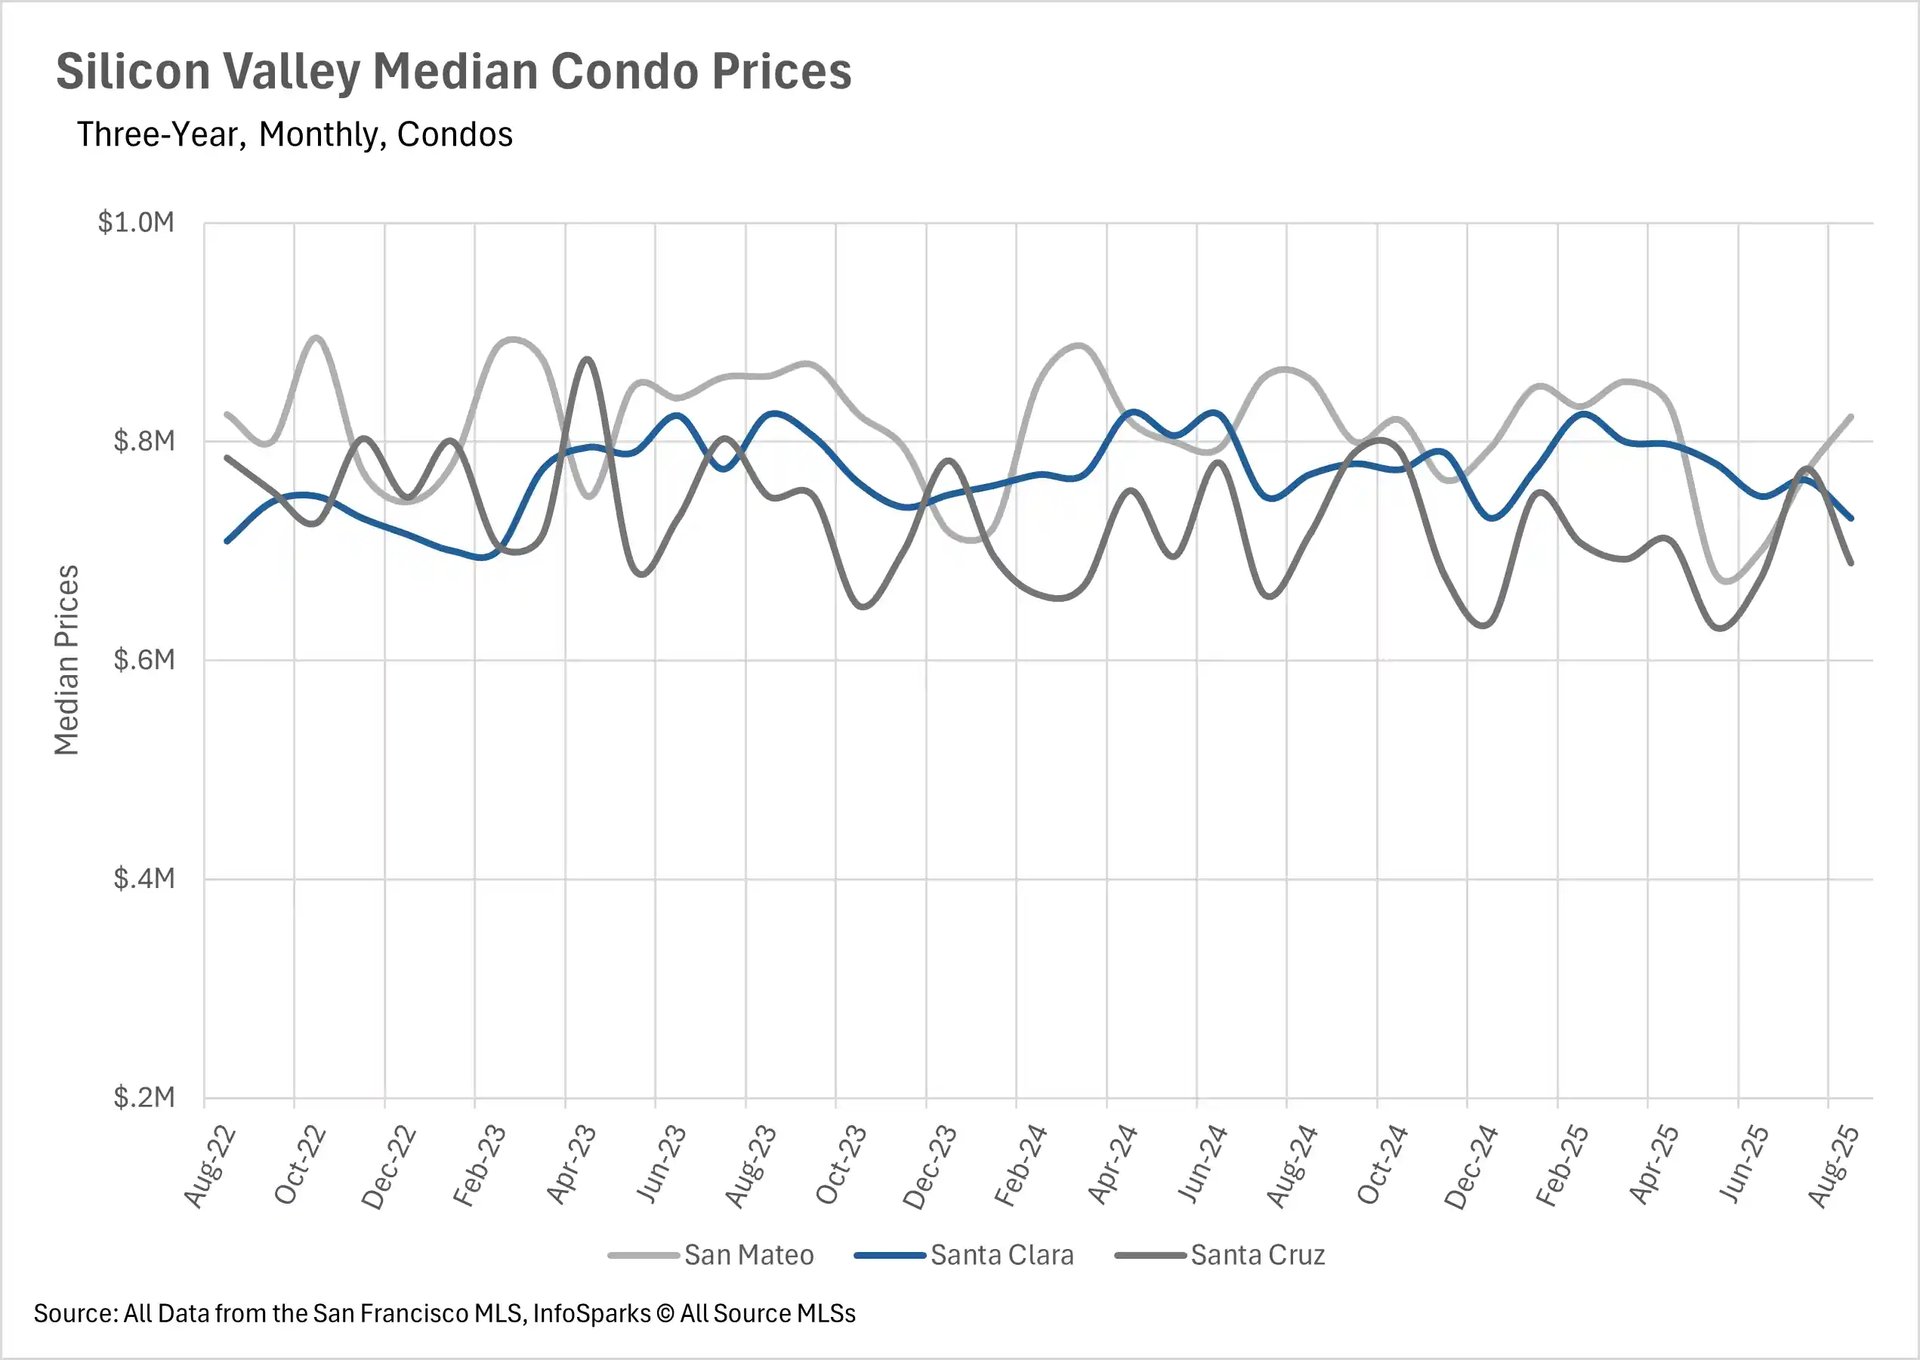
In recent years, Silicon Valley has been one of the strongest markets in terms of price appreciation. However, over the past few months, there has been quite a bit of softness, as certain counties saw their first year-over-year price declines in over a year. However, in August, we saw price appreciation across the board in the single-family home market, with median sale prices increasing by 3.01%, 5.54%, and 6.74% in Santa Clara, Santa Cruz, and San Mateo Counties, respectively. Unfortunately, the same cannot be said for the condo market, though, as we saw year-over-year decreases in median sale price across the board. Median sale prices decreased by 3.64% in Santa Cruz County, 4.02% in San Mateo County, and 5.20% in Santa Clara County, on a year-over-year basis.
Inventories for single-family homes made an unexpected reversal in August
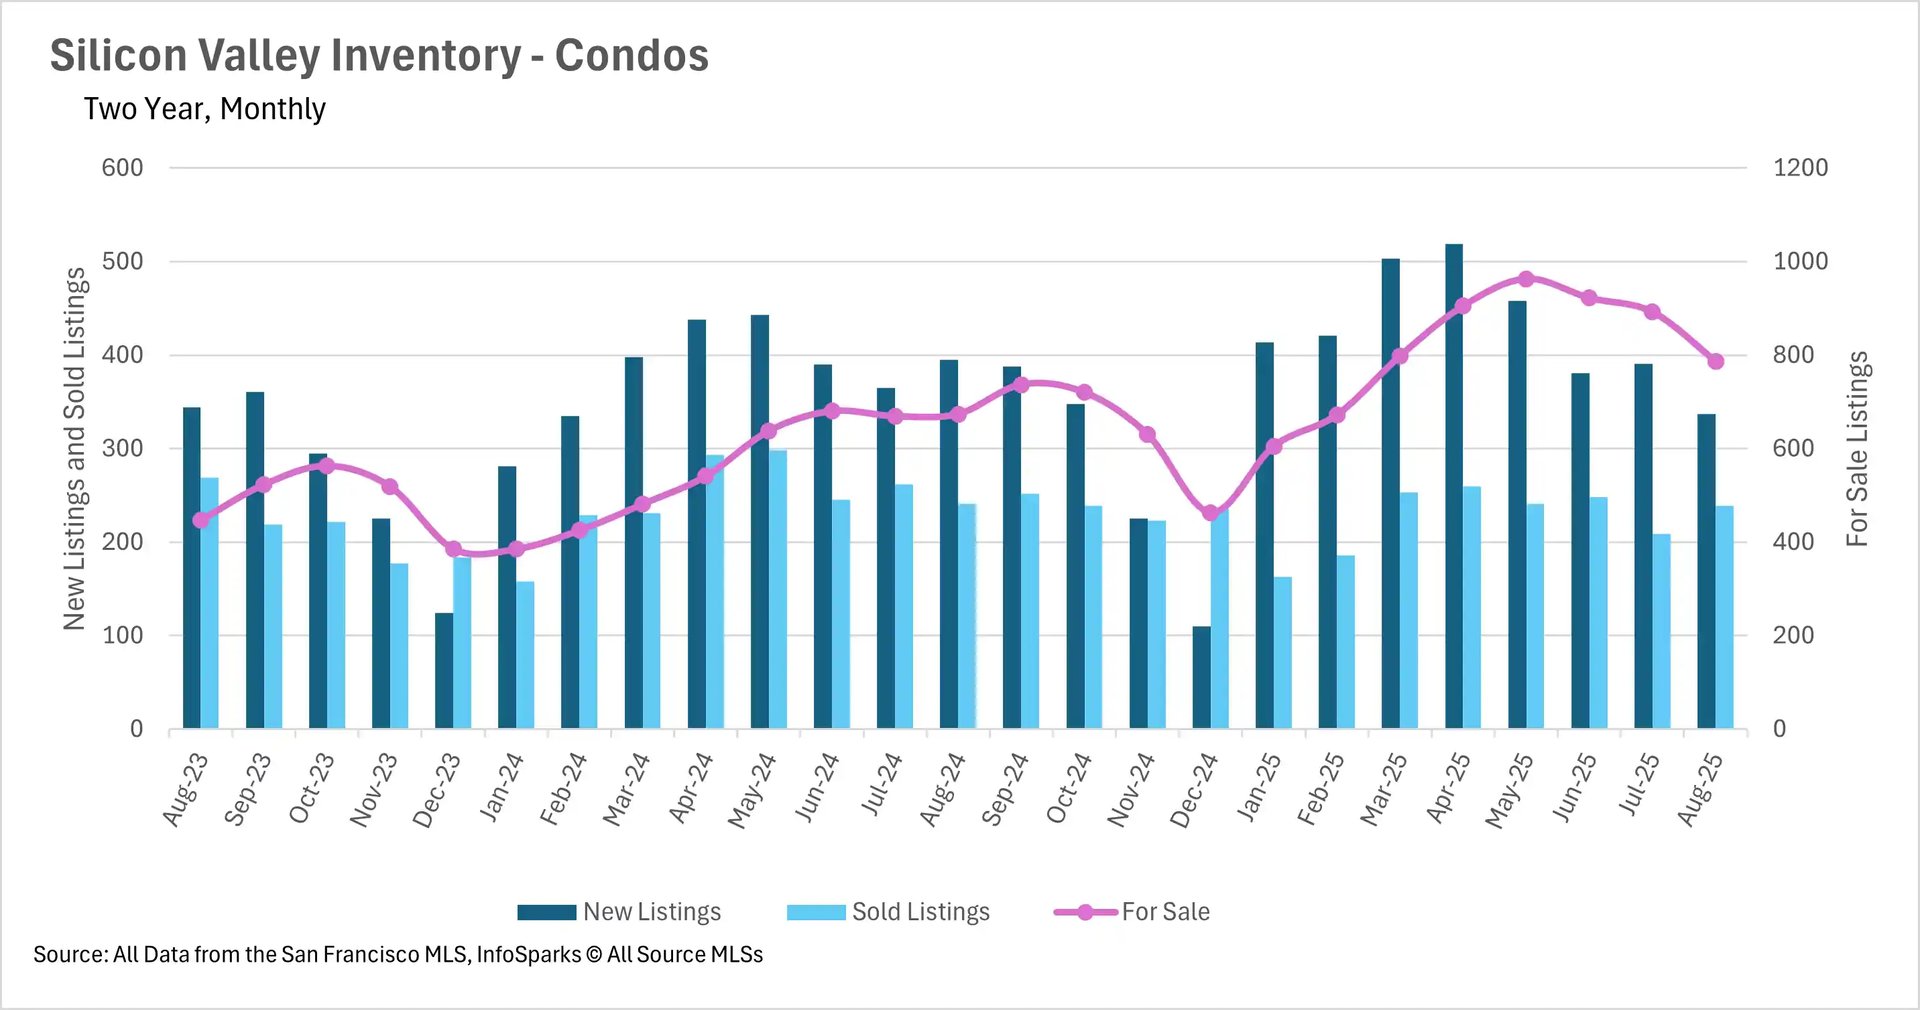
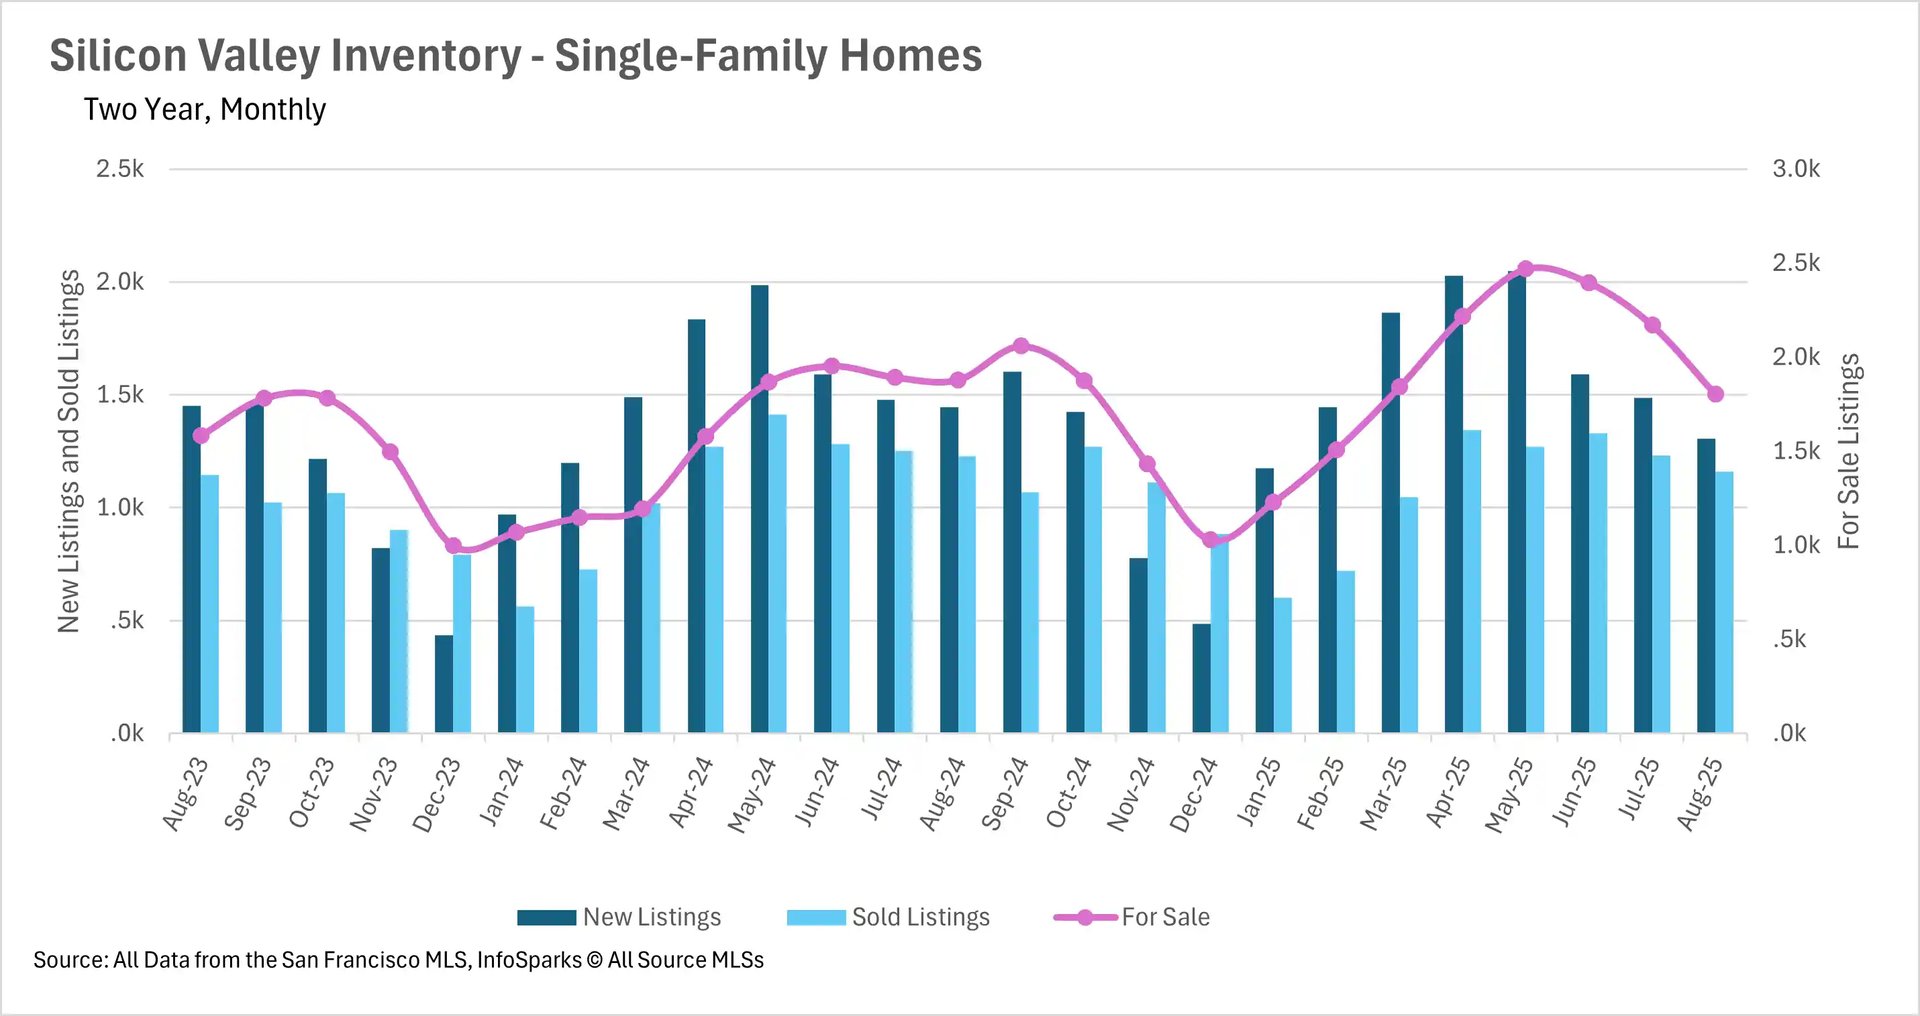
Inventories have been building throughout California, starting in late spring and continuing throughout the early summer, resulting in many areas having considerably more inventory on the market on a year-over-year basis. However, inventories began to normalize in the back half of the summer, with the Silicon Valley single-family home market making a full reversal in August. In fact, Silicon Valley ended August with 4.04% fewer active single-family listings on the market when compared to last year! The condo market has not made this same recovery, but it is on the same trajectory, with 16.77% more inventory on the market than this time last year - a drastic decrease when compared to prior months.
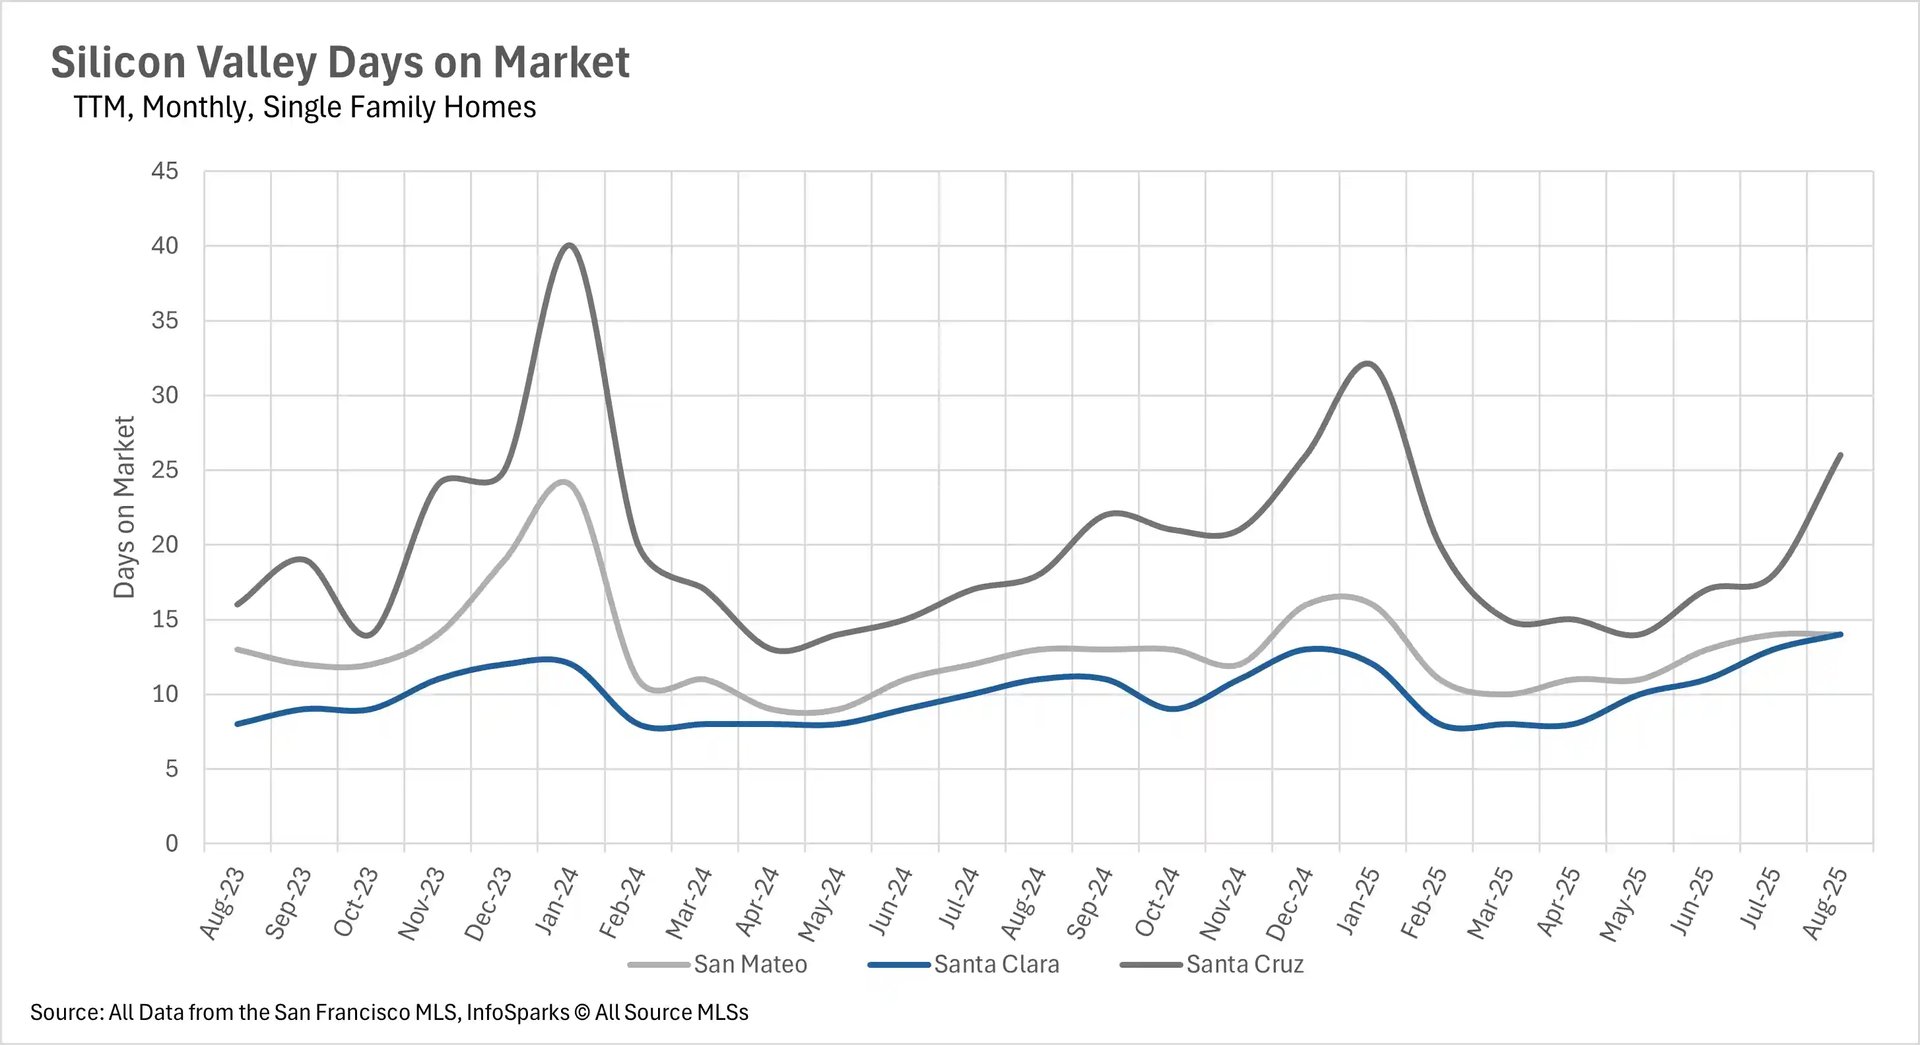
Most single-family home listings spend just two weeks on the market
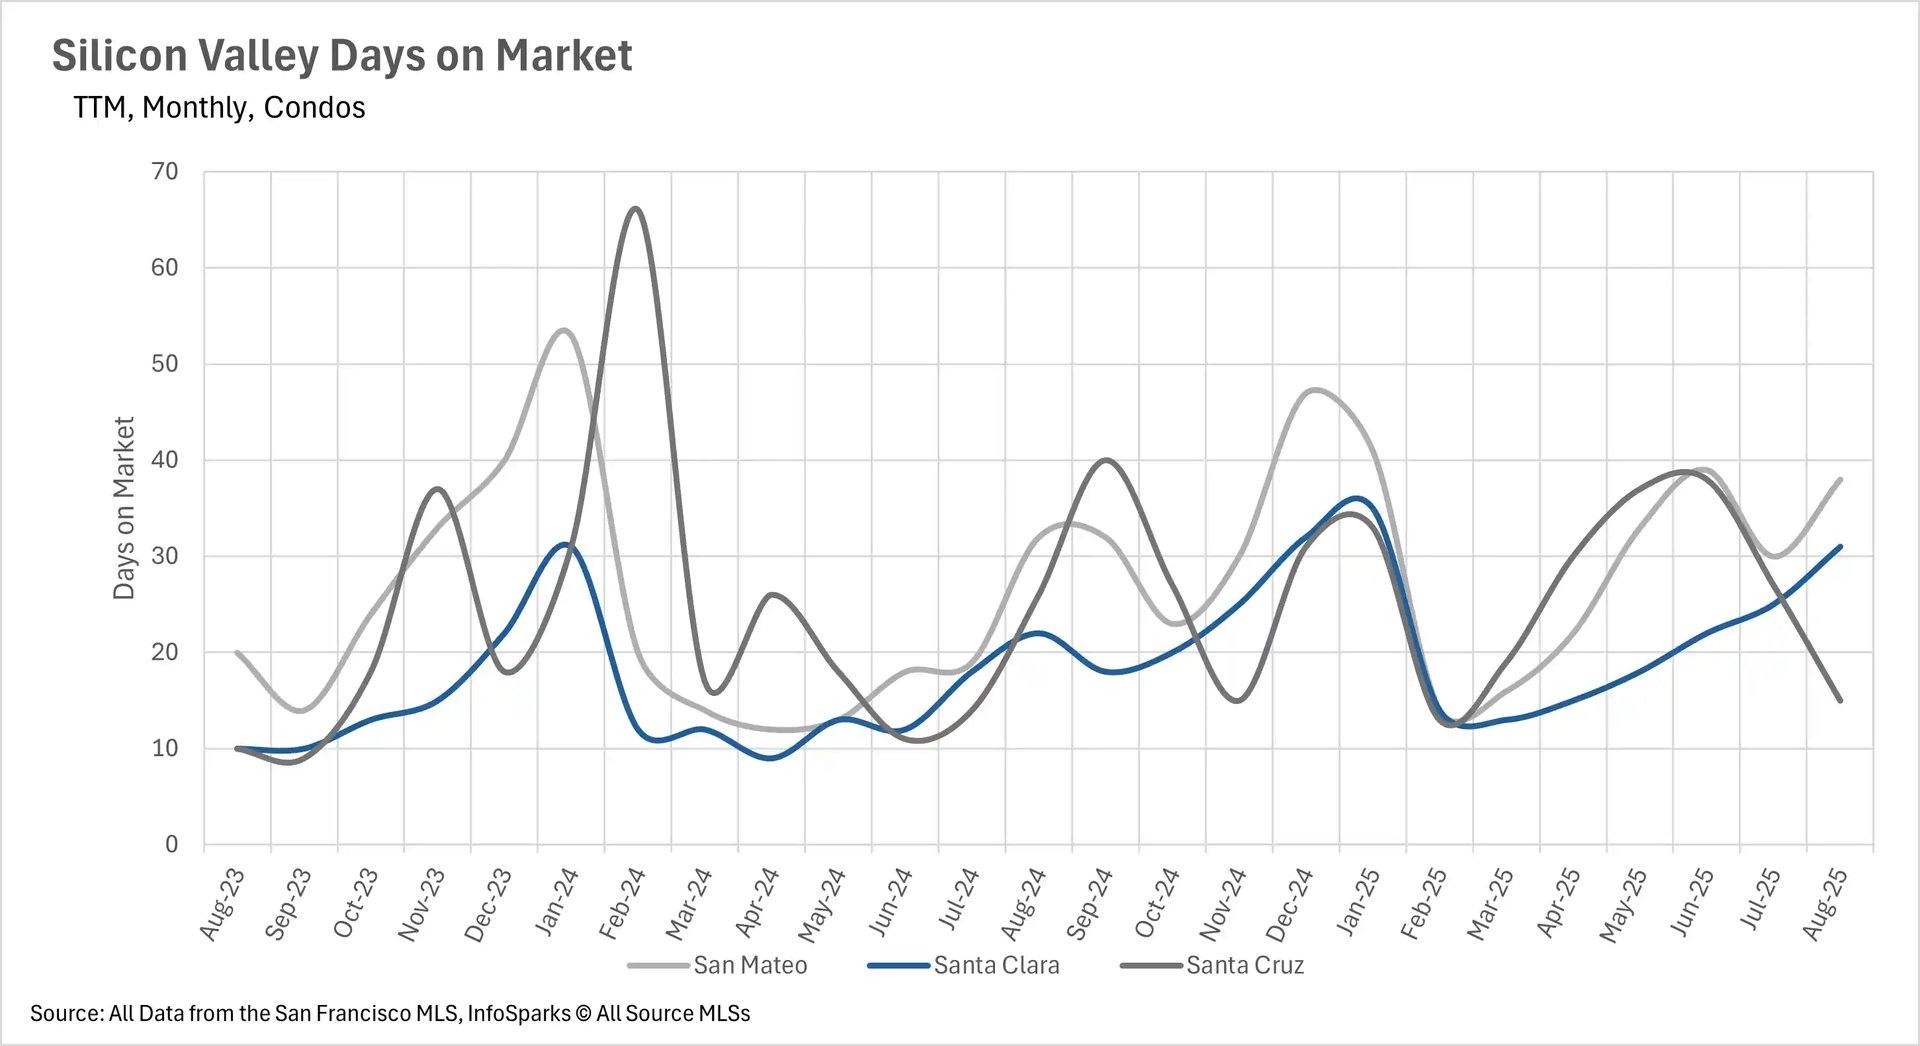
Although single-family homes are spending quite a bit more time on the market on a percentage basis when you compare to last year, on an absolute basis, they’re still moving incredibly quickly. The average single-family listing in San Mateo and Santa Clara Counties spends just 14 days on the market, and the average listing in Santa Cruz County spends 26 days on the market. When we look to the condo market, things generally move a bit slower, with the average condo in Santa Clara County spending 31 days on the market, and the average condo in San Mateo County spending 38 days on the market. Santa Cruz County bucks the trend here, with the average condo spending just 15 days on the market.
The San Mateo and Santa Clara County single-family home markets are tremendously competitive
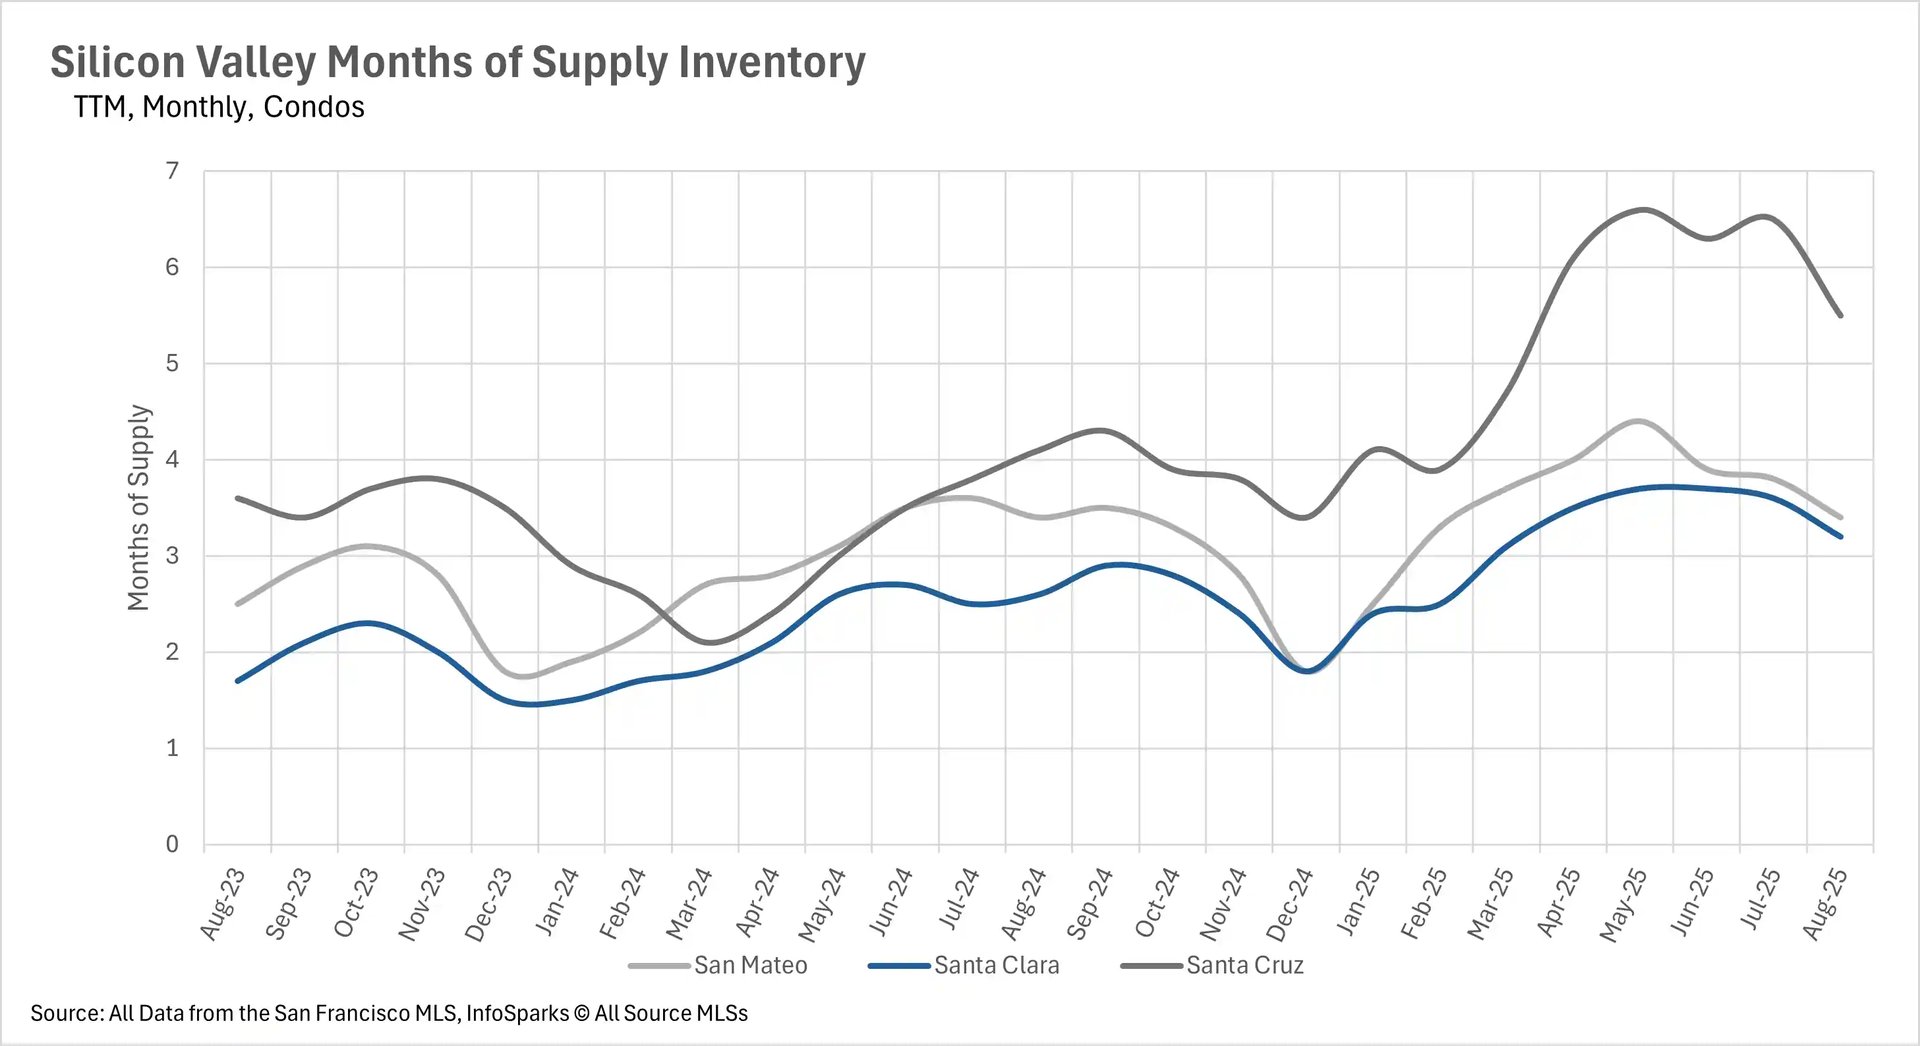
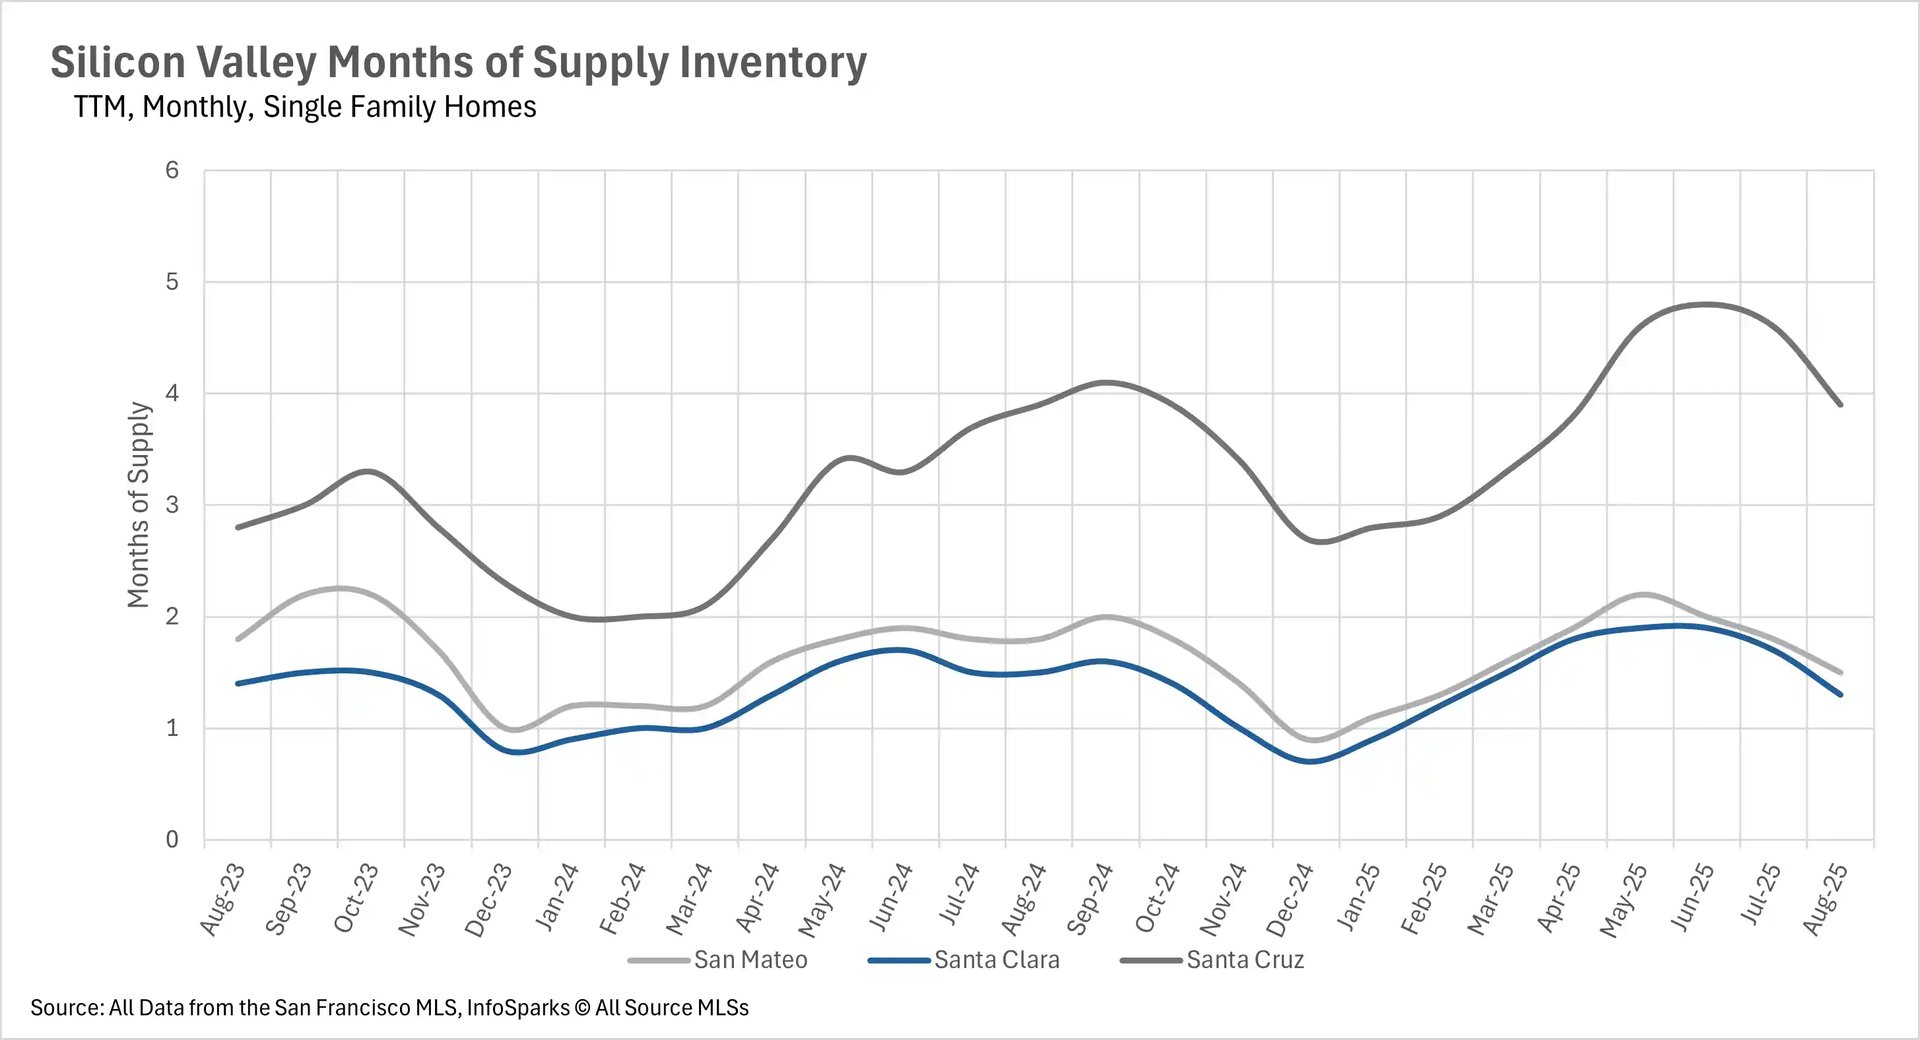
When determining whether a market is a buyers’ market or a sellers’ market, we look to the Months of Supply Inventory (MSI) metric. The state of California has historically averaged around three months of MSI, so any area with at or around three months of MSI is considered a balanced market. Any market that has lower than three months of MSI is considered a seller’s market, whereas markets with more than three months of MSI are considered buyers’ markets.
Few markets are more competitive than the San Mateo and Santa Cruz County single-family markets. These markets have just 1.5 and 1.3 months of inventory, respectively. On the flip side, the Santa Cruz County single-family home market is a buyer's market, with 3.9 months of inventory on the market. Likewise, the entire condo market is a buyer's market, with 3.4 months of inventory on the market in San Mateo County, 3.2 months in Santa Clara County, and 5.5 months in Santa Cruz County.