Select a Market Report to Read:
The Local Lowdown
Quick Take:
- The single-family home market remains relatively strong, with year-over-year growth in most counties.
- Inventory levels have seemed to normalize, as they drop dramatically from their summertime highs.
- Although inventories are normalizing, listings are still spending more time on the market on a year-over-year basis.
Note: You can find the charts/graphs for the Local Lowdown at the end of this section.
*National Association of REALTORS® data is released two months behind, so we estimate the most recent month's data when possible and appropriate.
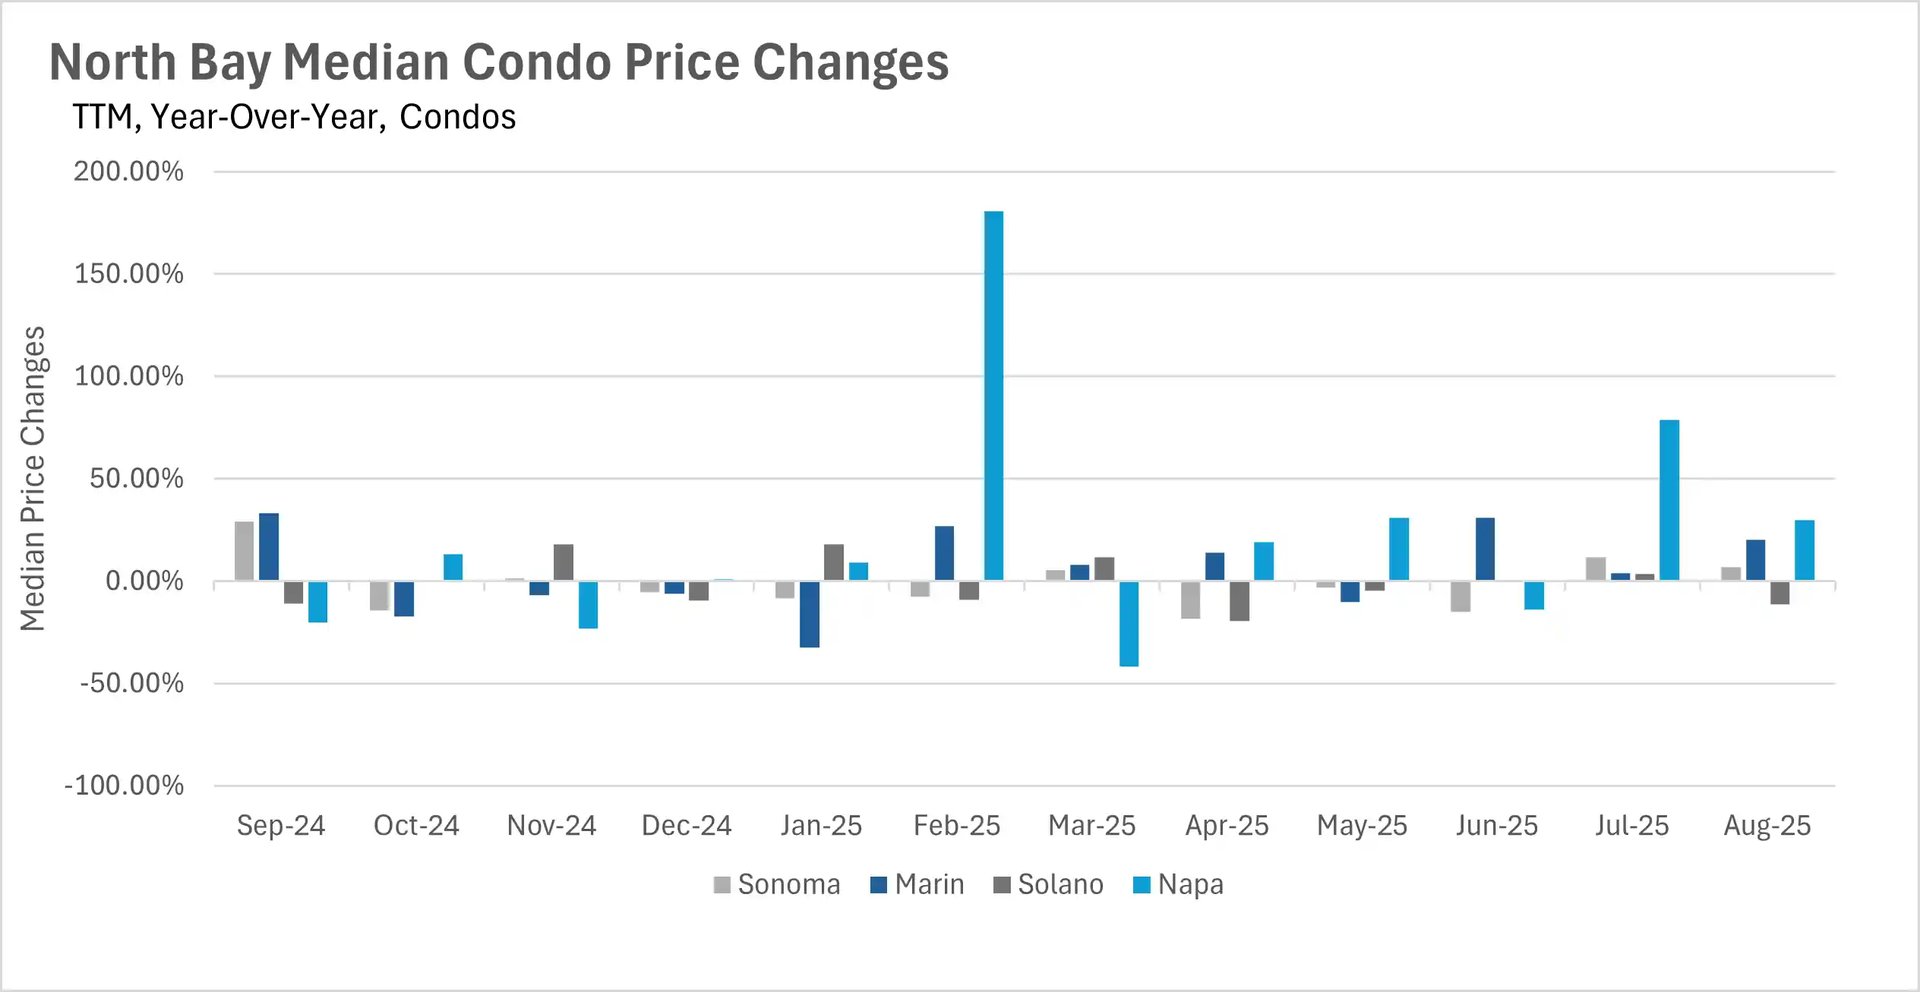
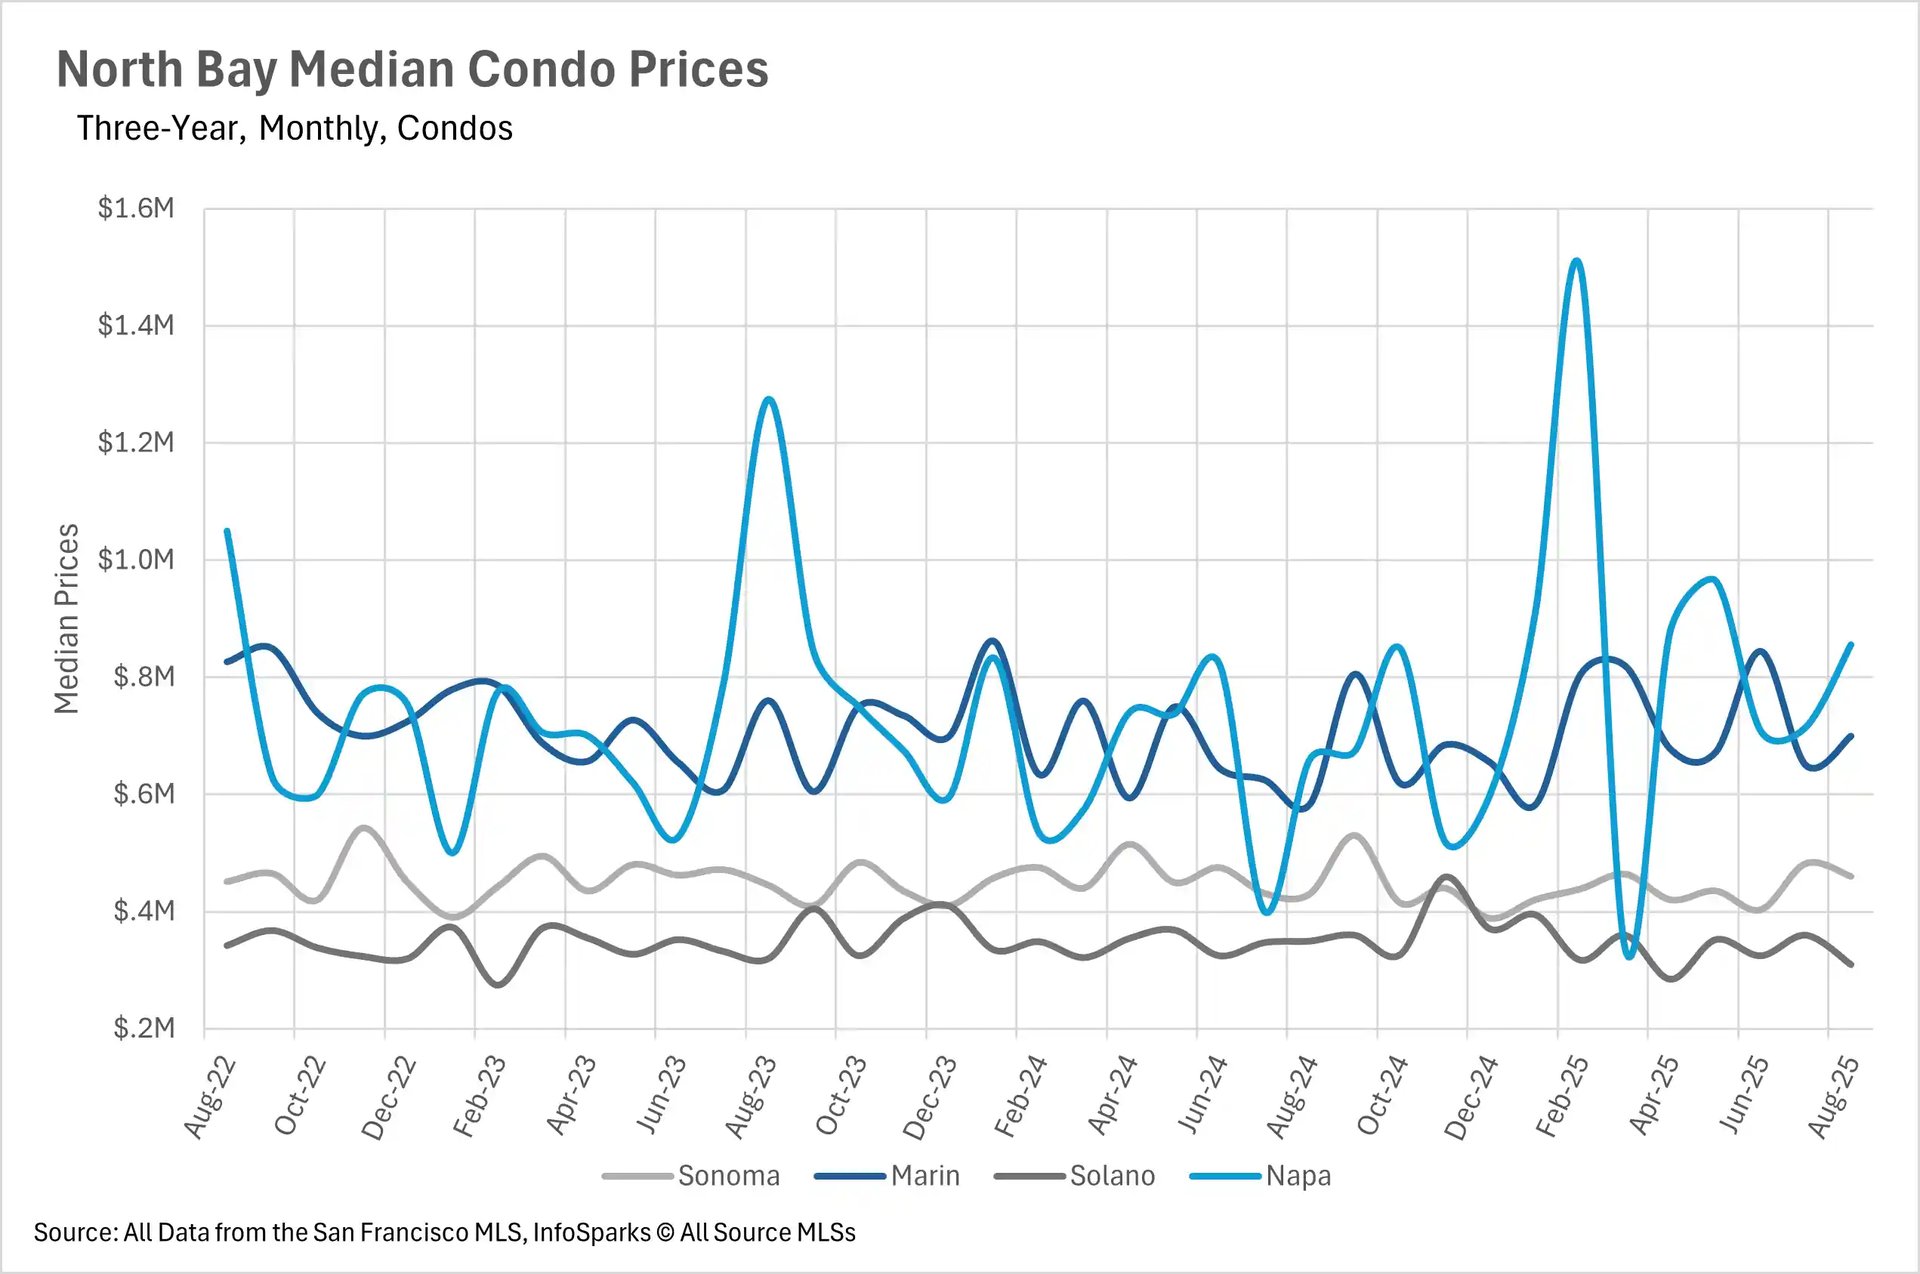
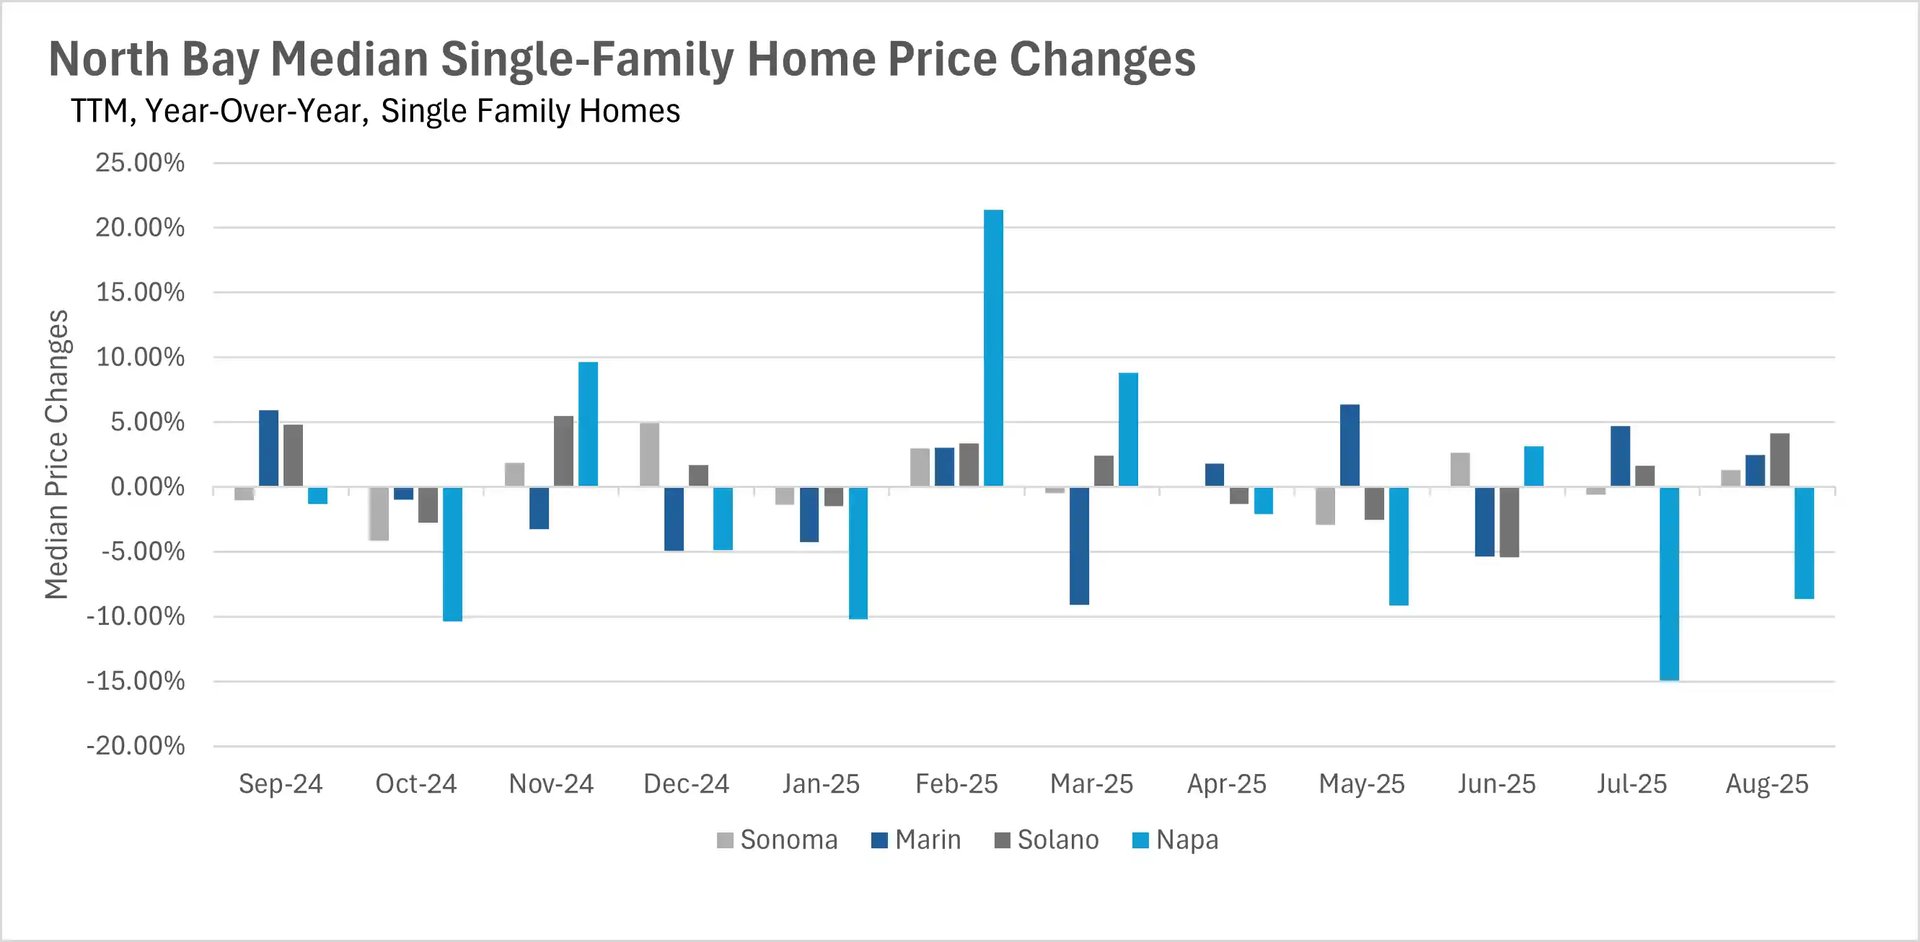
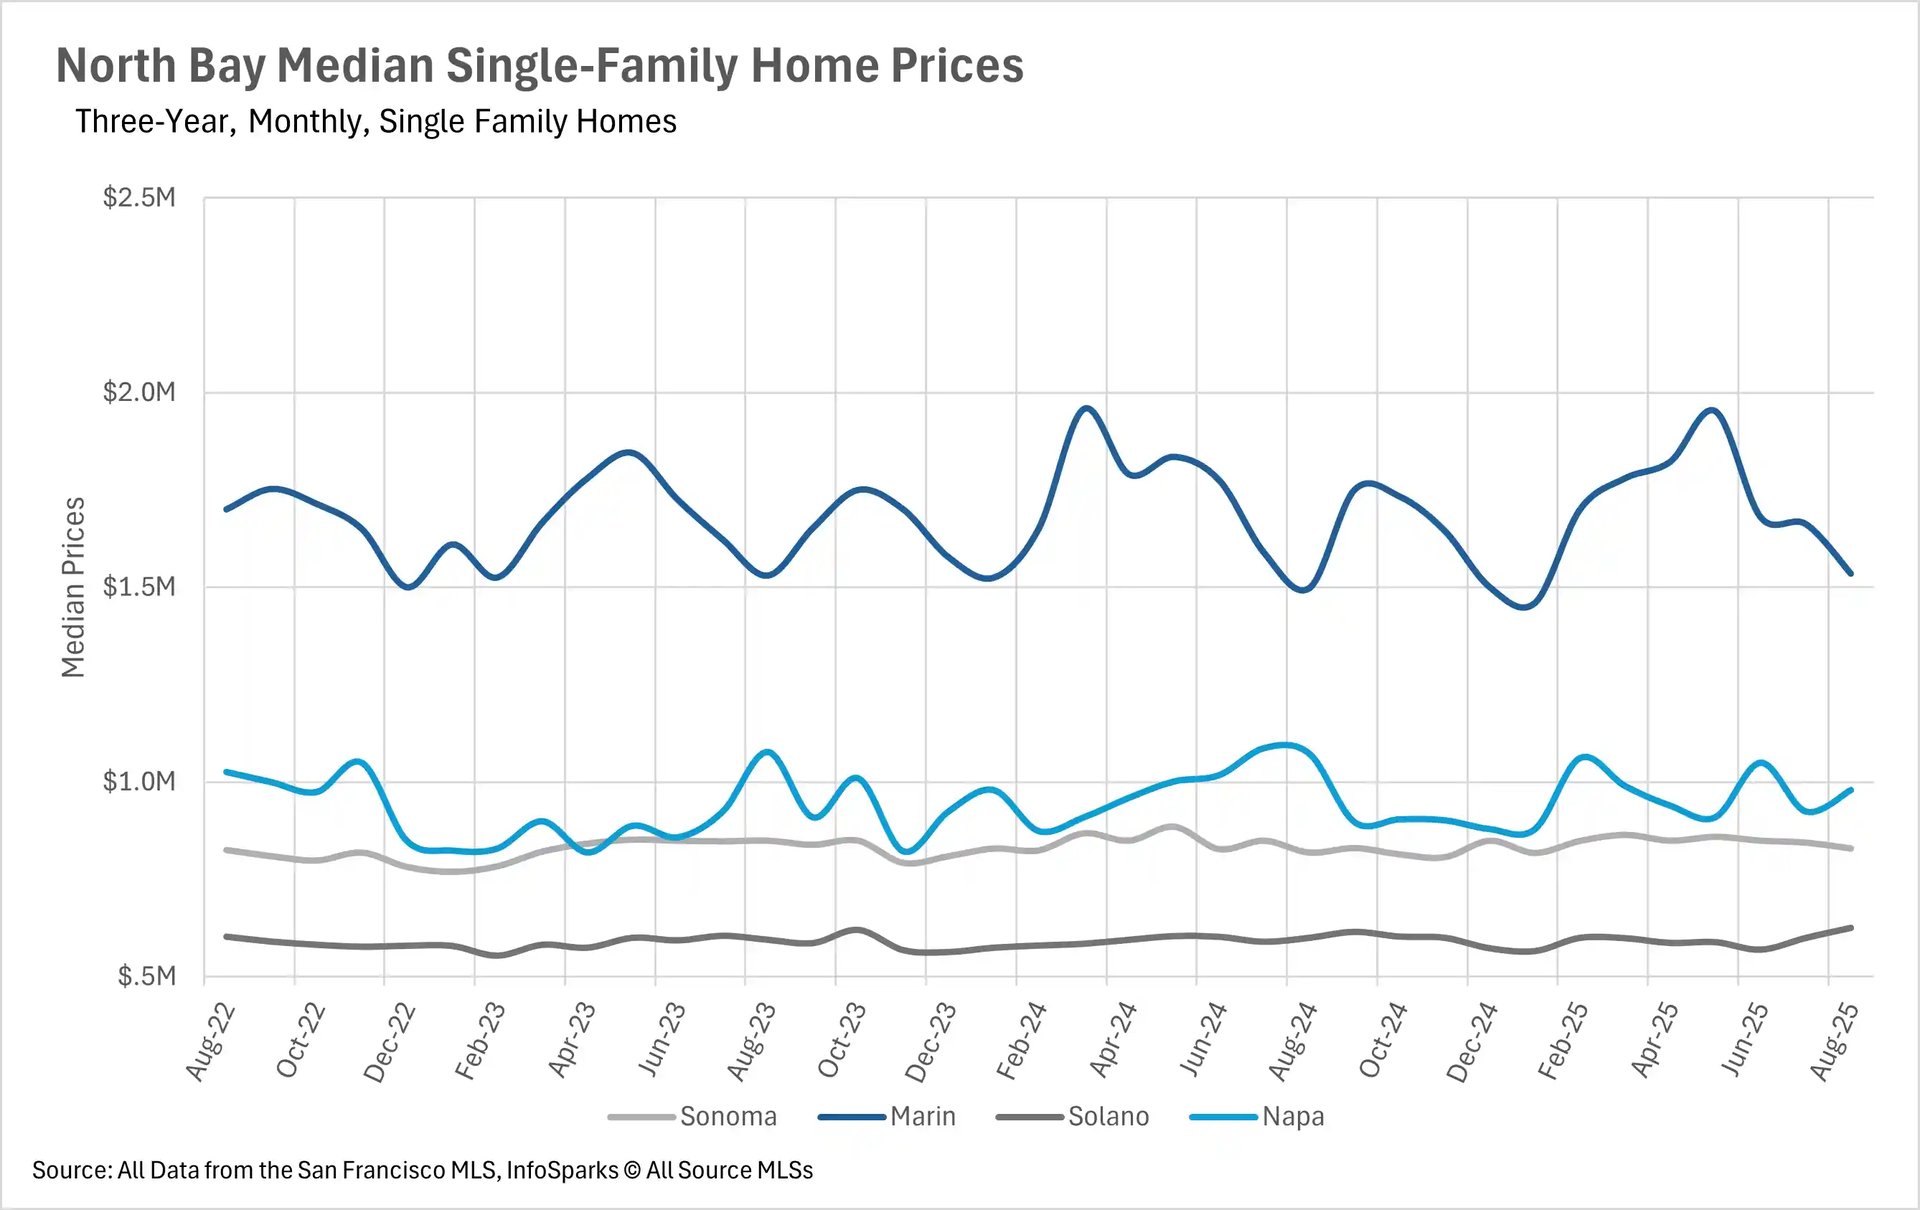
Single-family home values remain strong, while condo values remain relatively volatile
In the single-family home market, we saw quite a bit of growth on a year-over-year basis. Home values in Sonoma, Marin, and Solano Counties increased by 1.29%, 2.47%, and 4.17% on a year-over-year basis, respectively. However, median sale prices in Napa County actually decreased by 8.67% on a year-over-year basis. This increase in median sales prices that we’ve seen can more than likely be attributed to the fact that inventories are finally beginning to move in the North Bay. On the other hand, condo values were a bit more volatile, as usual. We saw increases of 6.98%, 20.07%, and 29.76% on a year-over-year basis in Sonoma, Marin, and Napa Counties, respectively. The median sale price for condos in Solano County decreased by 11.43% on a year-over-year basis.
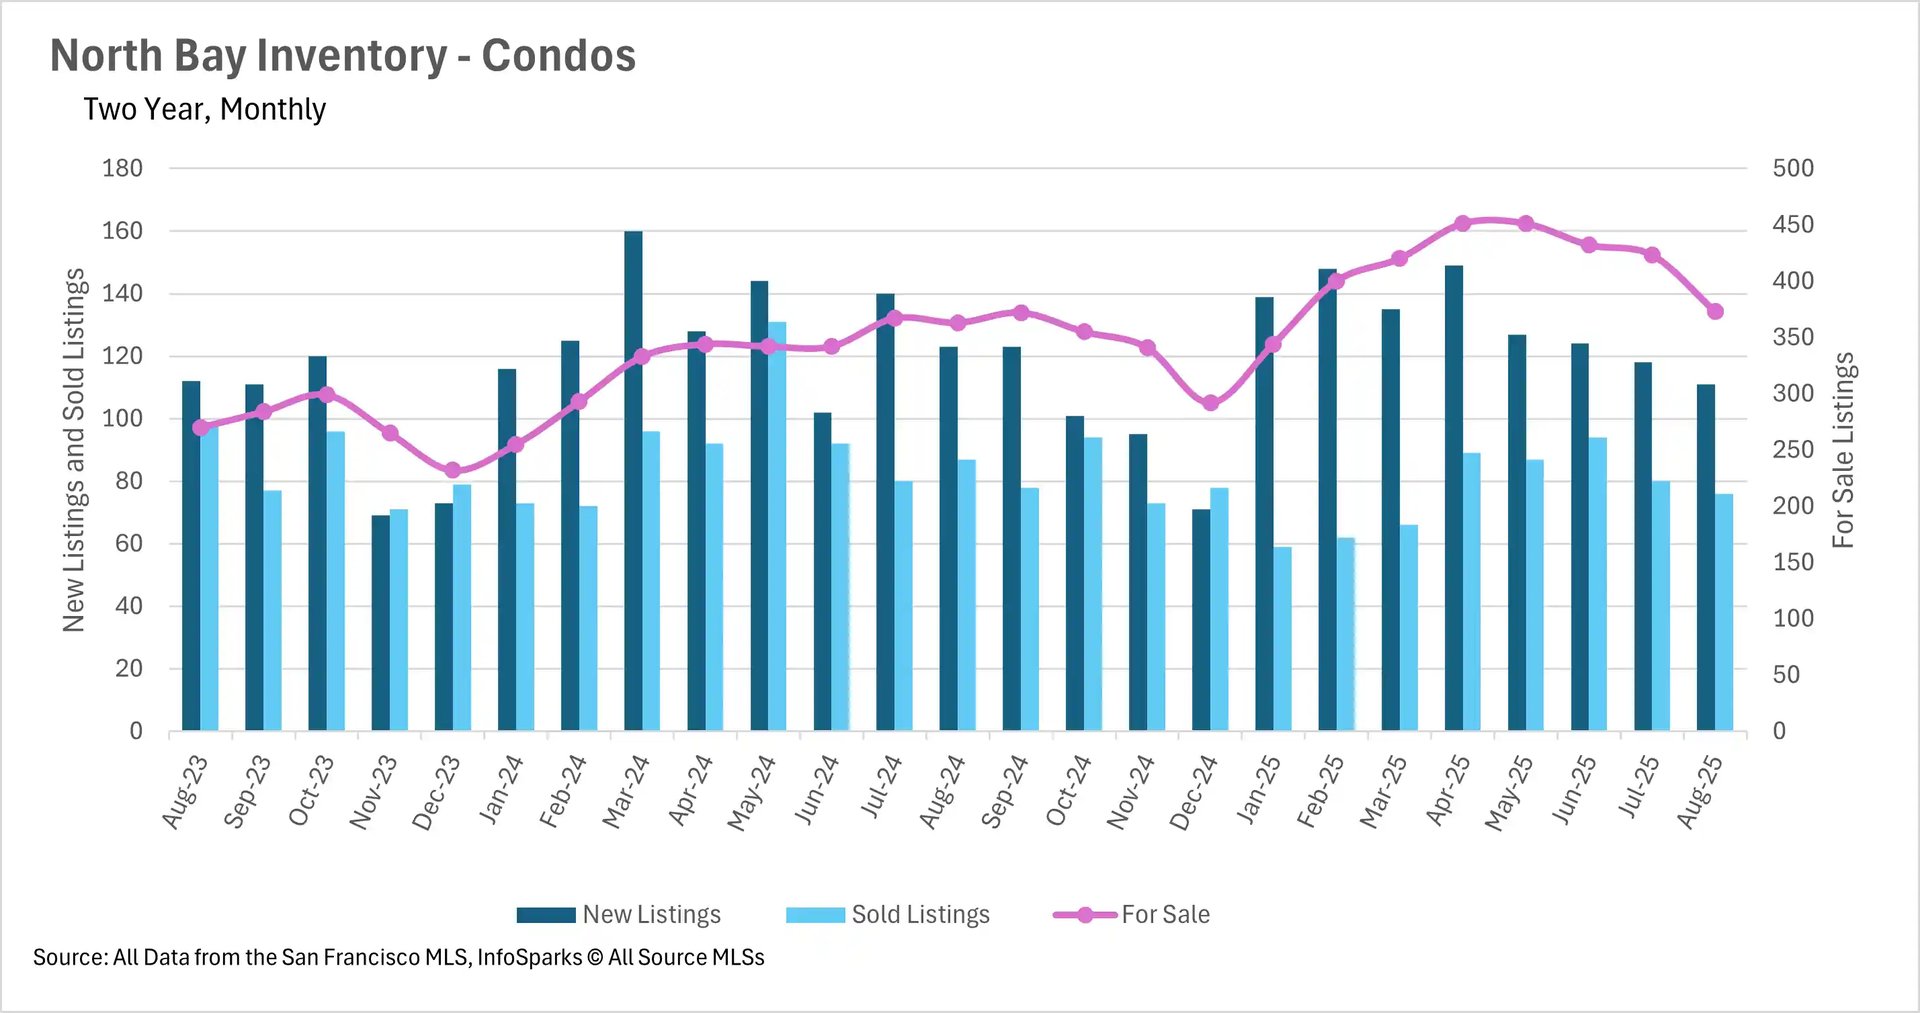
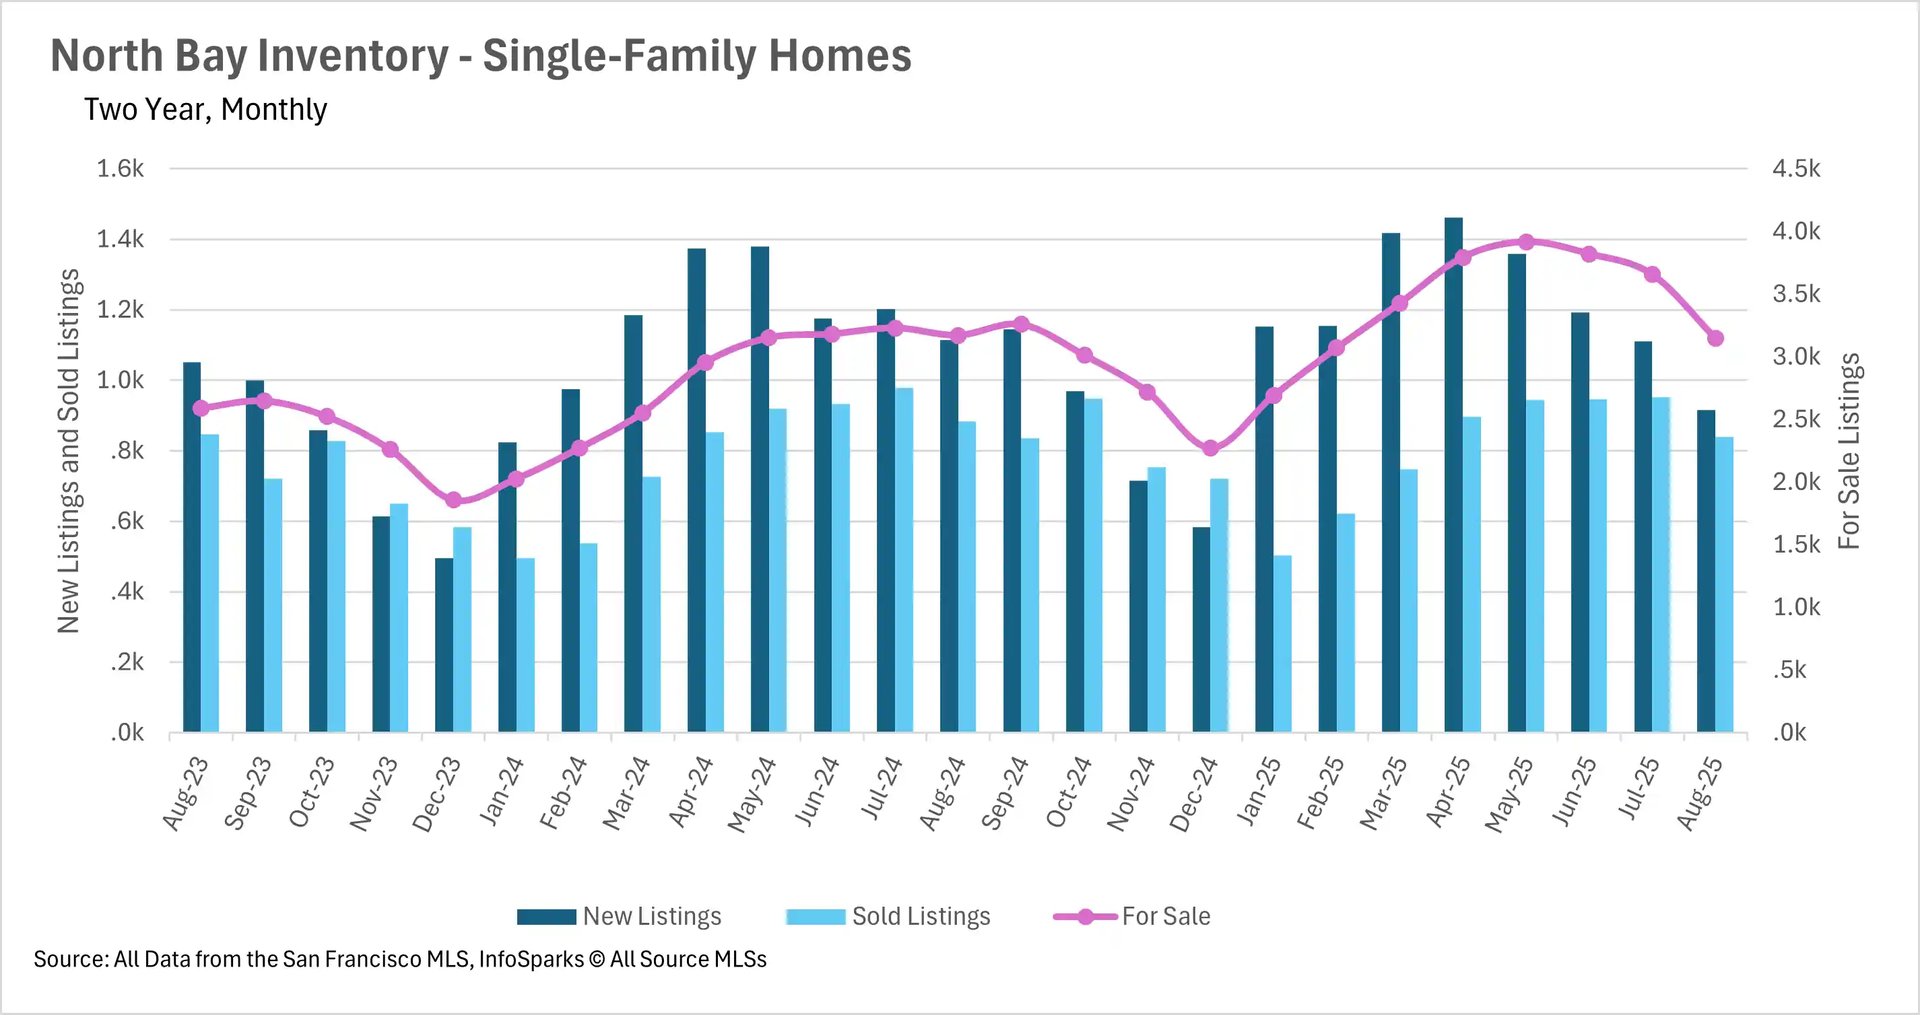
Inventories are beginning to move throughout the North Bay
Like many areas in California, housing inventories were building in the North Bay at a considerable rate throughout the first half of this year. However, it looks like the North Bay has largely recovered from this recent buildup. Right now, there are 0.73% fewer active single-family homes when compared to last year. When we turn to the condo market, there are slightly more listings on the market (2.75% more) on a year-over-year basis. This means that the market is gaining some traction as we head into the fall season.
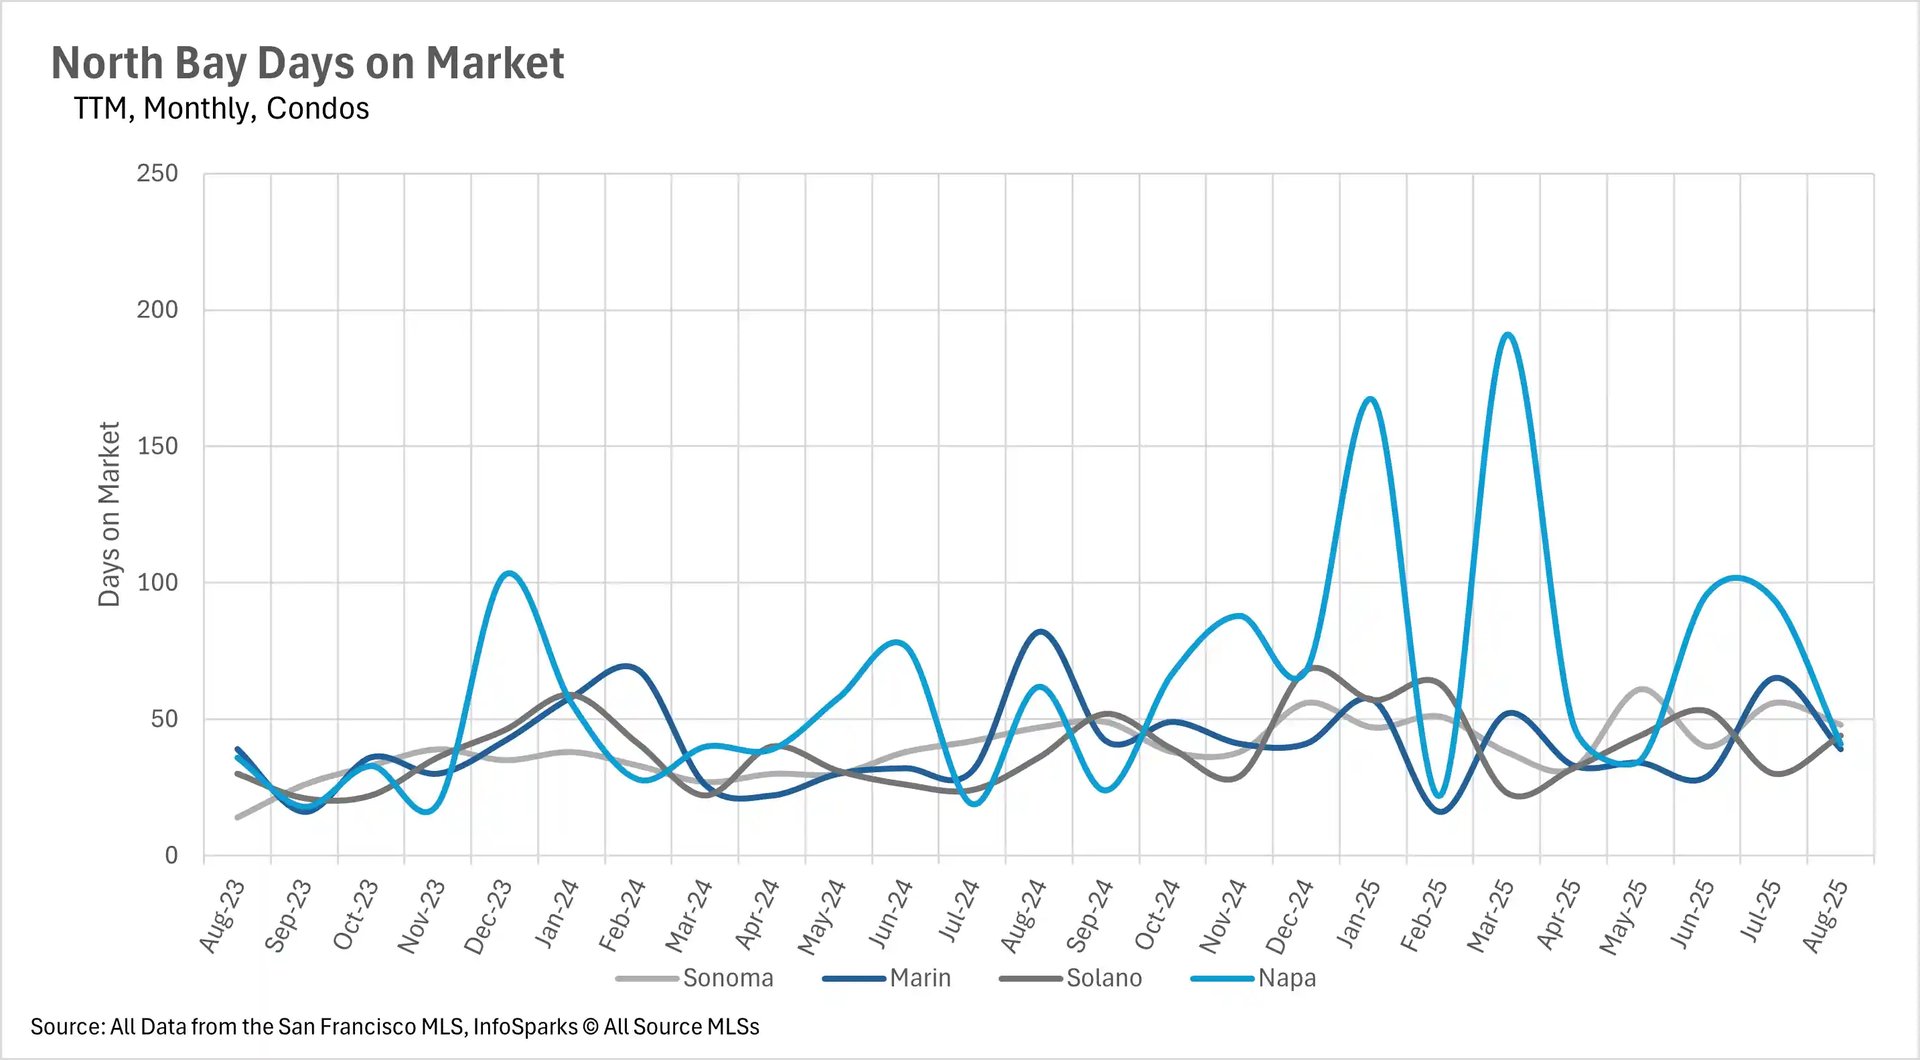
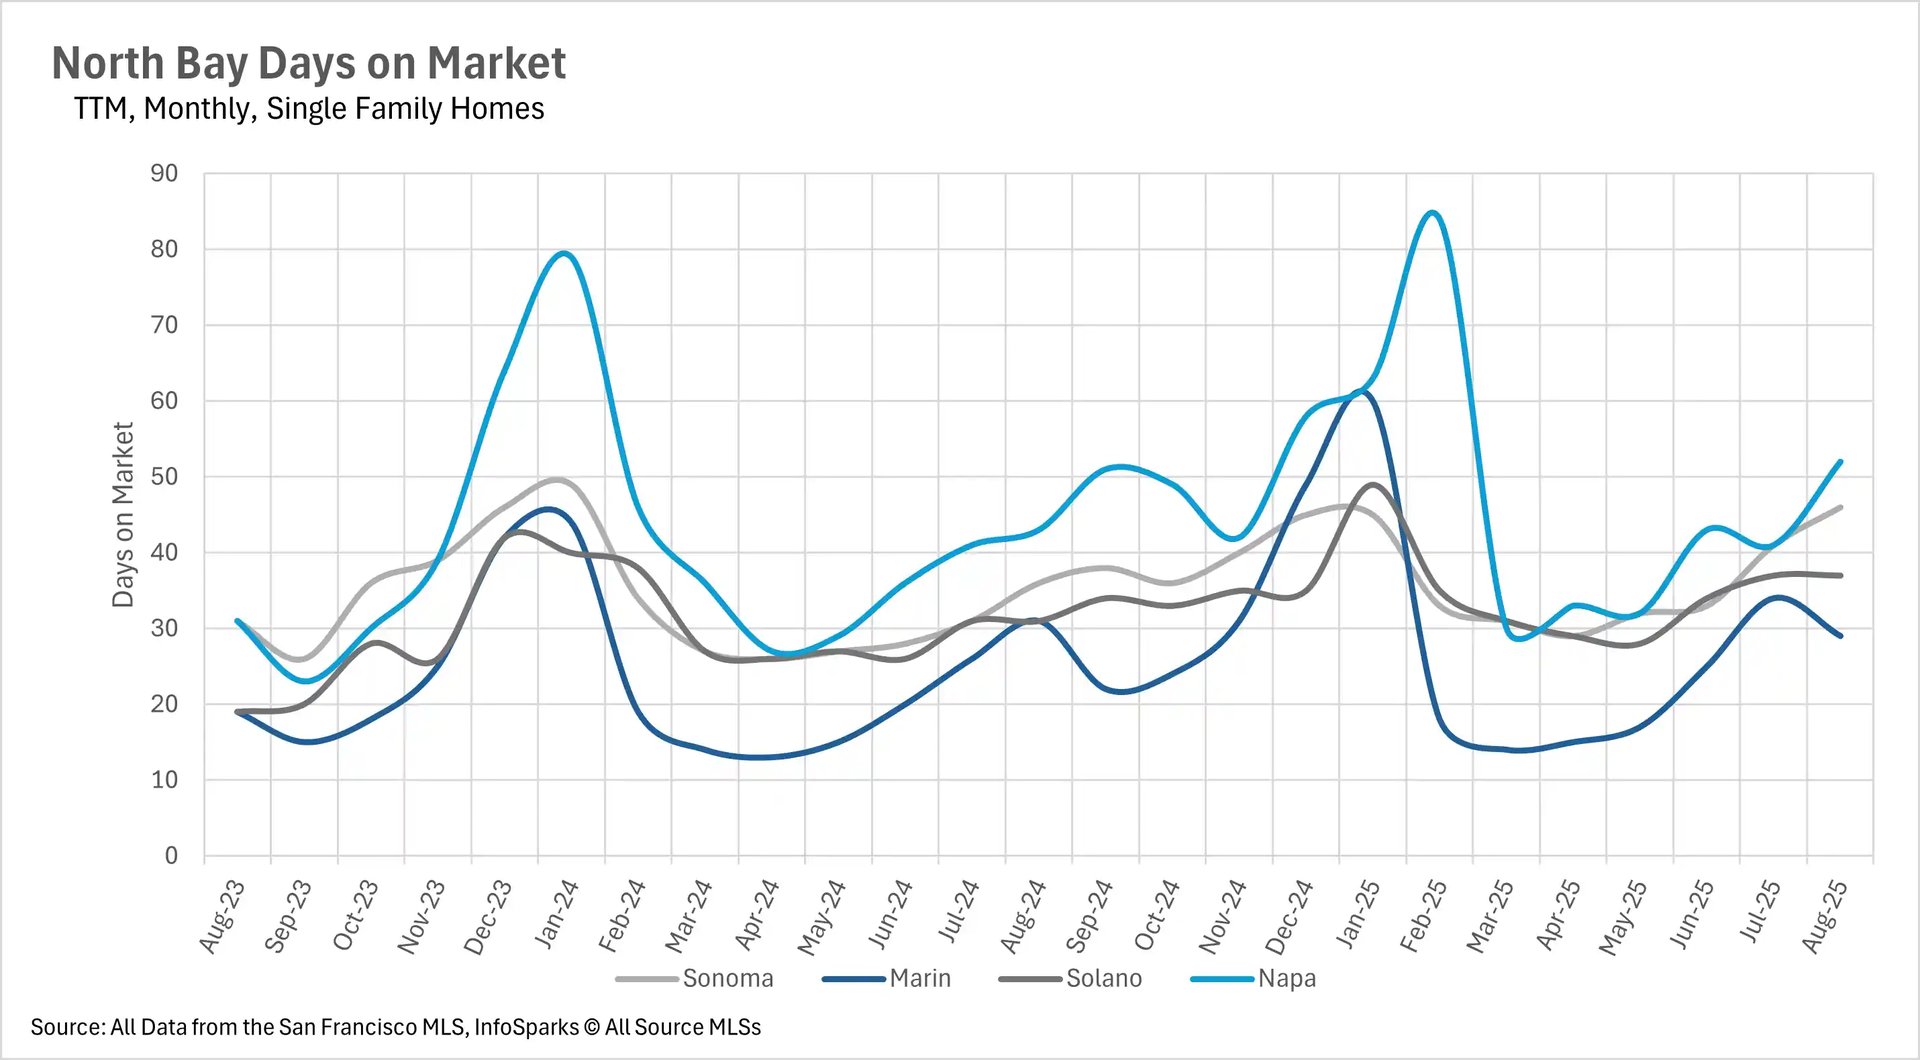
Despite dropping inventories, listings are still spending quite a bit of time on the market
Although we are seeing inventory levels normalize, the amount of time that listings are spending on the market has largely not seen this normalization yet. The average single-family home listing in Sonoma County is spending 46 days on the market, representing a 27.78% increase on a year-over-year basis. Likewise, we saw 19.35% and 20.93% year-over-year increases in time on market in Solano and Napa counties, respectively. Marin County did buck this trend, though, with the average listing spending 29 days on the market, representing a 6.45% decrease year-over-year.
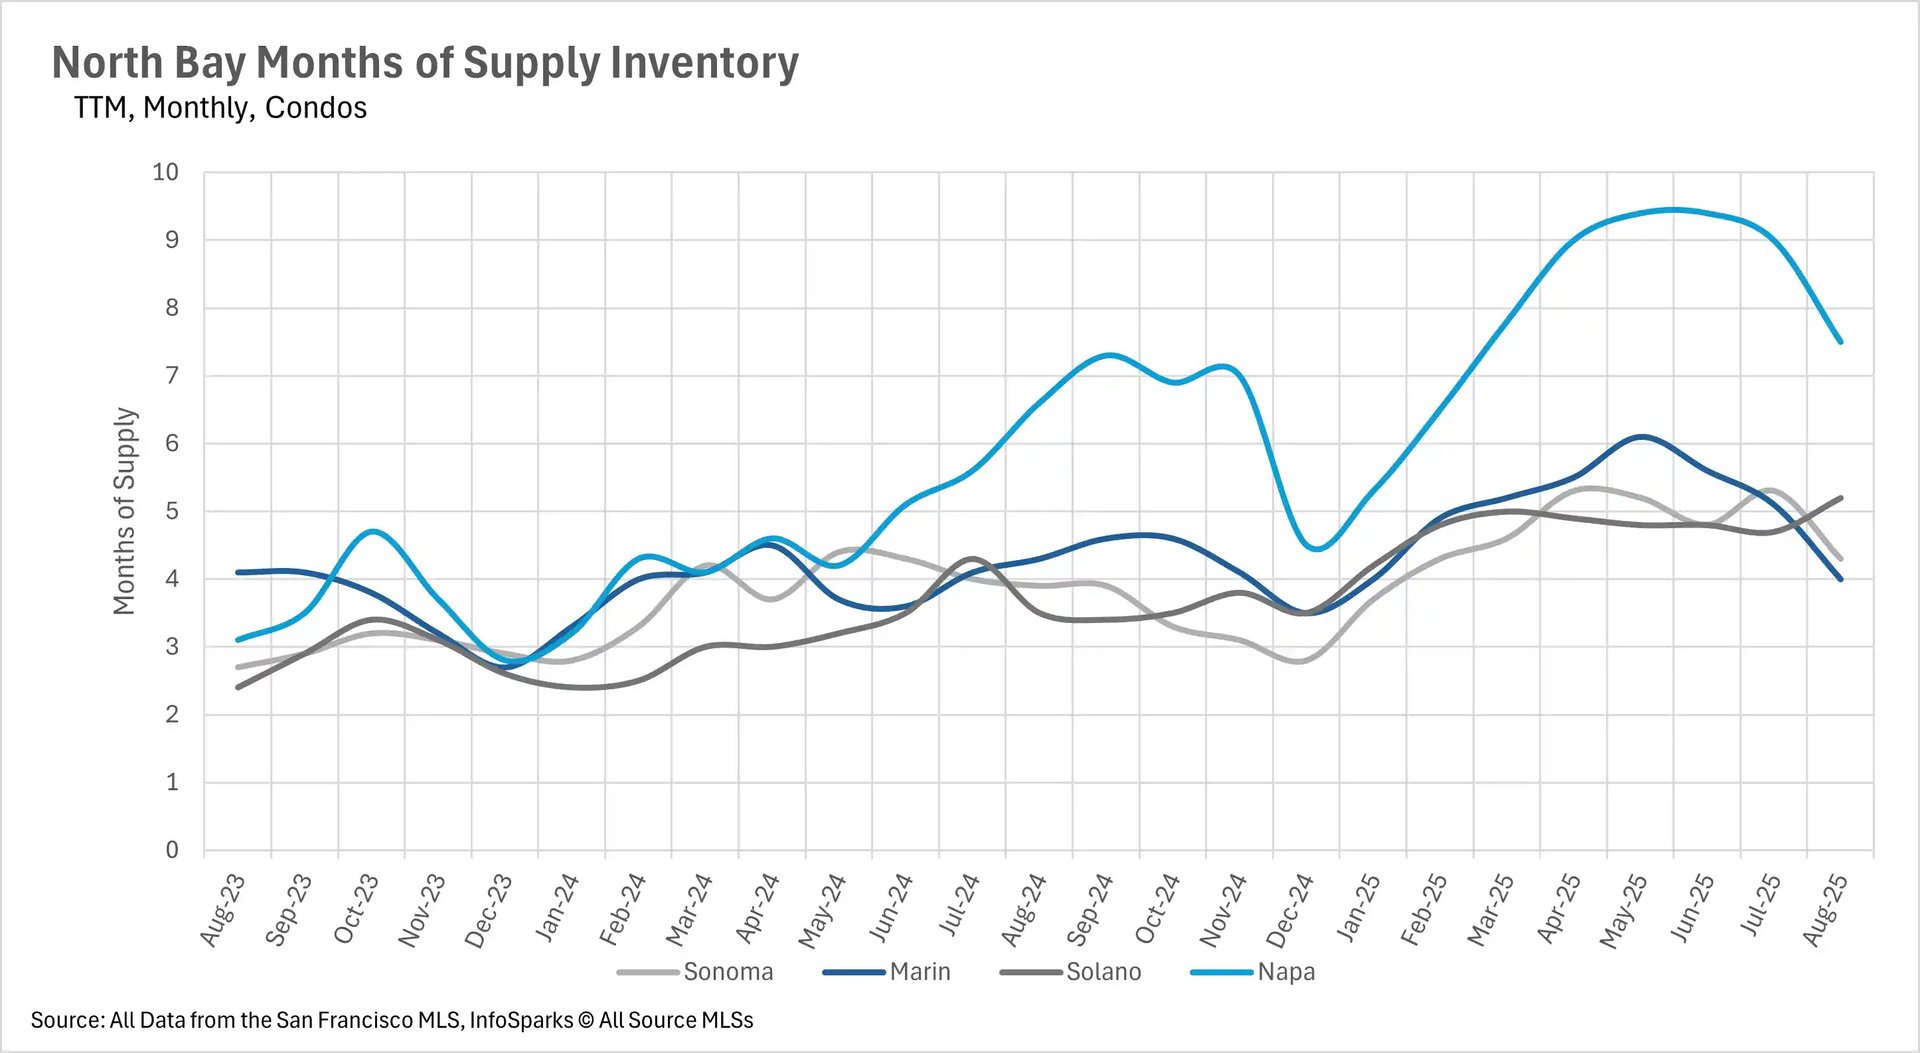
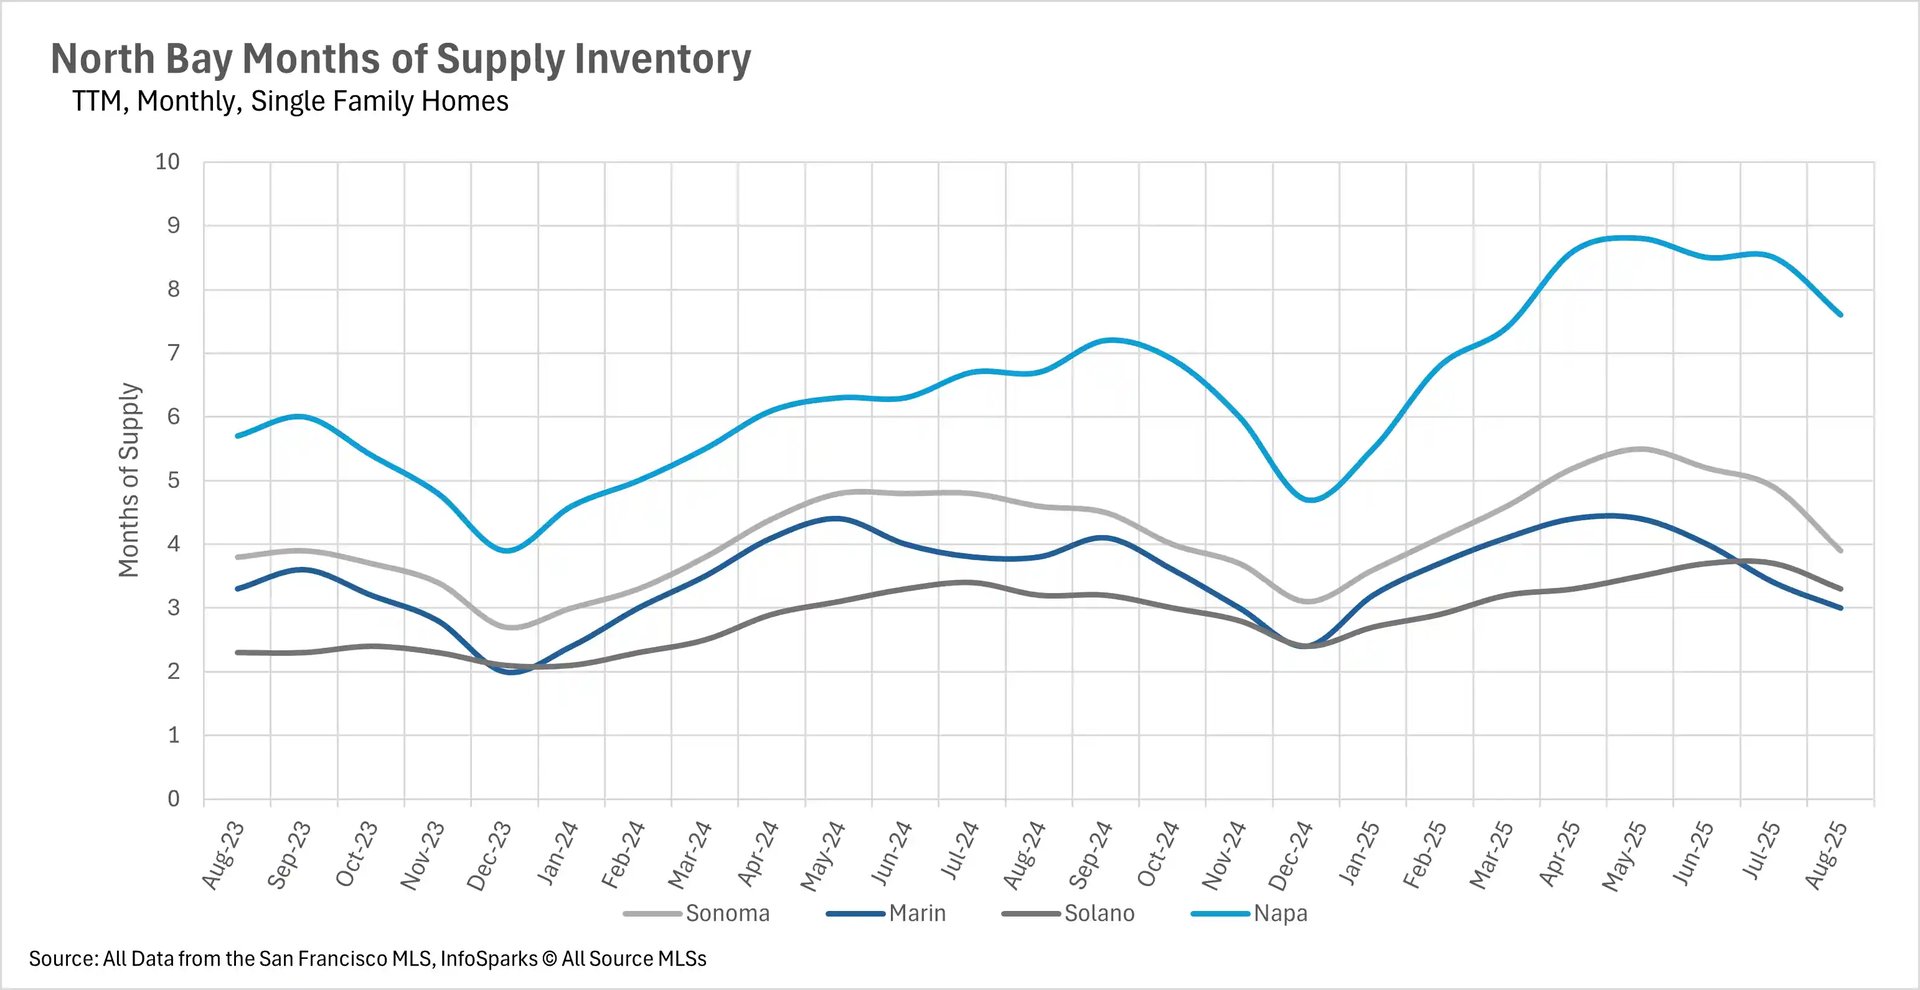
Marin becomes a balanced market, while others remain buyer’s markets
When determining whether a market is a buyers’ market or a sellers’ market, we look to the Months of Supply Inventory (MSI) metric. The state of California has historically averaged around three months of MSI, so any area with at or around three months of MSI is considered a balanced market. Any market that has lower than three months of MSI is considered a seller’s market, whereas markets with more than three months of MSI are considered buyers’ markets.
Despite the fact that we’ve seen the North Bay become a buyer’s market over the course of the past few months, we’re currently seeing the trend reverse, as inventories decline. With 3 months of active inventory, Marin has become a balanced market, while Solano, Sonoma, and Napa Counties trend downward, with 3.3, 3.9, and 7.6 months' worth of single-family home inventory on the market, respectively. Likewise, the condo market is entirely a buyer’s market, with 4 months of inventory on the market in Marin County, 4.3 months in Sonoma County, 5.2 months in Solano County, and 7.5 months in Napa County.