Select a Market Report to Read:
The Local Lowdown
Quick Take:
- August marked a turning point for Bay Area real estate, with single-family home prices rebounding in most regions while condo markets continue to struggle with volatility and declines.
- Inventory levels are normalizing across the region after summer peaks, with San Francisco reaching some of the lowest supply levels ever recorded while other areas remain elevated year-over-year.
- Despite inventory normalization, listings are spending significantly more time on market throughout most of the Bay Area, reflecting increased buyer selectivity.
- Market dynamics strongly favor single-family homes over condos, with San Francisco becoming a dual seller's market while other regions maintain the traditional split between property types.
Note: You can find the charts/graphs for the Local Lowdown at the end of this section.
*National Association of REALTORS® data is released two months behind, so we estimate the most recent month's data when possible and appropriate.
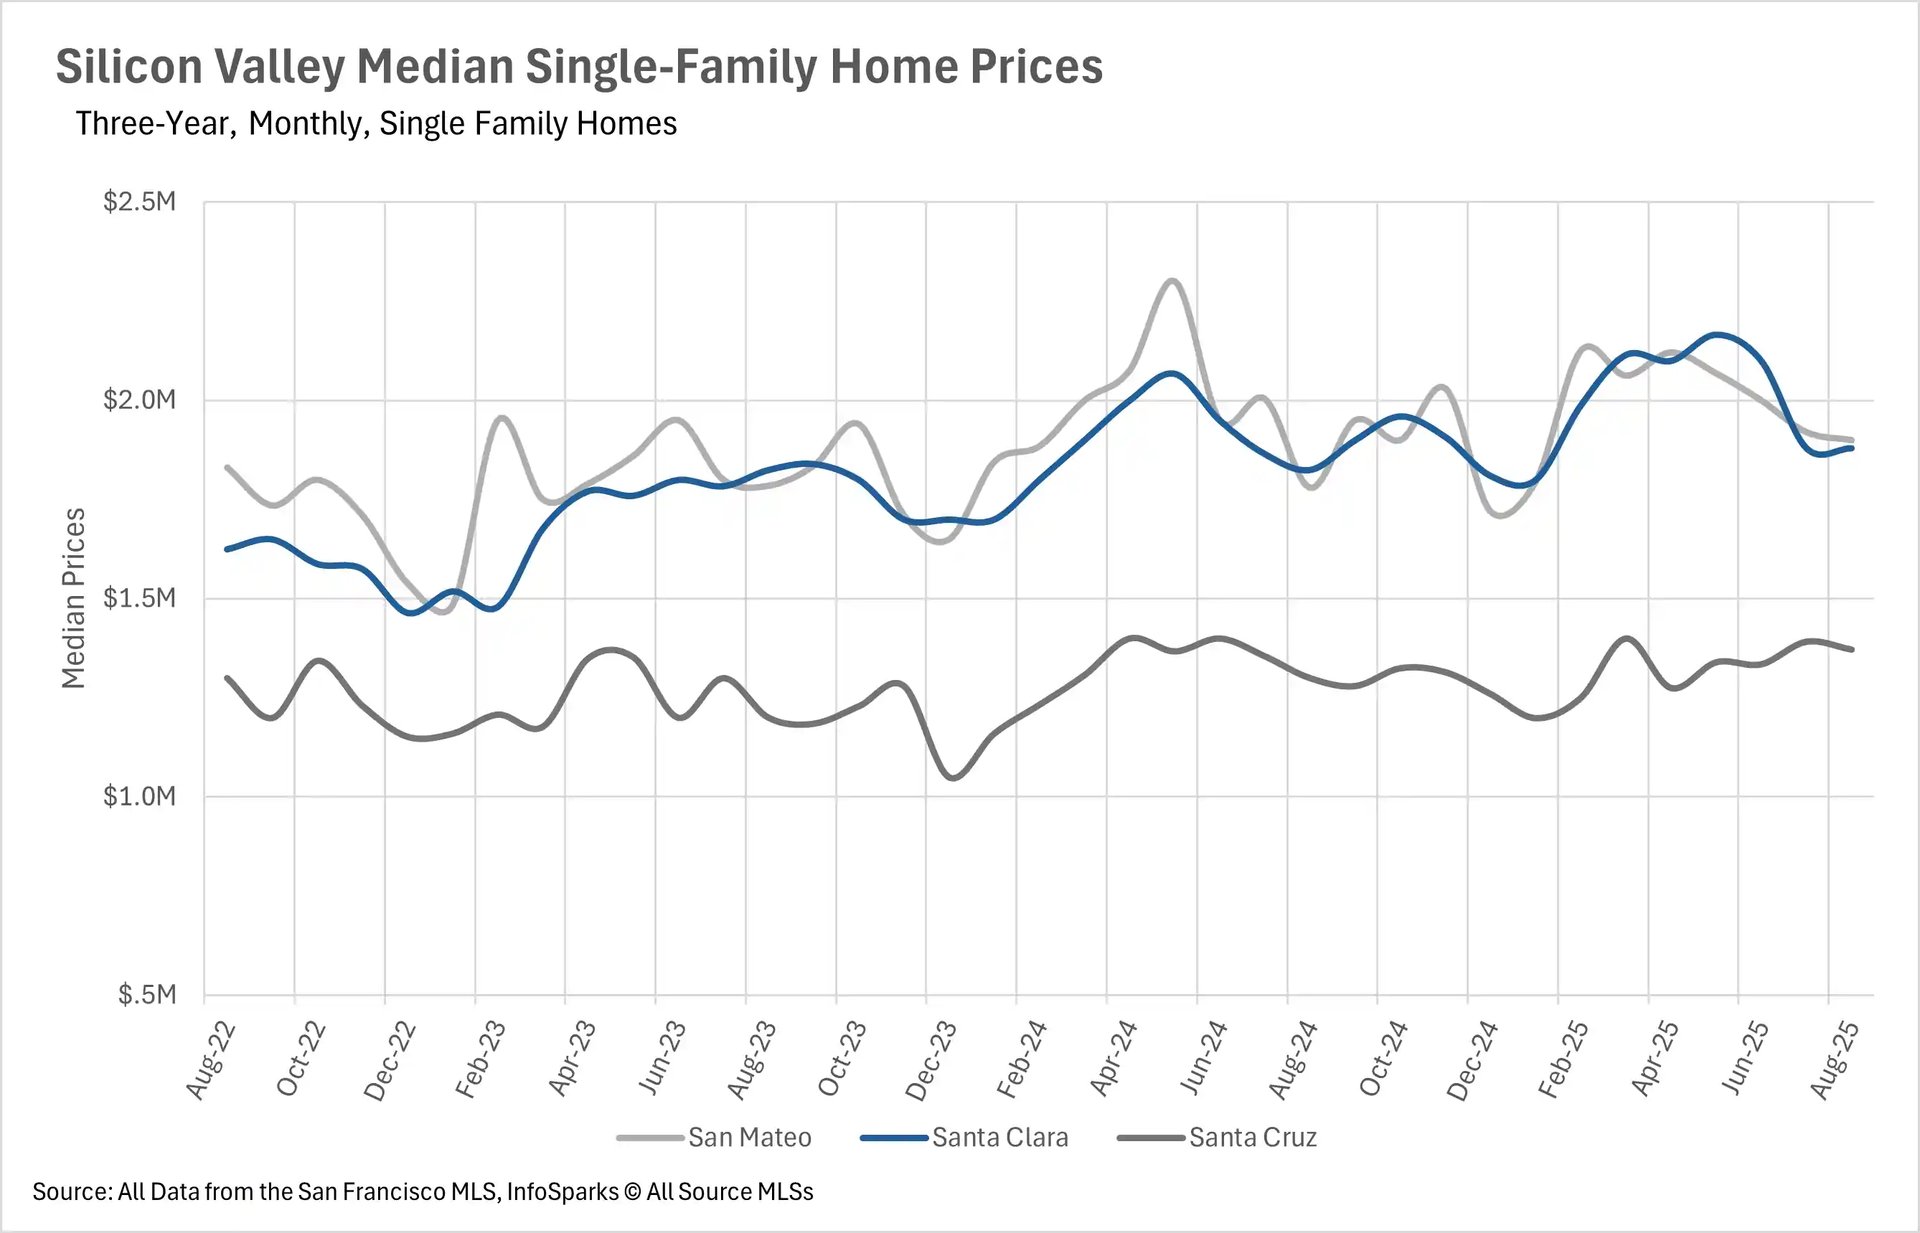
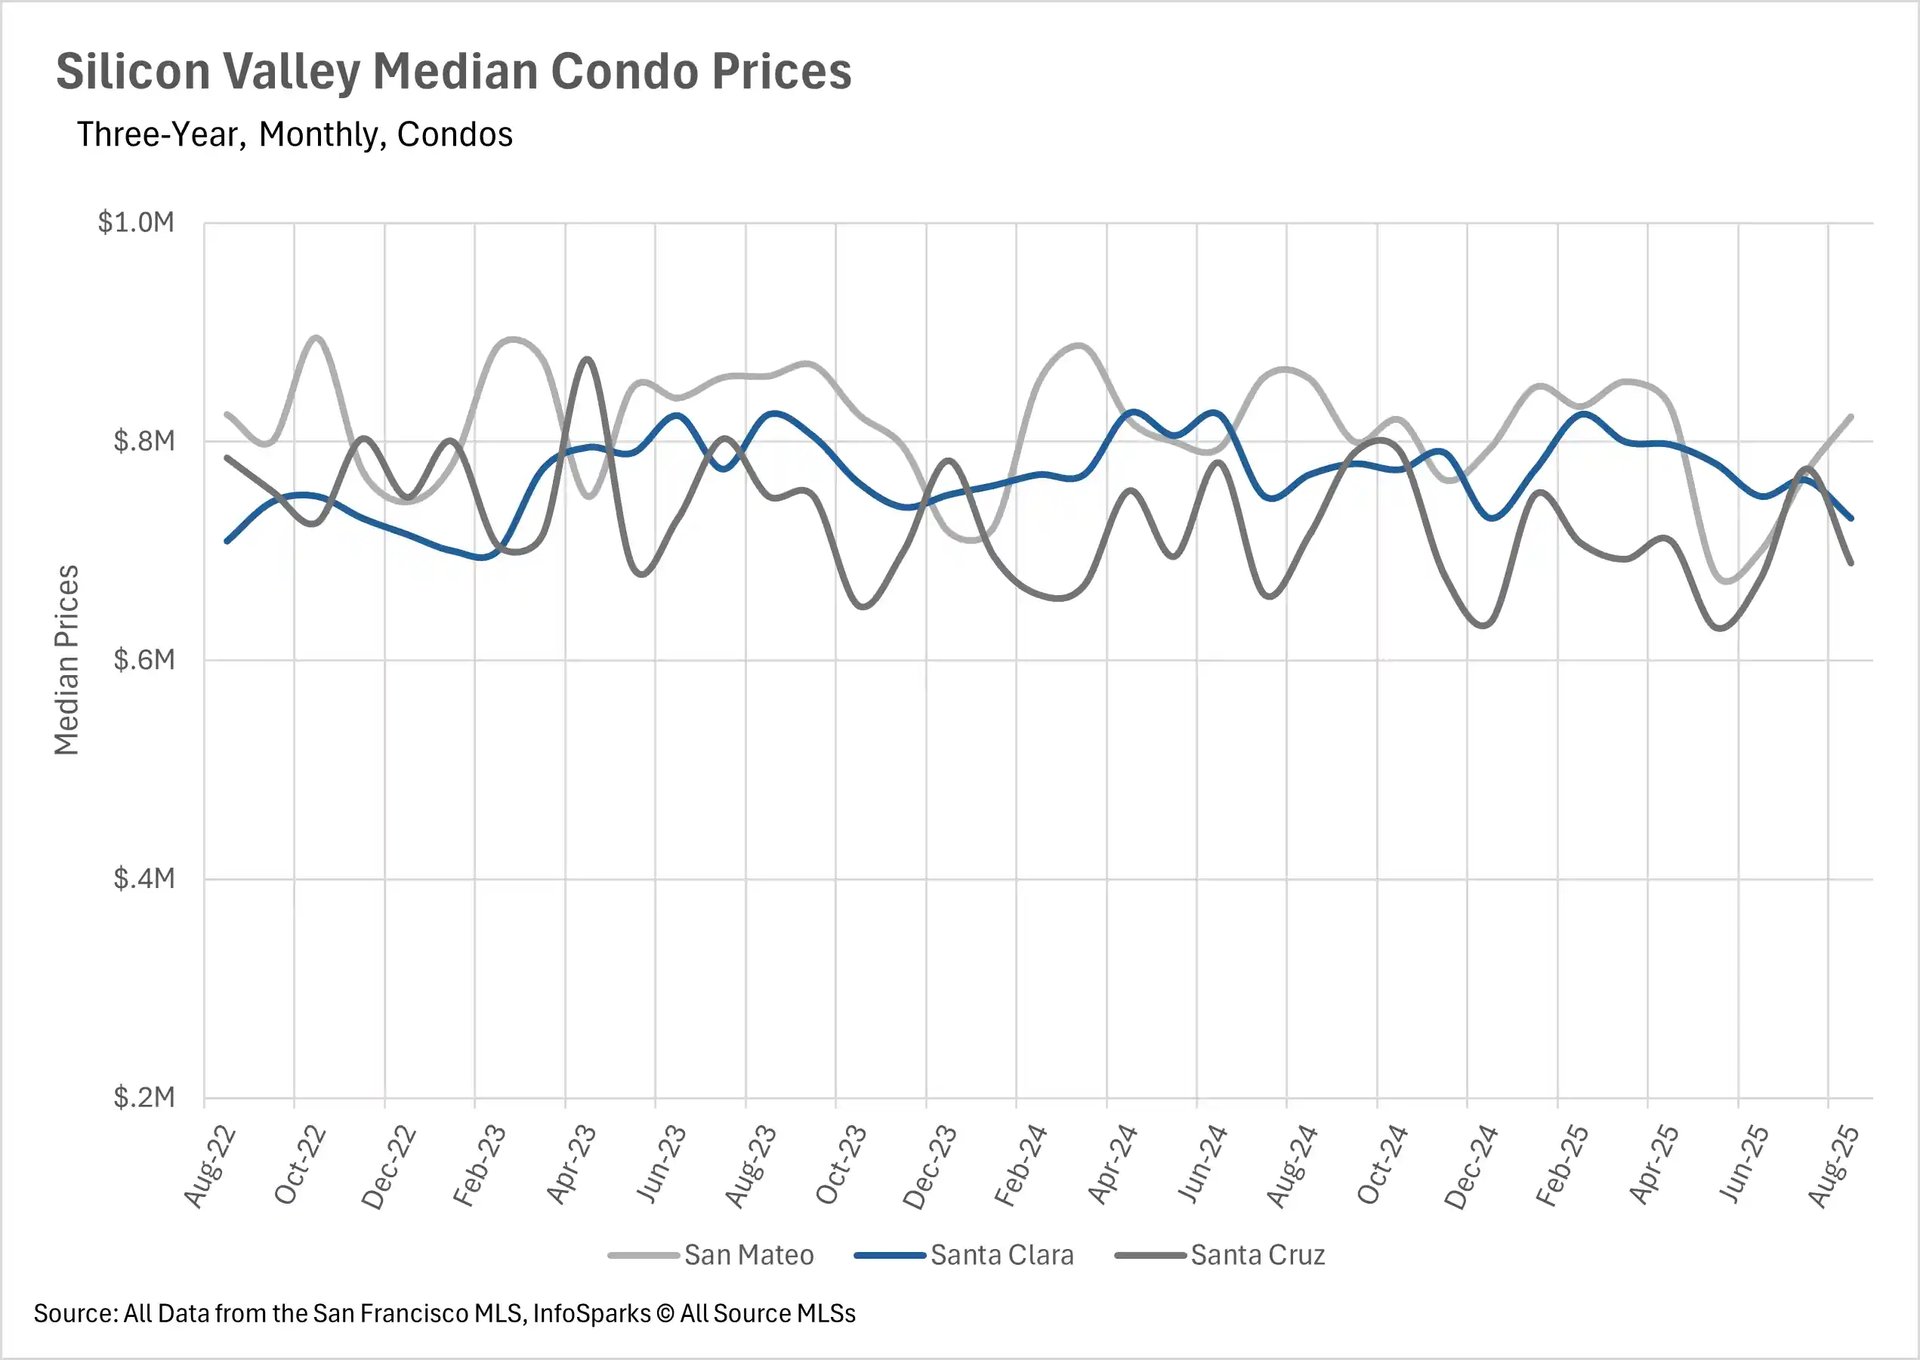
Single-family home prices rebound while condo markets remain volatile
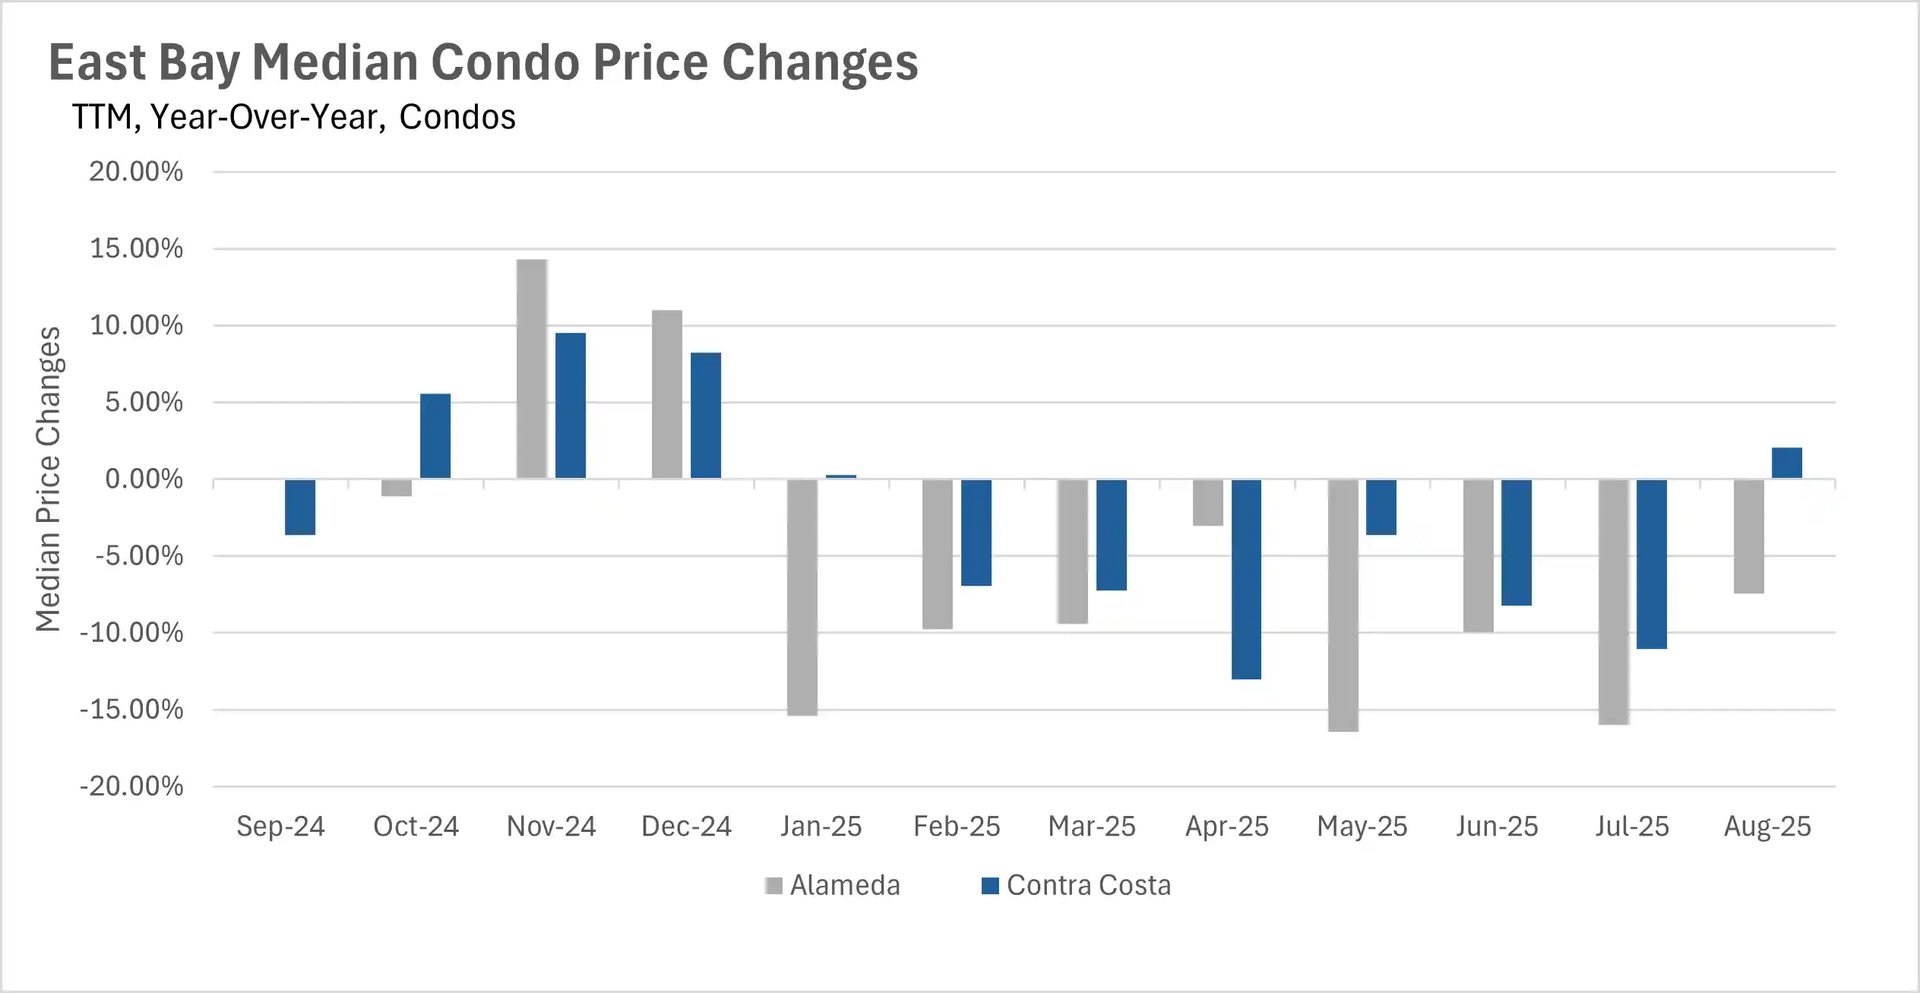
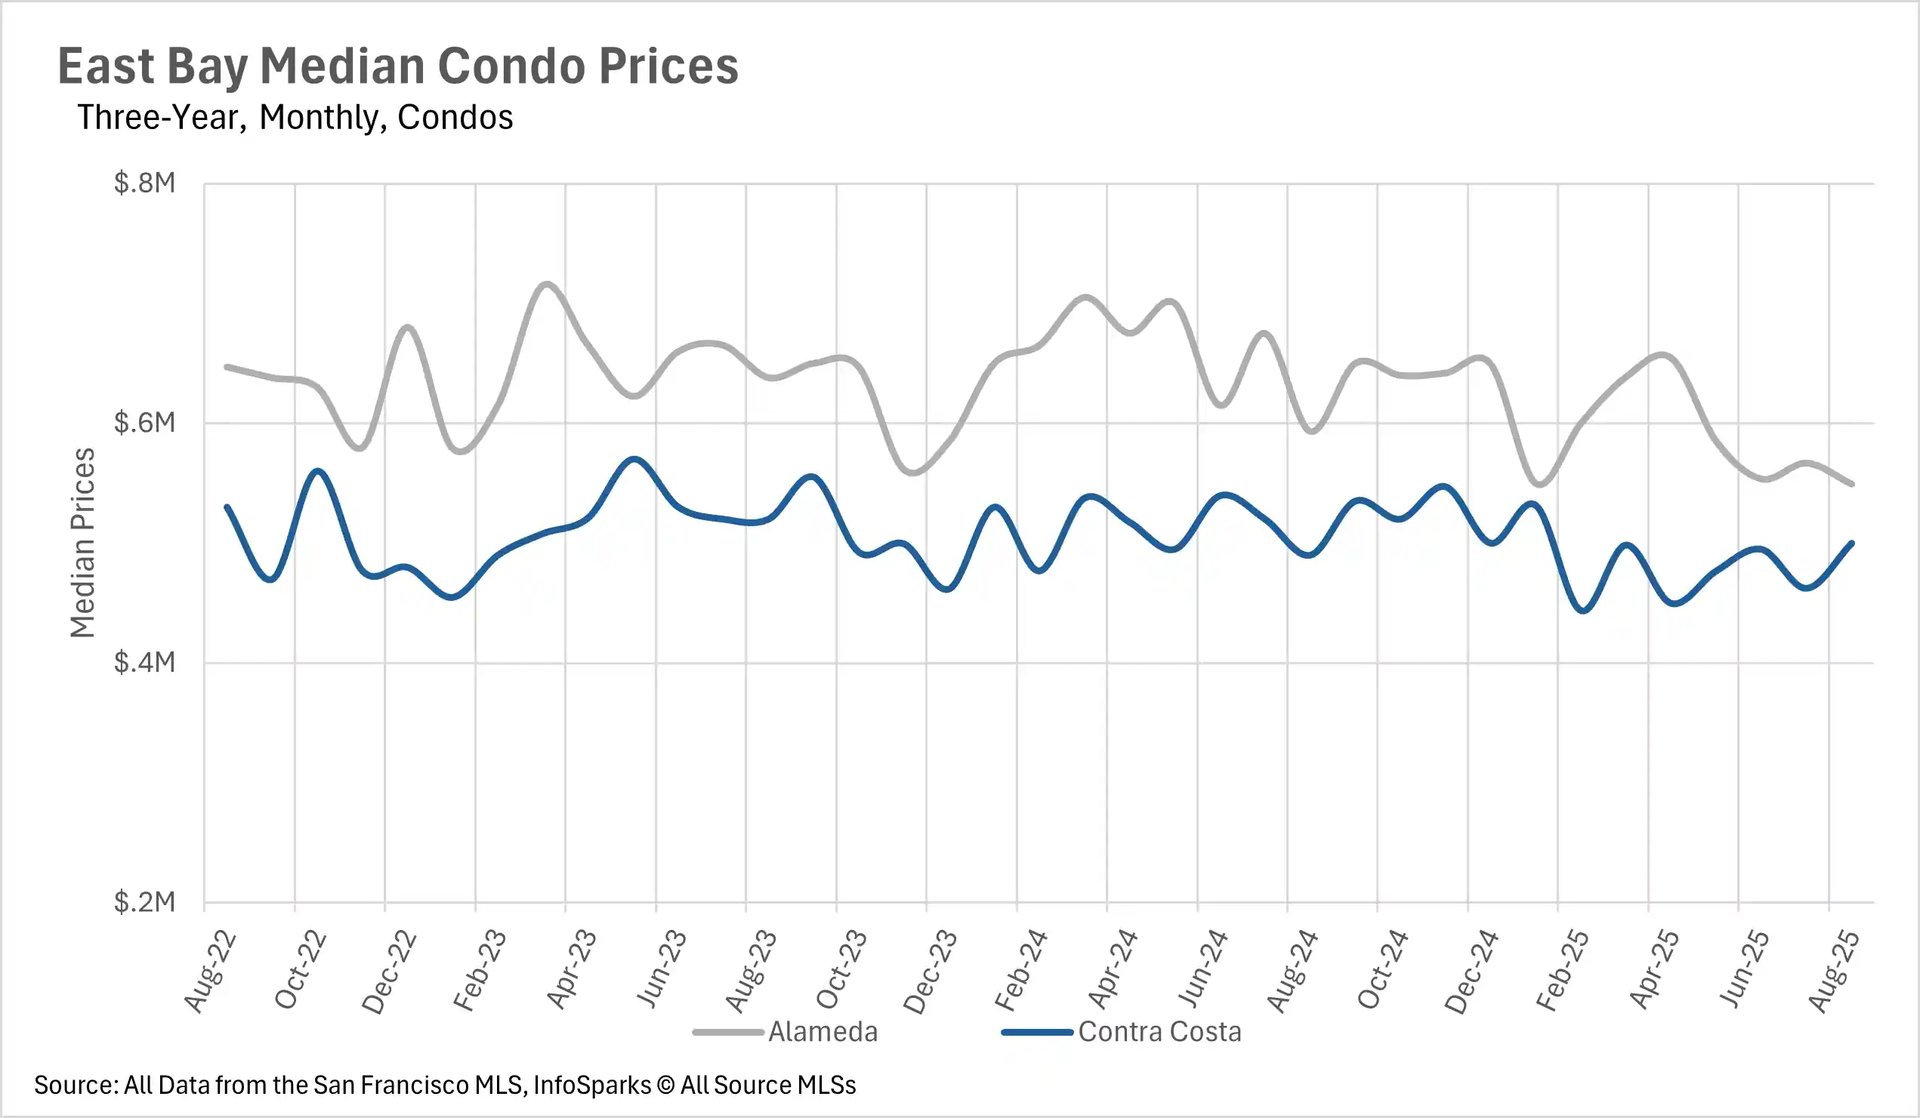
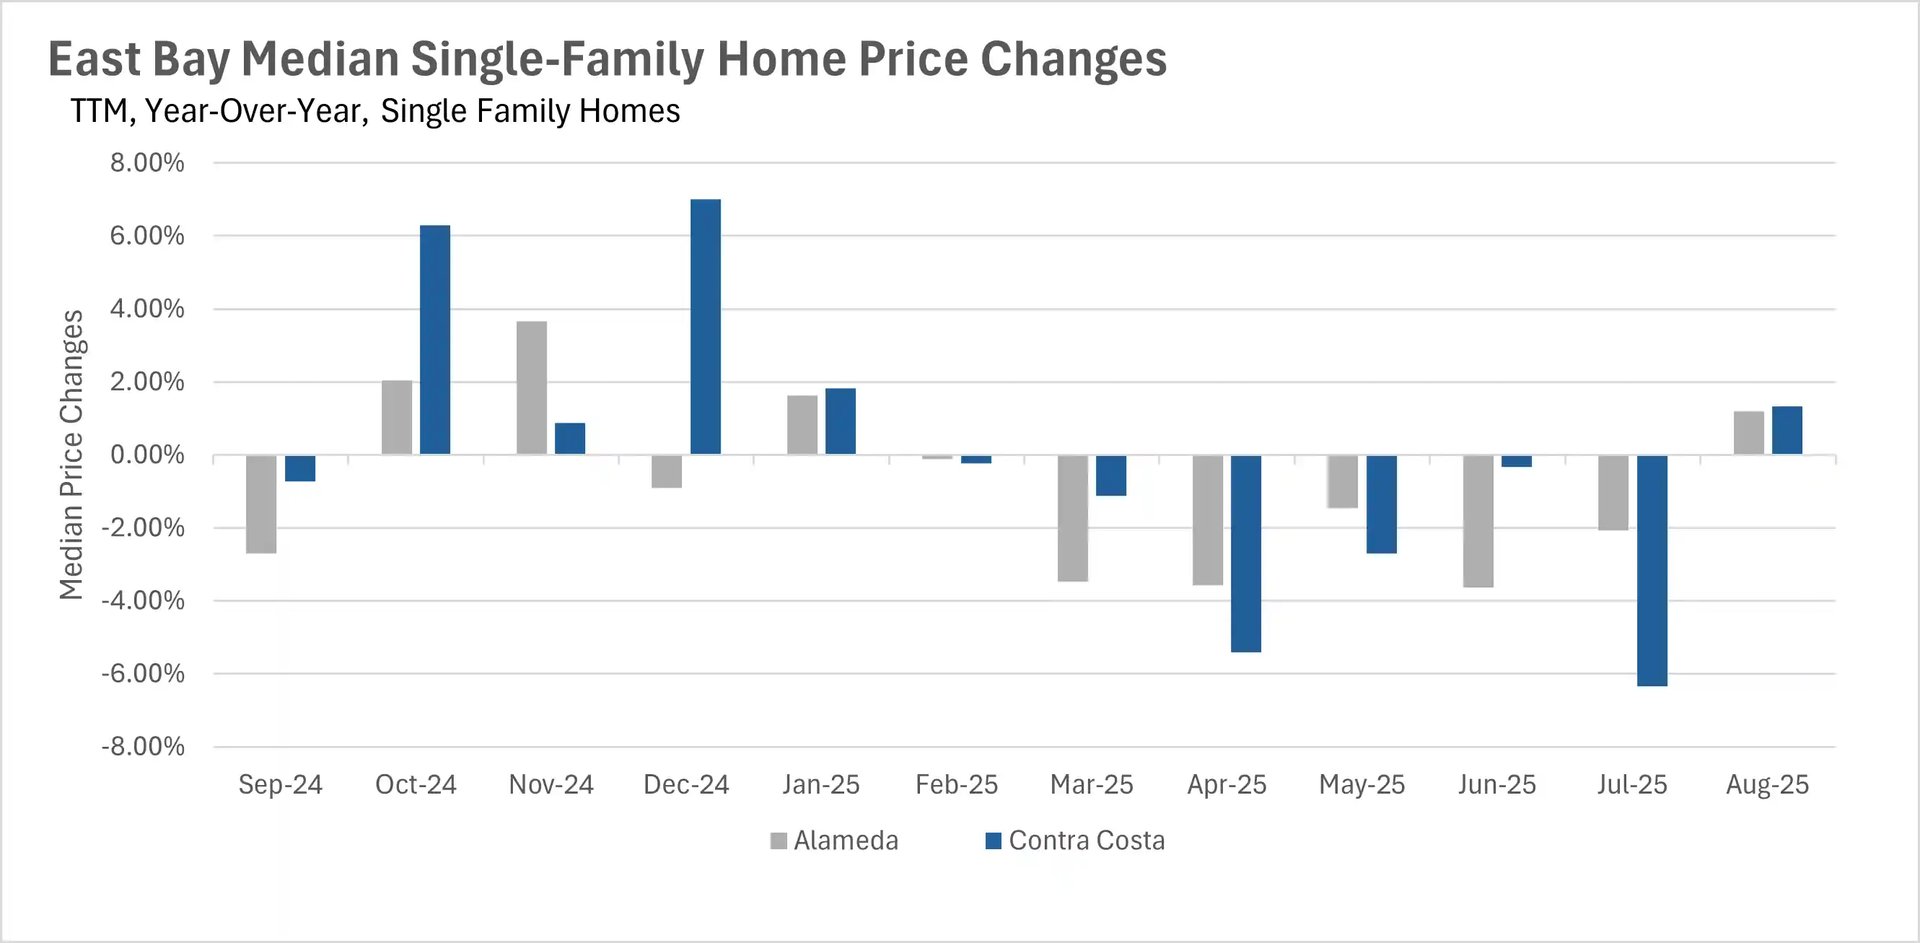
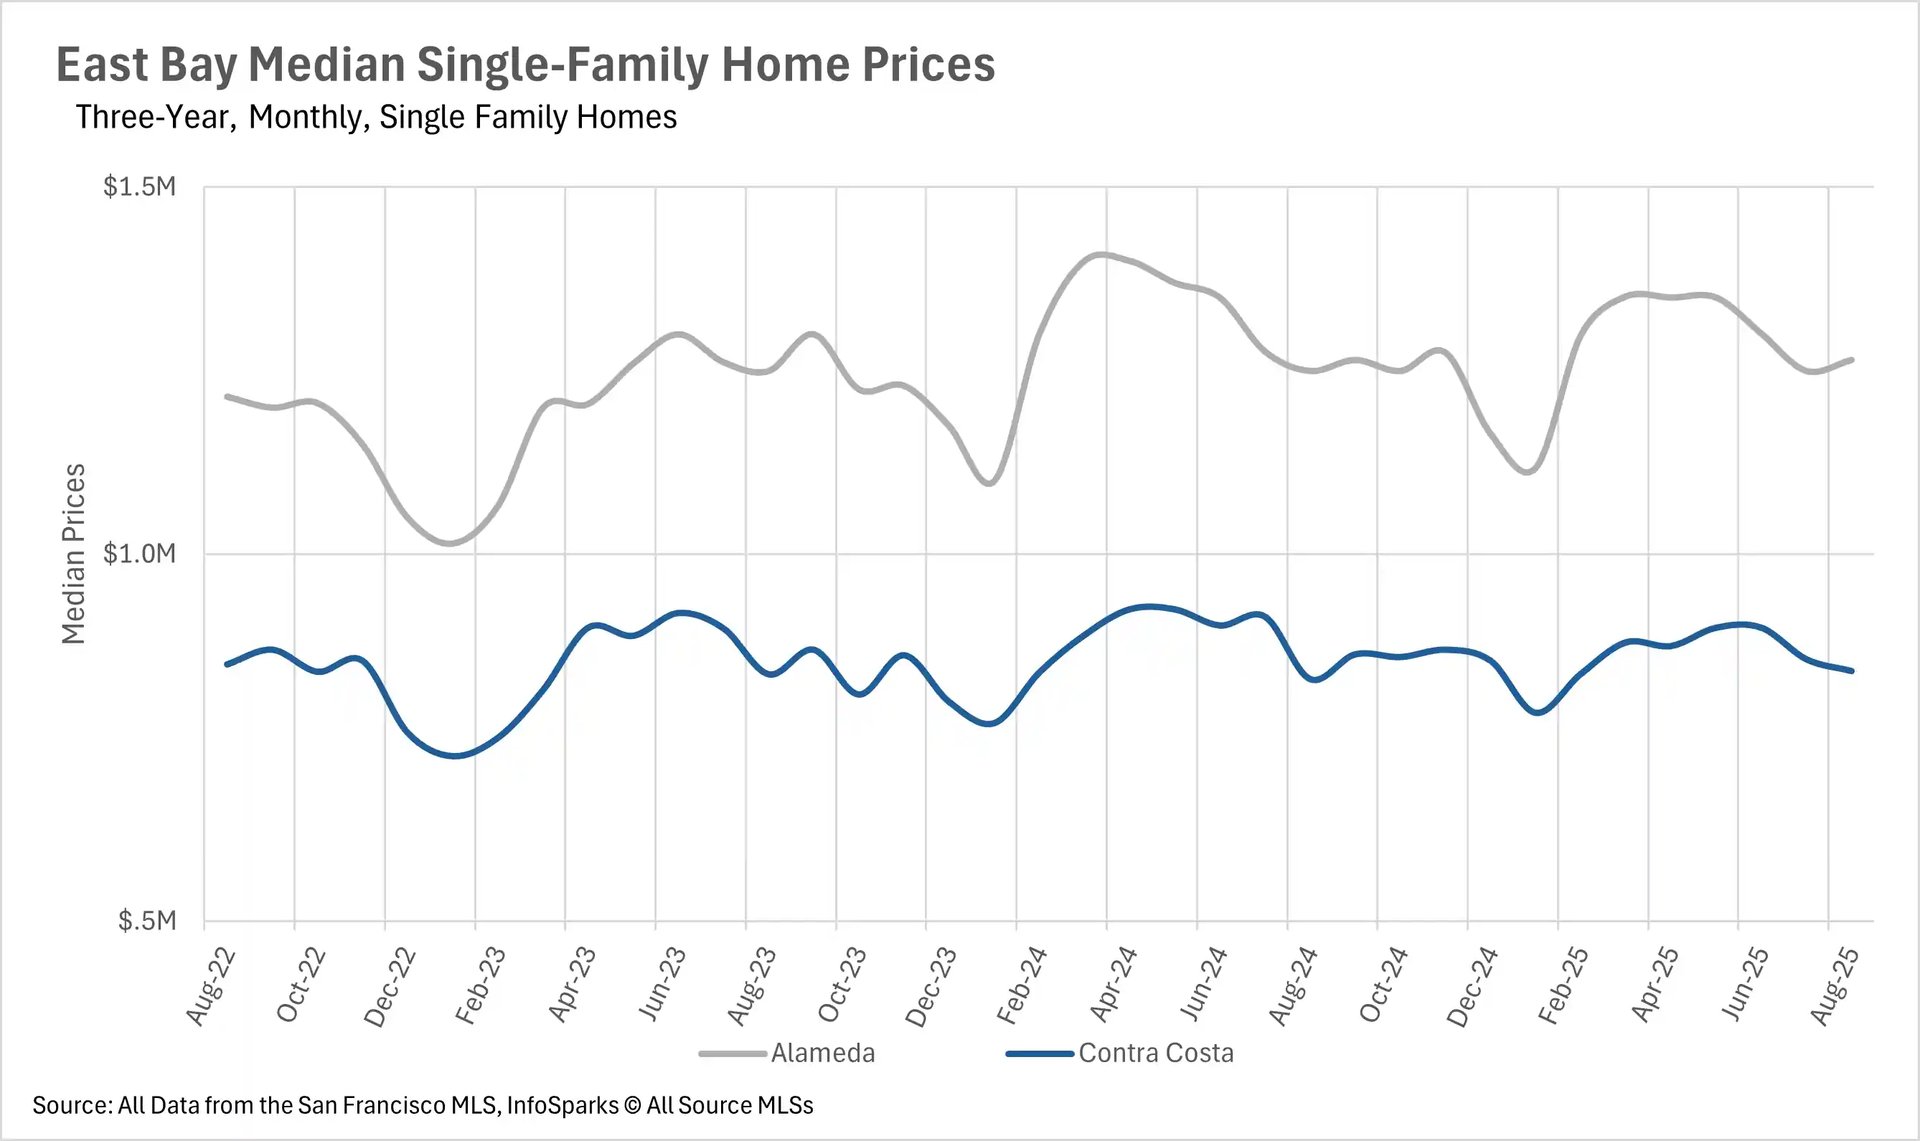
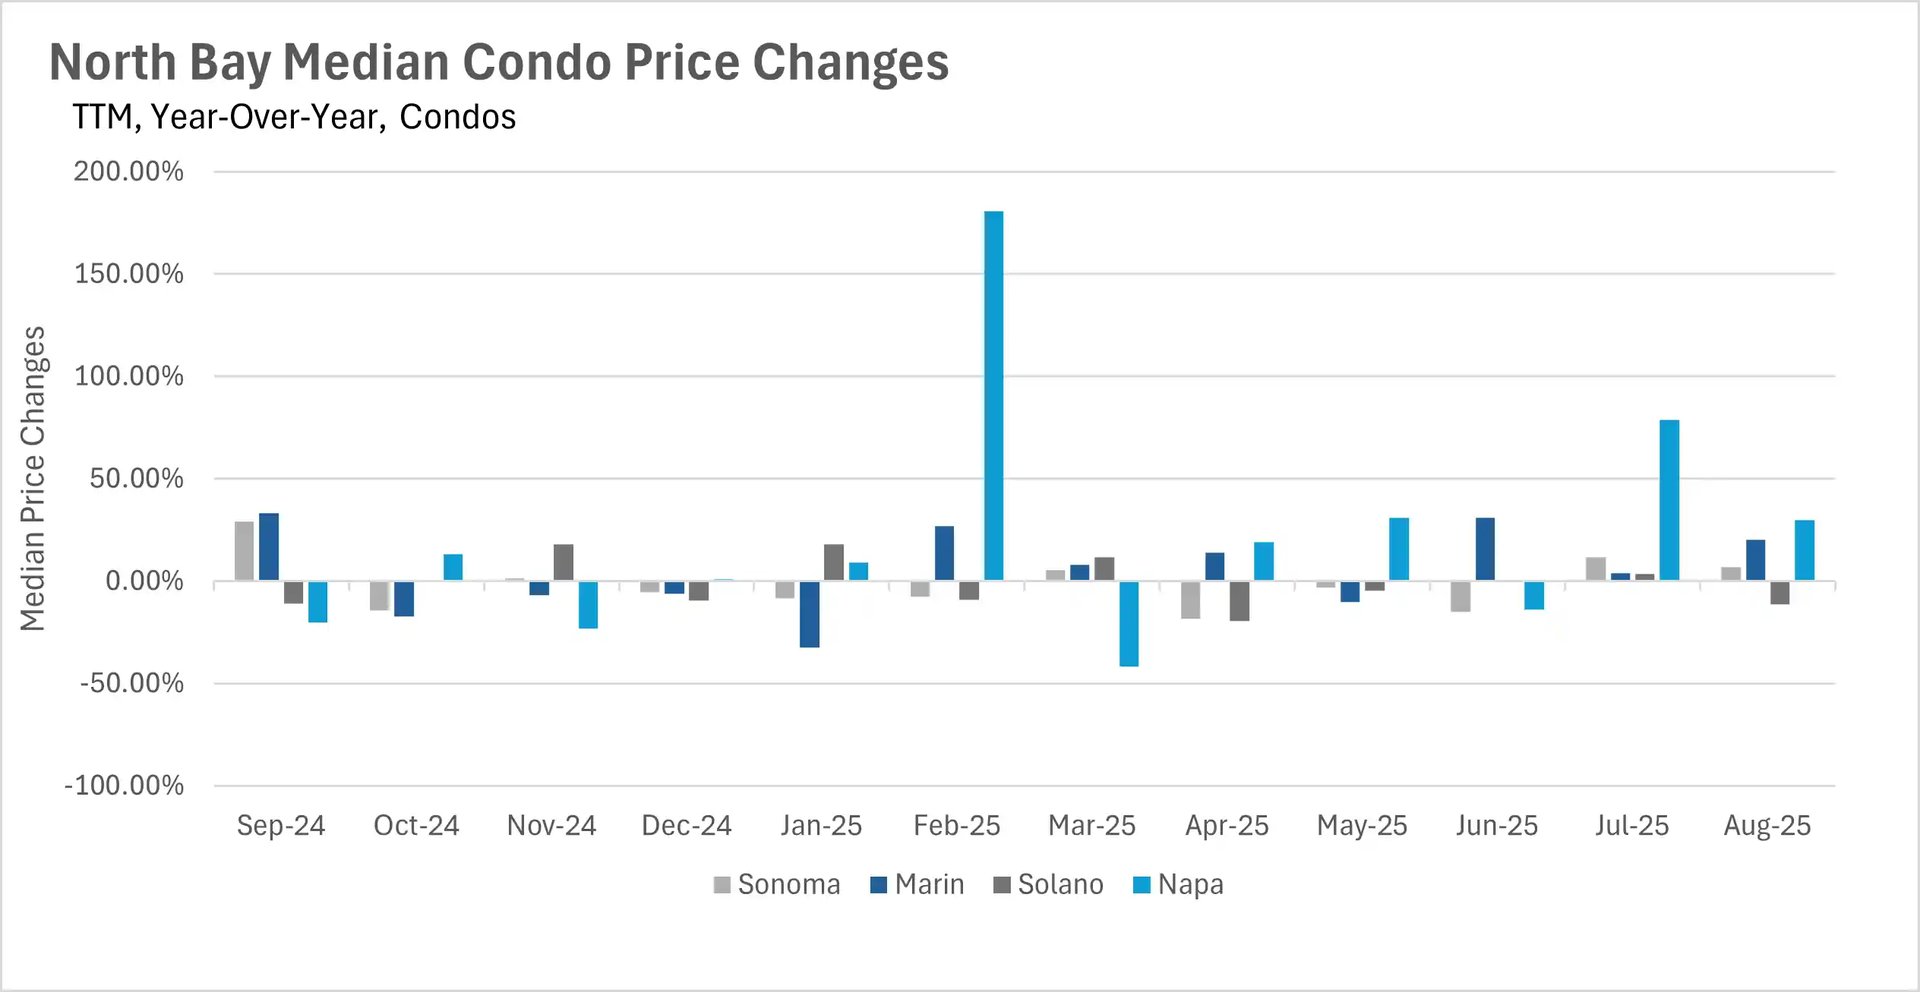
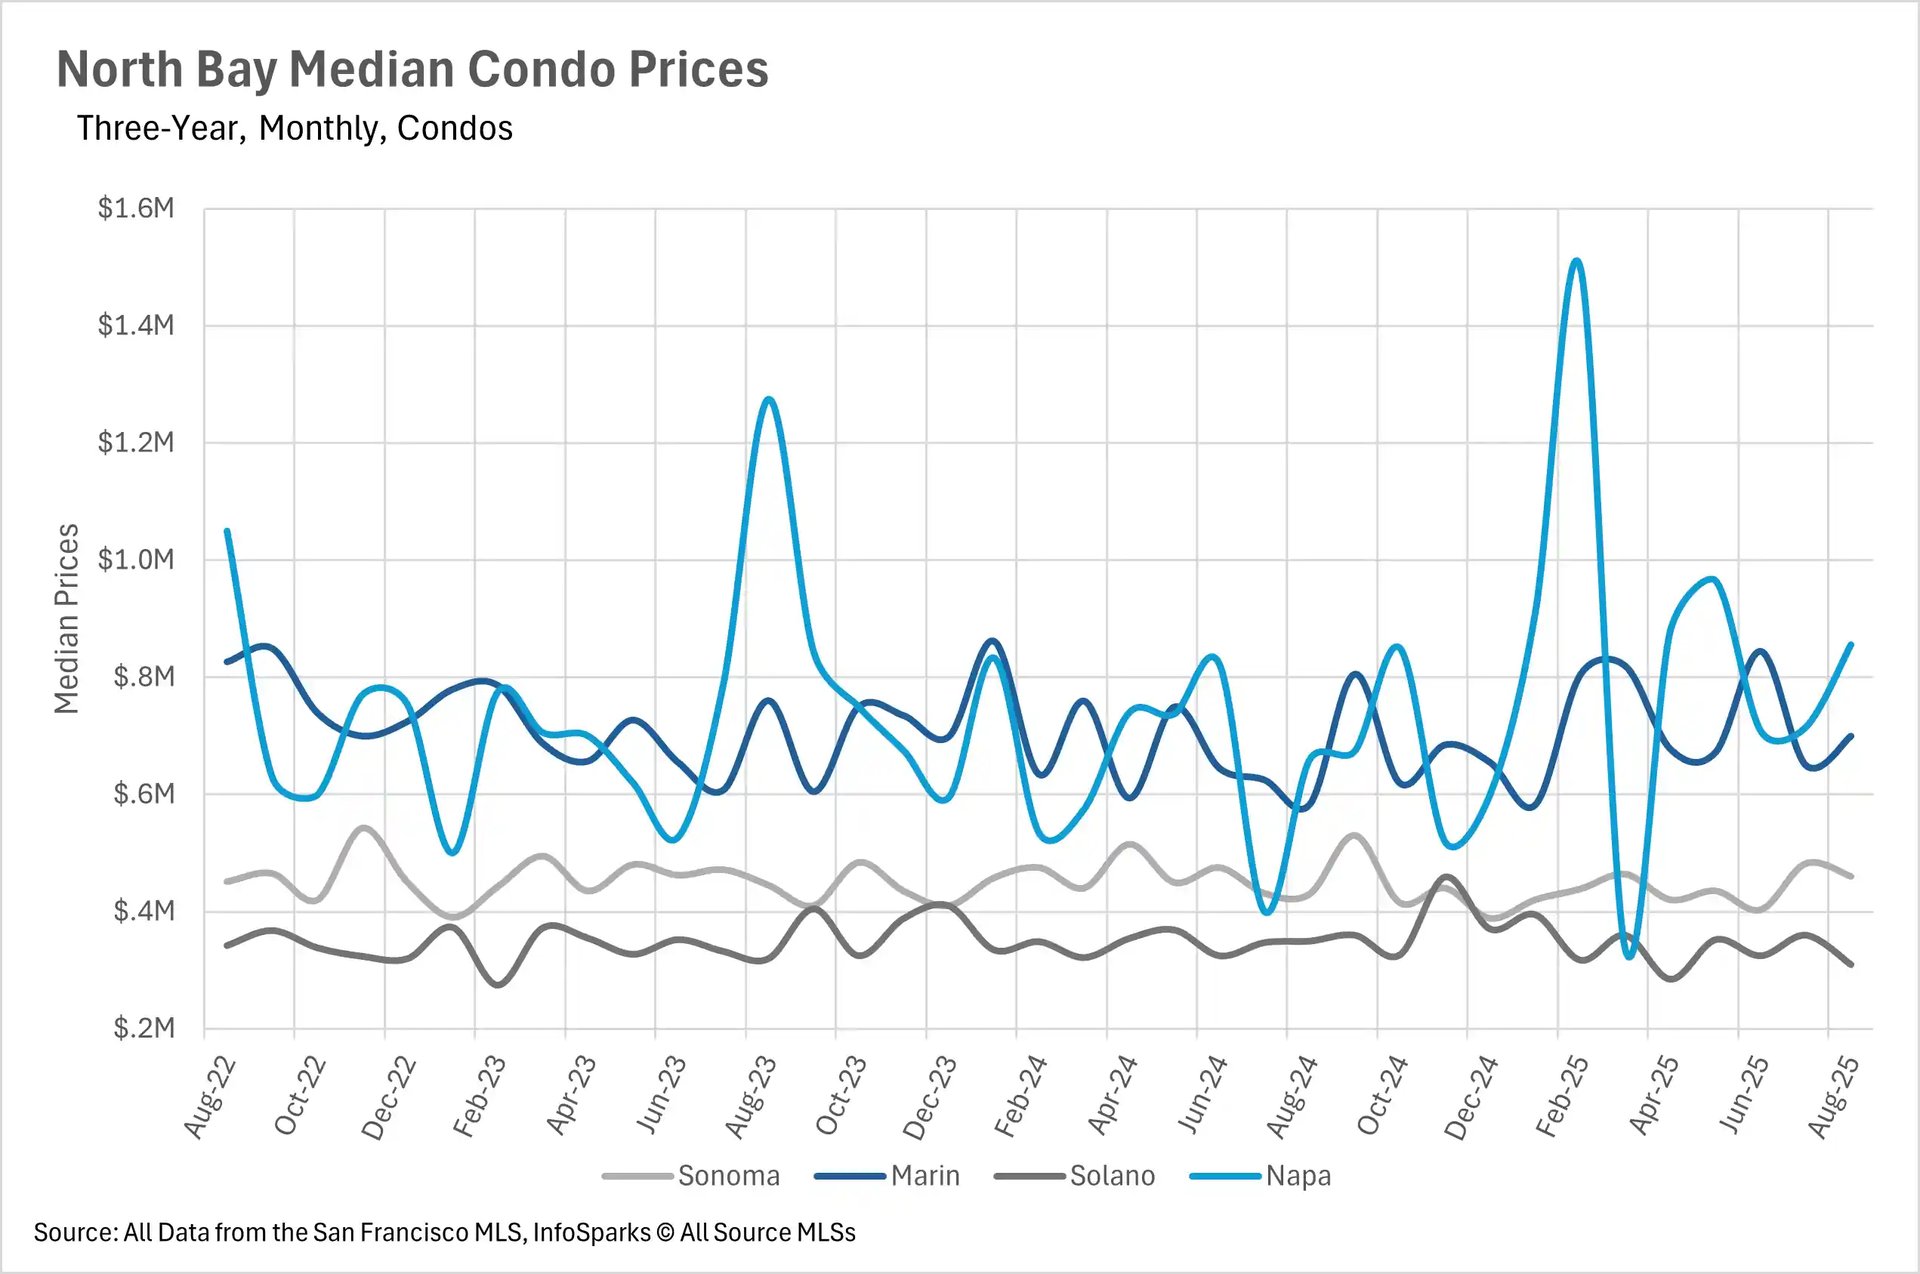
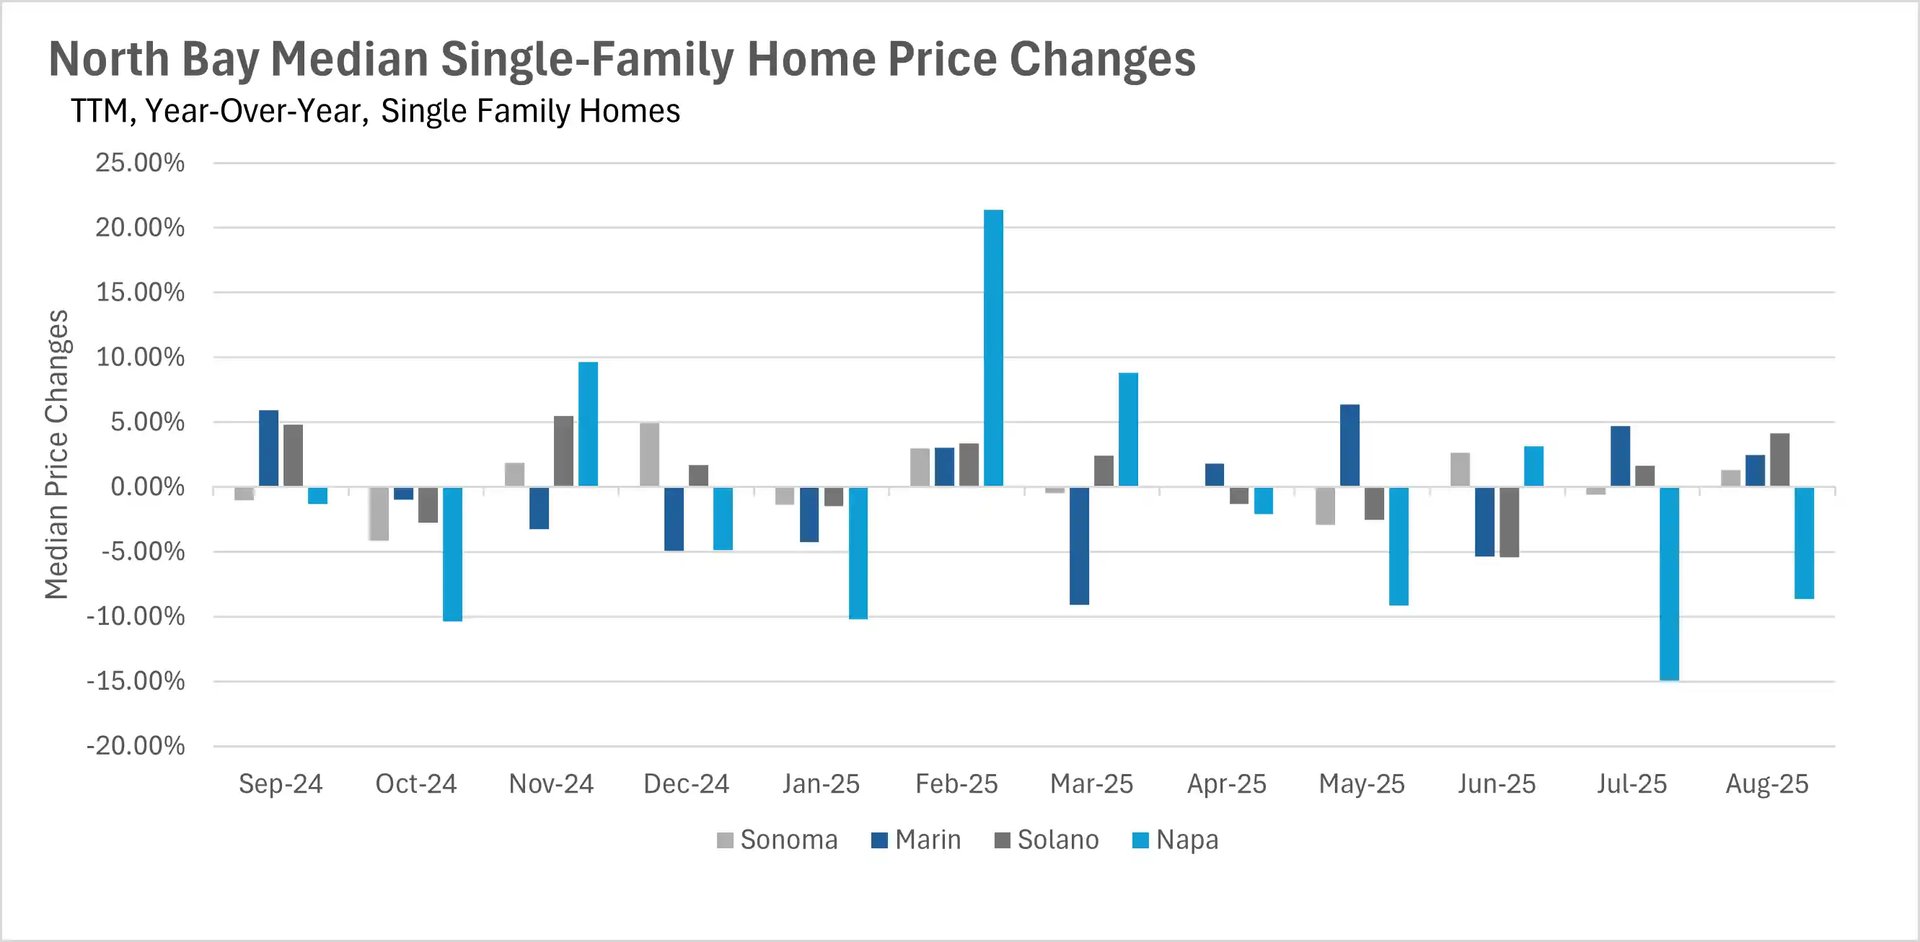
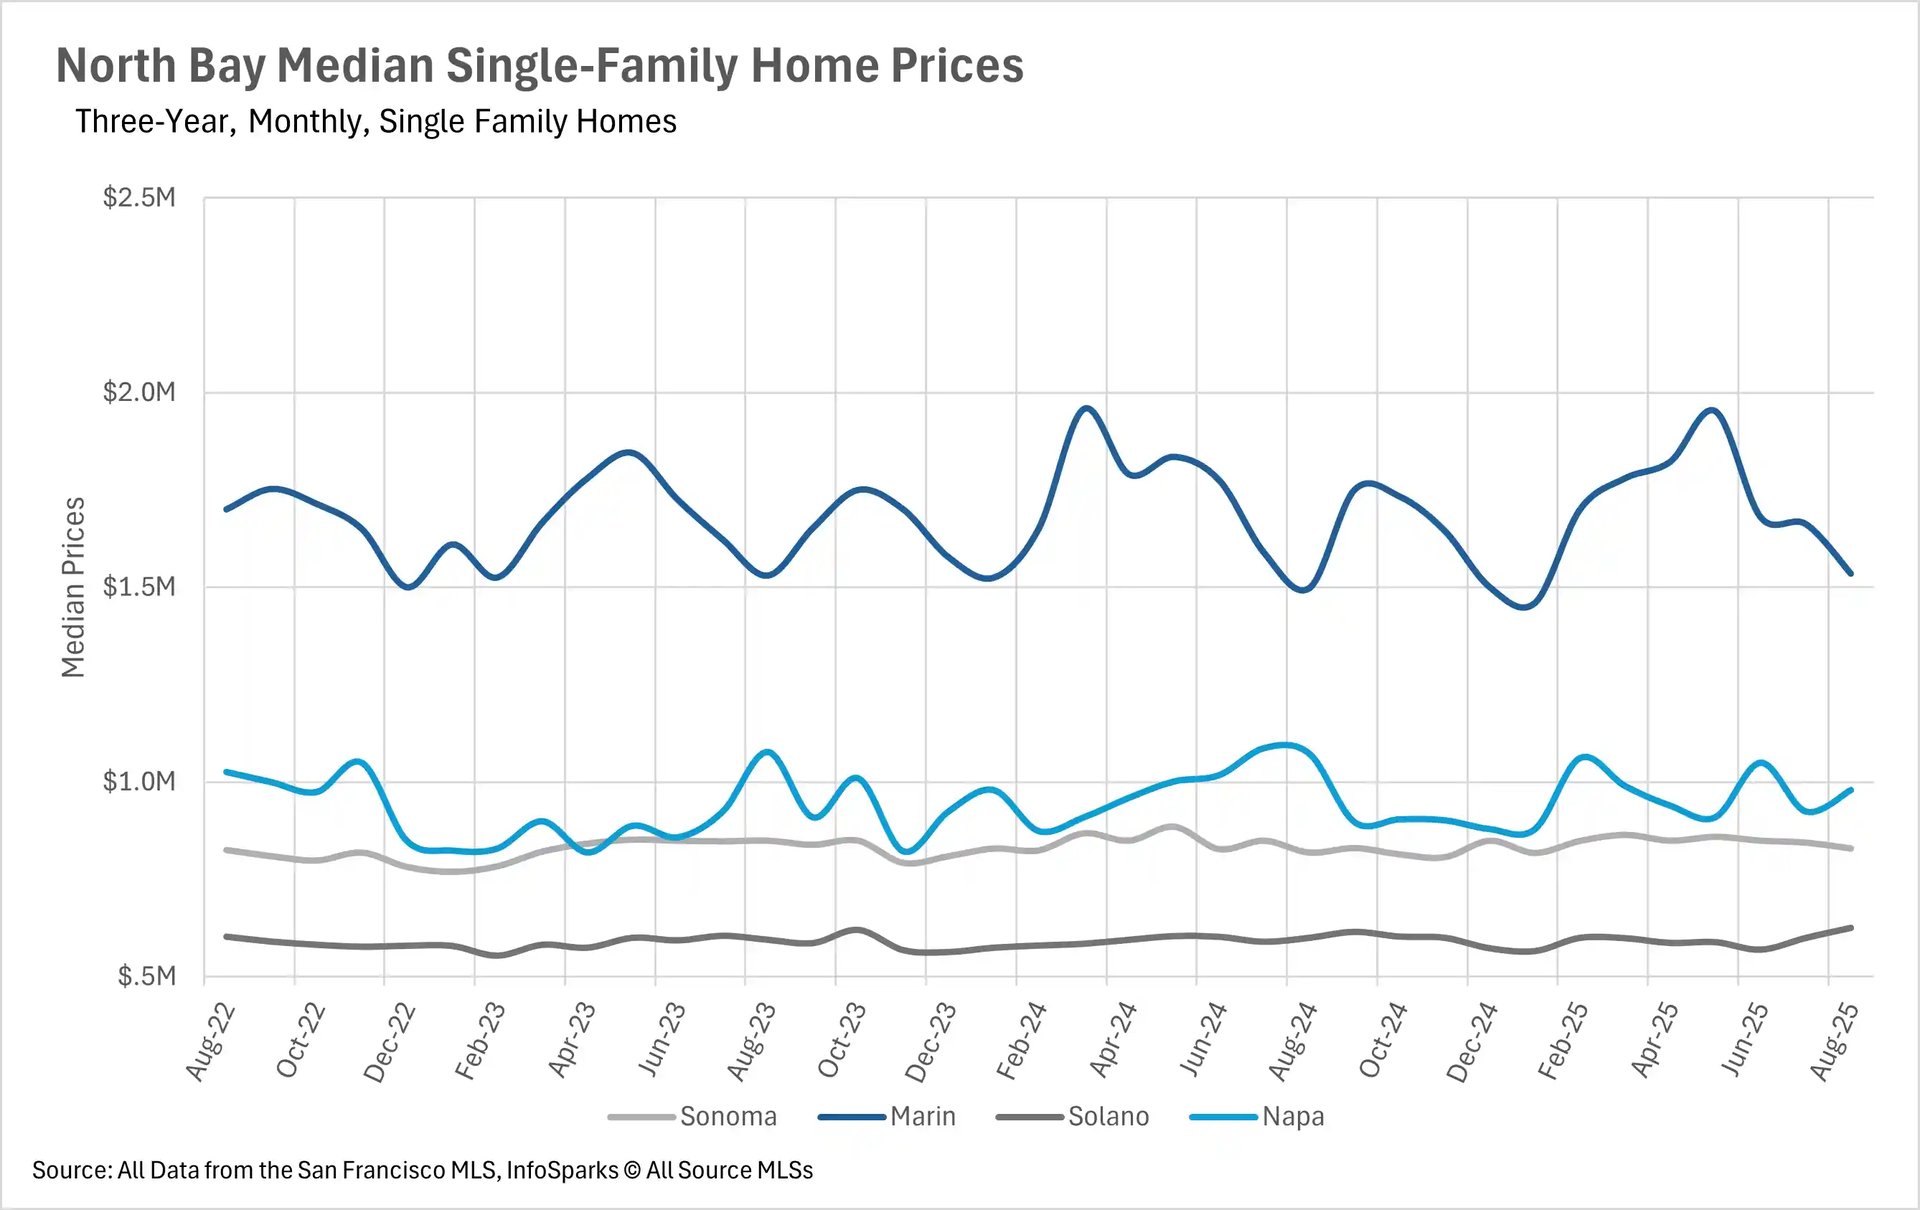
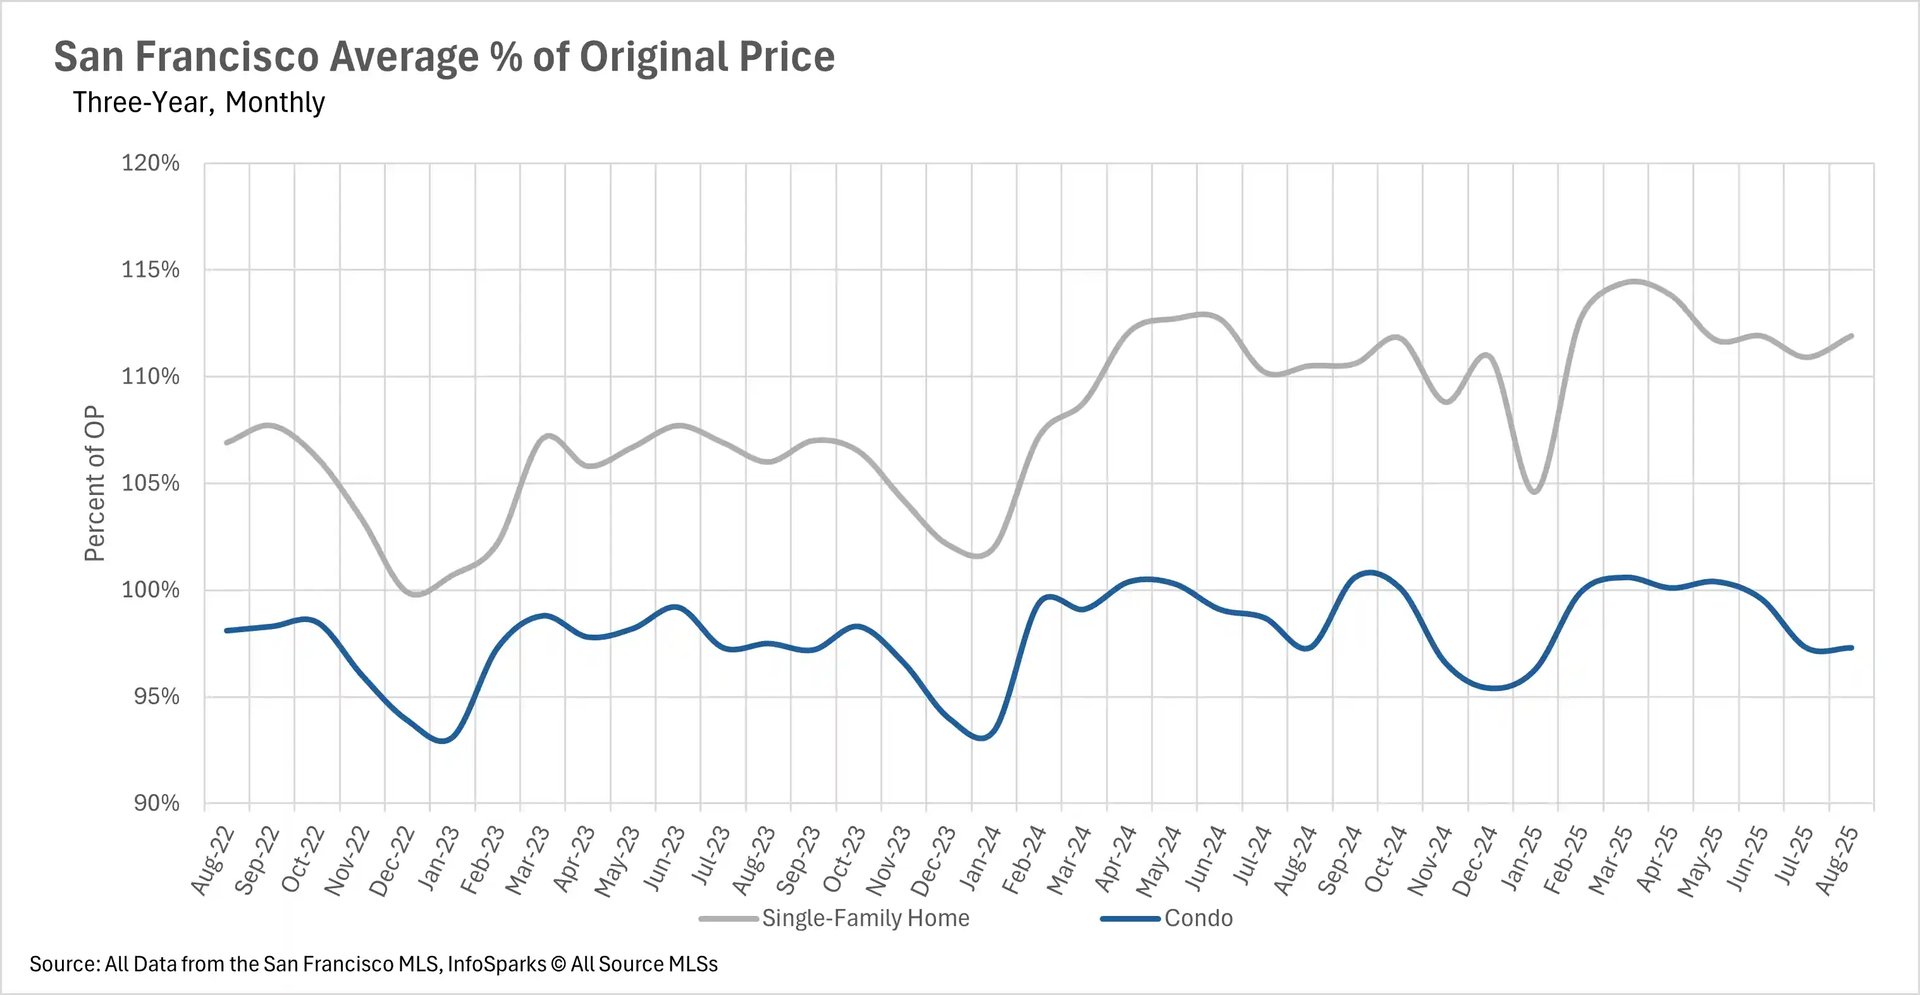
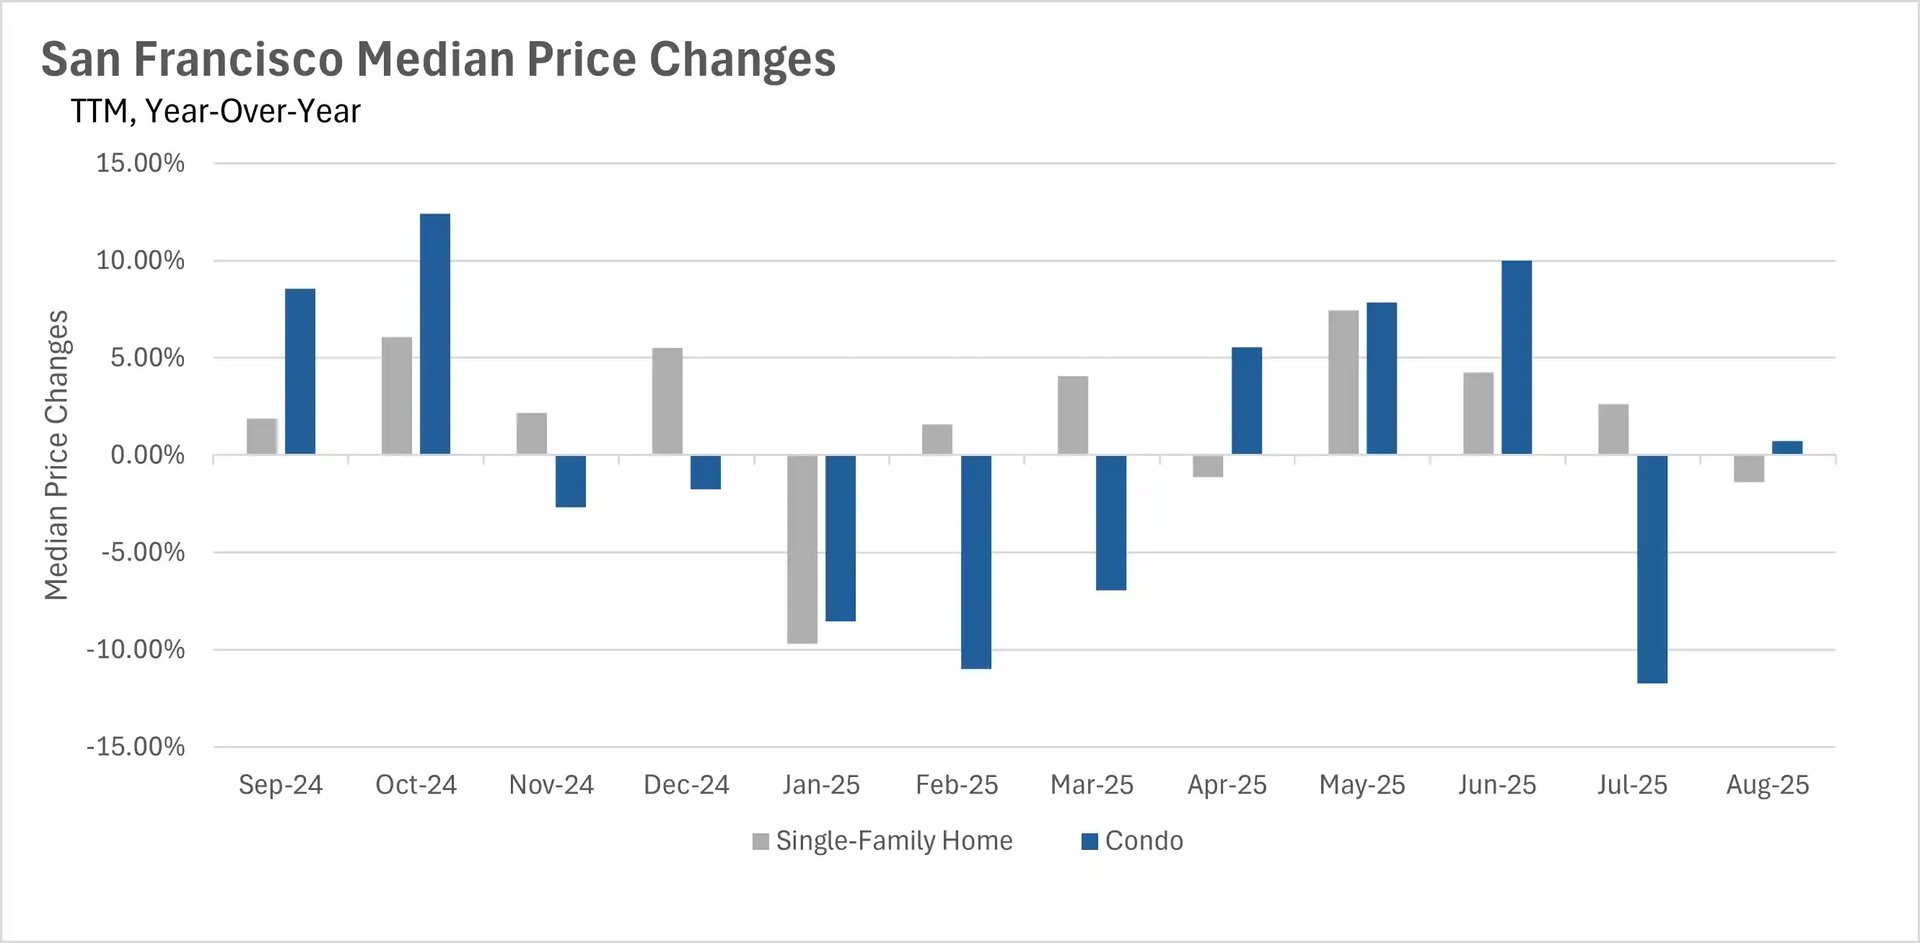
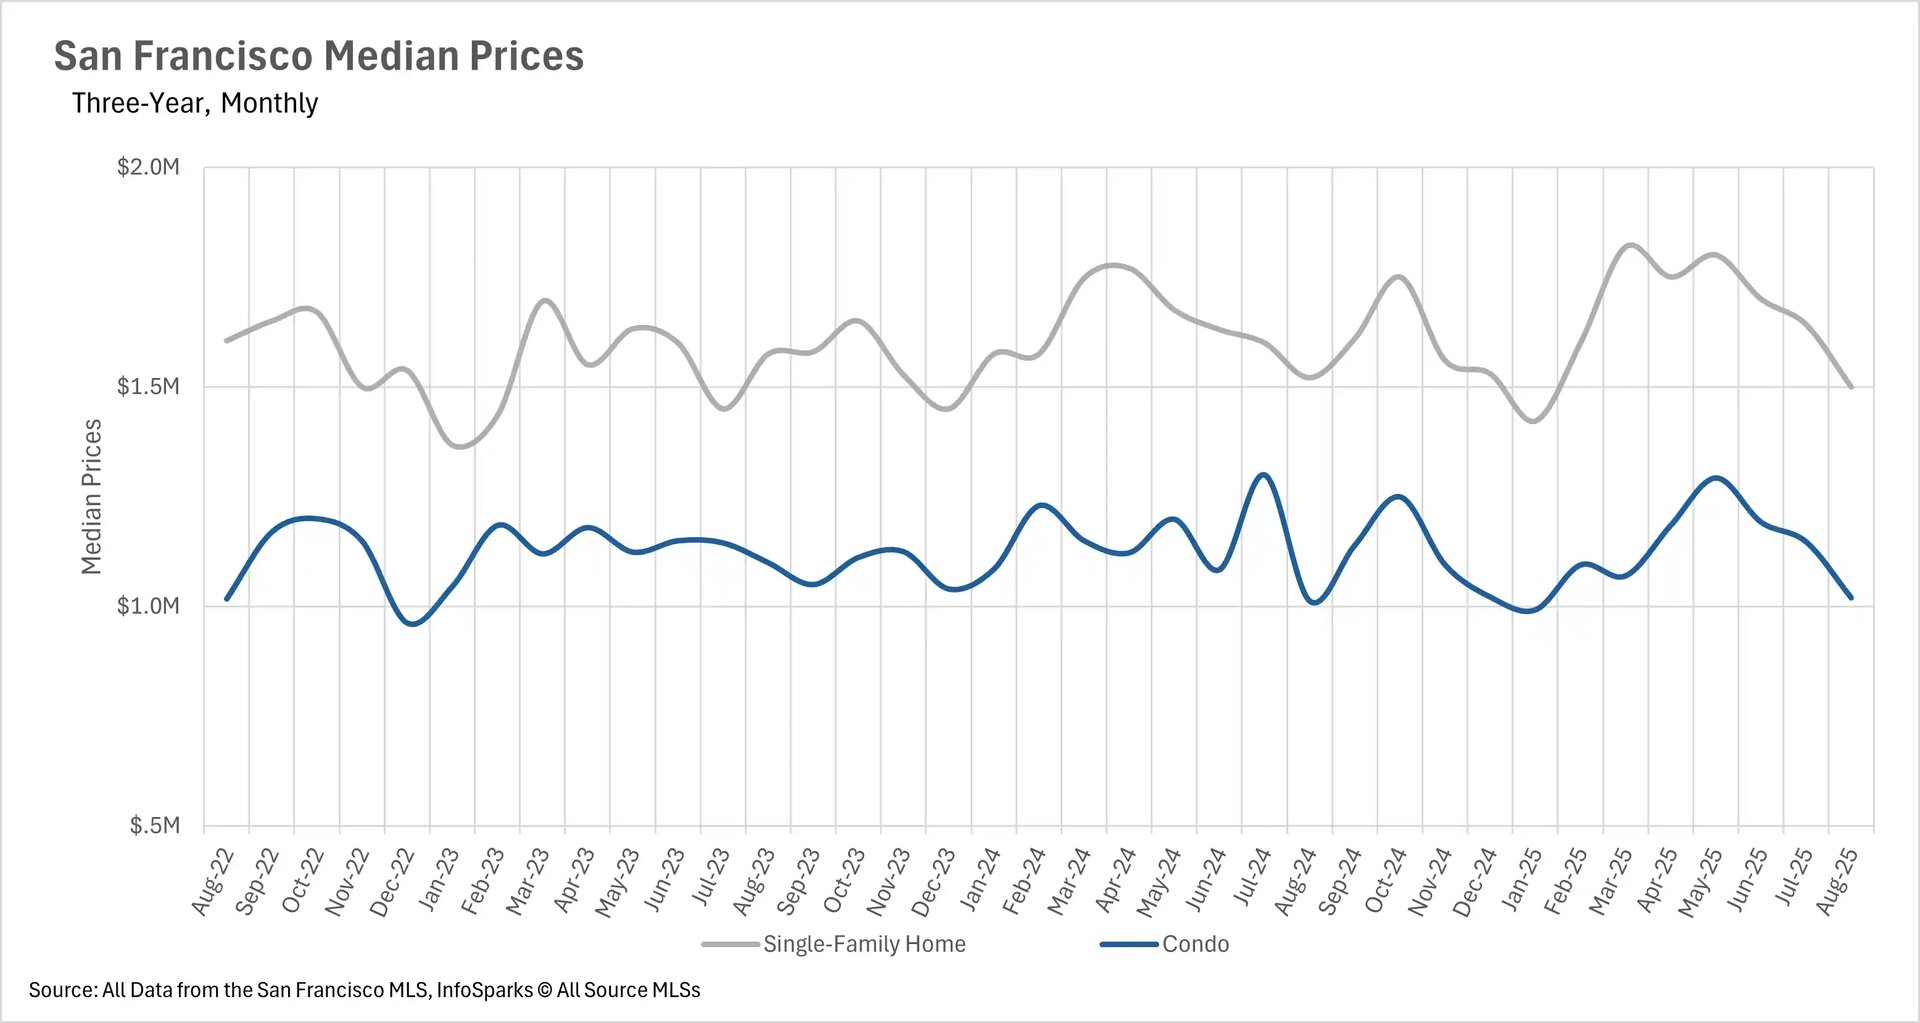
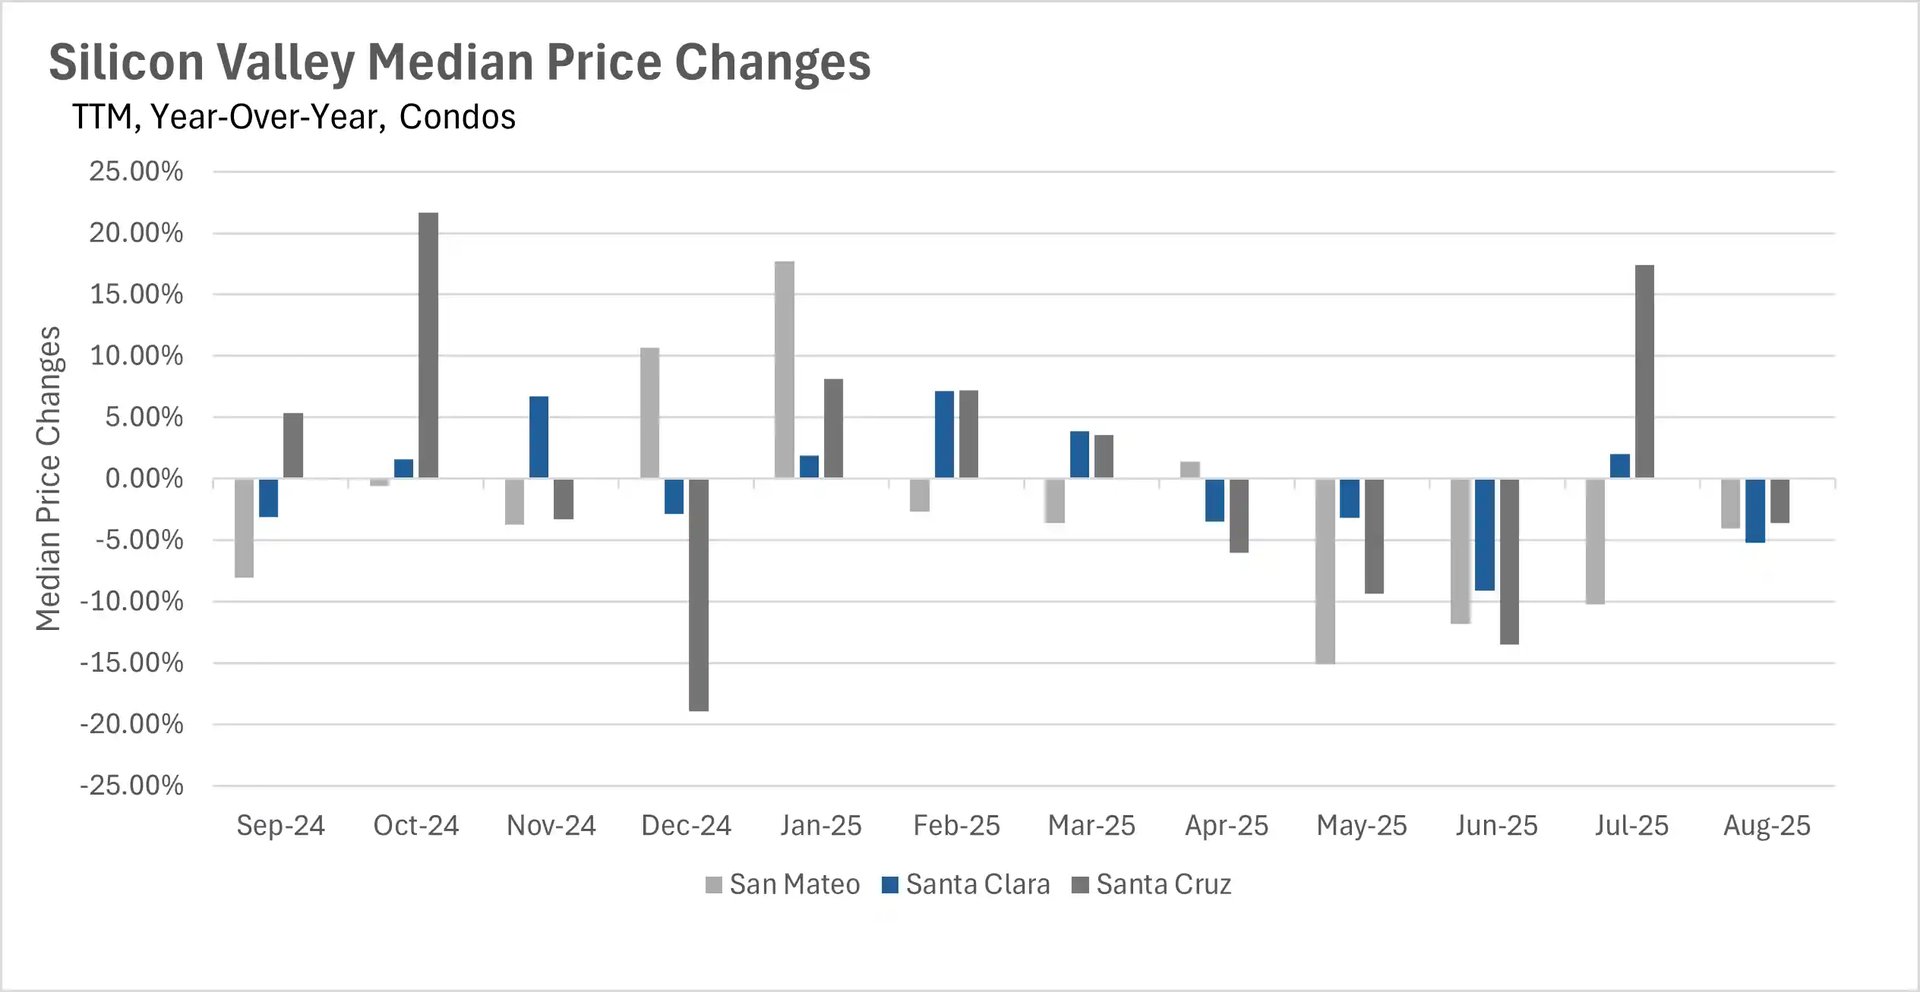
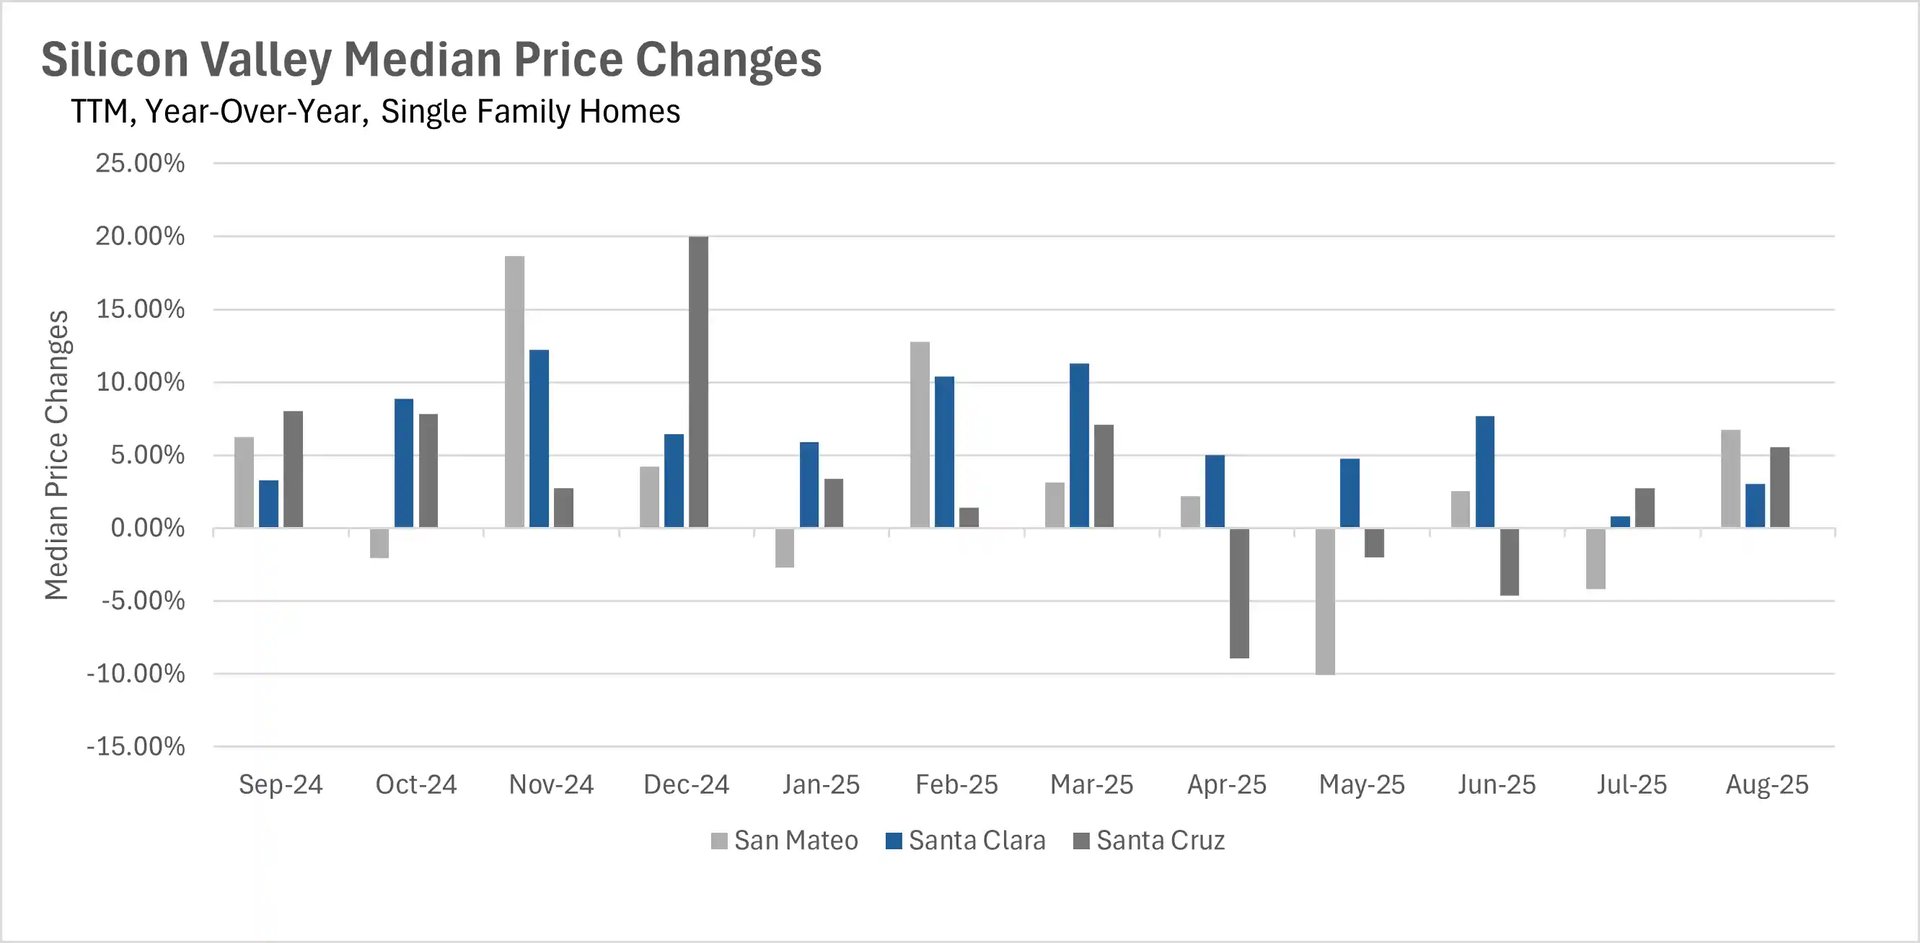
August showcased a remarkable turnaround for Bay Area single-family home markets after months of uncertainty. Silicon Valley led the recovery with price appreciation across all counties for the first time in four months - San Mateo County surged 6.74%, Santa Cruz gained 5.54%, and Santa Clara increased 3.01% year-over-year. The East Bay also returned to positive territory for the first time in six months, with Alameda and Contra Costa Counties posting modest gains of 1.20% and 1.33% respectively. The North Bay showed strong performance in most areas, with Solano County up 4.17%, Marin County gaining 2.47%, and Sonoma County rising 1.29%, though Napa County experienced a significant 8.67% decline. San Francisco displayed unusual stability with single-family homes down just 1.38% and condos up a modest 0.74% - a stark contrast to its typical volatility. However, condo markets throughout the region continued to face headwinds, with Silicon Valley experiencing broad declines ranging from 3.64% in Santa Cruz to 5.20% in Santa Clara County. The East Bay's condo market remained mixed, with Contra Costa County up 2.04% but Alameda County down 7.41%. North Bay condos showed extreme volatility, with dramatic increases in Napa (29.76%), Marin (20.07%), and Sonoma (6.98%) Counties, while Solano County declined 11.43%.
Inventory normalization accelerates with San Francisco reaching historic lows
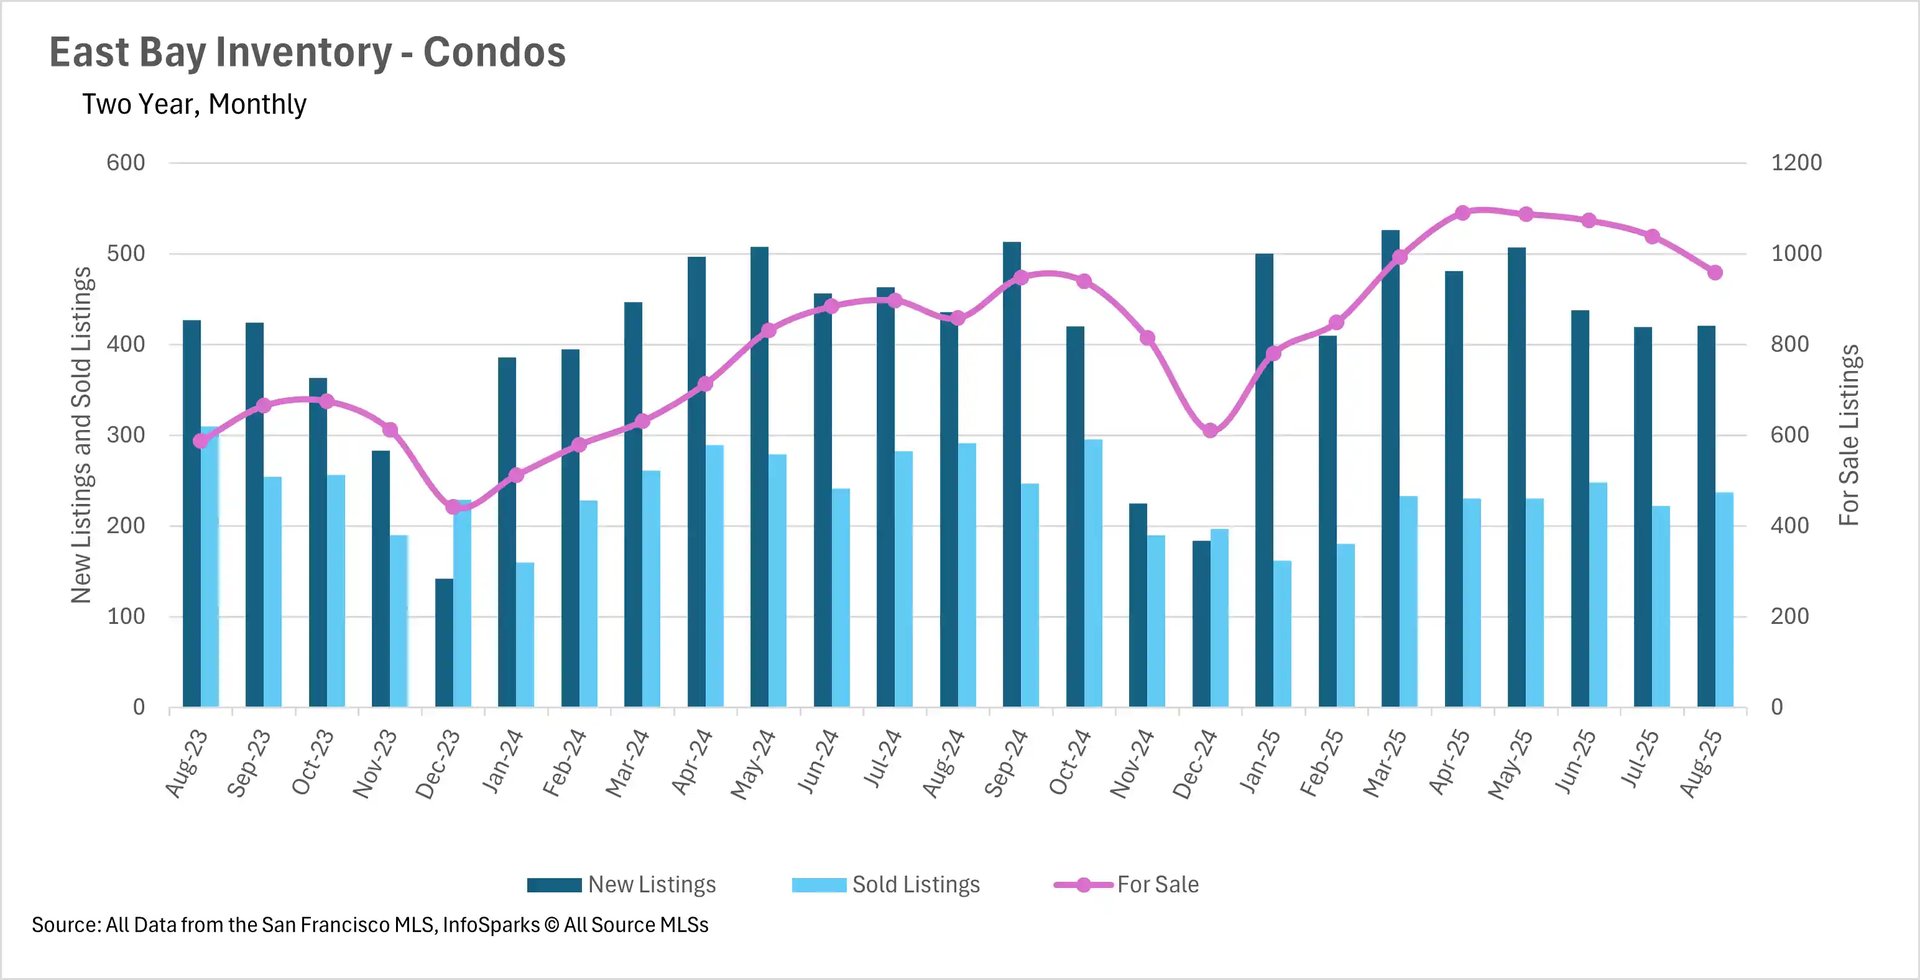
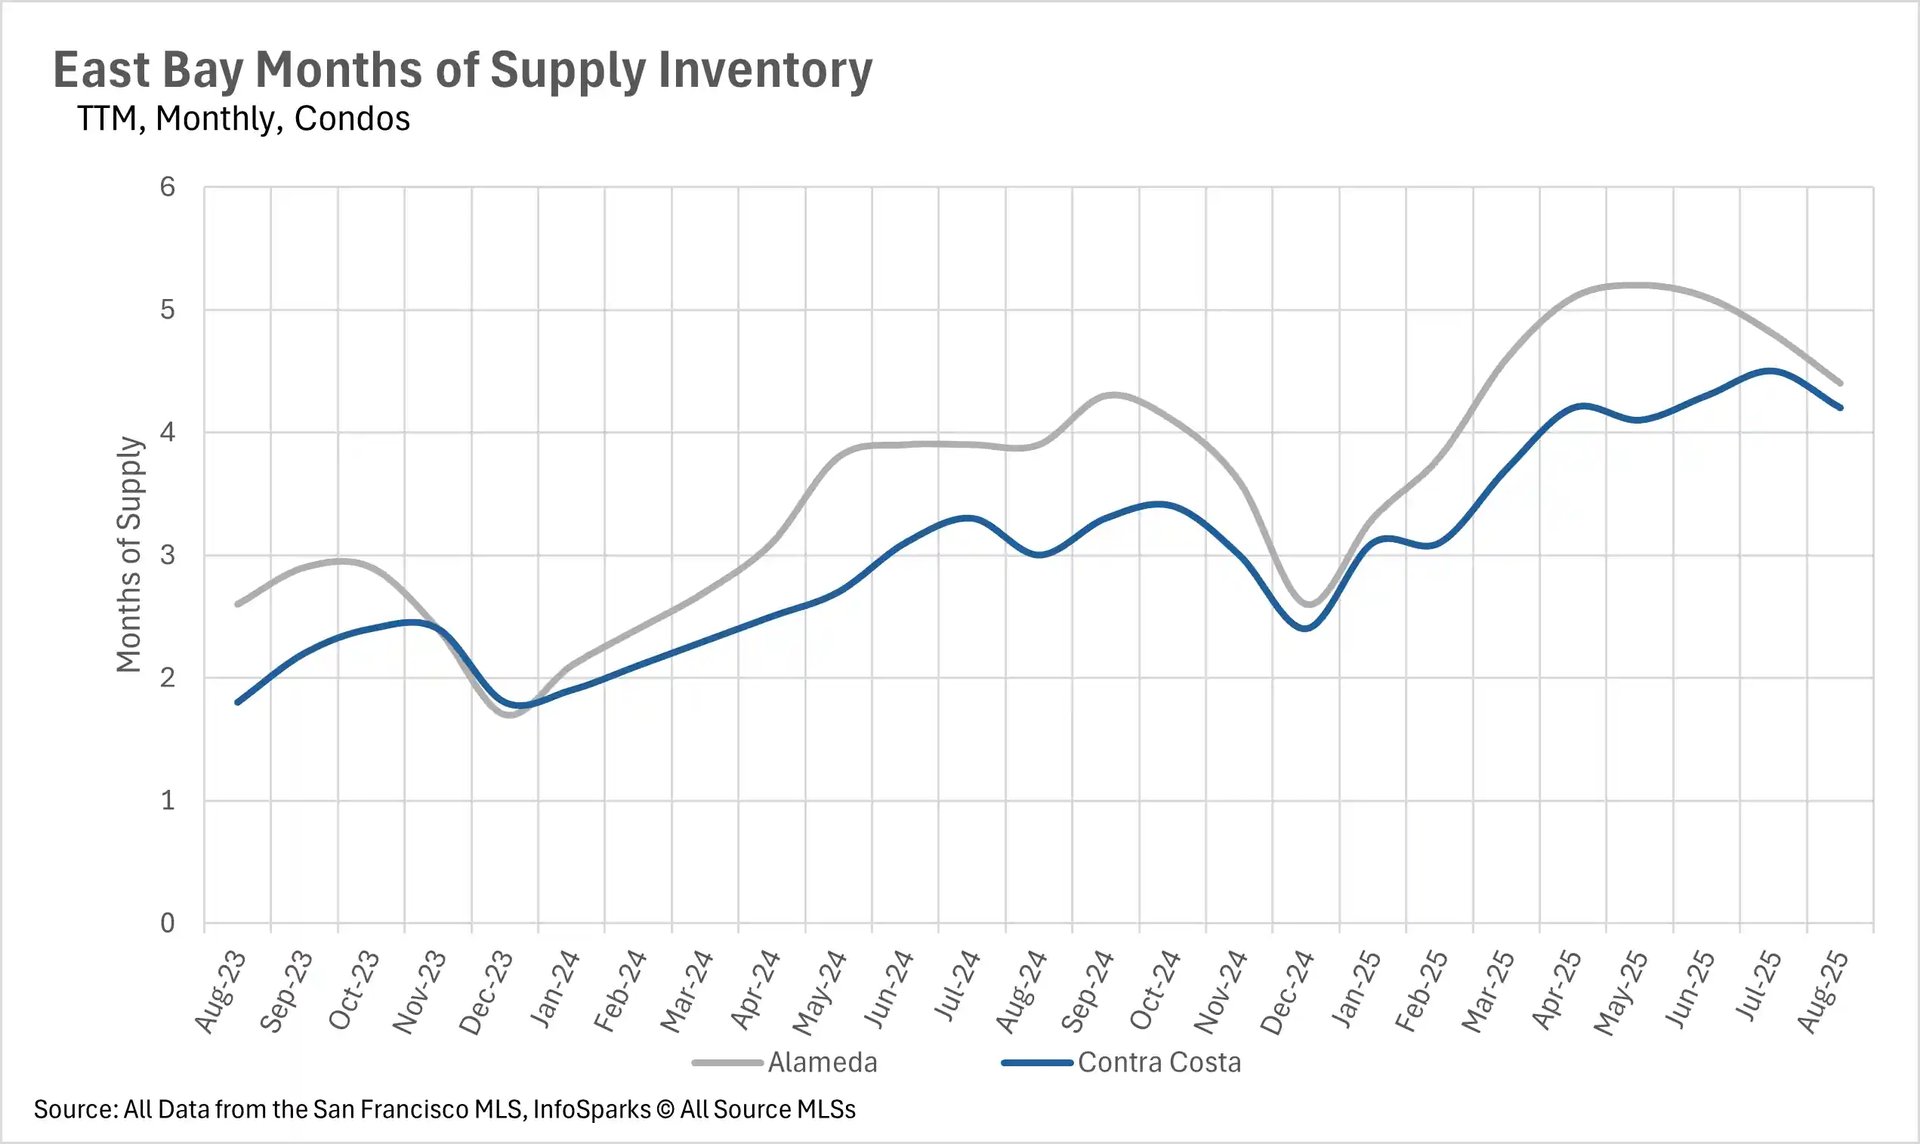
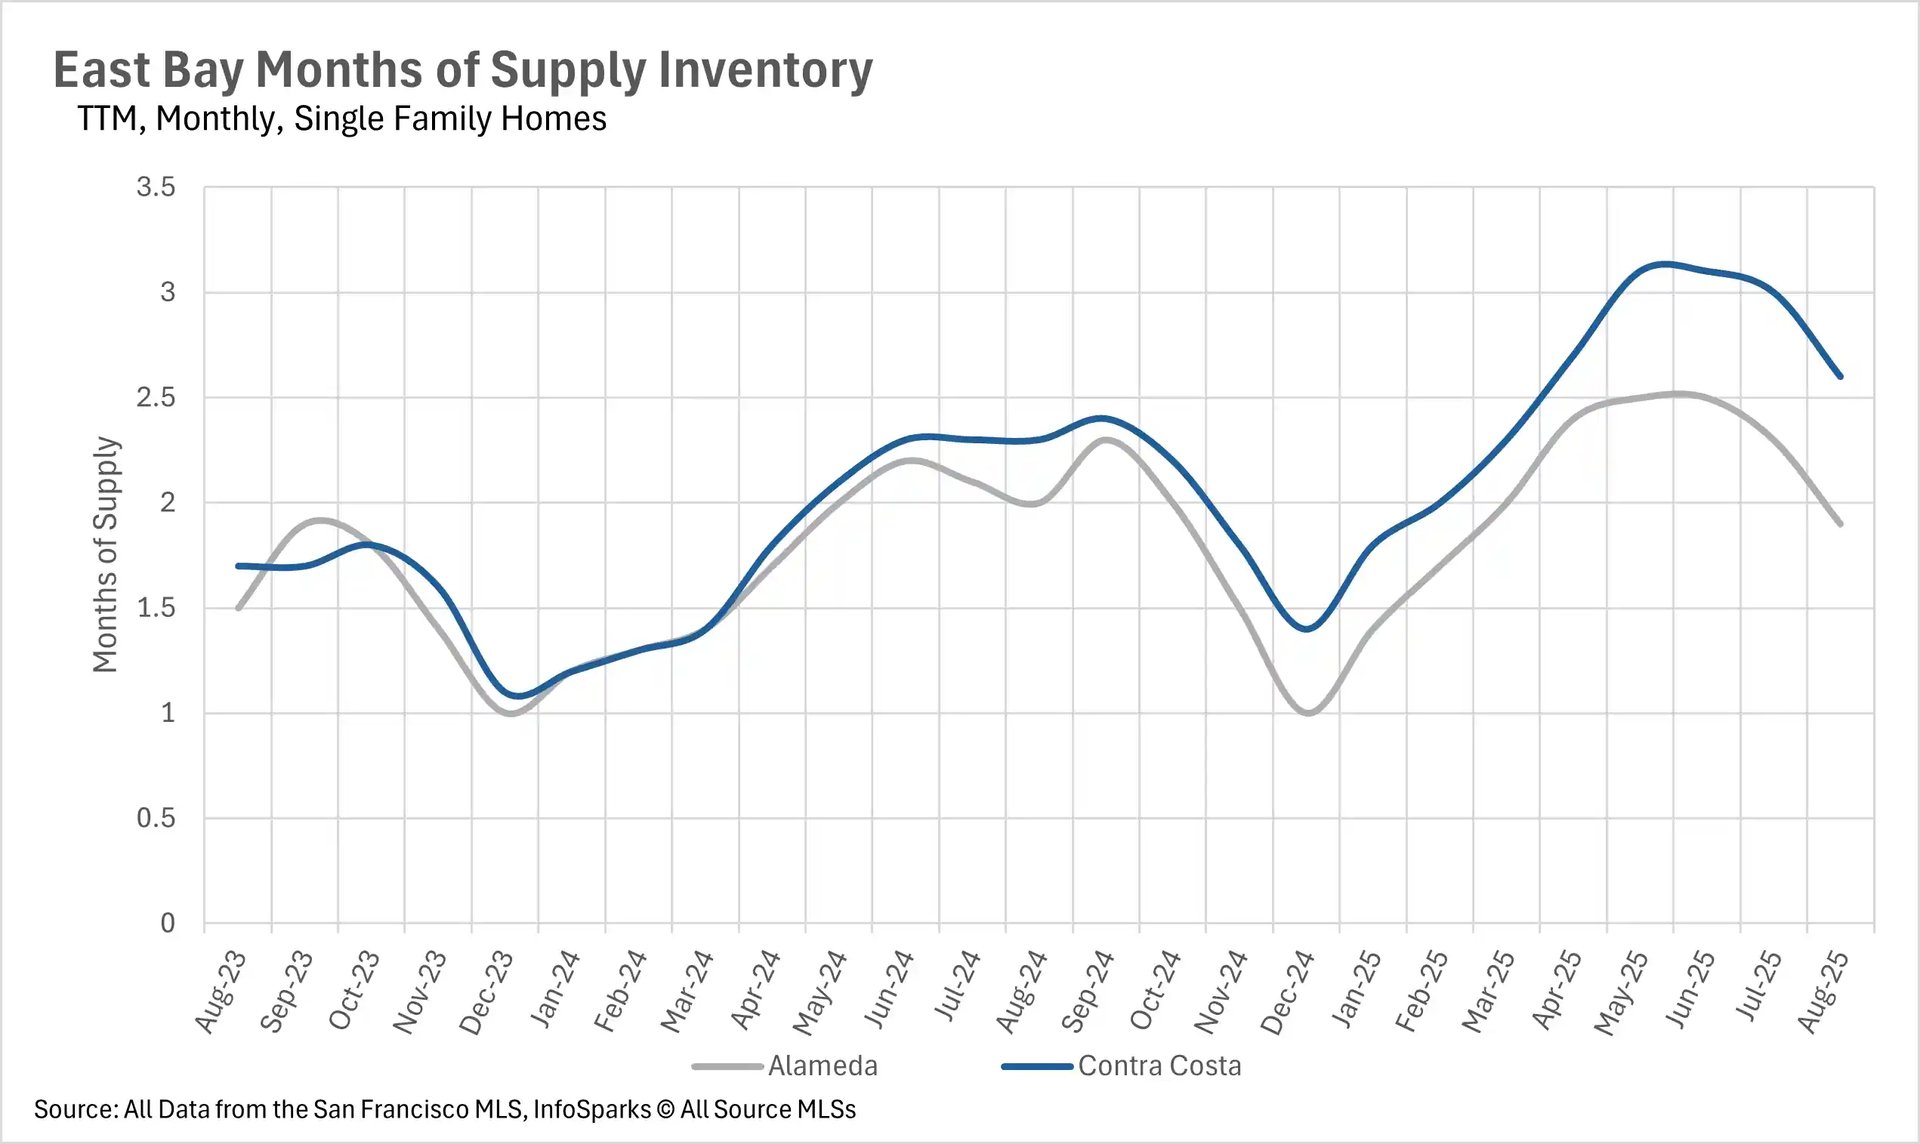
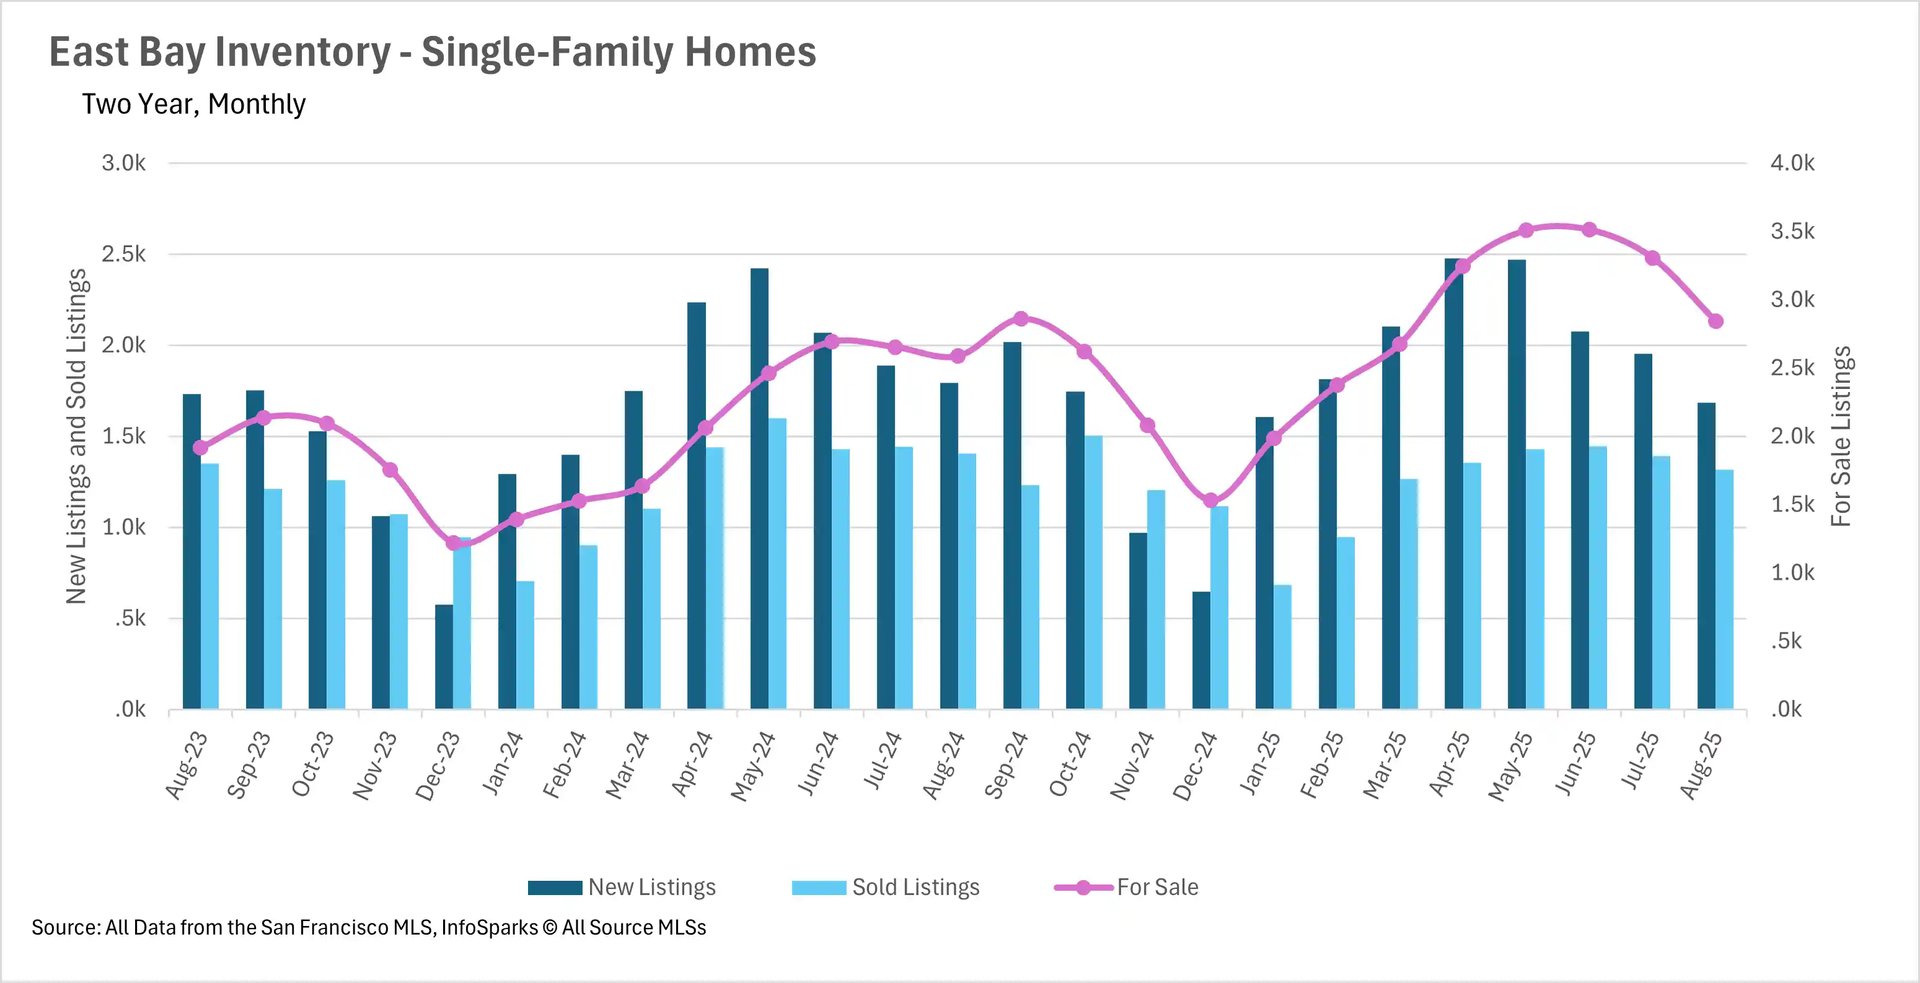
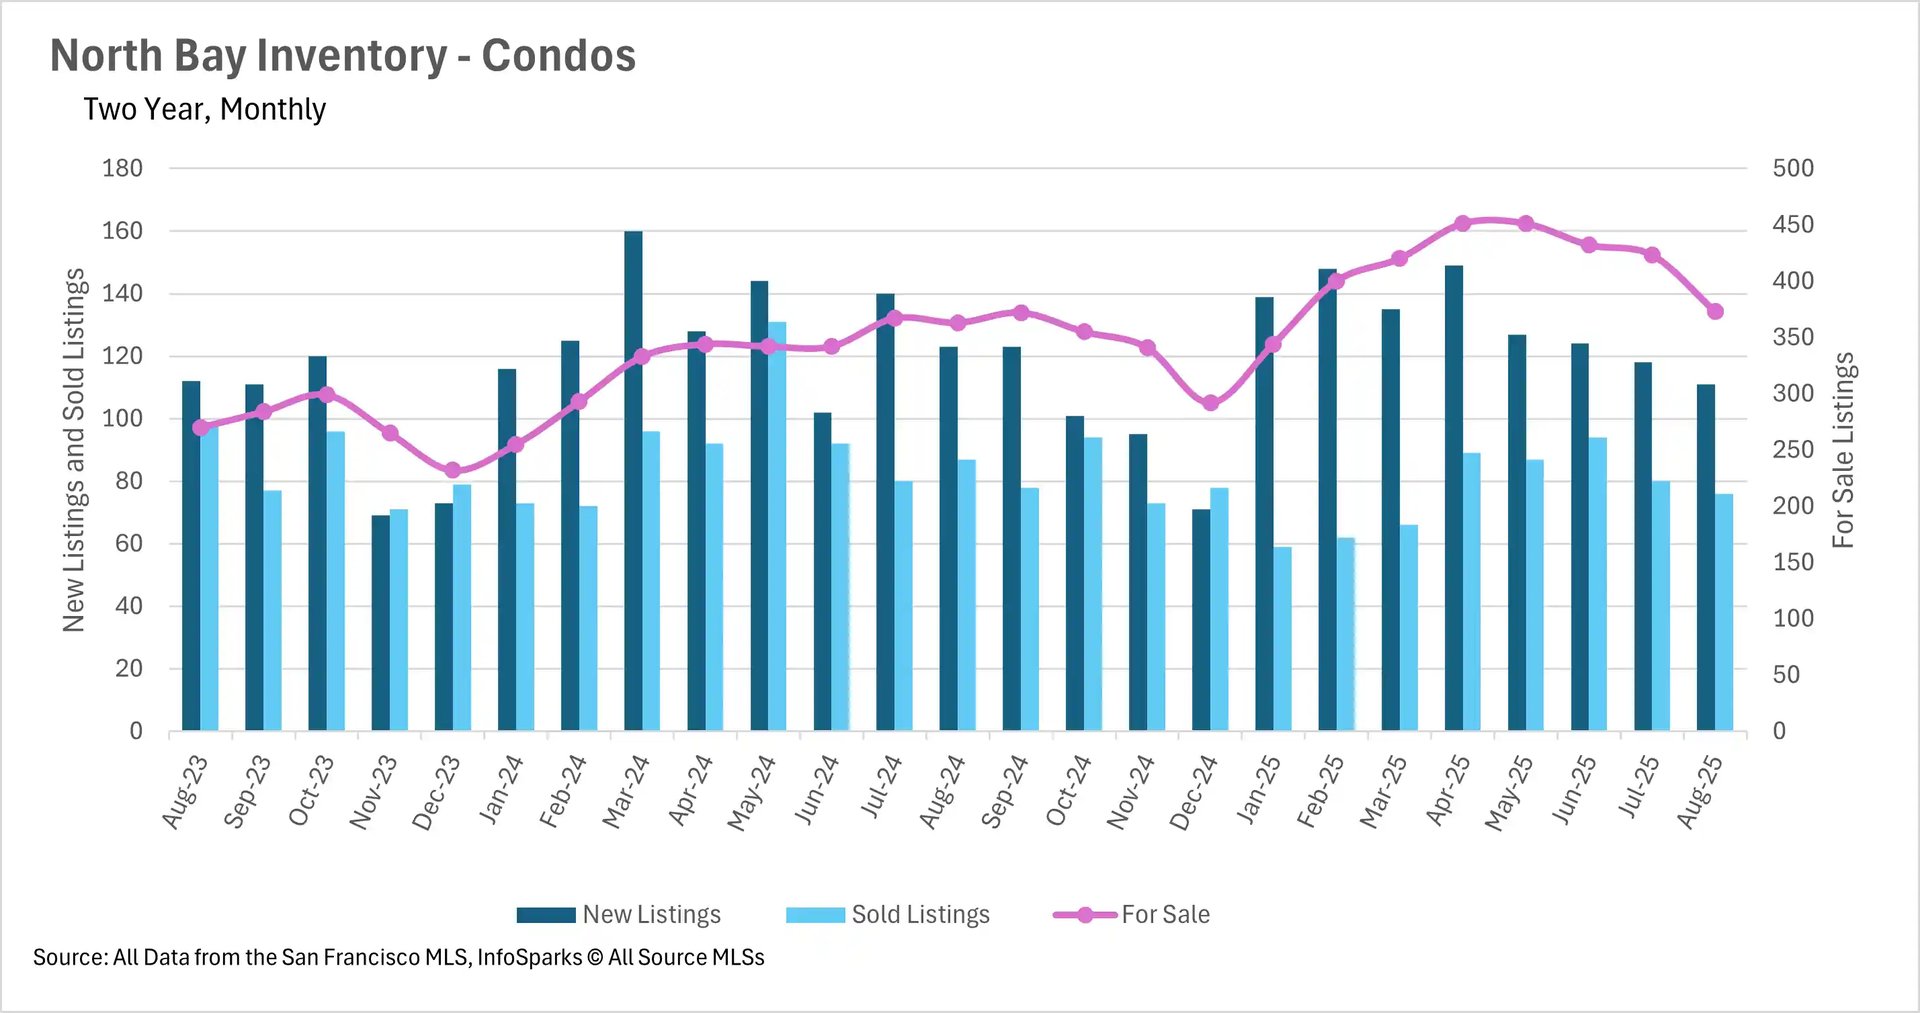
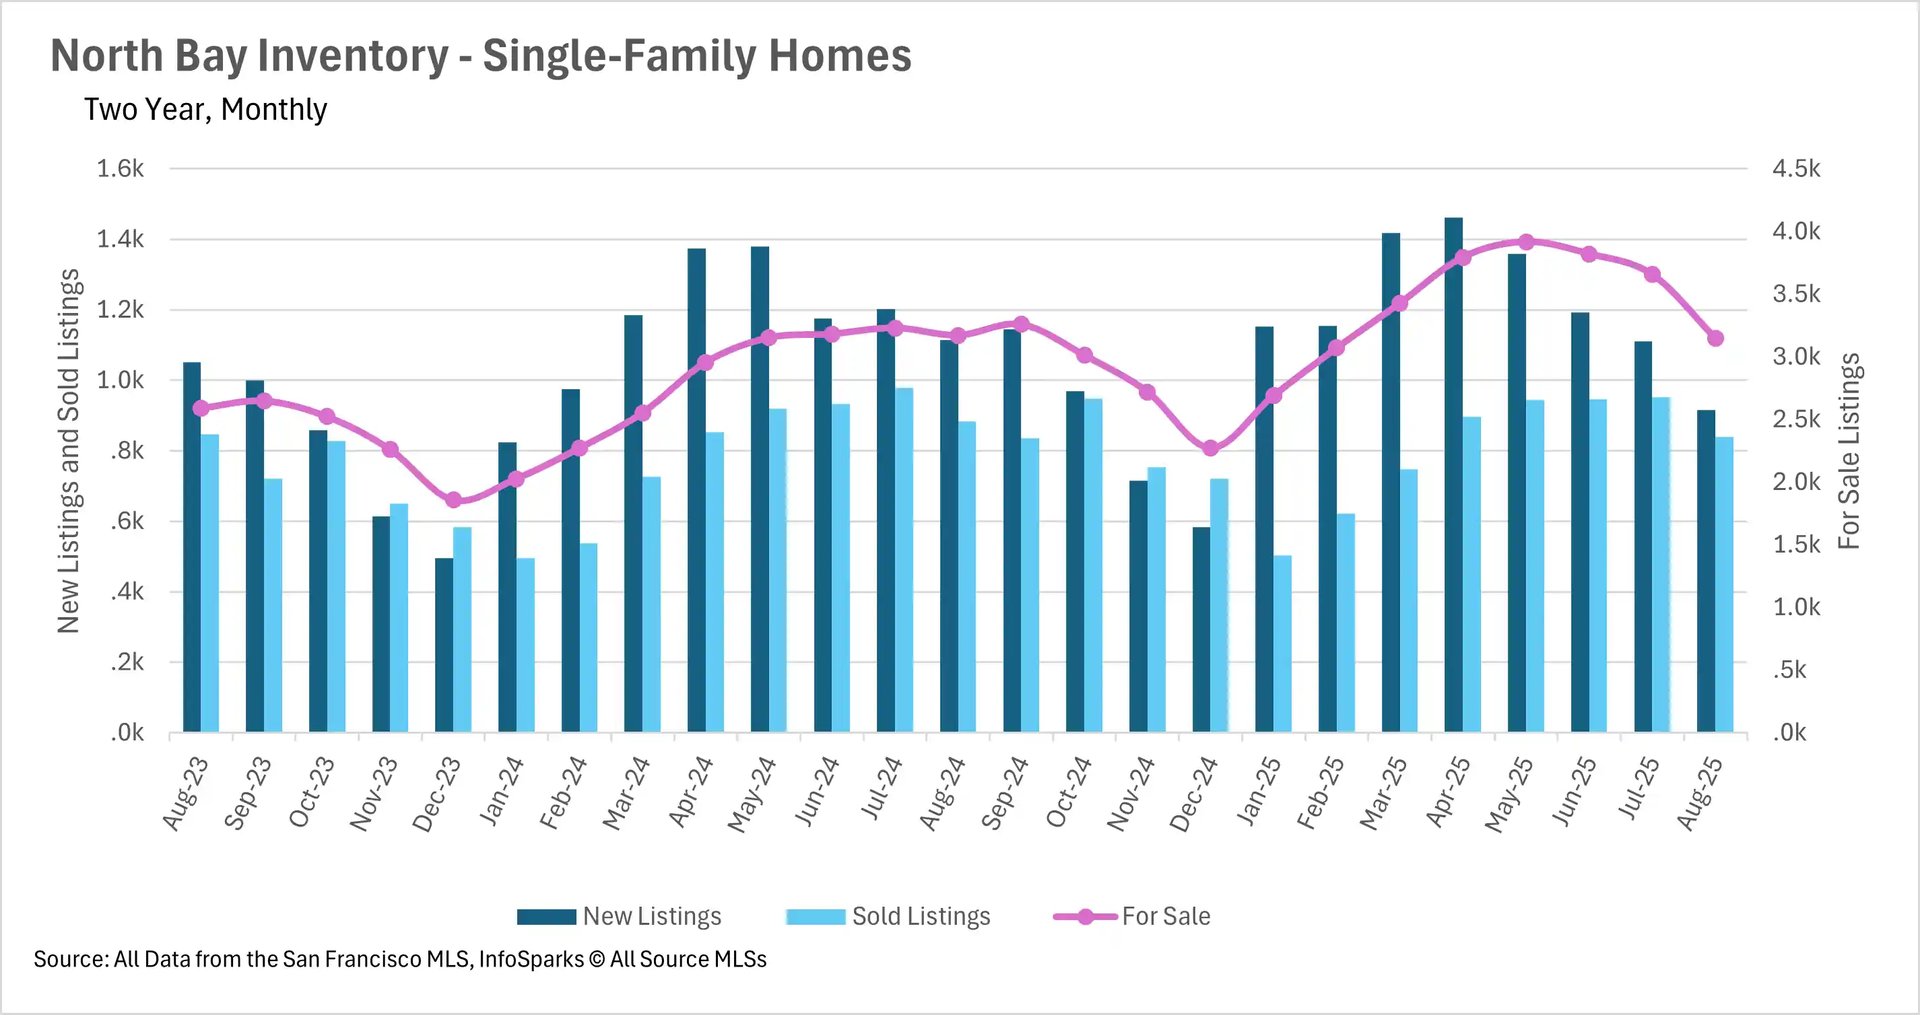
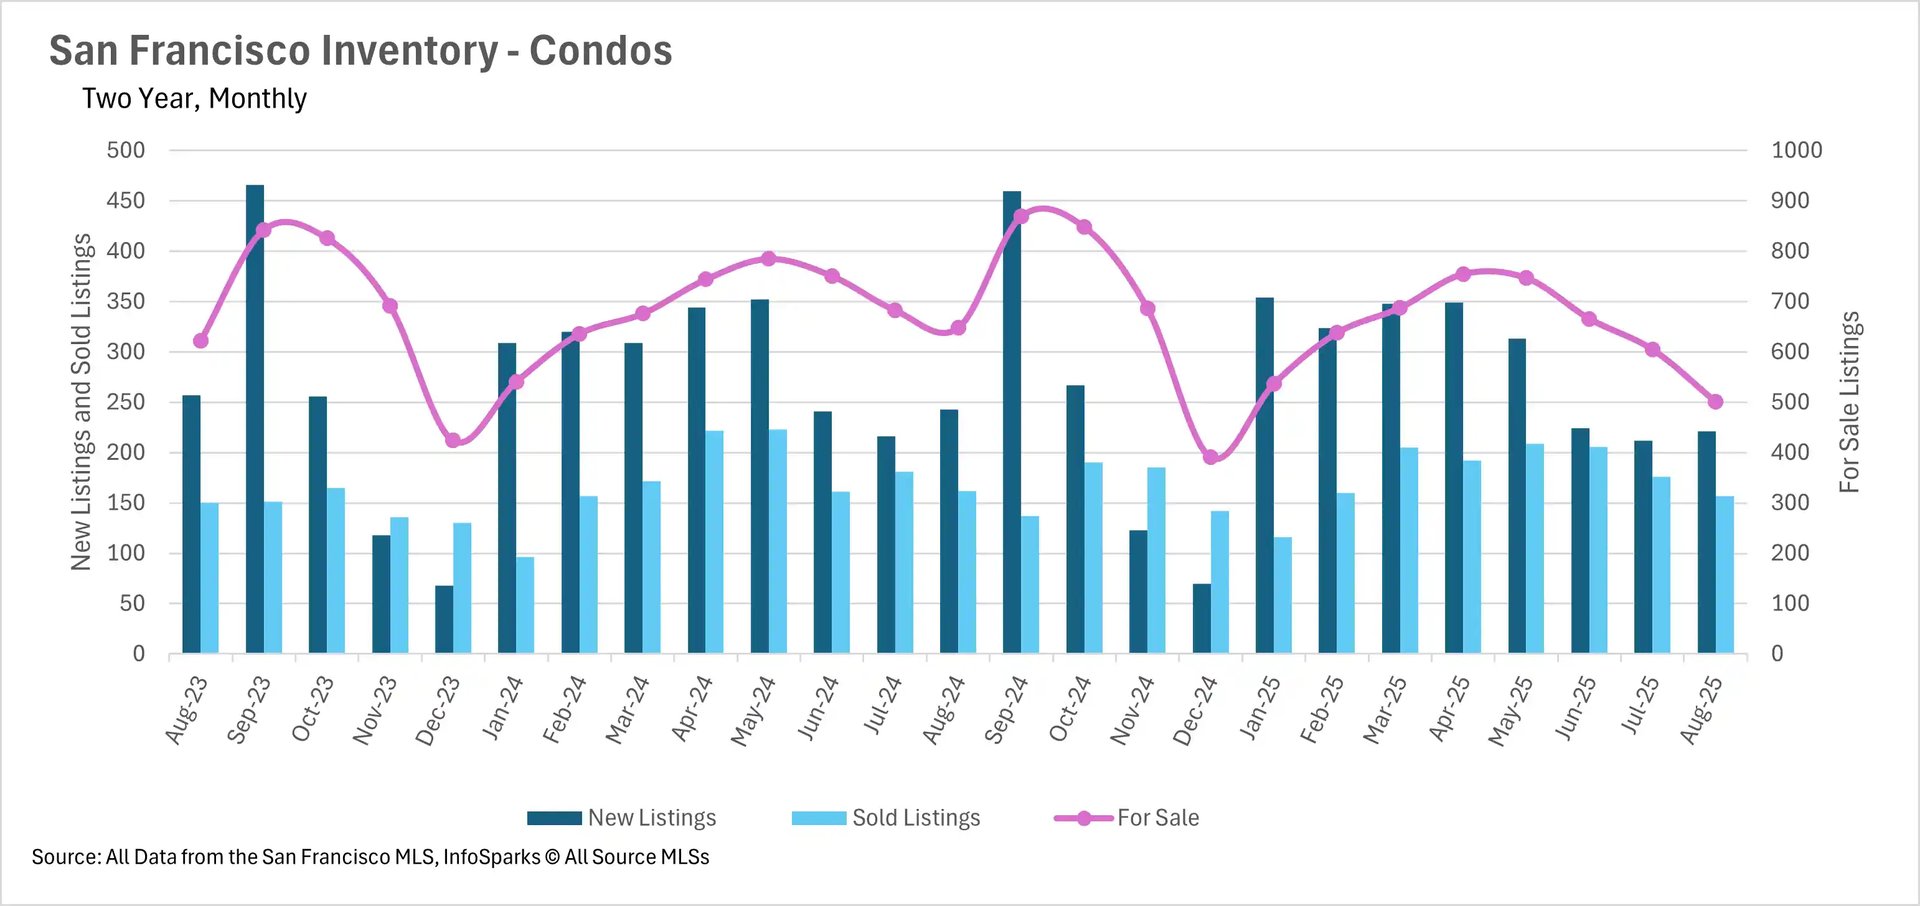
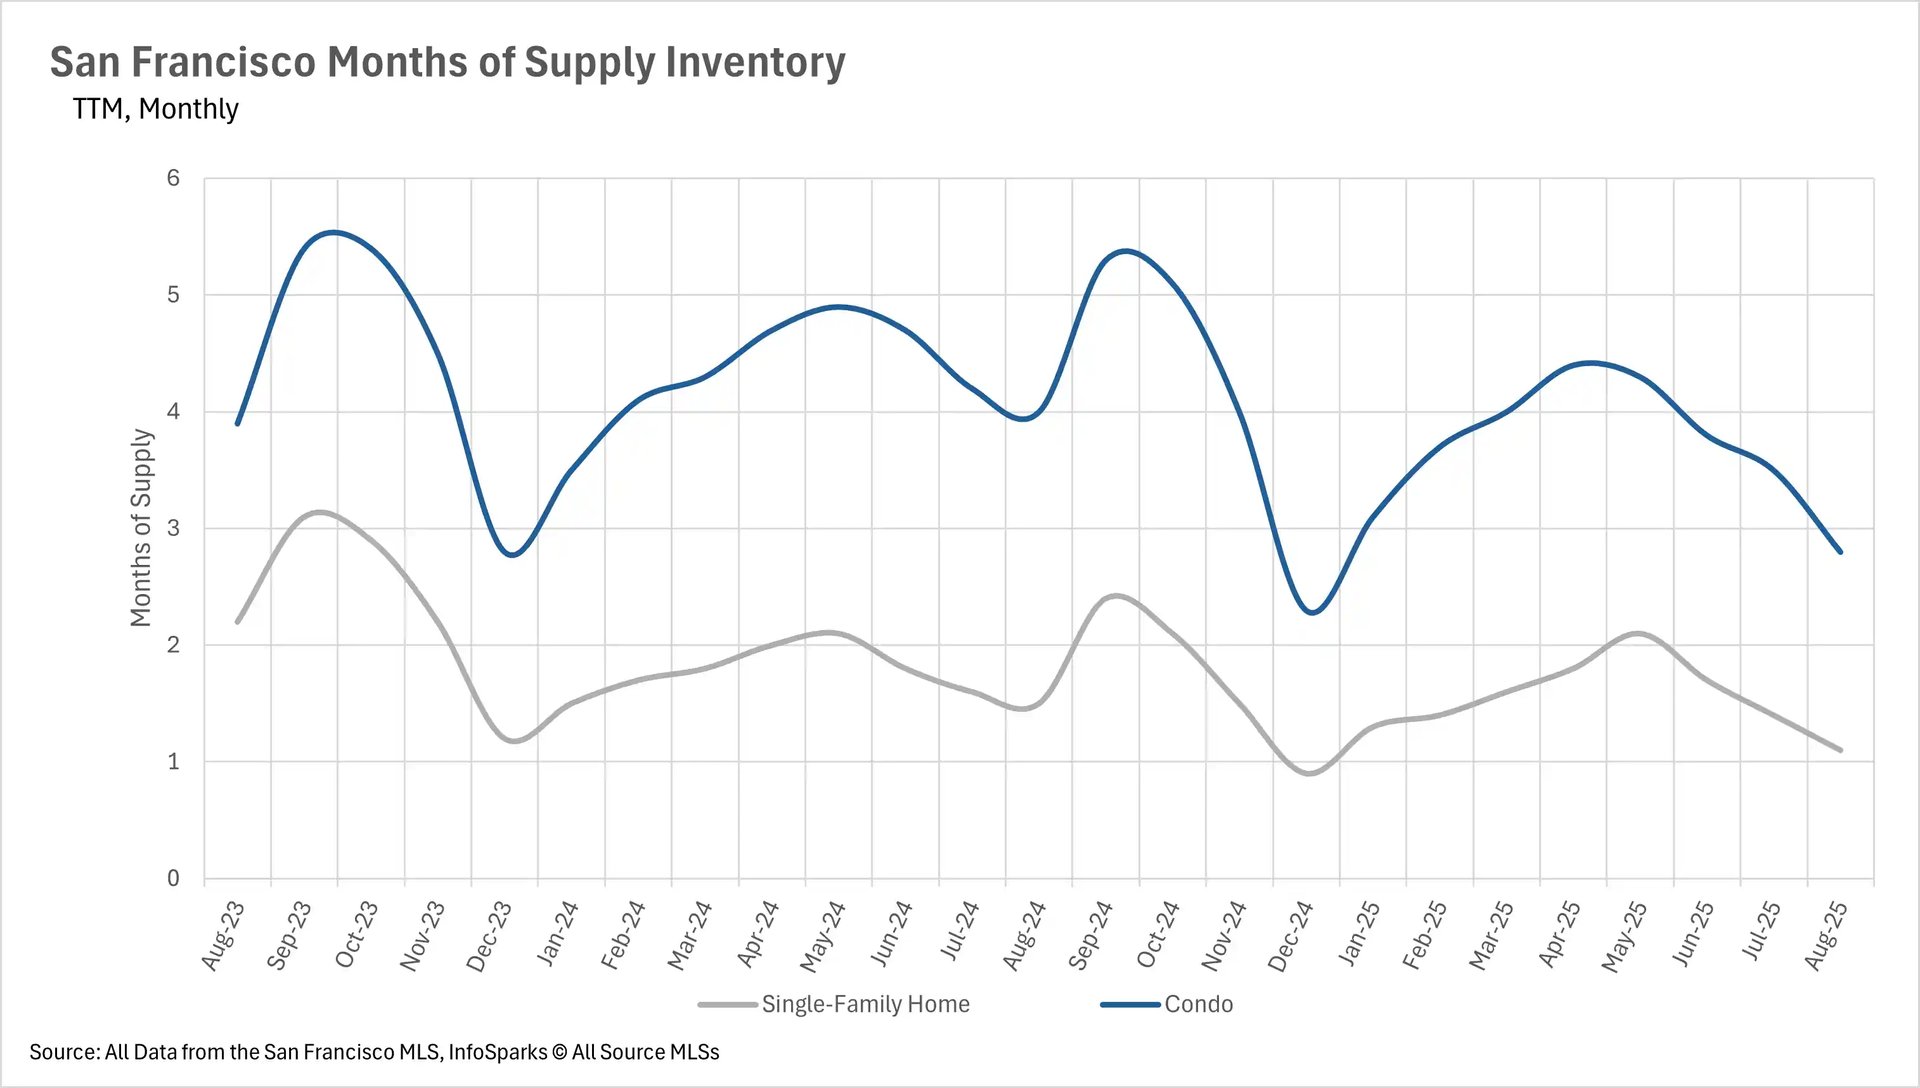
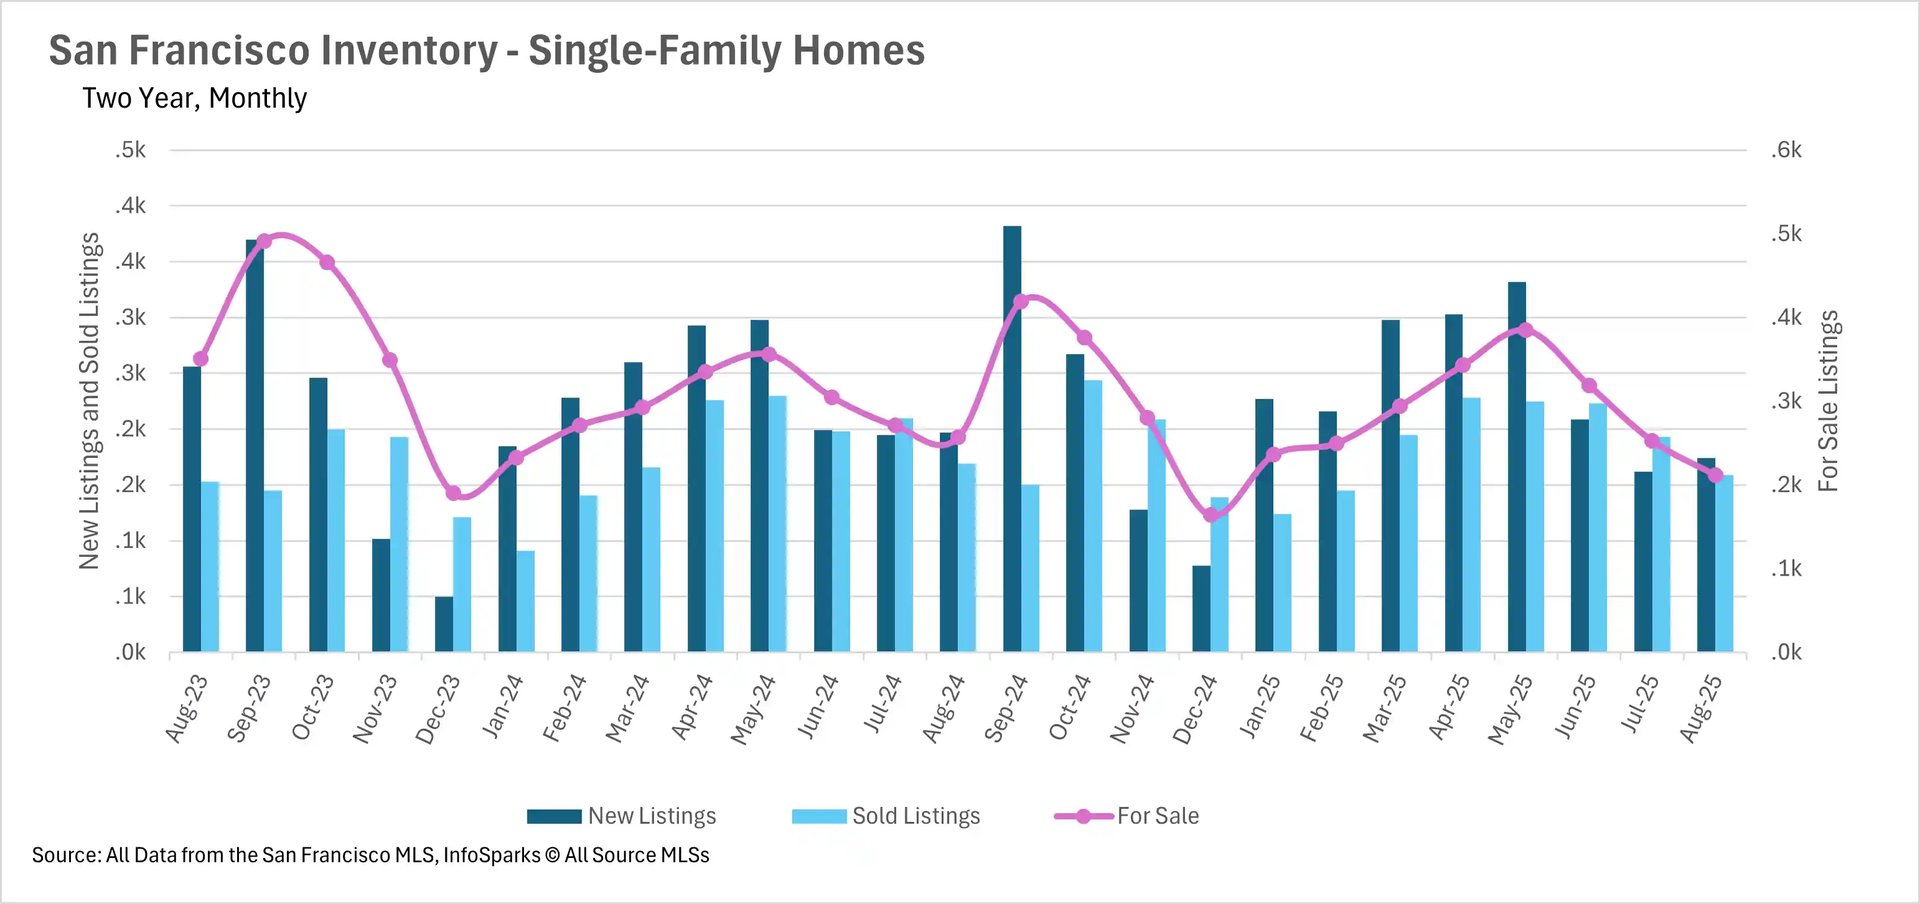
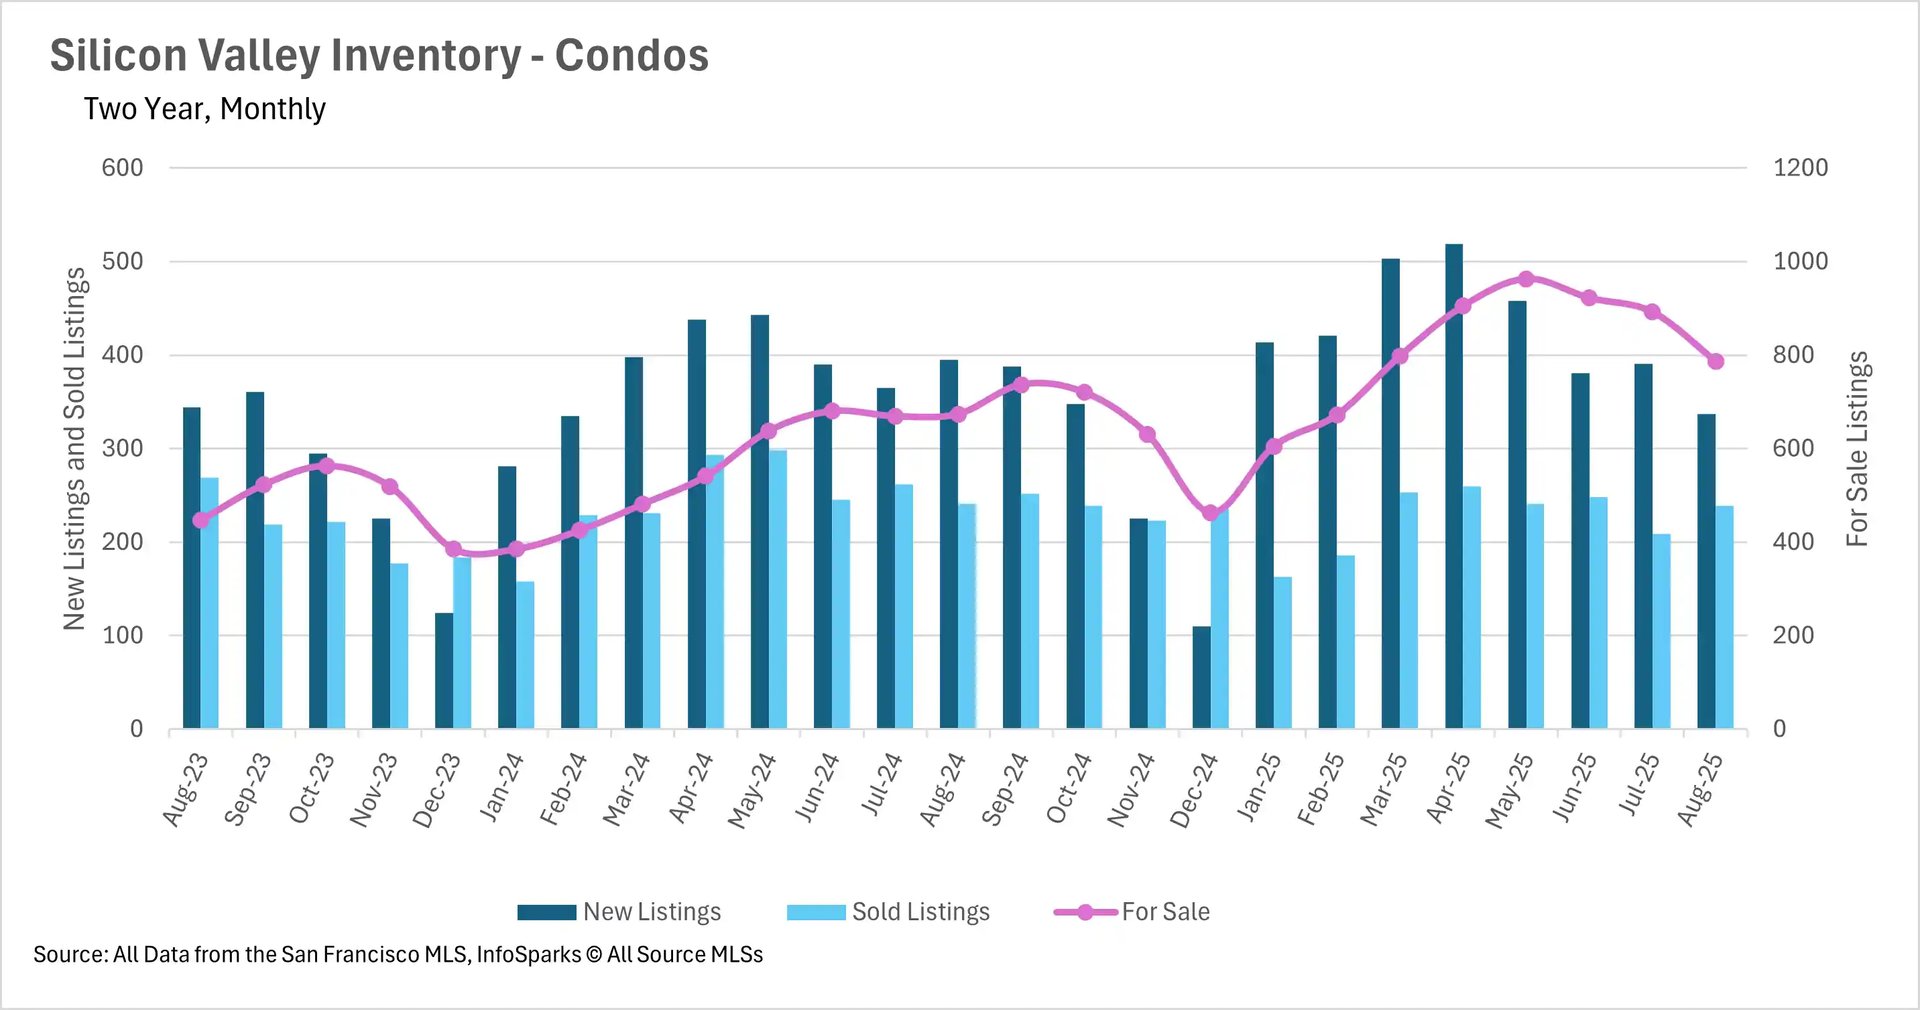
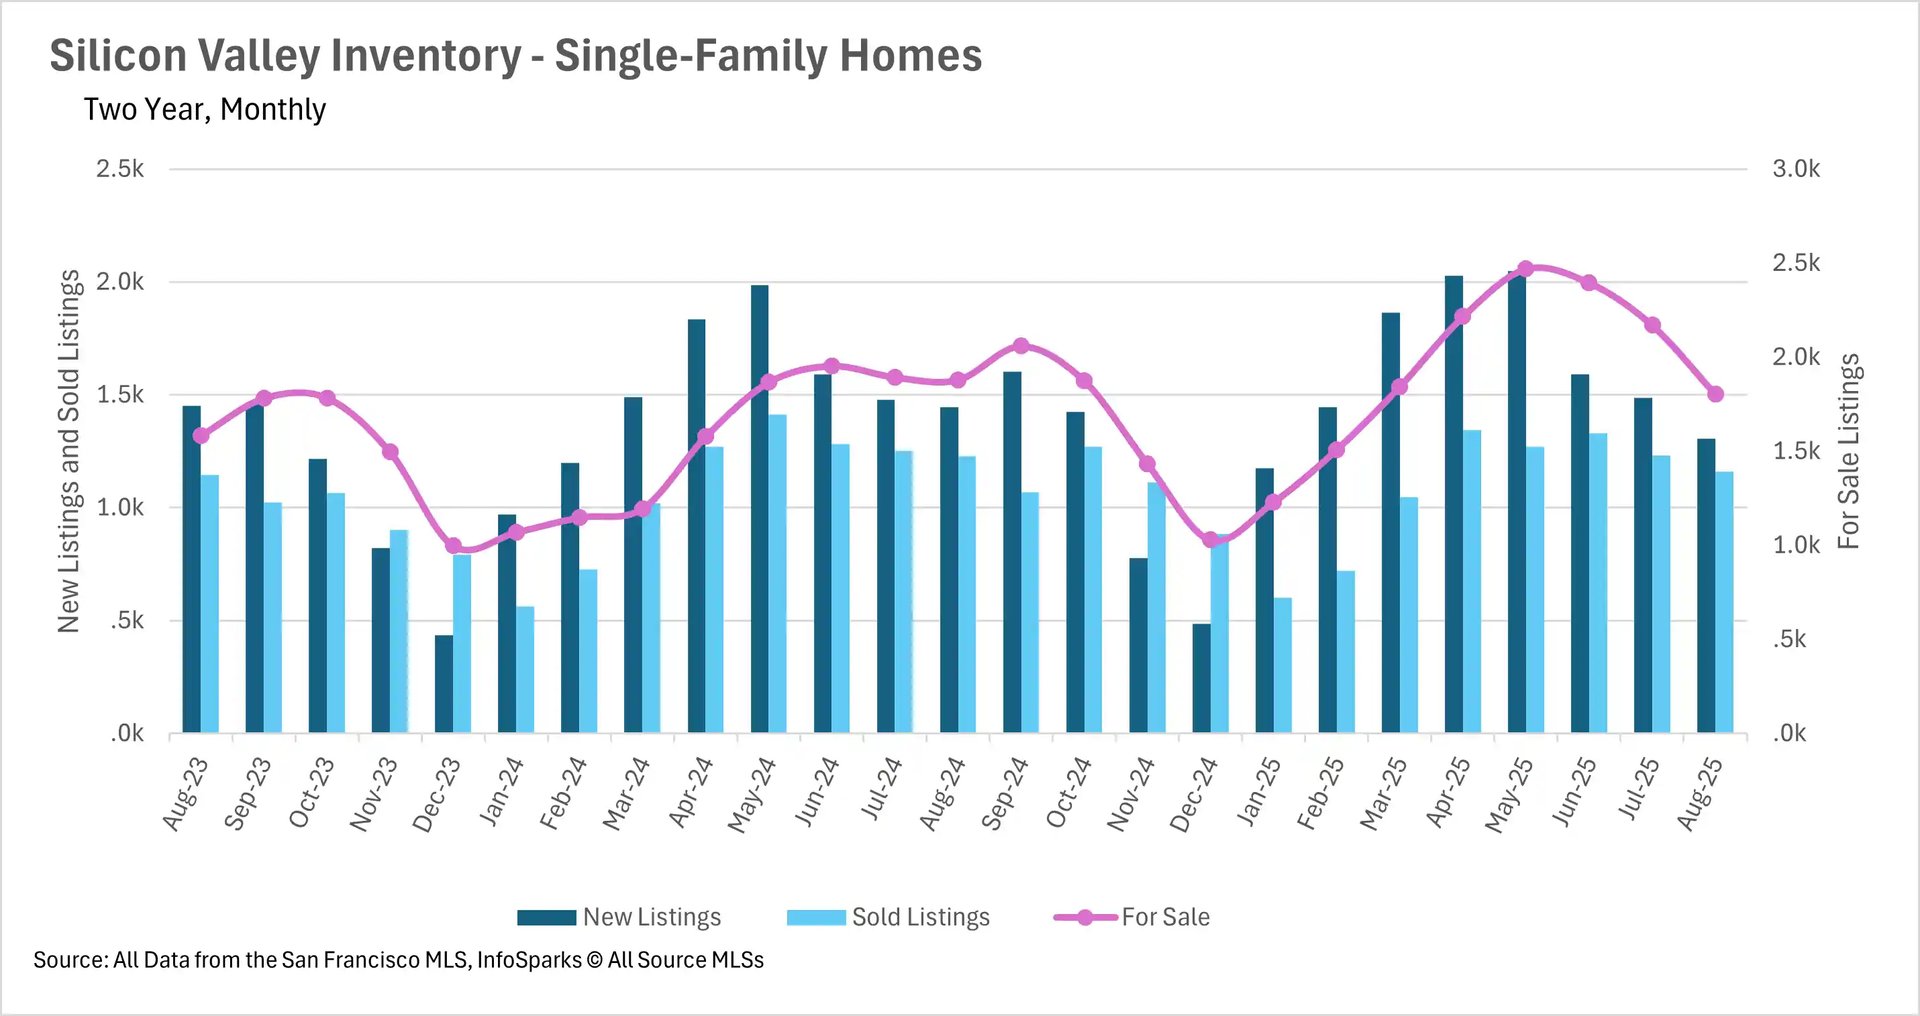
August marked a significant shift in Bay Area inventory dynamics, with most regions continuing the normalization process that began in the summer. San Francisco reached unprecedented territory with both single-family homes and condos achieving seller's market status - single-family inventory dropped to just 1.1 months of supply while condos fell to 2.8 months, representing the lowest levels ever recorded in the area. Single-family inventory declined 17.51% year-over-year, while condo inventory dropped 22.69%. Silicon Valley made a dramatic reversal, with single-family home inventory actually falling 4.04% below last year's levels for the first time in months, though condo inventory remained elevated at 16.77% above last year's levels - still a significant improvement from prior months. The North Bay showed the most balanced inventory picture, with single-family homes down just 0.73% year-over-year and condos up a modest 2.75%, indicating near-normalization. The East Bay, while still elevated, continued its downward trajectory with single-family inventory at 9.97% above last year and condos at 11.67% - substantial decreases from peak levels. Notably, most regions experienced fewer new listings hitting the market year-over-year, suggesting seller hesitancy rather than increased buyer absorption as the primary driver of inventory declines.
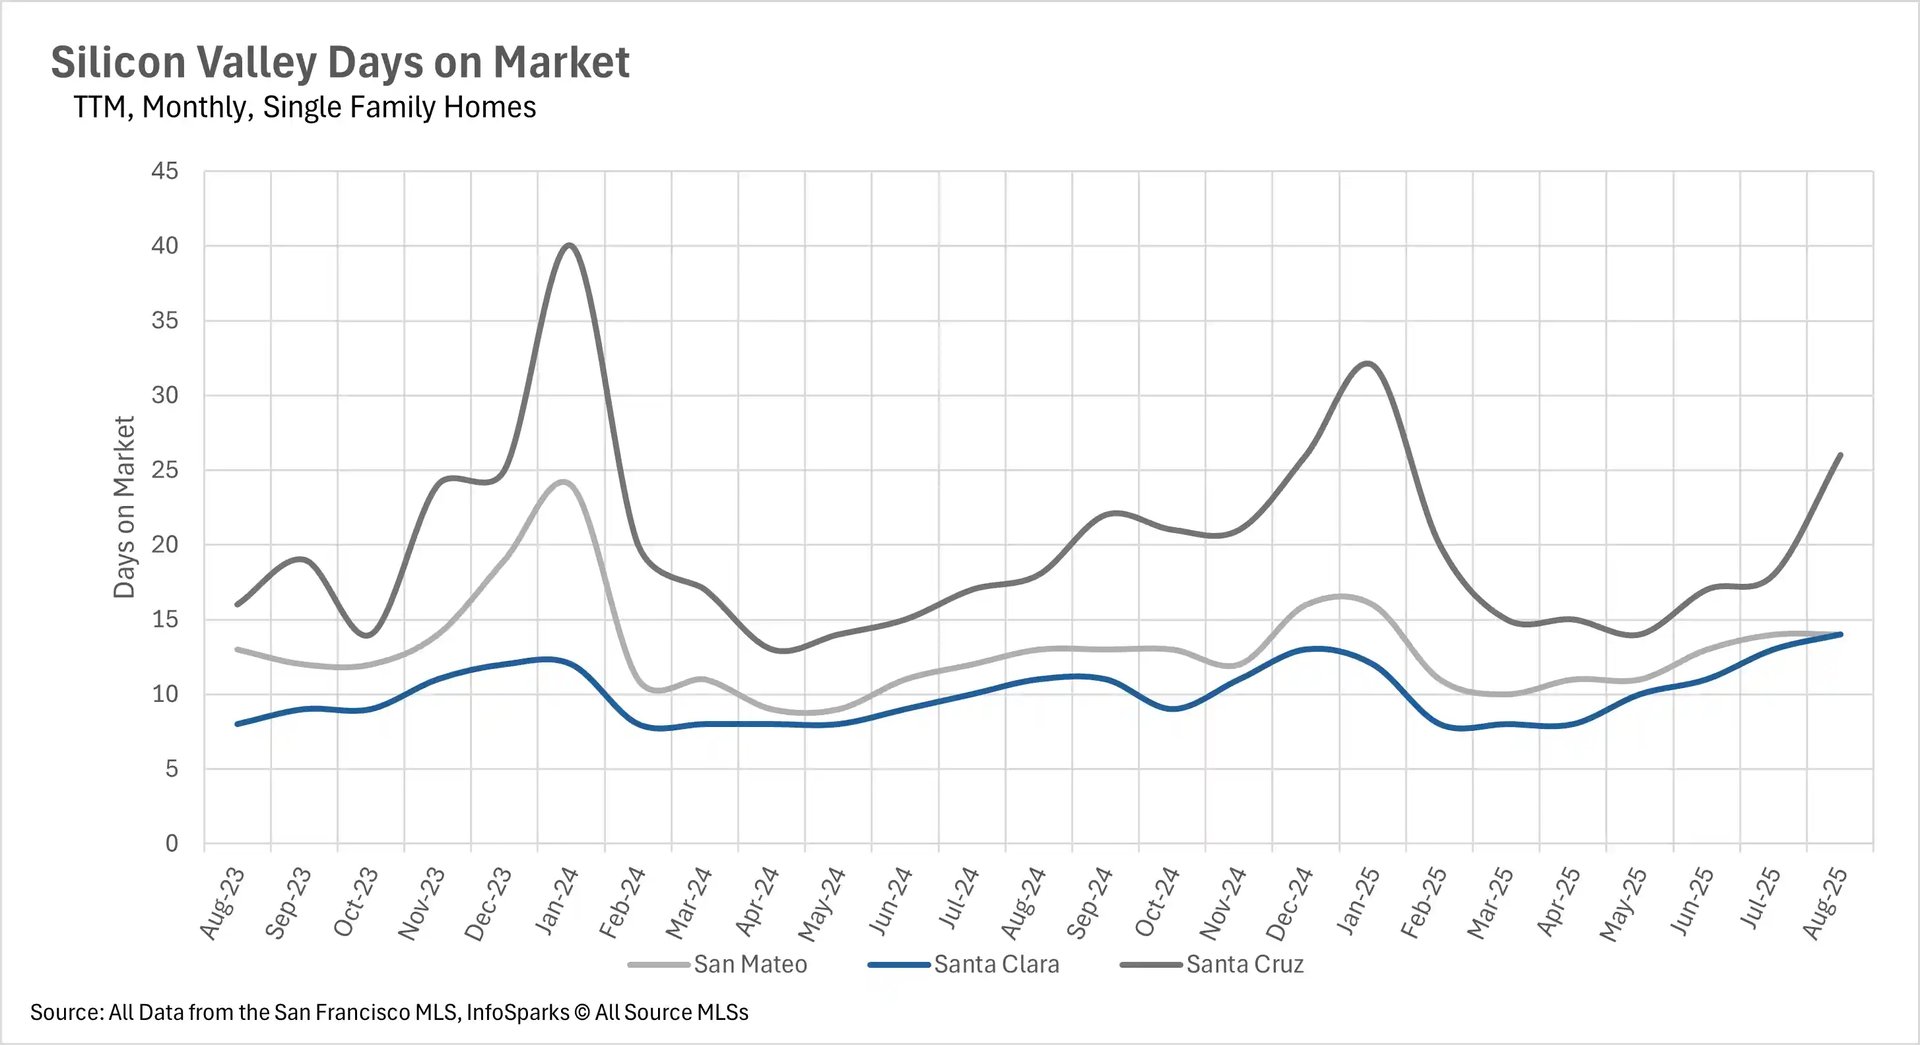
Days on market increase despite inventory improvements
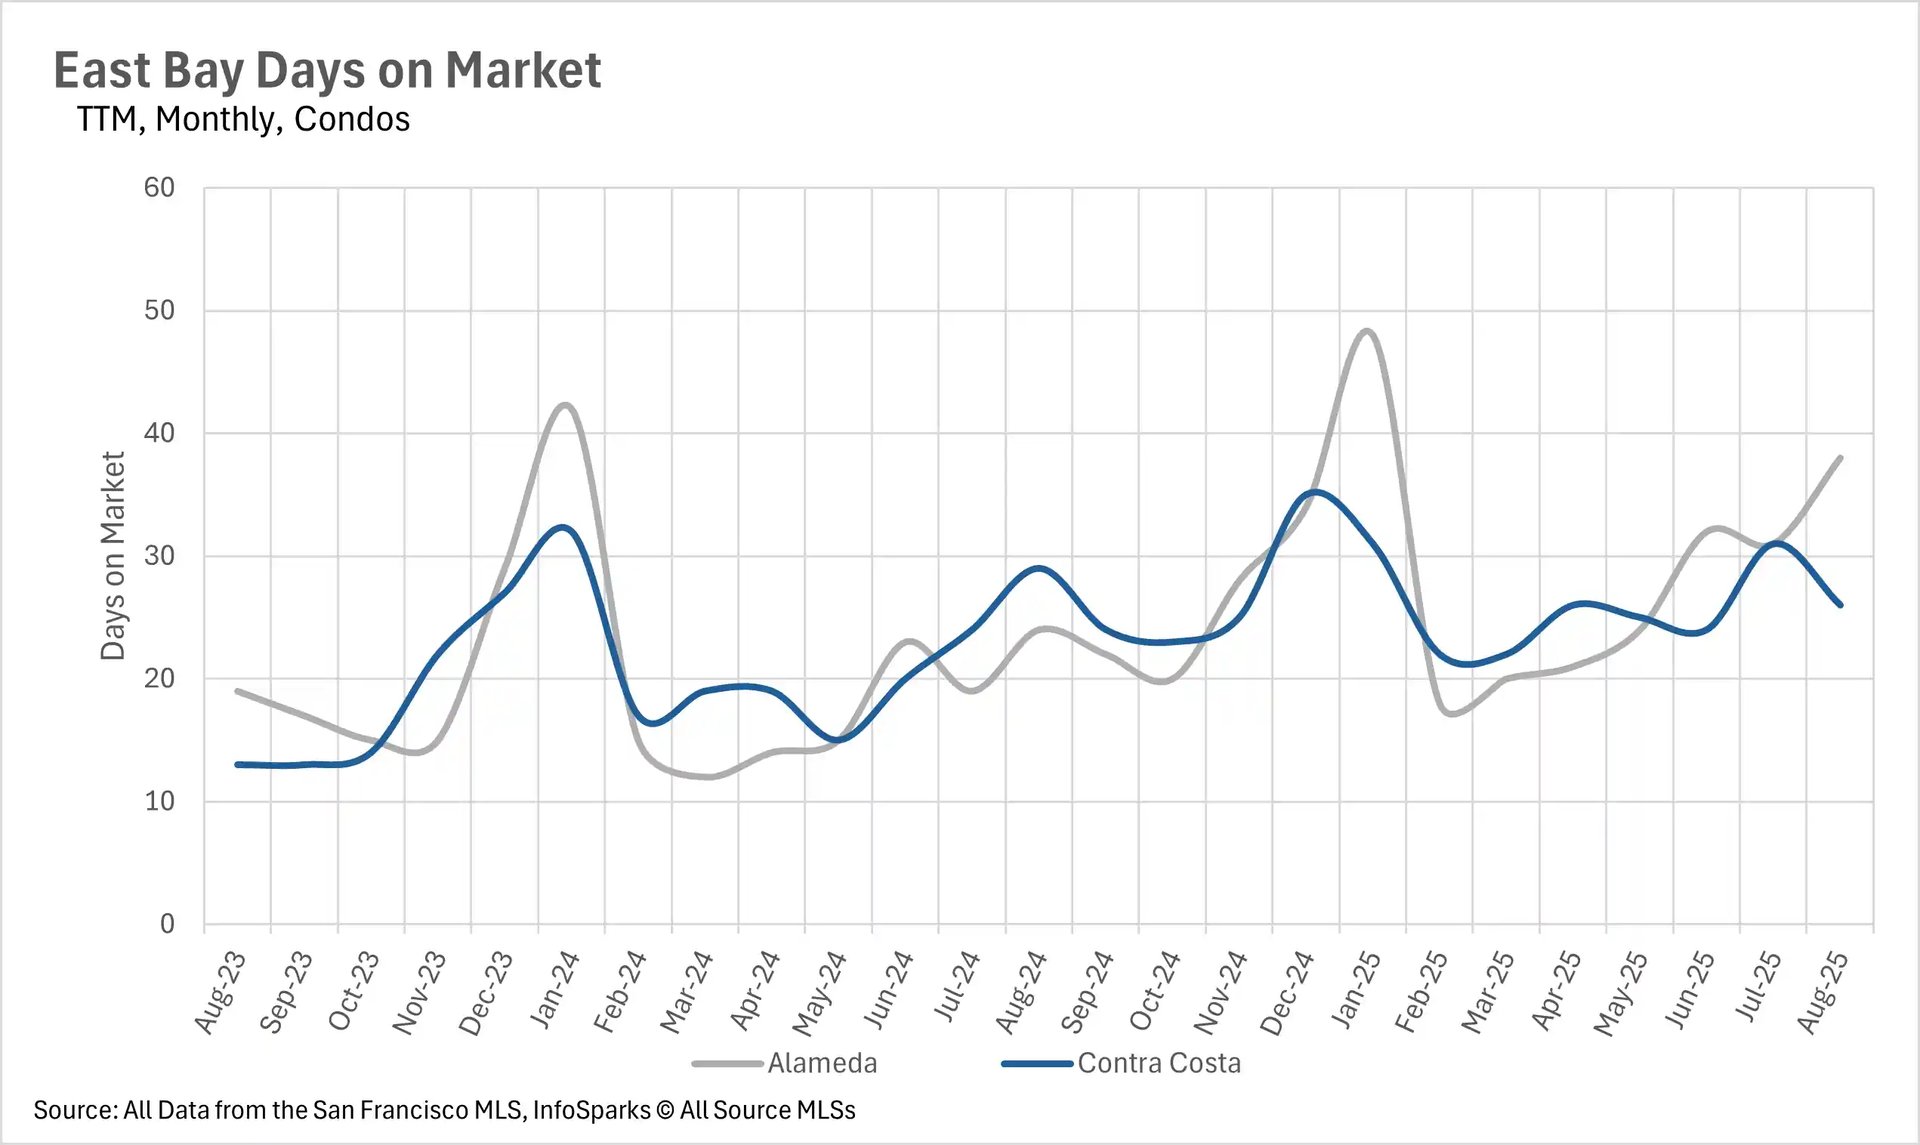
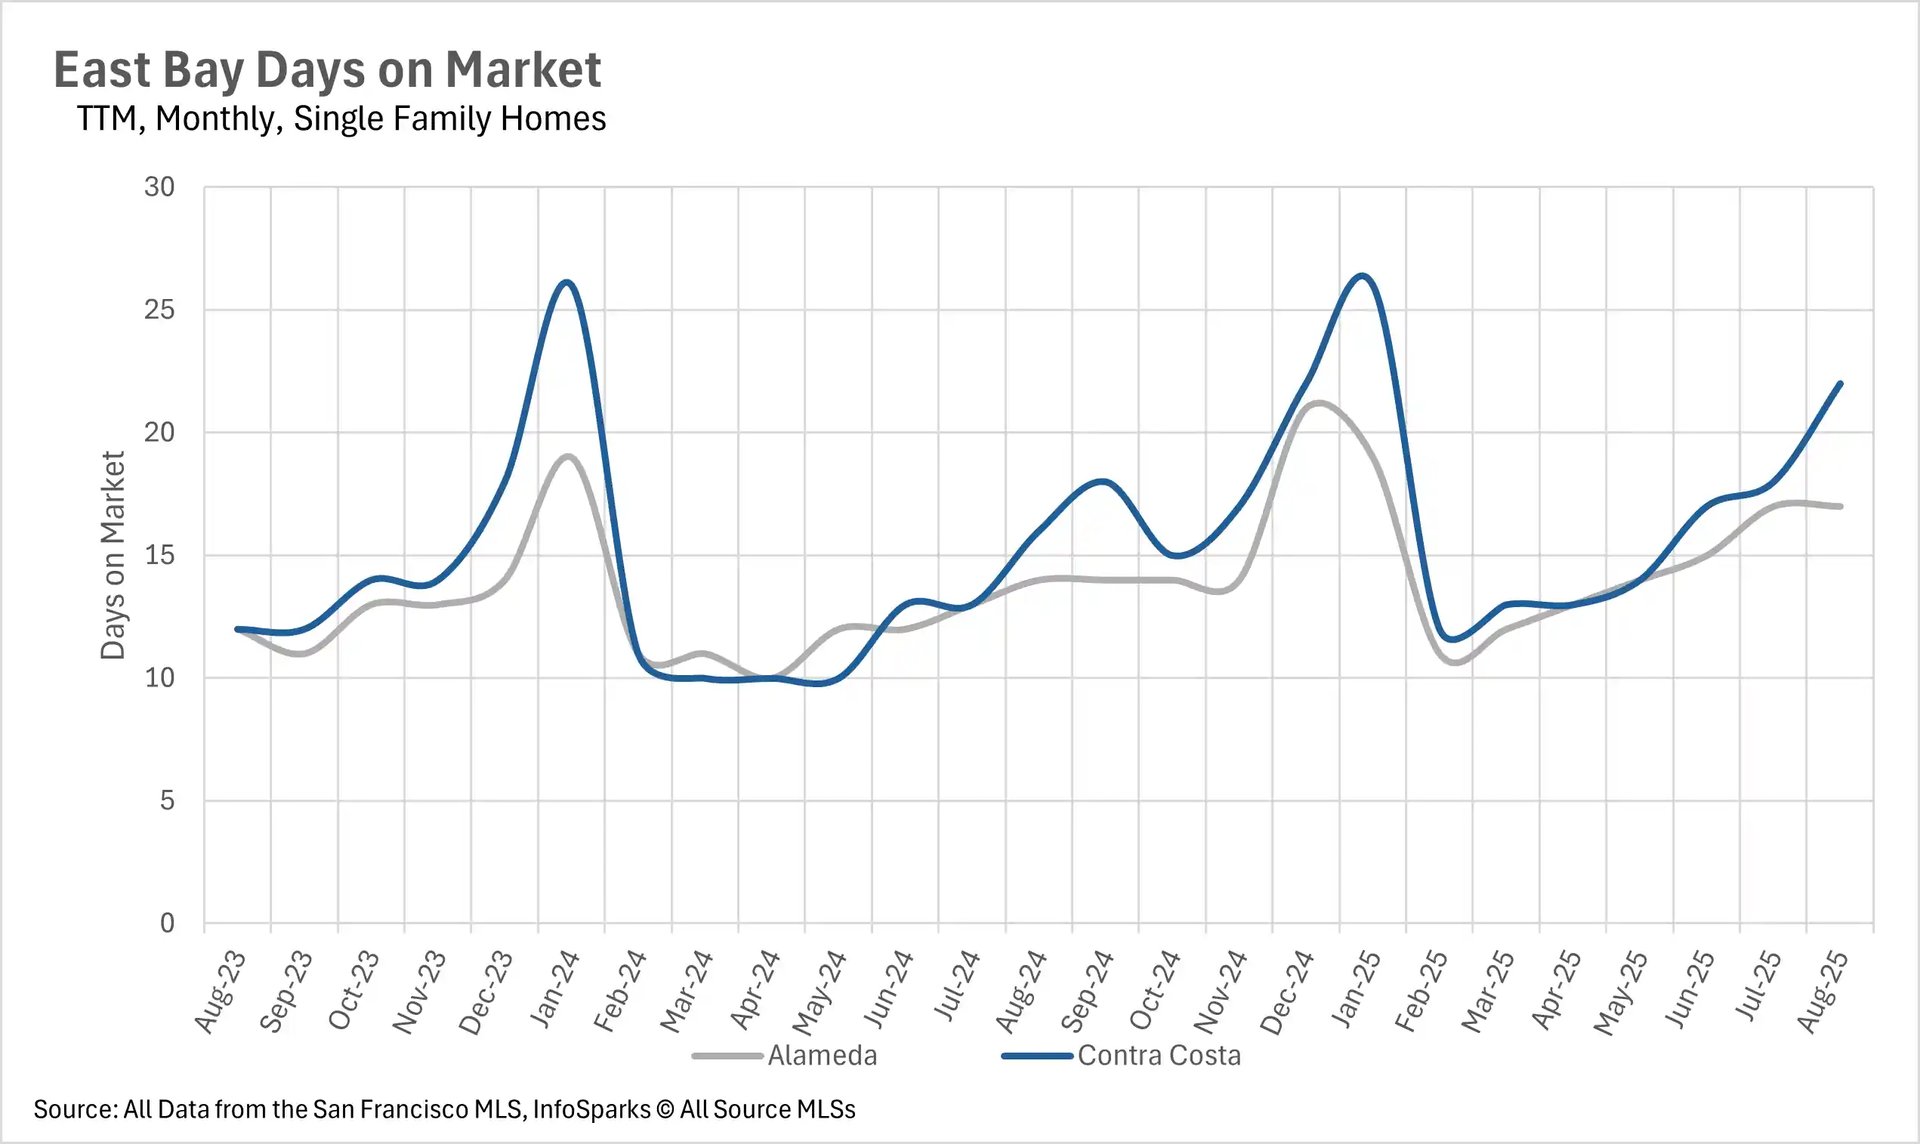
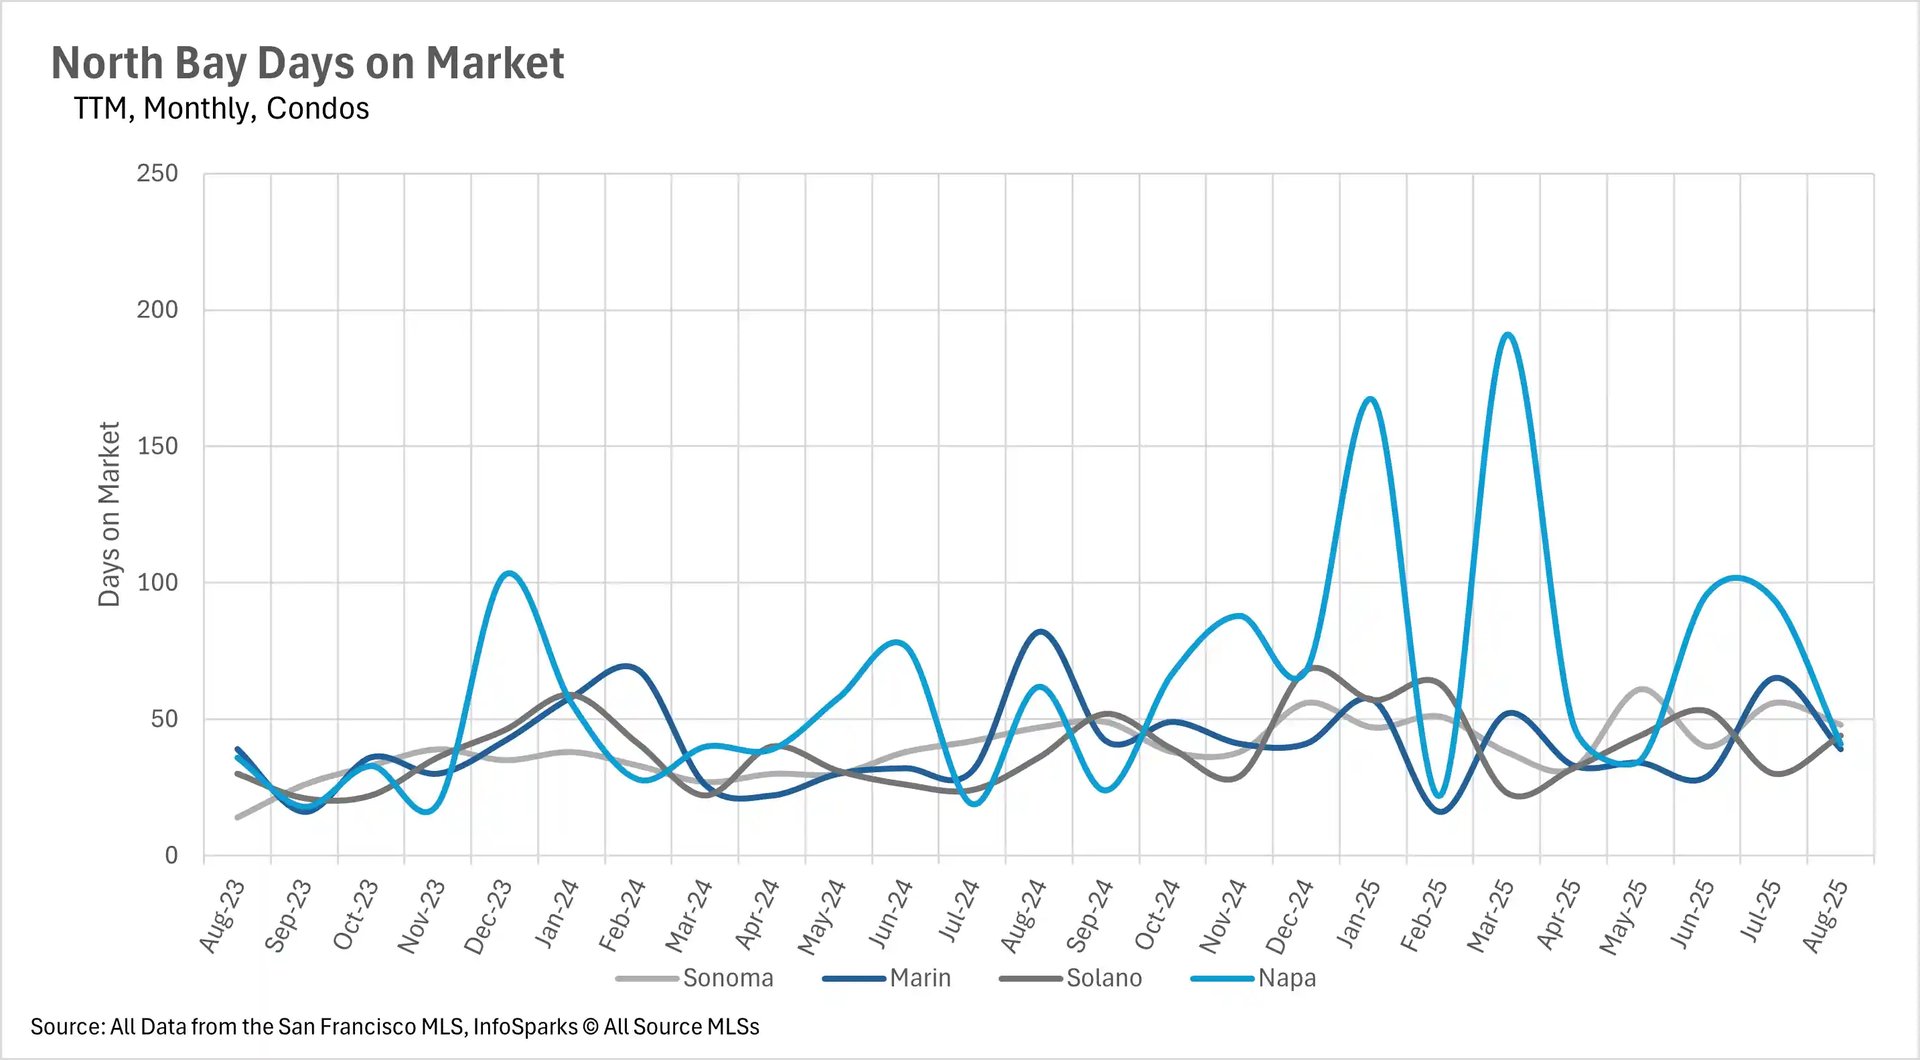
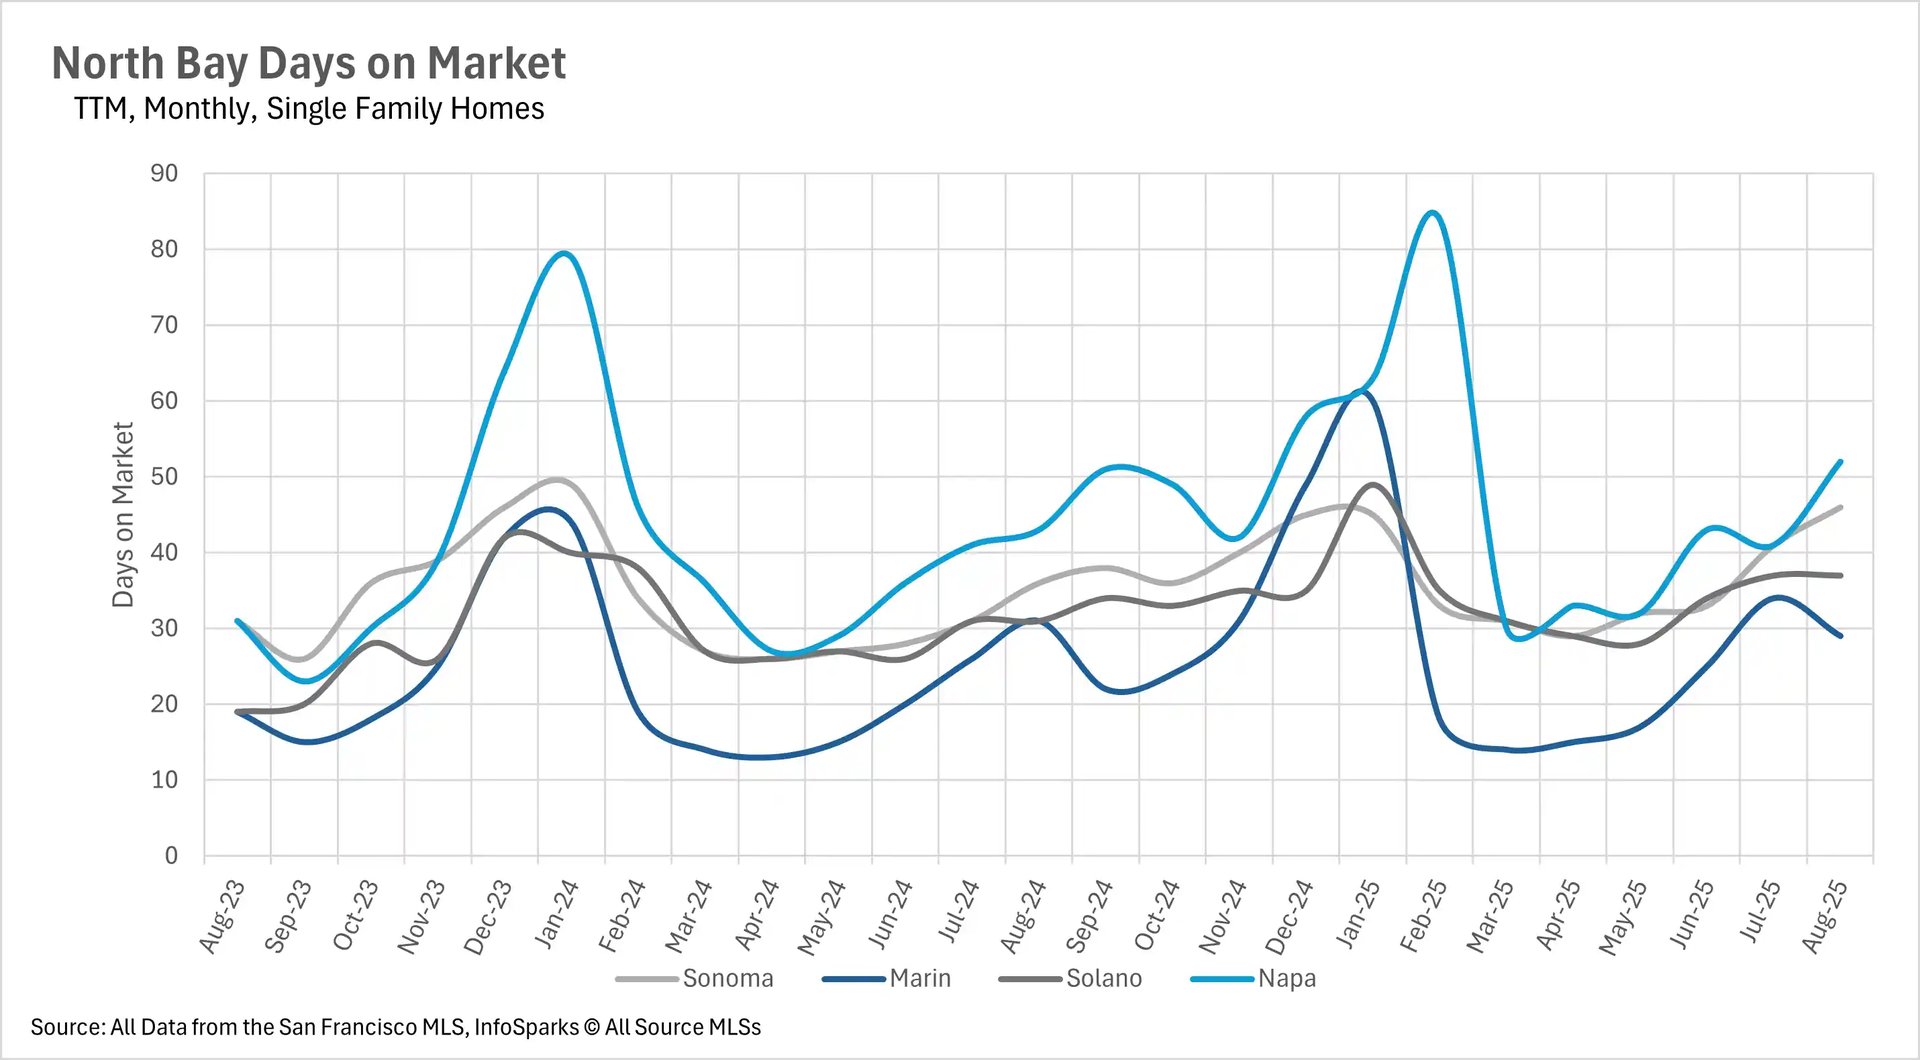
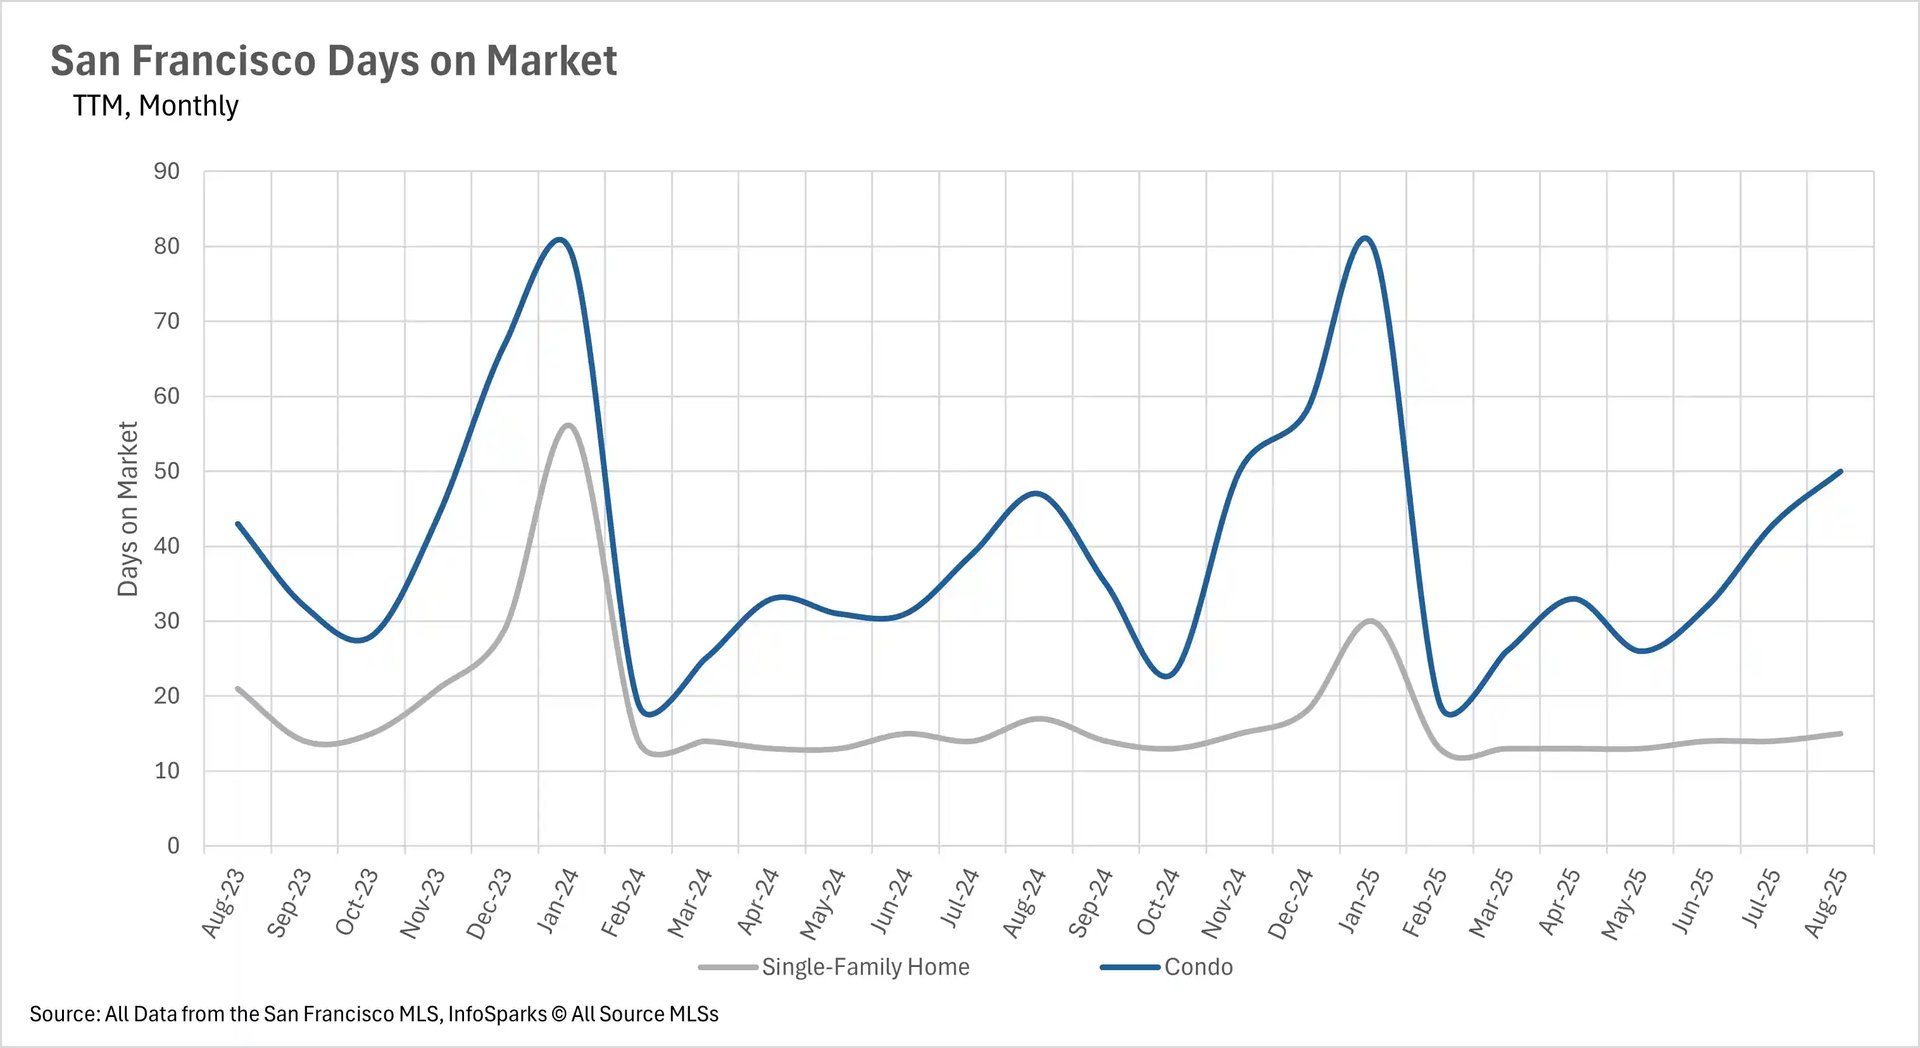
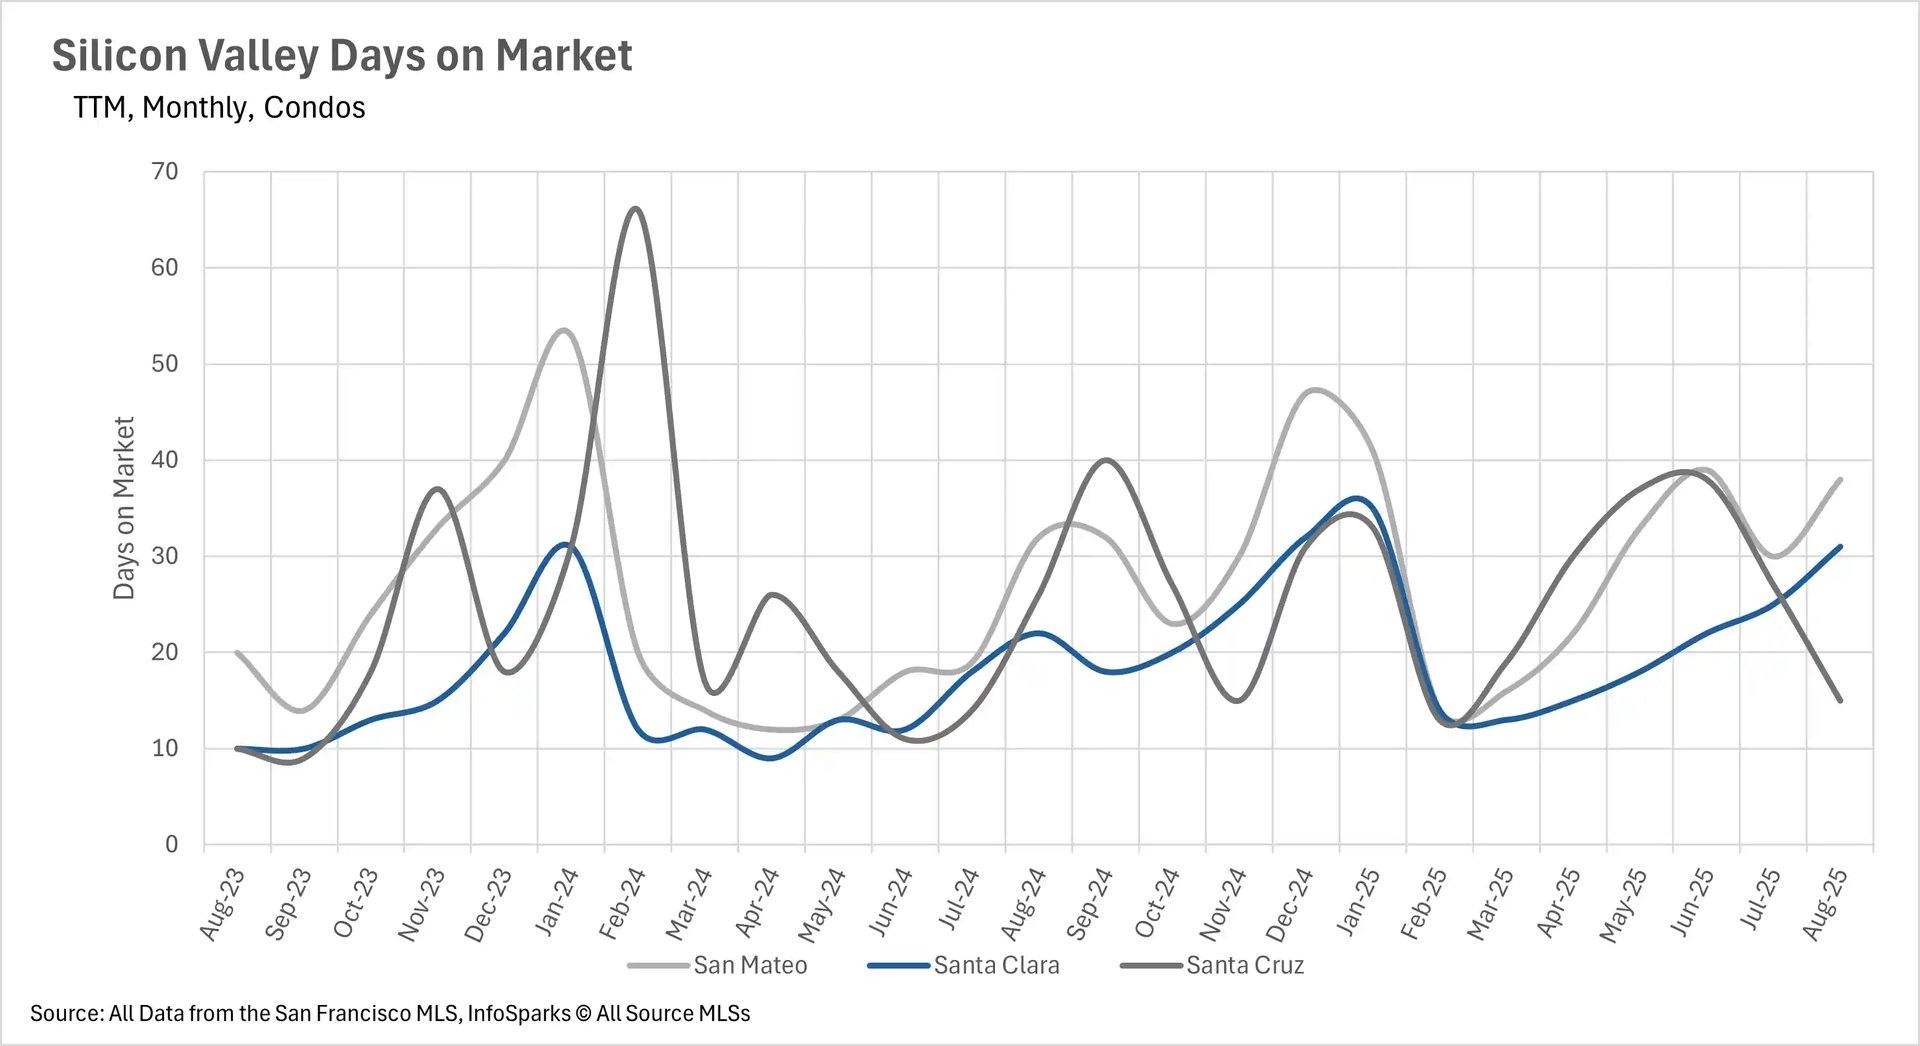
One of August's most notable trends was the continued increase in time on market across most Bay Area regions, despite improving inventory conditions. The North Bay showed the most dramatic increases, with single-family homes spending 27.78% more time on the market in Sonoma County and approximately 20% longer in Solano and Napa Counties, though Marin County bucked the trend with a 6.45% decrease. The East Bay demonstrated significant variations by property type and county, with single-family homes spending 21.43% more time on market in Alameda County and 37.50% more in Contra Costa County, while condo market times showed mixed results - Alameda condos spent 58.33% more time on market while Contra Costa condos actually decreased by 10.34%. Silicon Valley maintained relatively quick movement for single-family homes despite percentage increases, with absolute times remaining at just 14 days in San Mateo and Santa Clara Counties and 26 days in Santa Cruz County. San Francisco showed the most interesting pattern, with single-family homes remaining incredibly fast at just 15 days while condos increased to 50 days (up 6.38% year-over-year). These patterns suggest that while inventory levels are improving, buyer behavior has fundamentally shifted toward increased selectivity and deliberation.
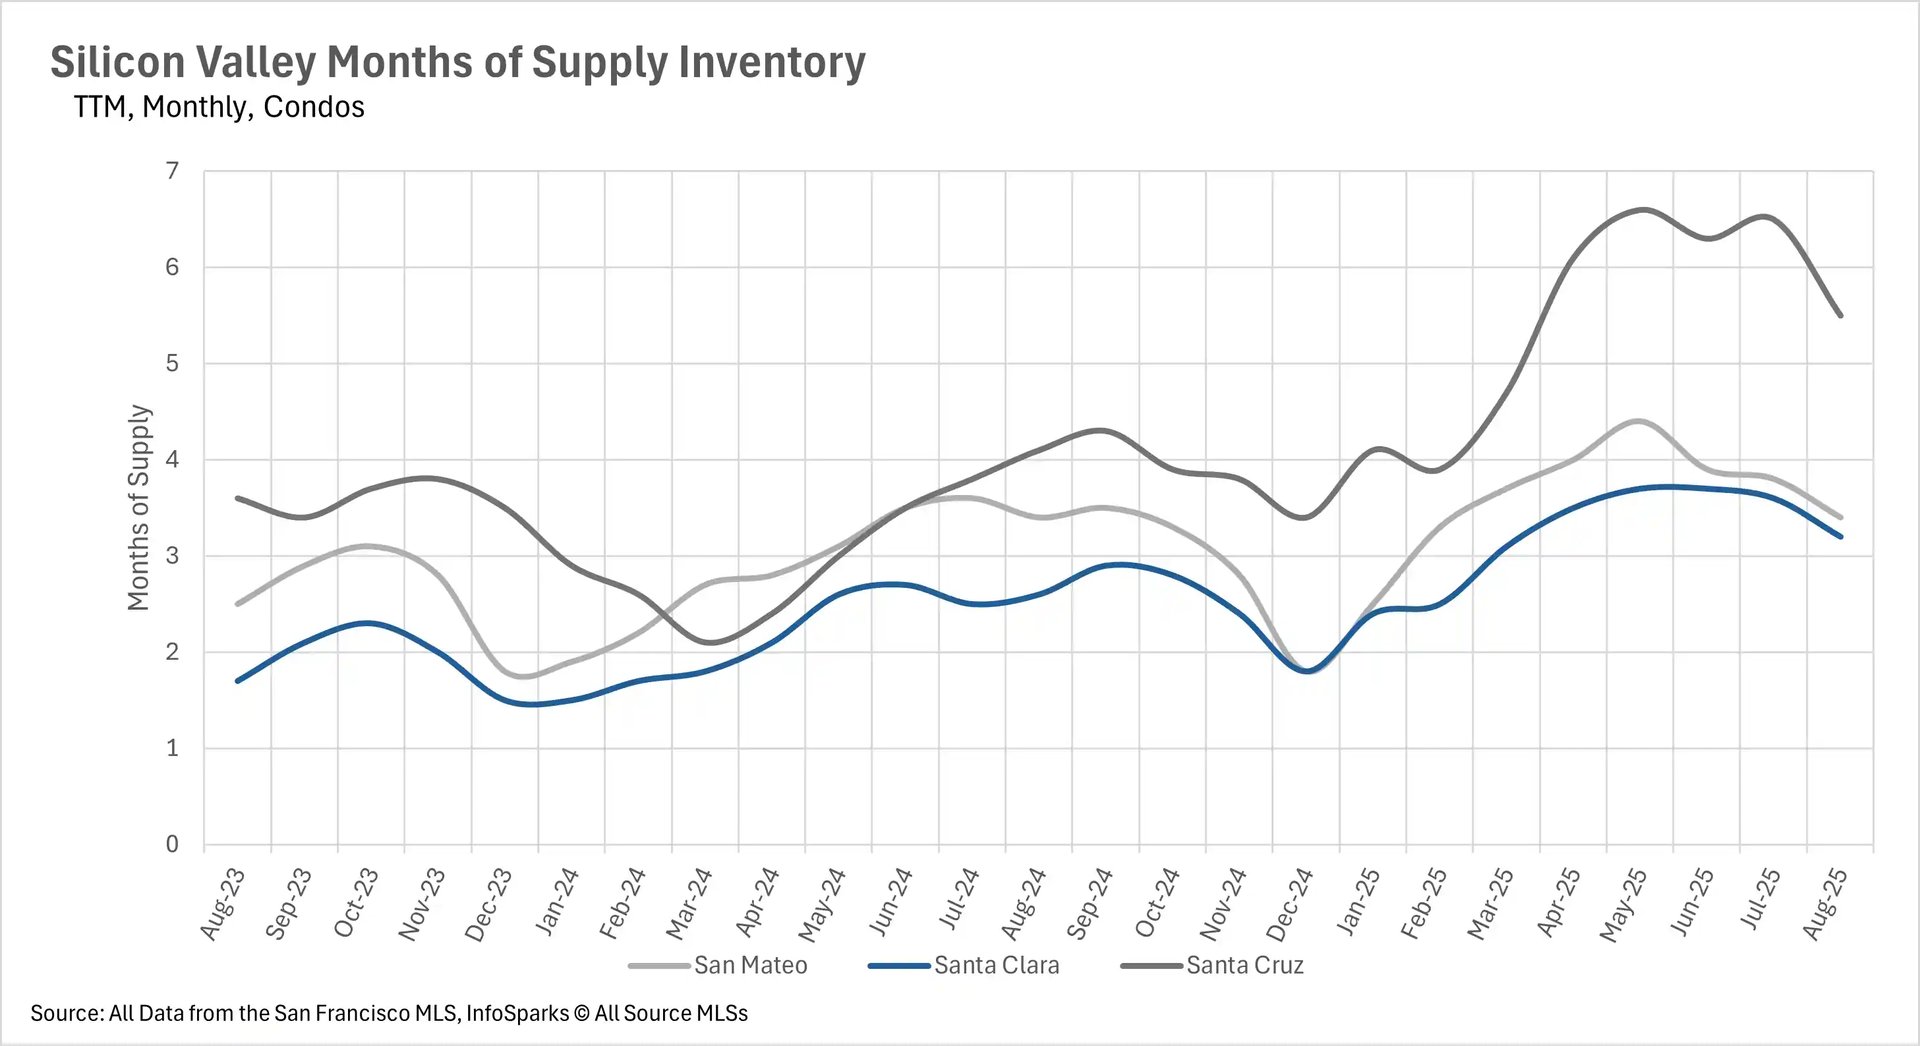
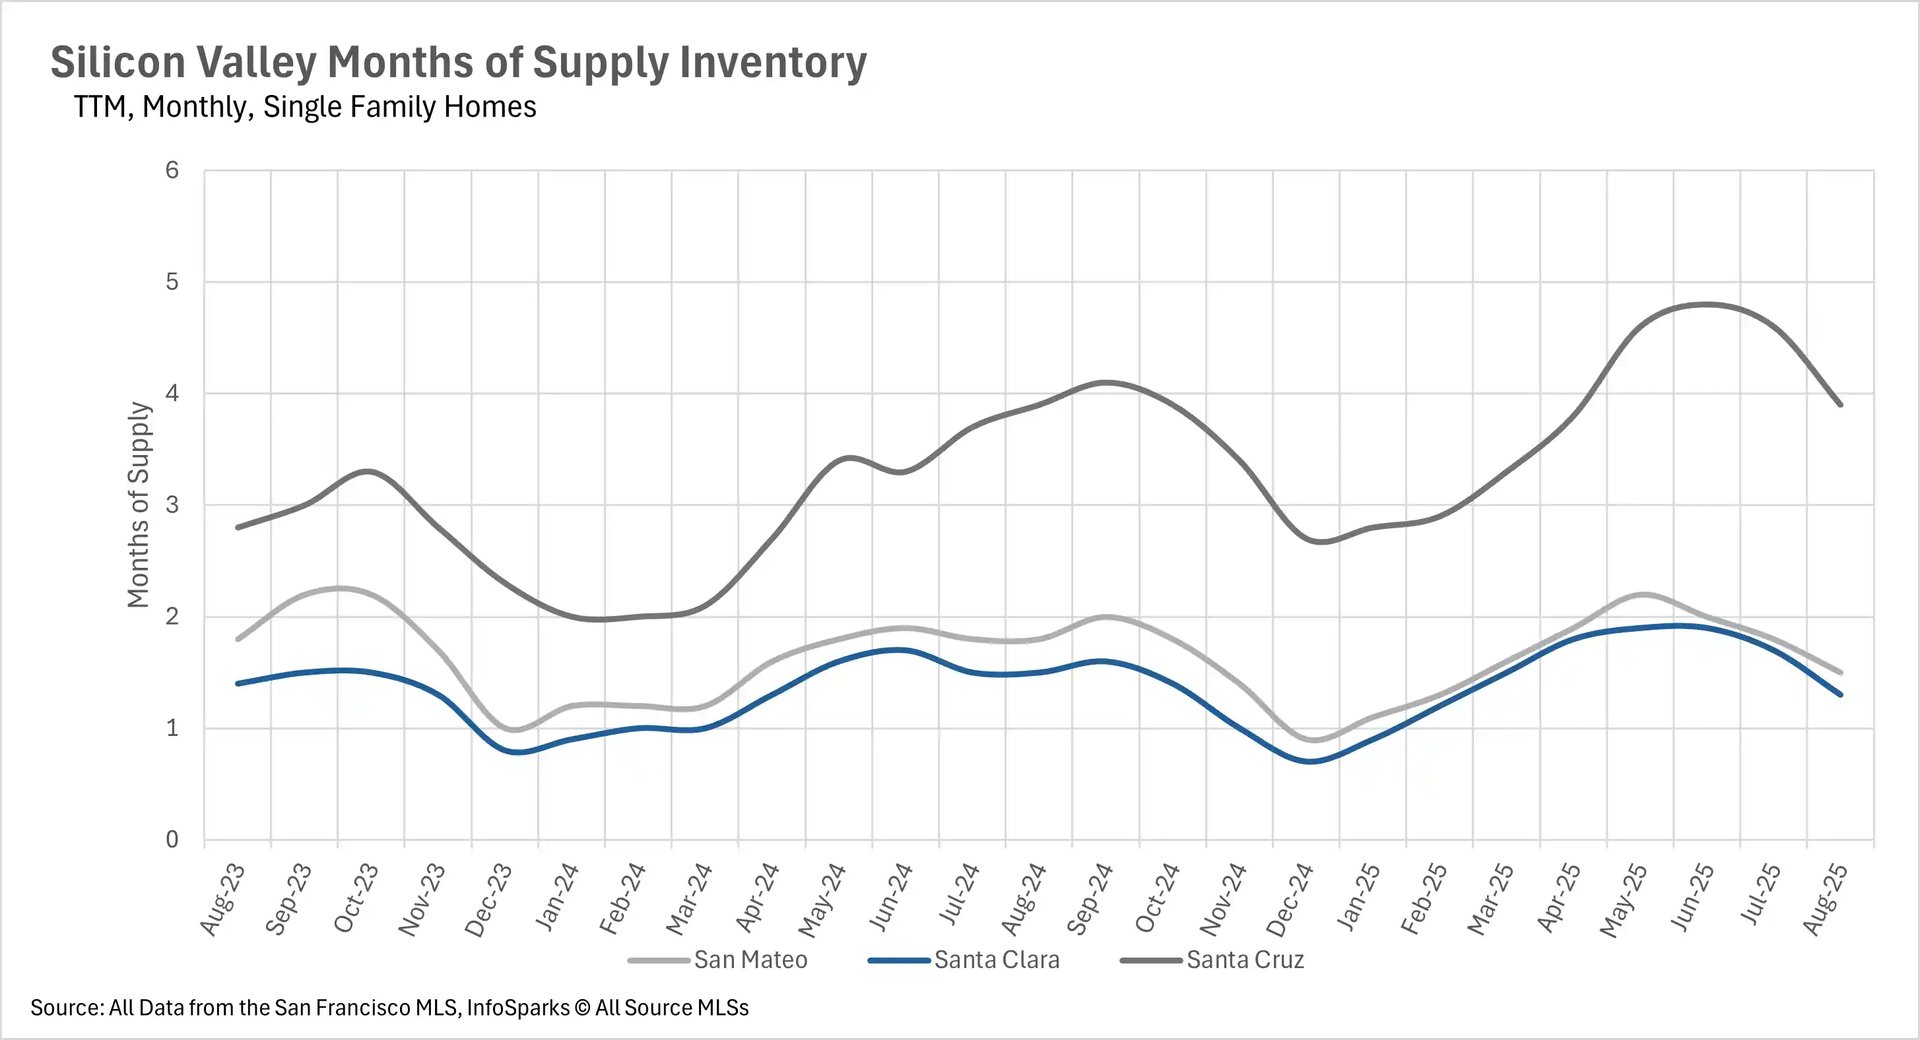
Property type trumps geography in market dynamics
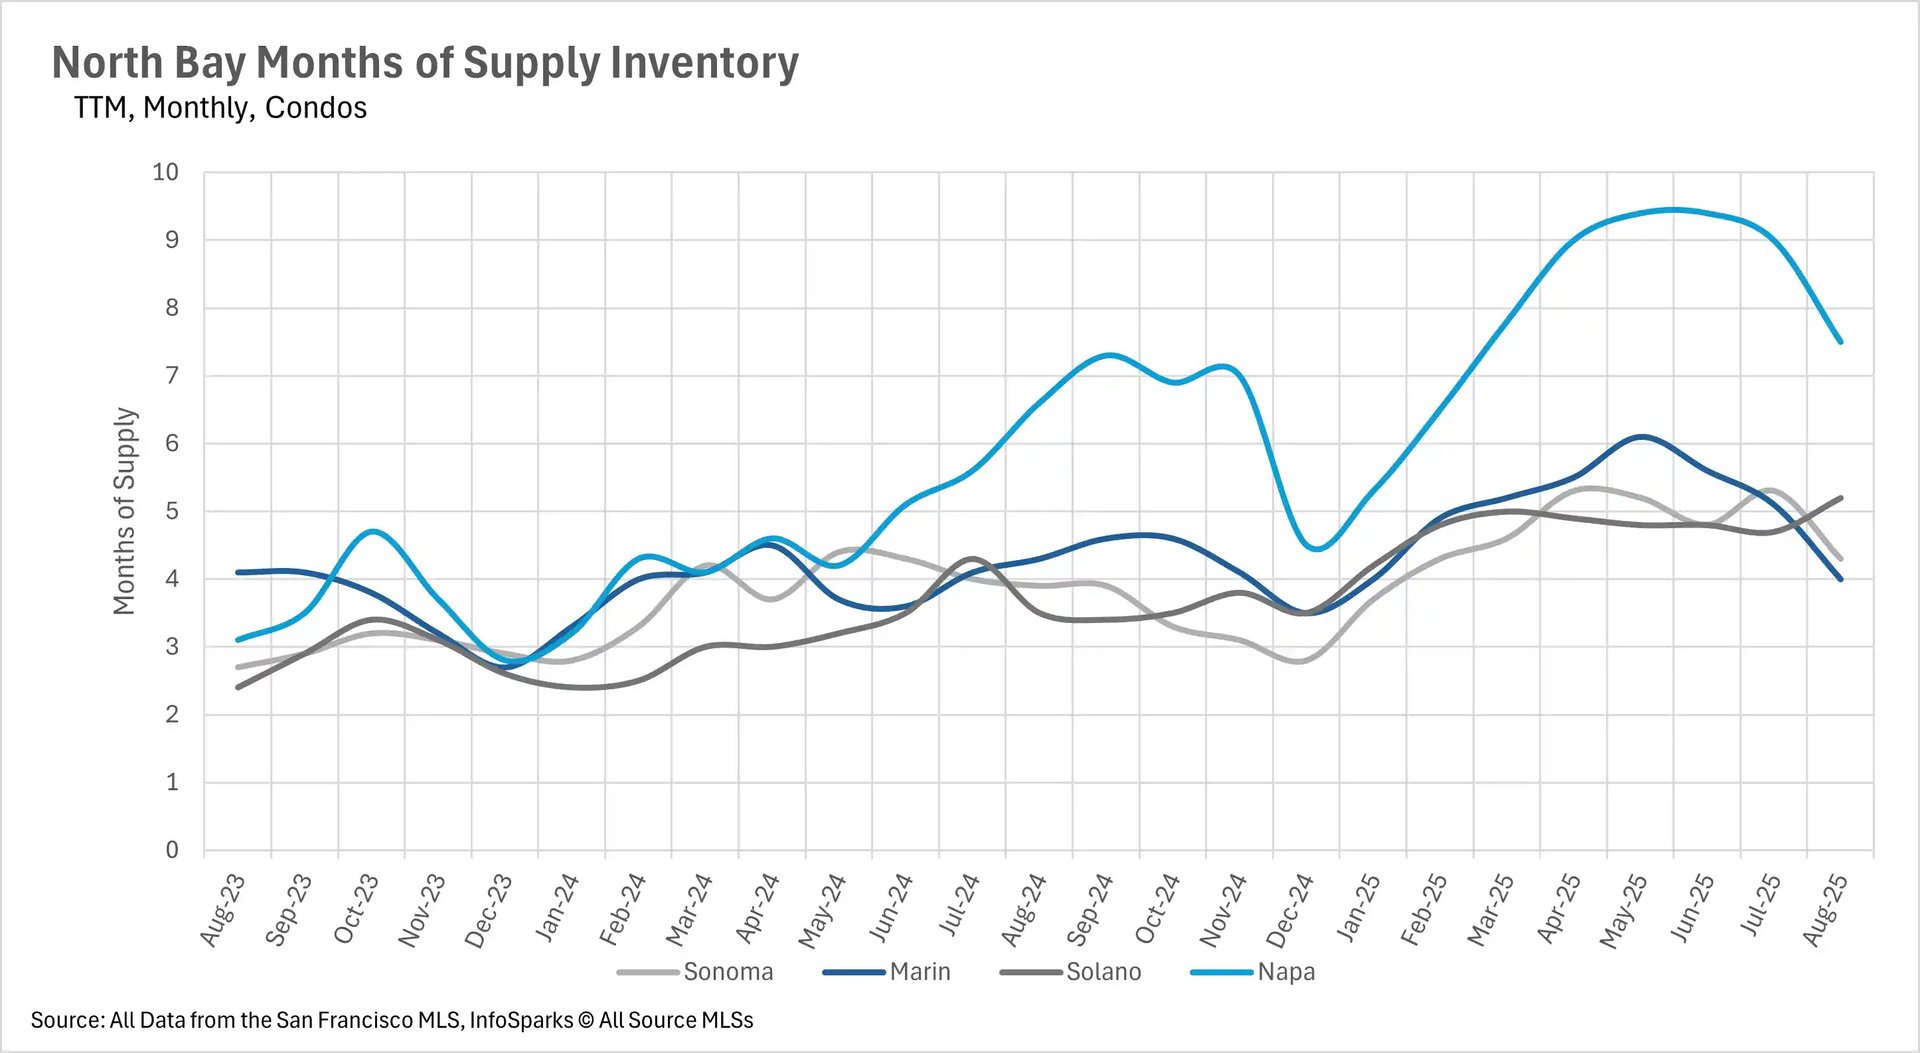
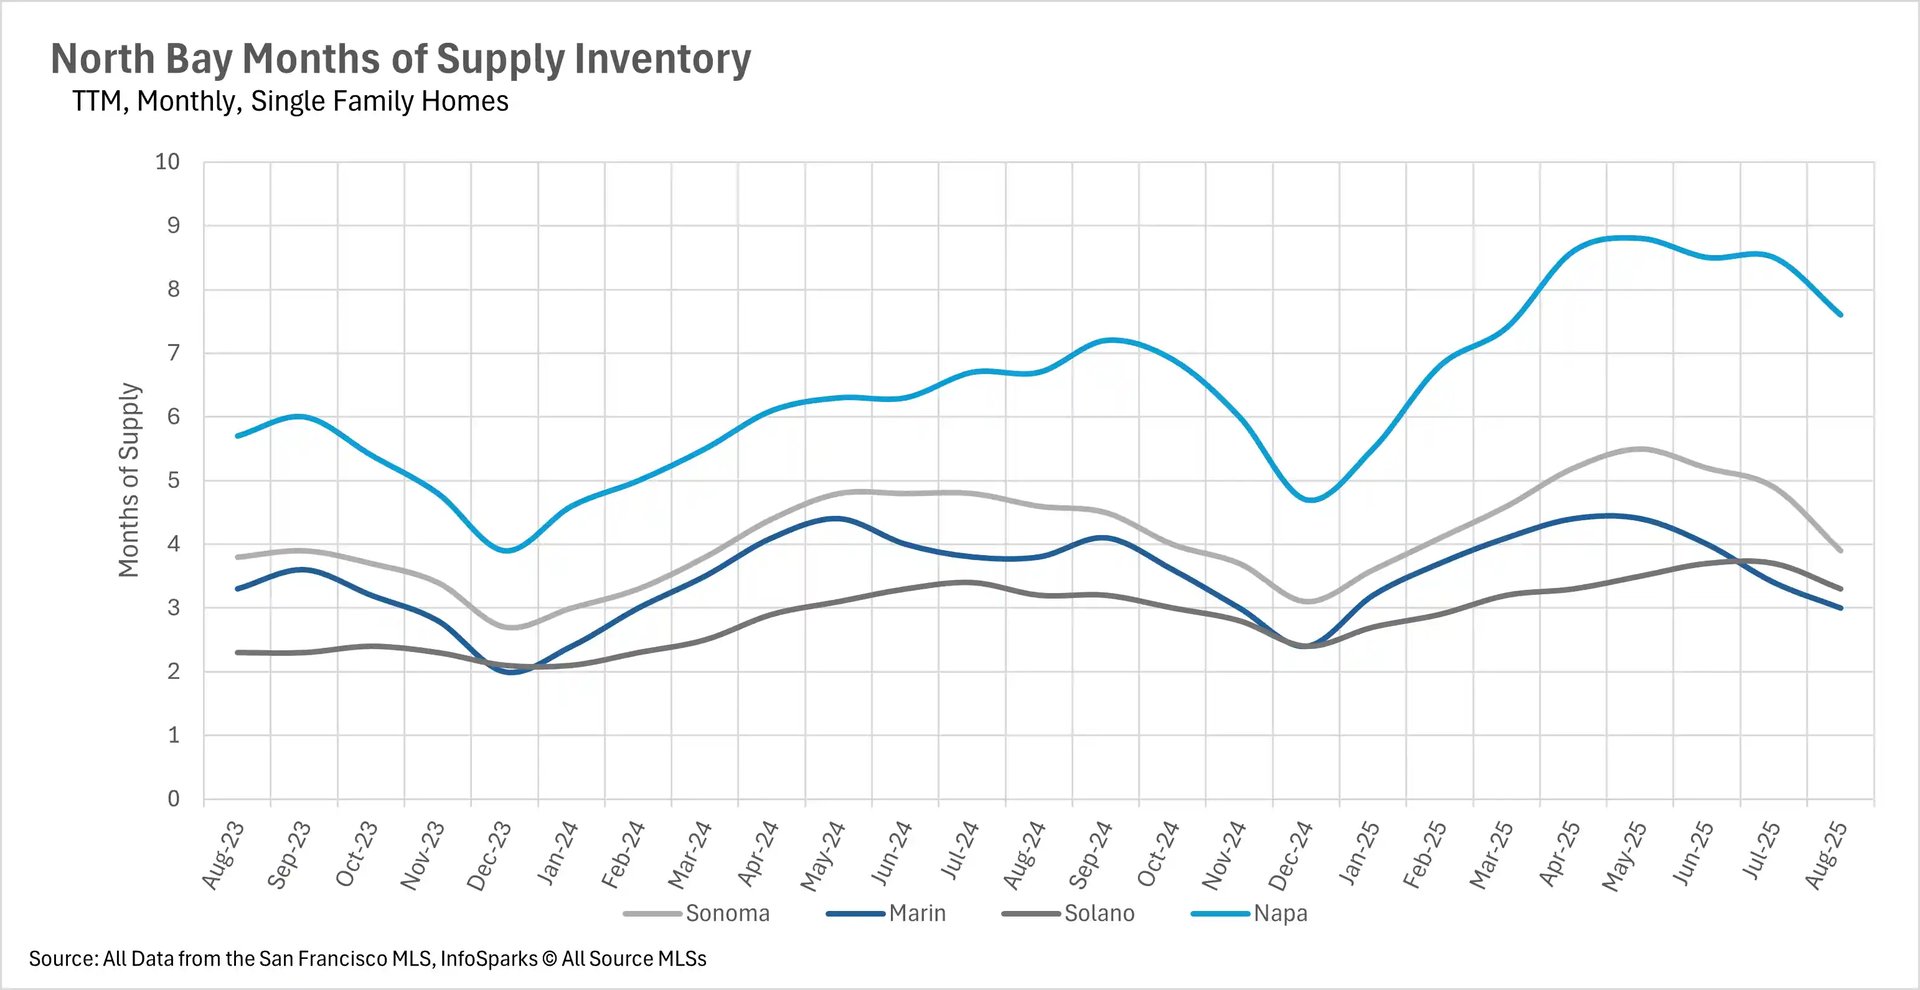
August reinforced the Bay Area's clear segmentation by property type rather than geographic location. San Francisco made headlines by achieving seller's market status for both single-family homes (1.1 months of supply) and condos (2.8 months of supply) - a rare occurrence that highlights the area's extreme inventory constraints. Silicon Valley maintained its competitive stance for single-family homes, with San Mateo and Santa Clara Counties at ultra-low 1.5 and 1.3 months respectively, while Santa Cruz County remained a buyer's market at 3.9 months. All Silicon Valley condo markets favored buyers, ranging from 3.2 months in Santa Clara to 5.5 months in Santa Cruz County. The East Bay preserved its traditional split with single-family homes strongly favoring sellers at 1.9 months in Alameda and 2.6 months in Contra Costa, while condos remained buyer-friendly at 4.4 and 4.2 months respectively. The North Bay showed the most variation, with Marin achieving perfect balance at 3.0 months for single-family homes, while Solano (3.3 months), Sonoma (3.9 months), and Napa (7.6 months) all favored buyers. North Bay condos uniformly favored buyers, with supply ranging from 4.0 months in Marin to 7.5 months in Napa County. This consistent pattern across the region suggests that single-family homes have retained their premium status and scarcity value, while condos present substantial opportunities for buyers willing to navigate longer timelines and increased inventory choices.