Select a Market Report to Read:
The Local Lowdown
Quick Take:
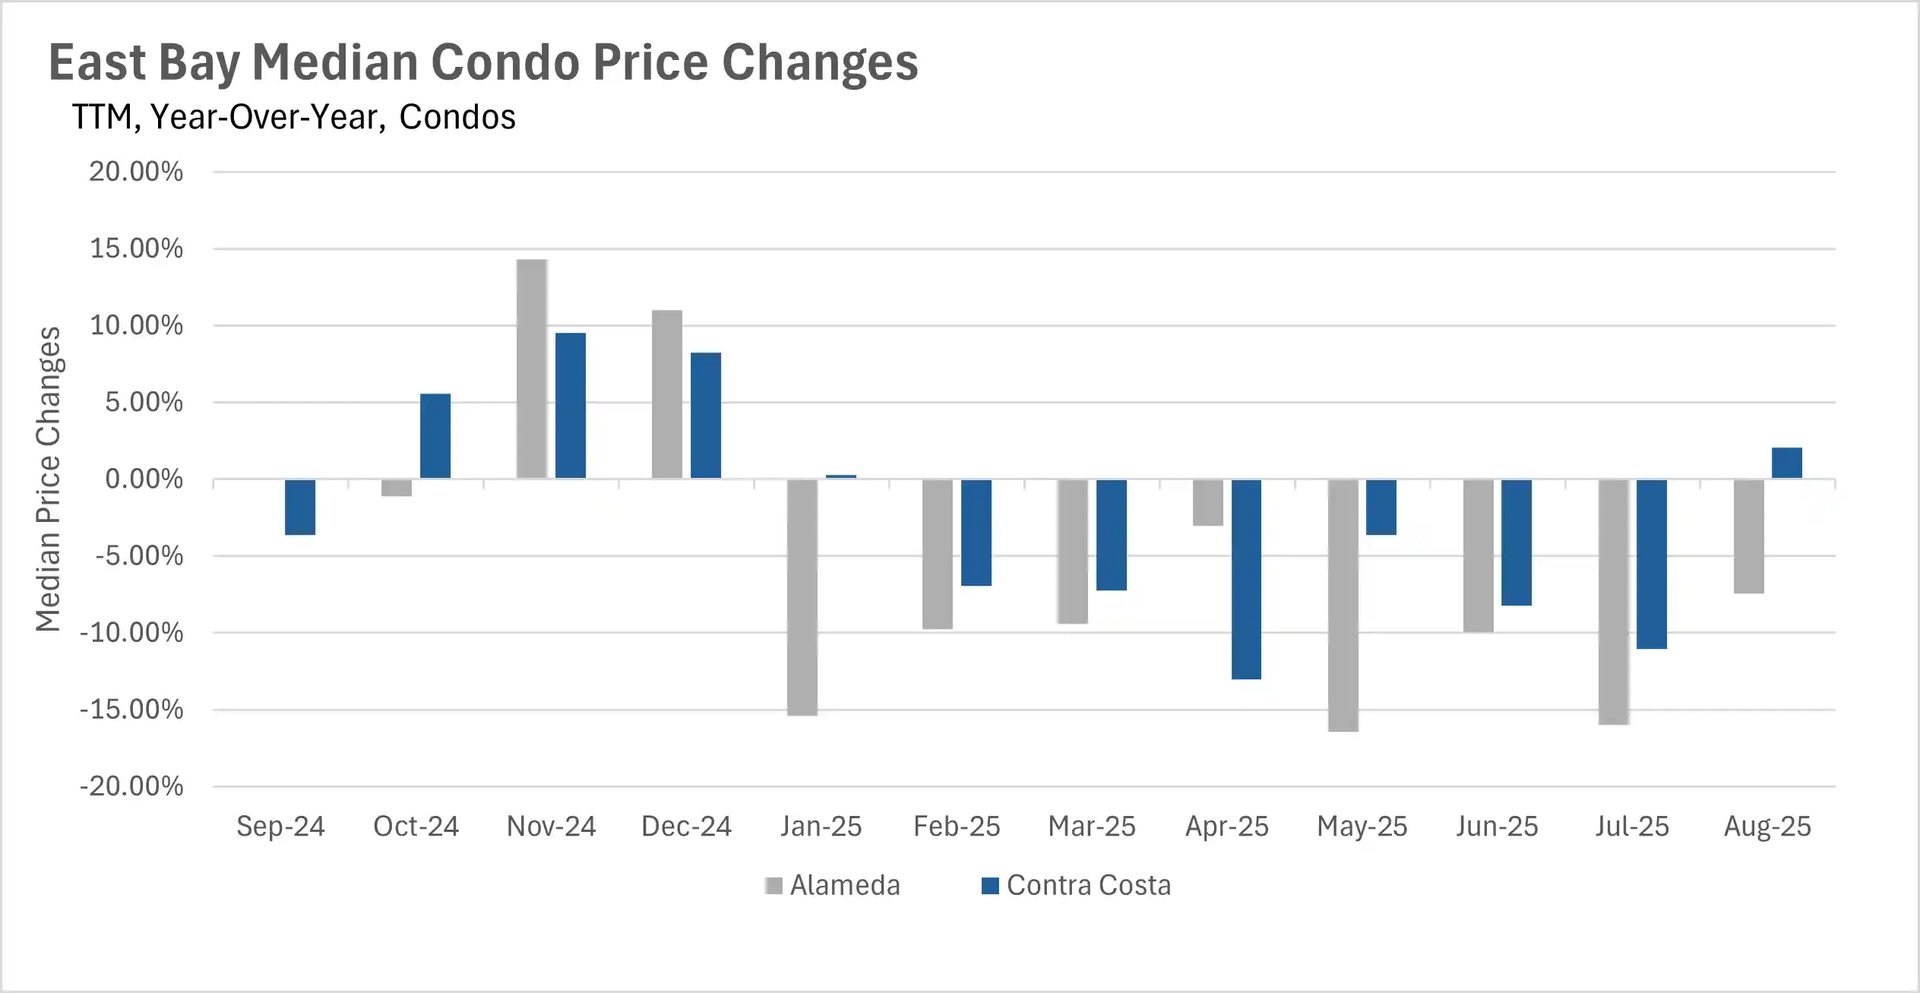
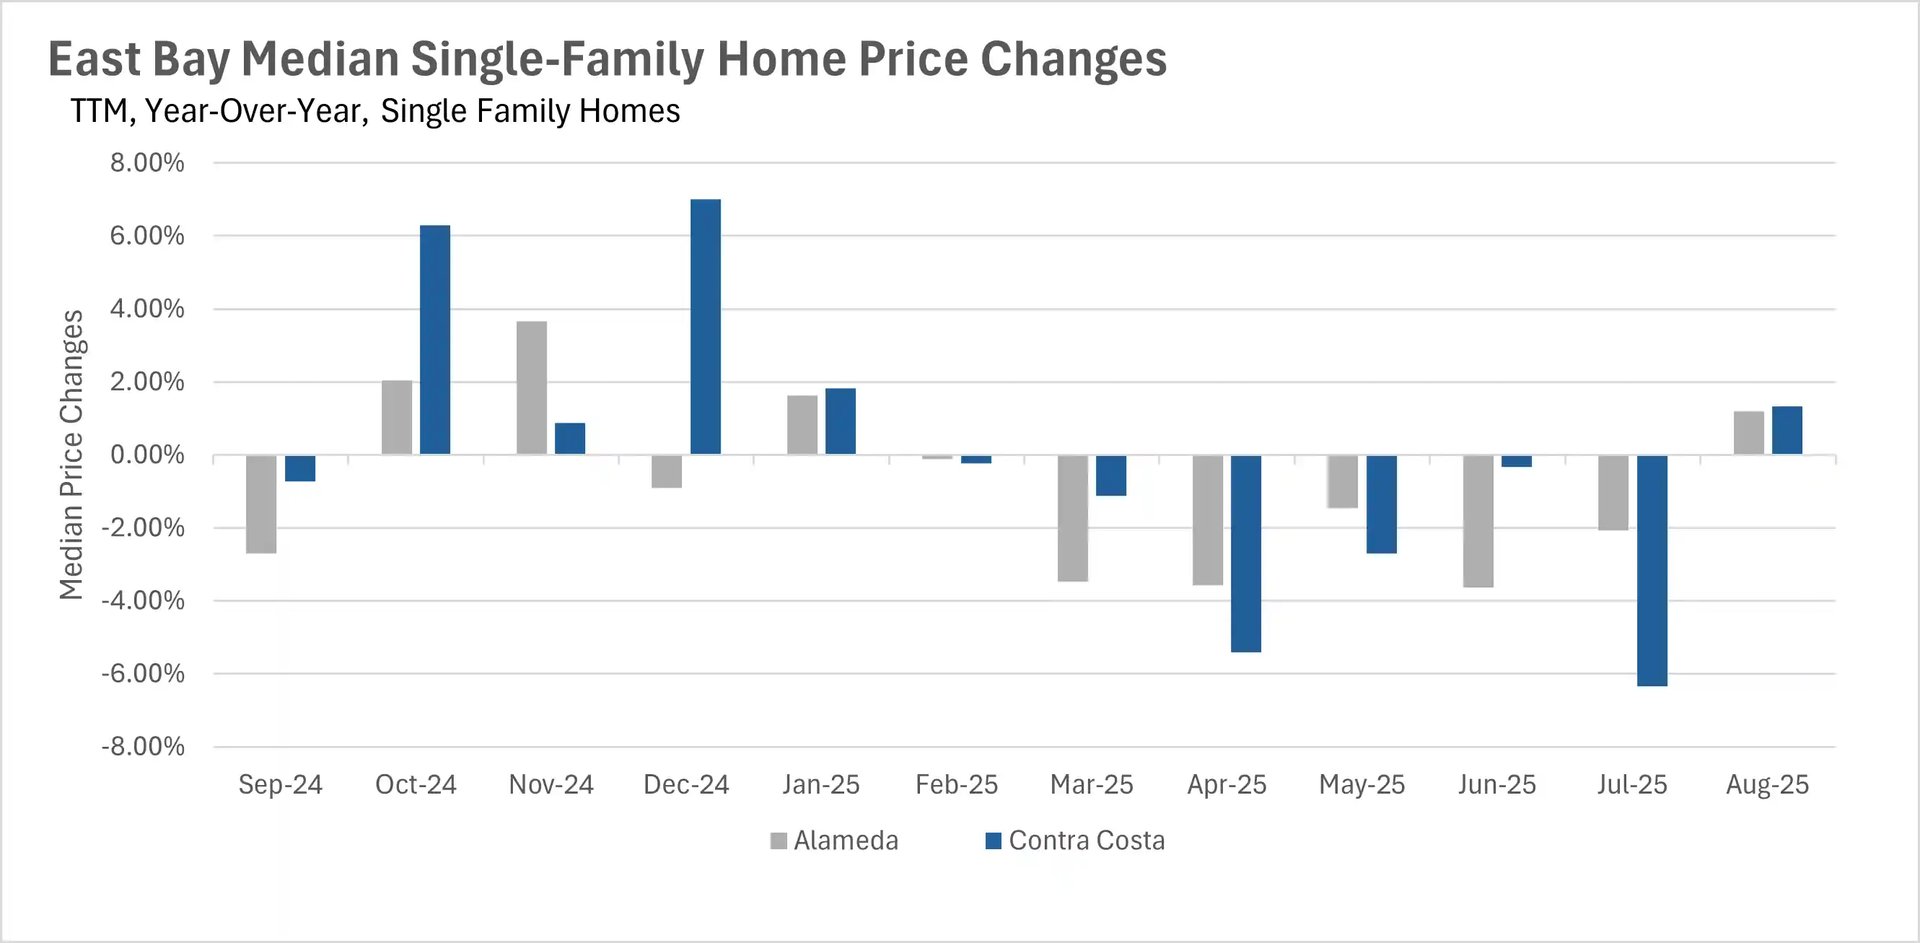
- In August, median sale prices increased on a year-over-year basis in the East Bay for the first time in six months!
- Despite median sale price growth, inventories remain at an elevated level on a year-over-year basis.
- While inventories are normalizing, the average listing is still spending quite a bit more time on the market when compared to last year.
Note: You can find the charts/graphs for the Local Lowdown at the end of this section.
*National Association of REALTORS® data is released two months behind, so we estimate the most recent month's data when possible and appropriate.
Median sale price growth returns to the East Bay
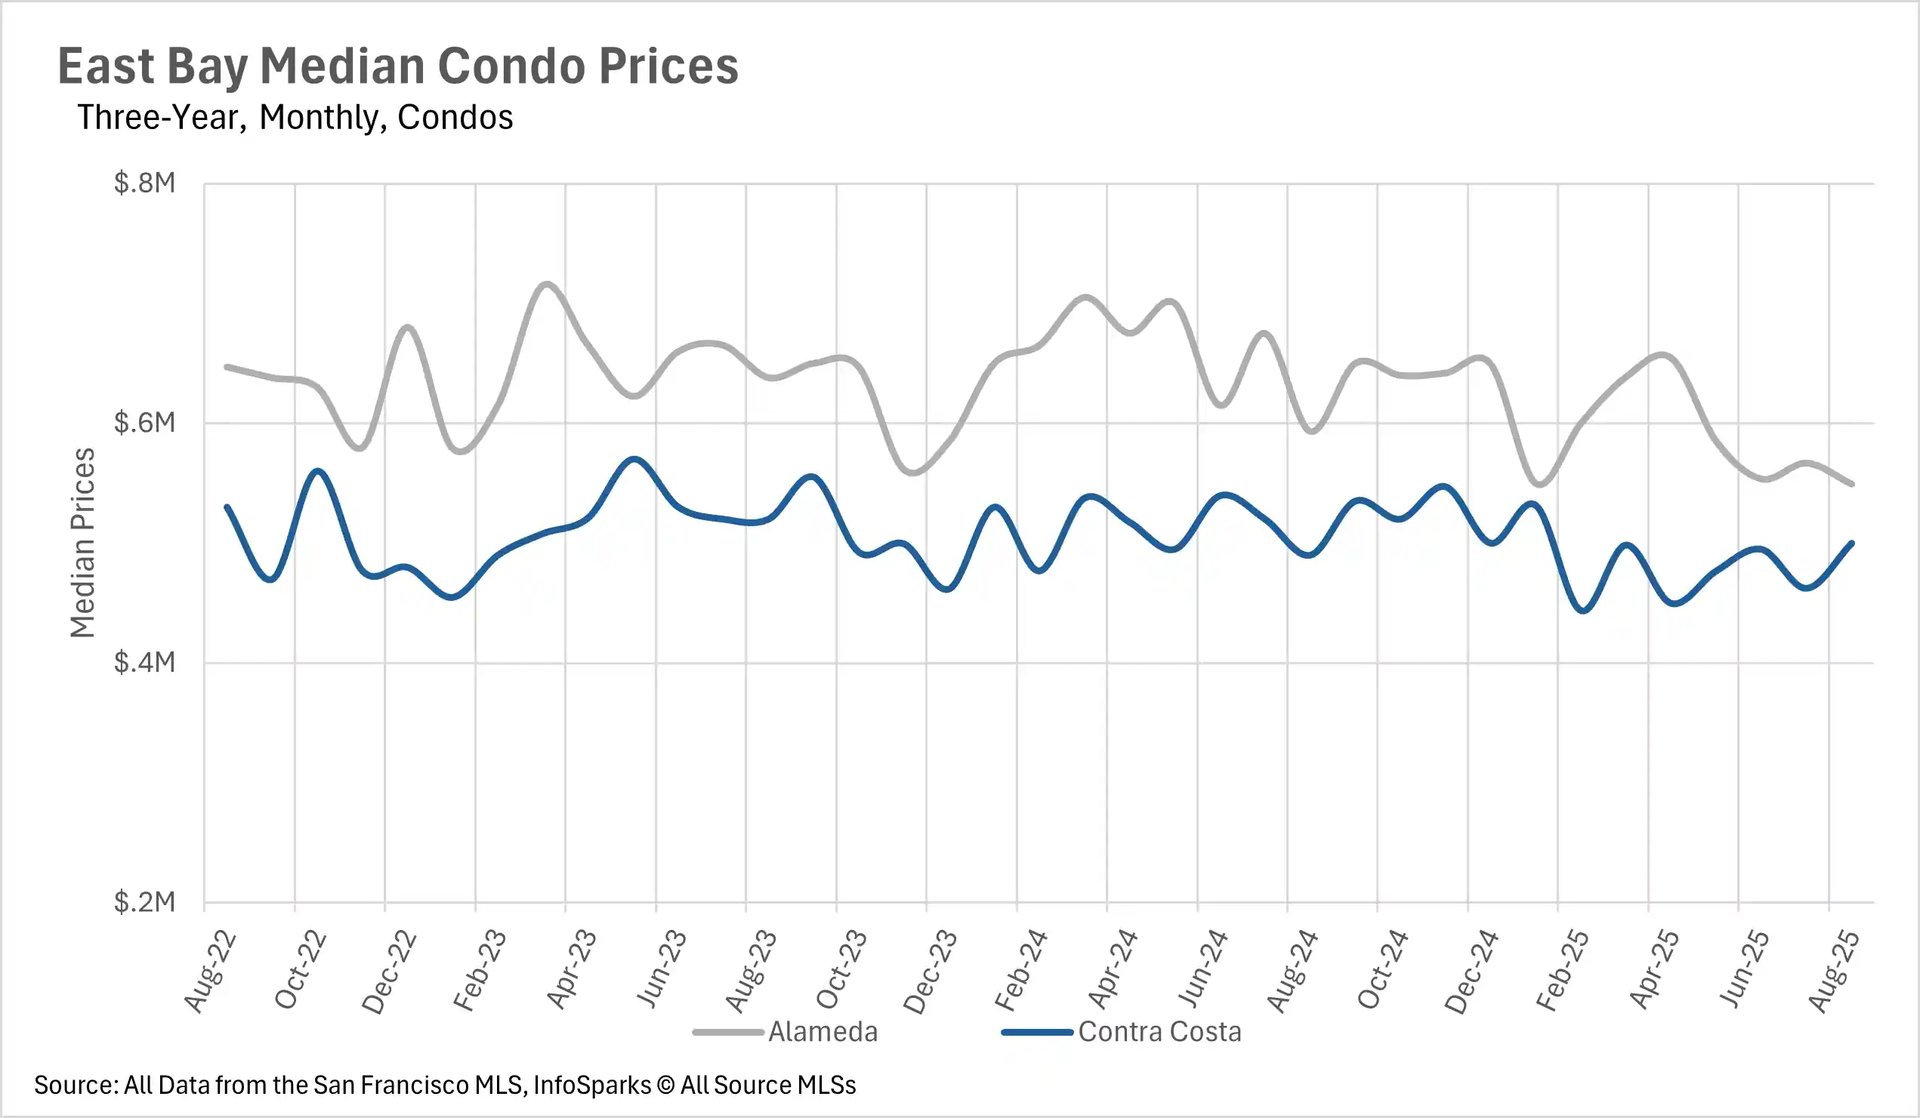
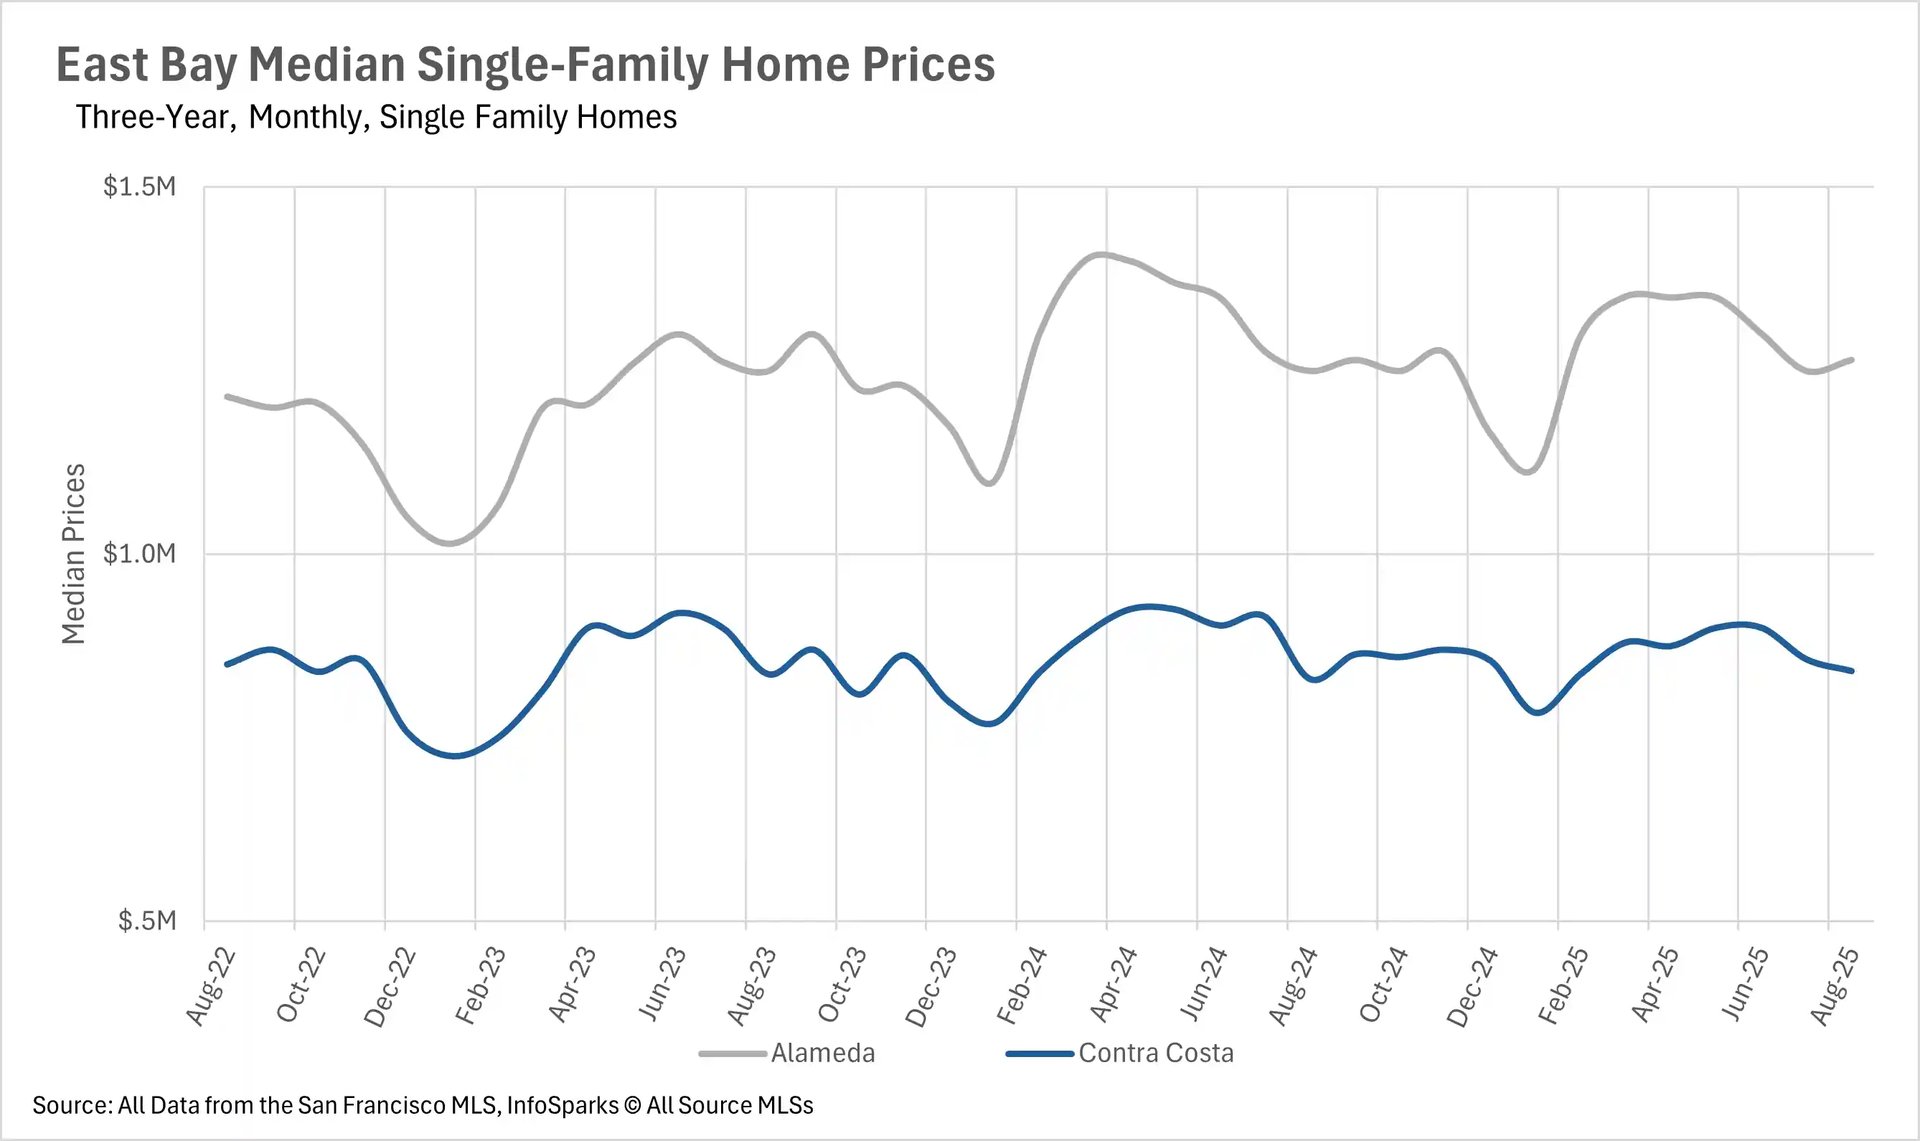
Over the past few months, we have seen nothing but year-over-year declines in median sale price throughout the East Bay. However, for the first time in 6 months, we saw median sale prices increase in August. Median sale prices for single-family homes increased by 1.20% and 1.33% in Alameda and Contra Costa Counties, respectively. Unfortunately, when we turn to the condo market, we did not see the same widespread increase in values, with median sale prices increasing by 2.04% on a year-over-year basis in Contra Costa County, and decreasing by 7.41% in Alameda County.
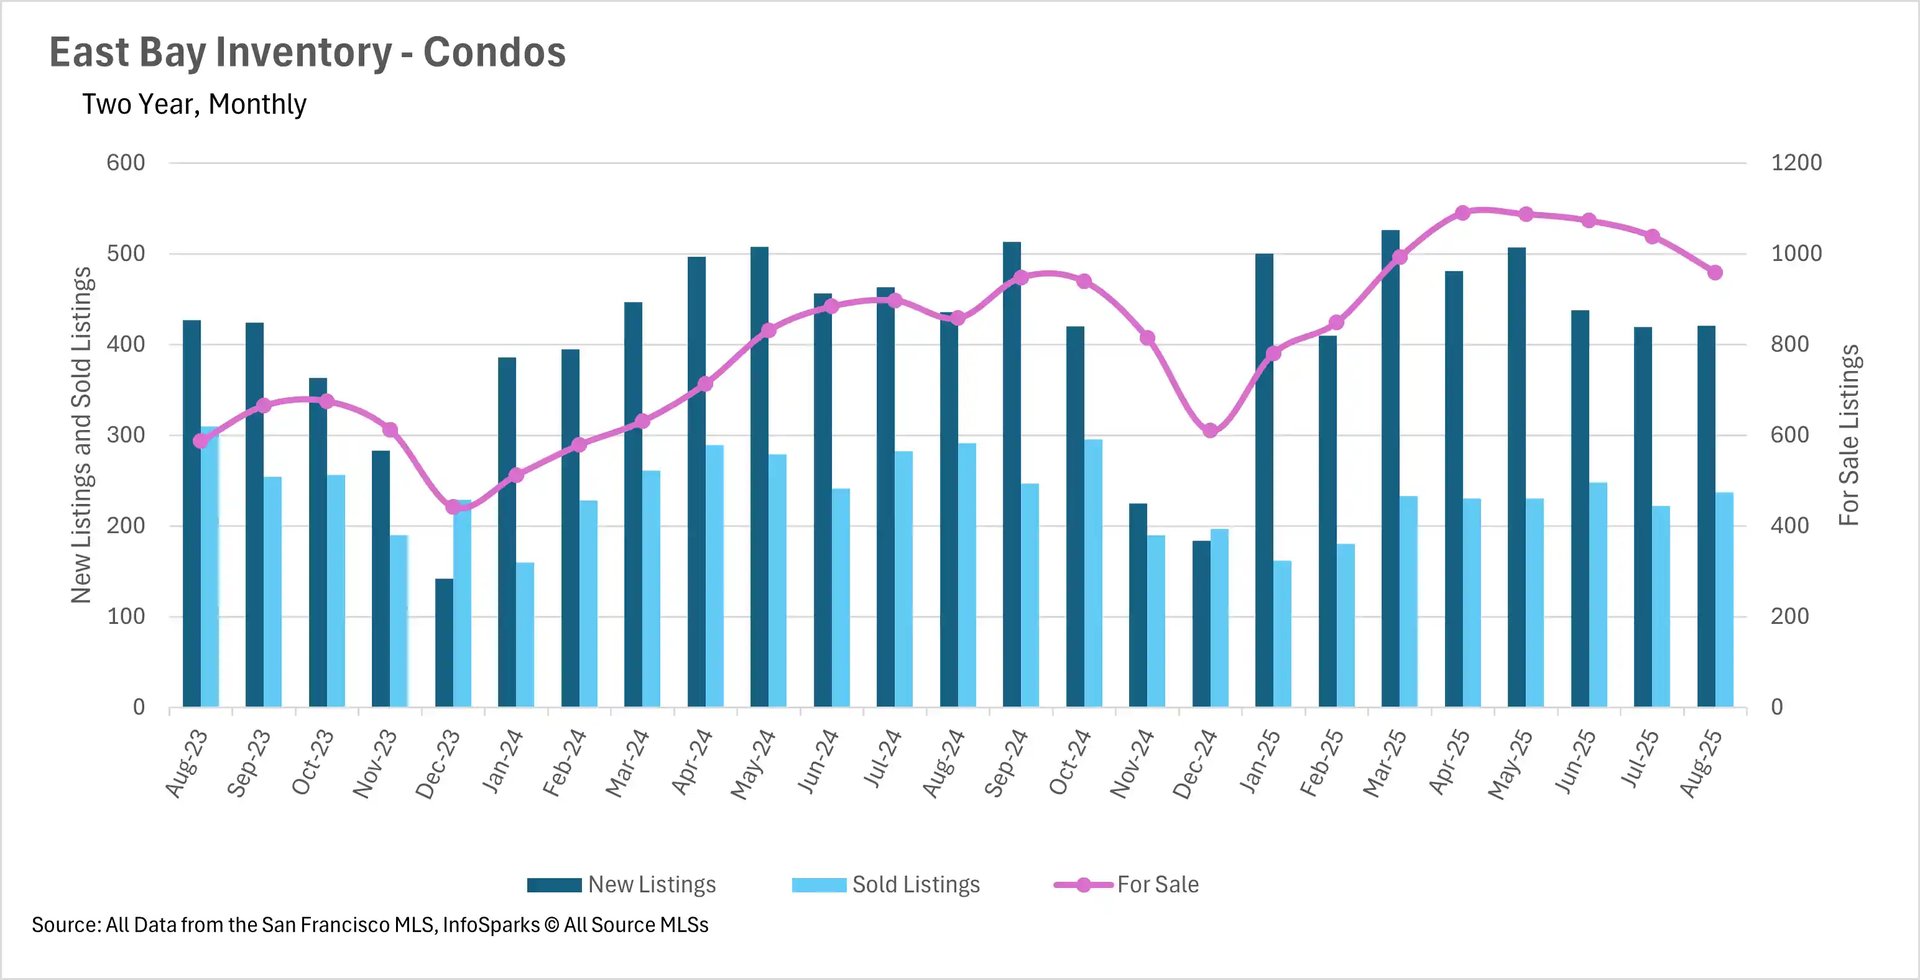
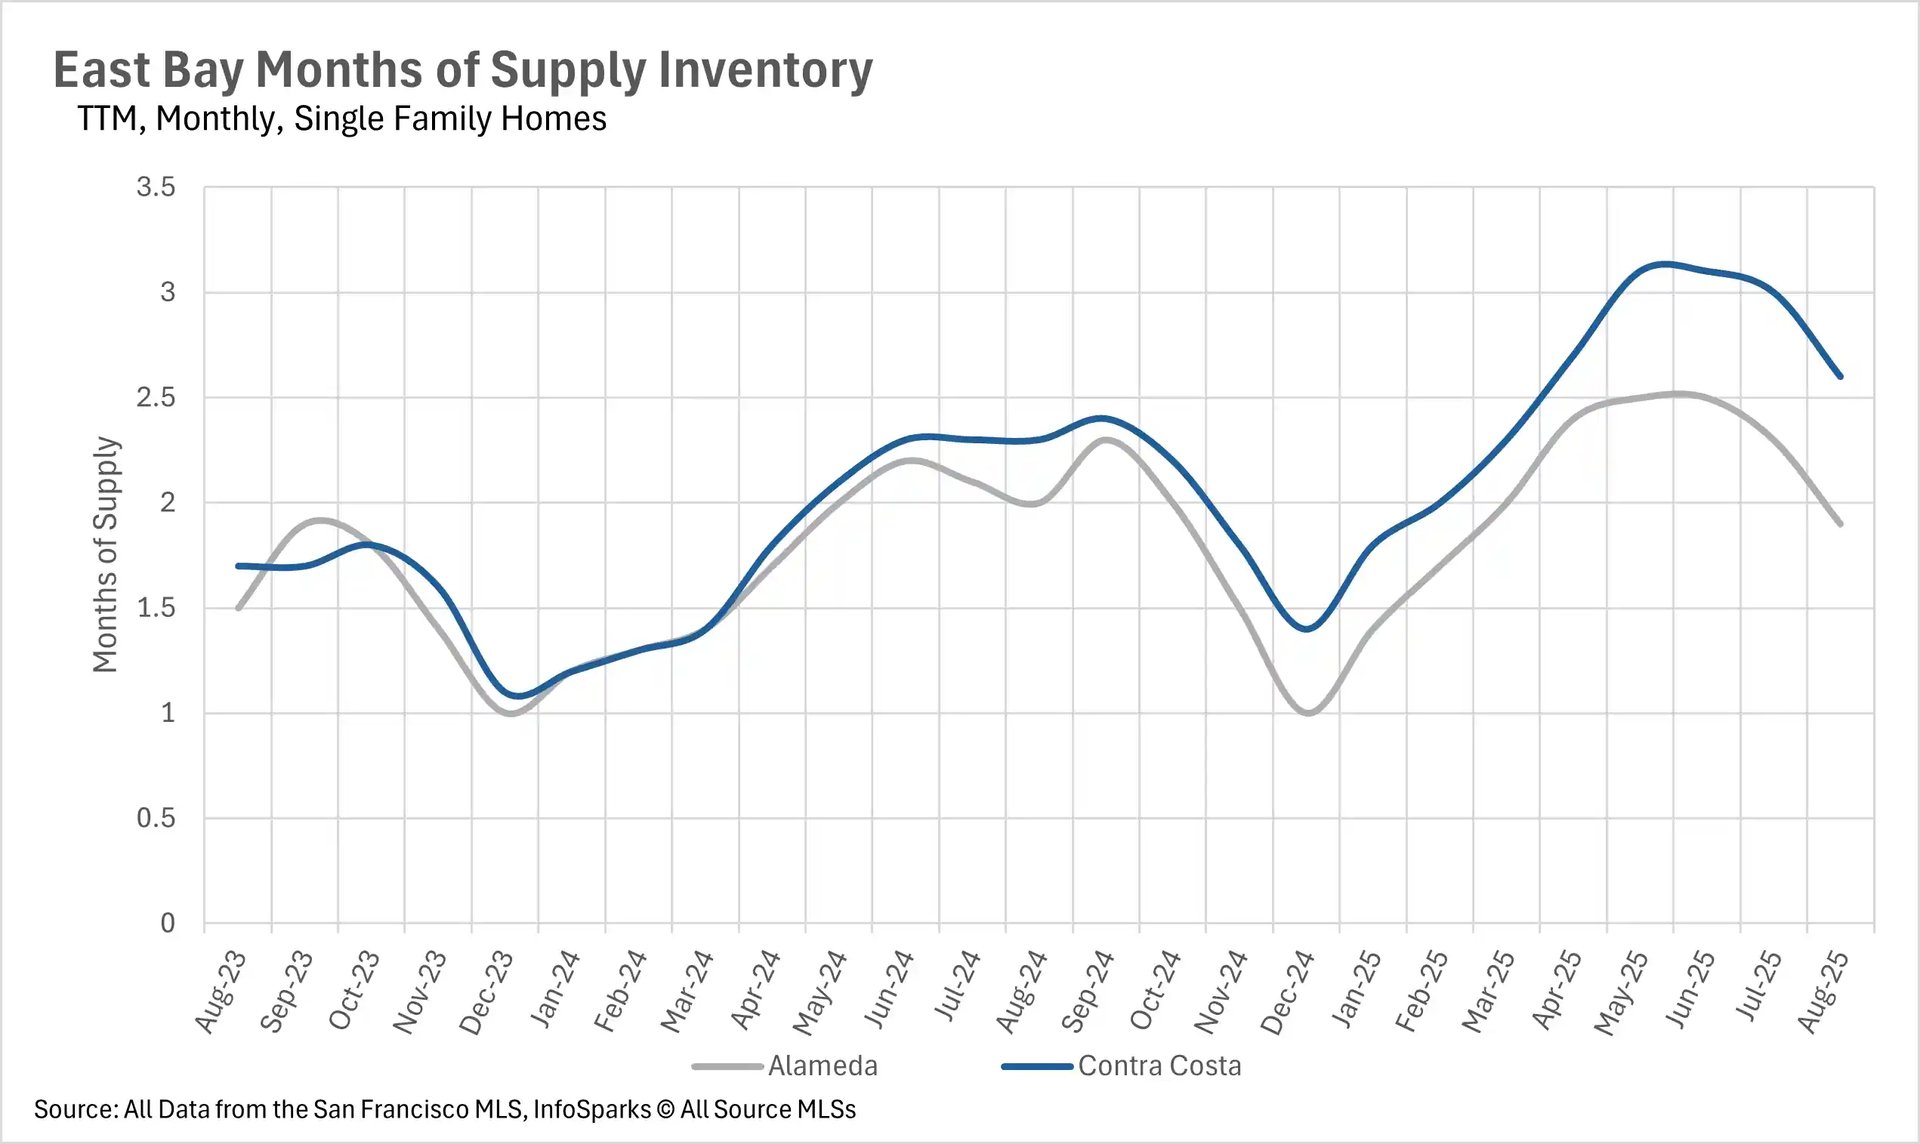
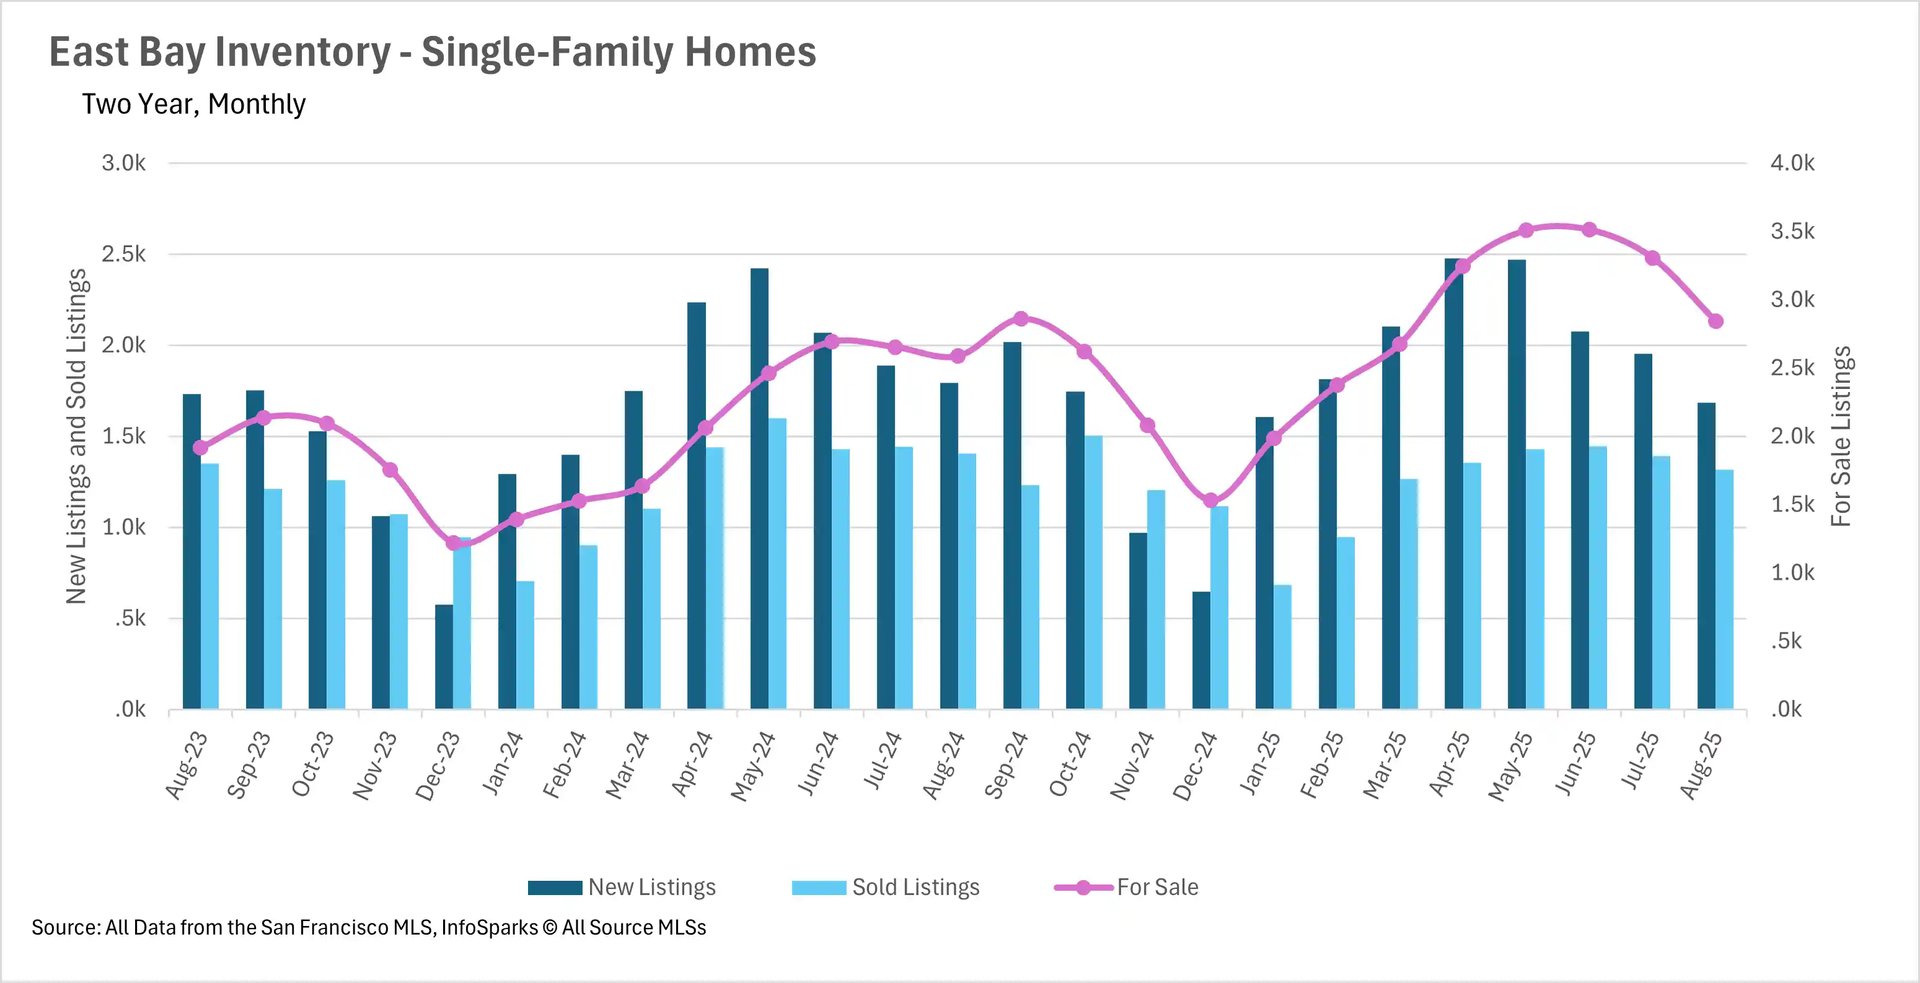
While inventories are decreasing, they’re still high year-over-year
Much like the rest of California, inventories built at a breakneck rate throughout the late spring and early summer this year. However, this trend seems to be reversing to a degree. In August, there were 9.97% more active single-family home listings on the market, and 11.67% more active condo listings. This month was the first time in a while that we saw fewer new listings hitting the market on a year-over-year basis, though, with there being 6.18% fewer single-family homes and 3.44% fewer condos hitting the market on a year-over-year basis.
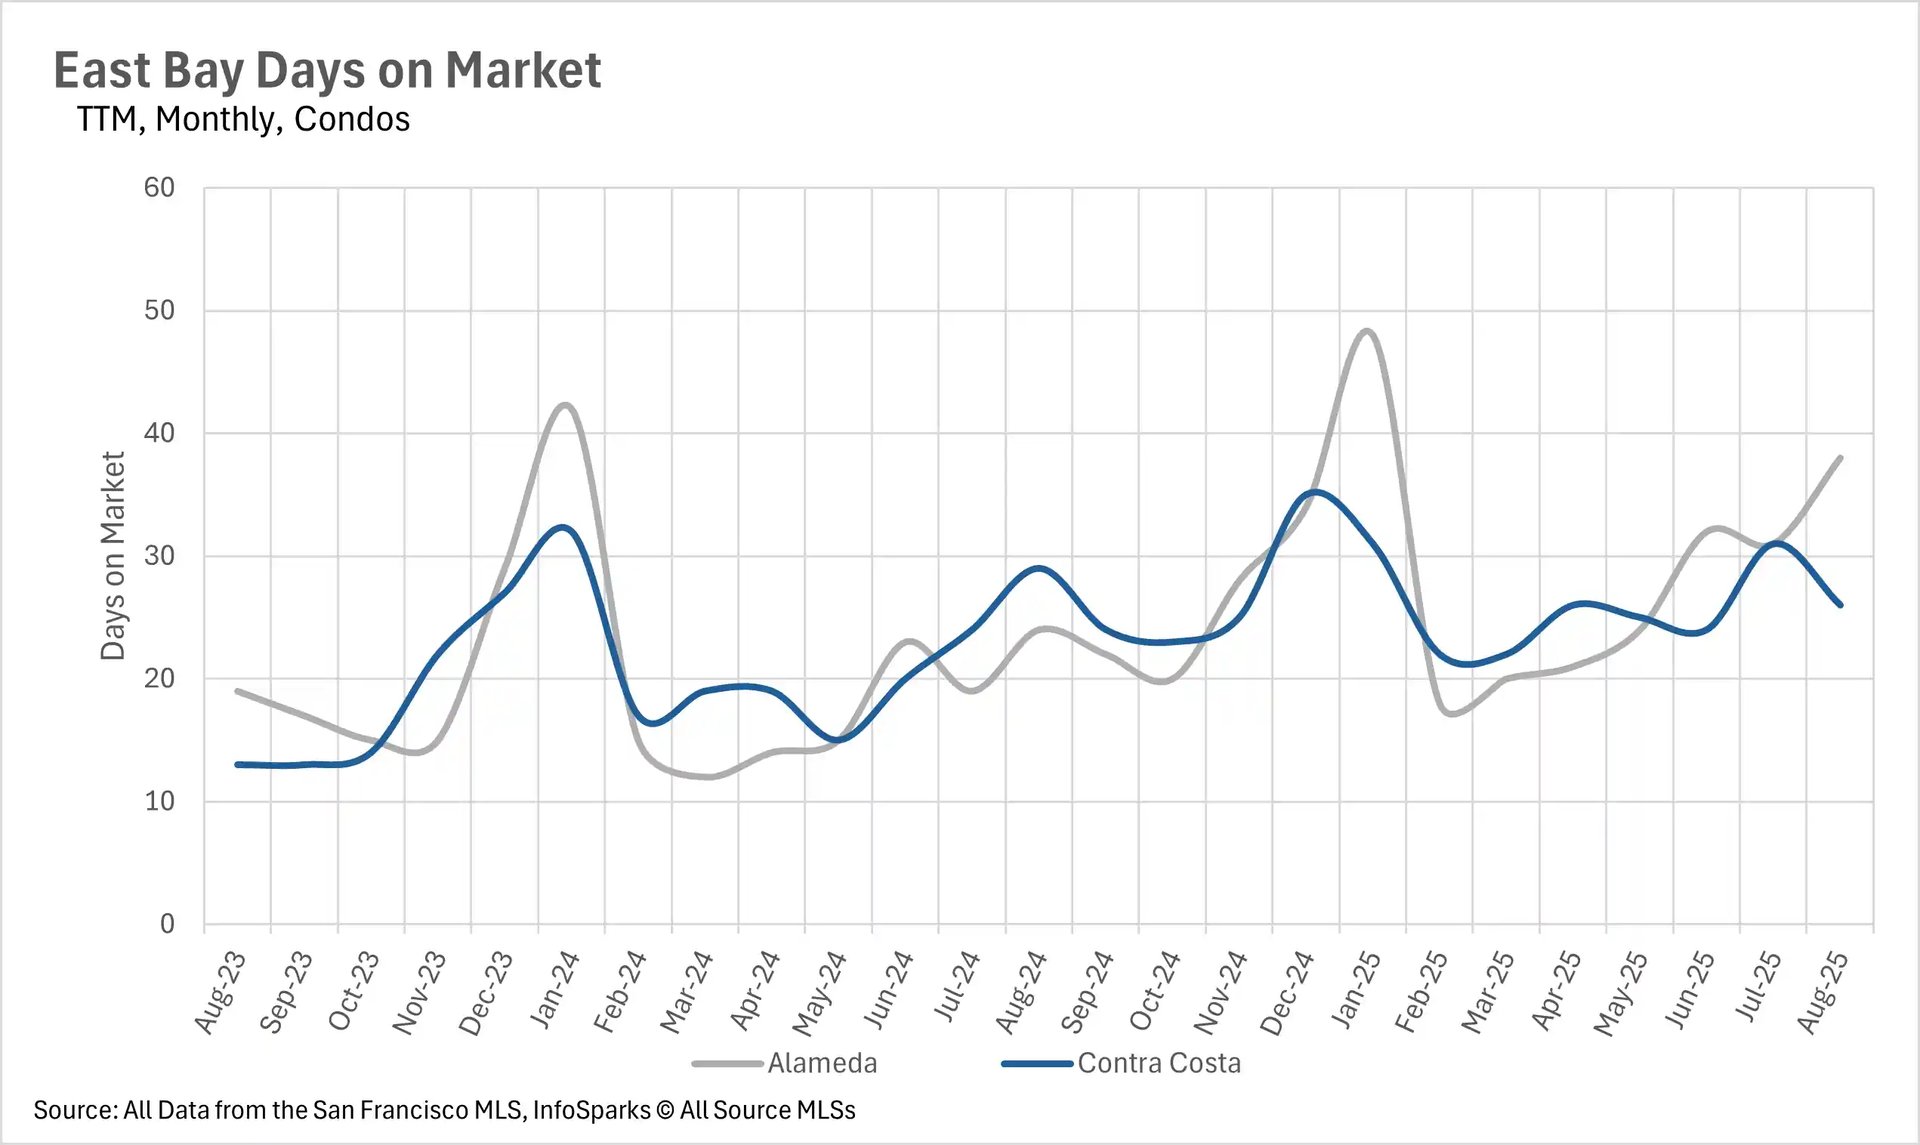
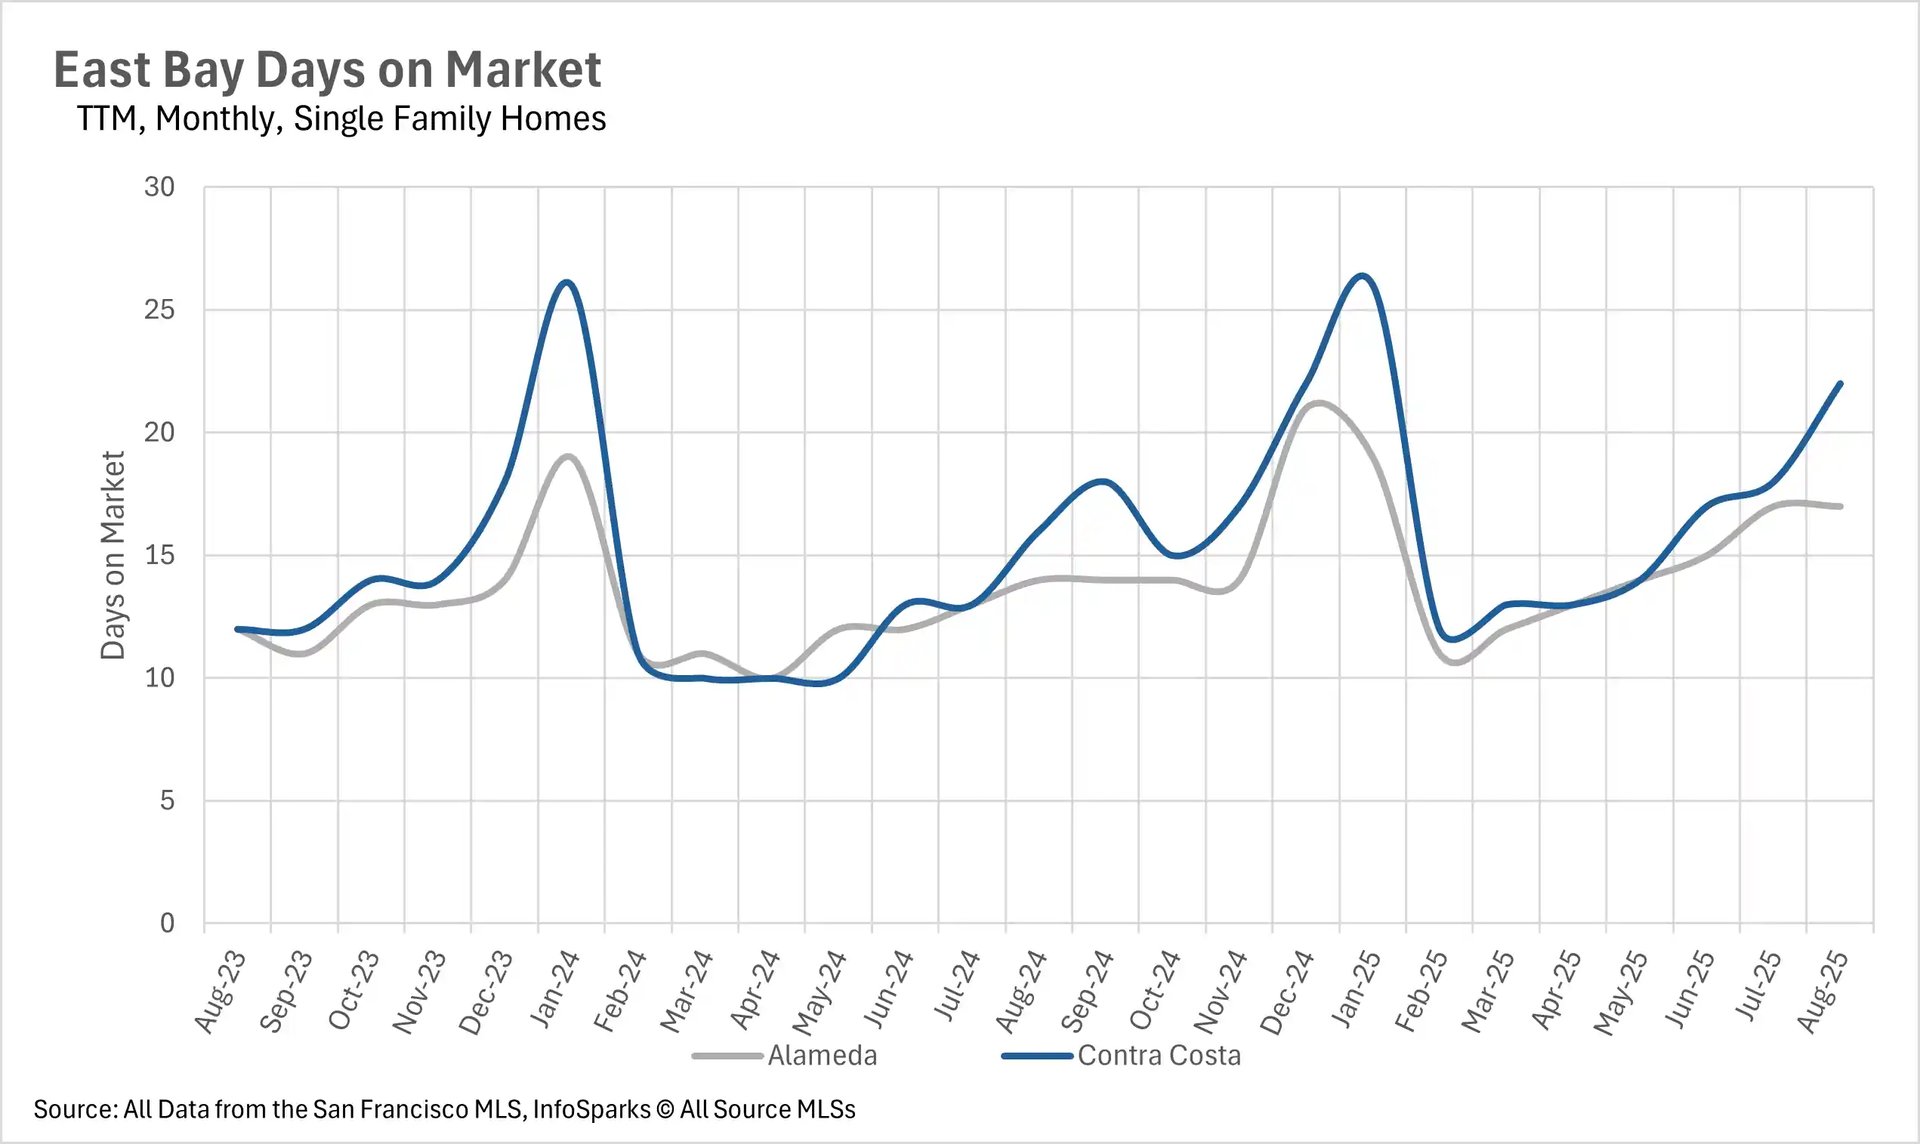
As inventory levels remain high, so does the amount of time the average listing spends on the market
Since inventory levels remain relatively high on a year-over-year basis, listings are spending more time on the market, as buyers have more options. However, despite the fact that single-family homes are spending 21.43% more time on the market in Alameda County and 37.50% more time on the market in Contra Costa County, they’re still being bought up at a relatively fast rate, with the average listing spending 17 and 22 days on the market, respectively. Things are a bit different when we turn to the condo market, with the average condo listing in Alameda County spending 58.33% more time on the market (38 days), and the average Contra Costa County condo spending 10.34% less time on the market (26 days).
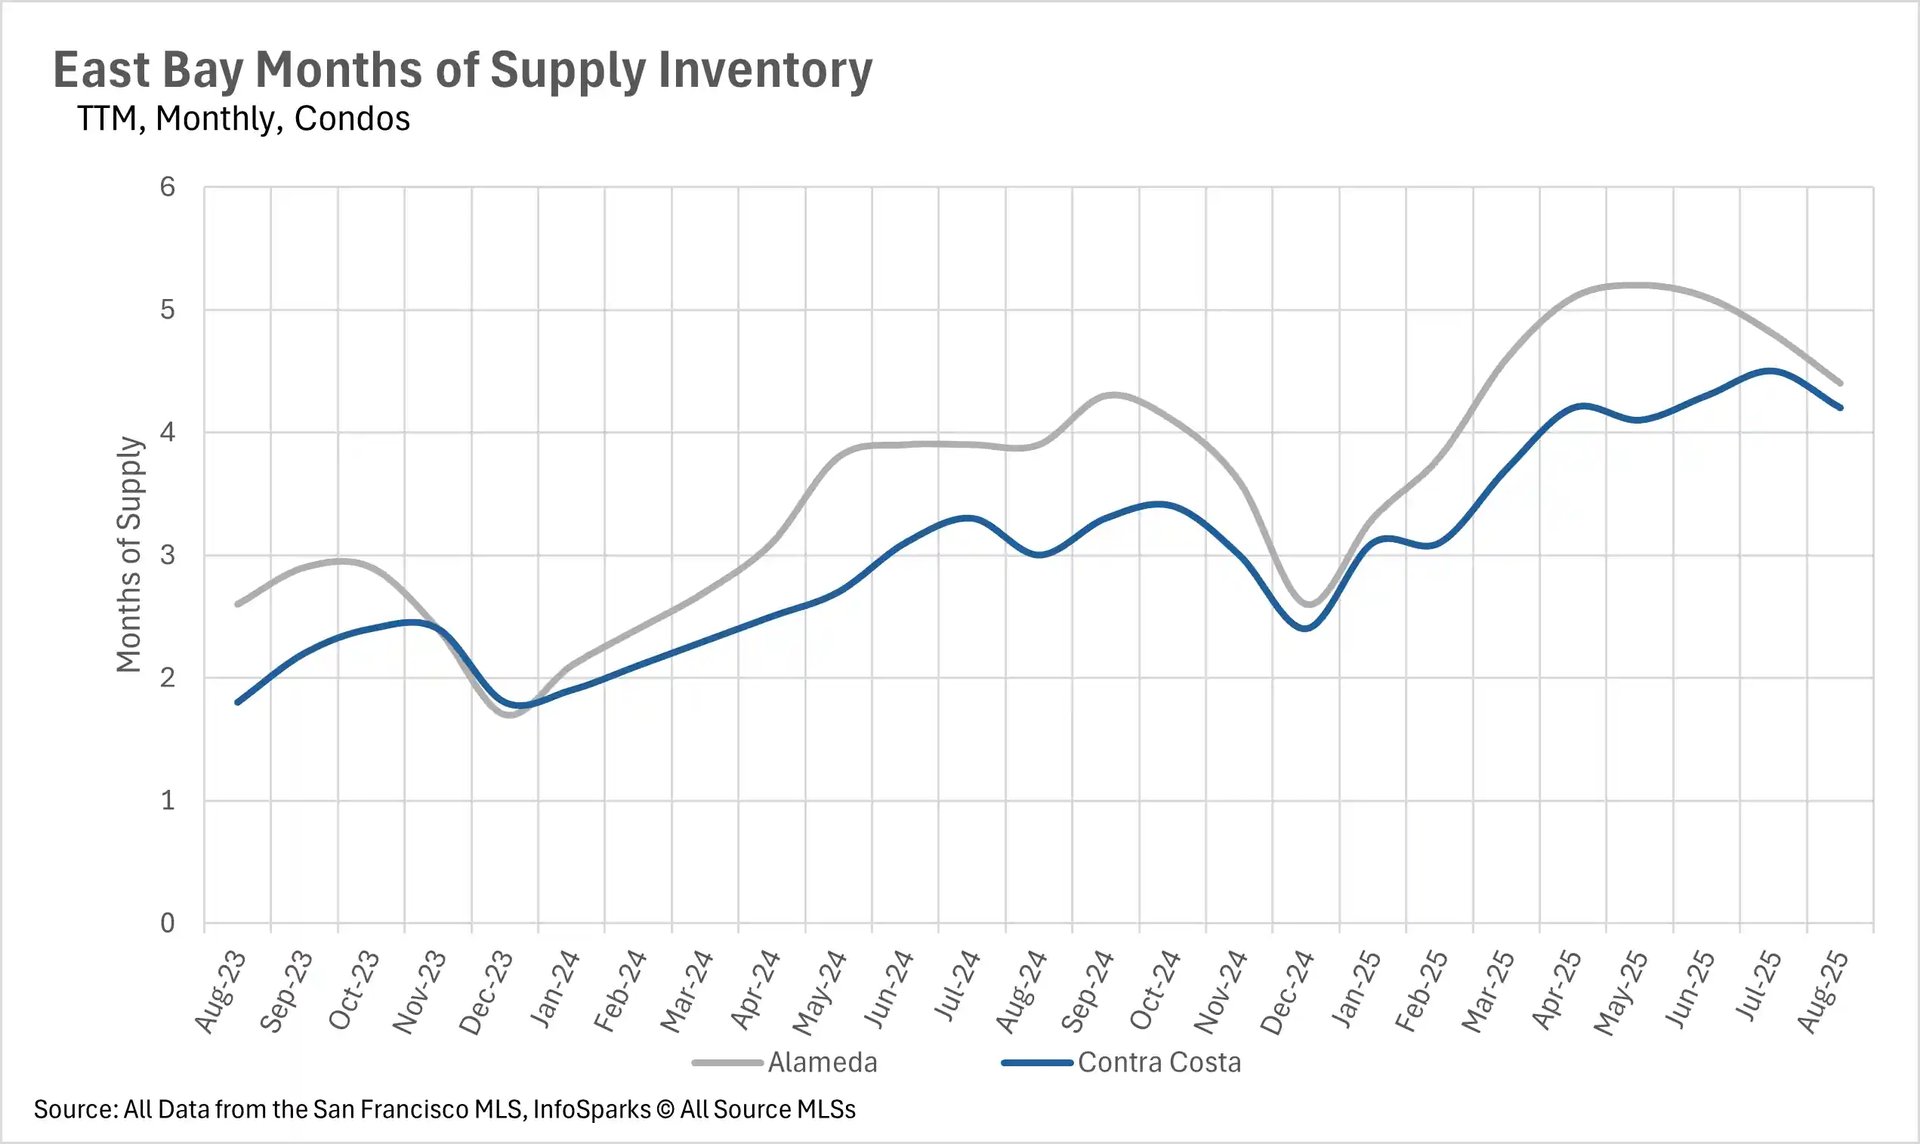
The single-family market is a seller's market, and the condo market is a buyer's market
When determining whether a market is a buyers’ market or a sellers’ market, we look to the Months of Supply Inventory (MSI) metric. The state of California has historically averaged around three months of MSI, so any area with at or around three months of MSI is considered a balanced market. Any market that has lower than three months of MSI is considered a seller’s market, whereas markets with more than three months of MSI are considered buyers’ markets.
The East Bay single-family home market is entirely a seller's market, with just 1.9 months of inventory on the market in Alameda County and 2.6 months of inventory on the market in Contra Costa County. However, the condo market tells a much different story. There are 4.2 months of condo inventory on the market in Contra Costa County, and 4.4 months of inventory on the market in Alameda County, making the entire condo market very buyer-friendly.