Aerial view of neighborhood in Silicon Valley

Silicon Valley Real Estate Market Report - July 2025

Select a Market Report to Read:

Quick Take

  • The single-family home market has remained incredibly resilient, while cracks have begun to form in the condo market.
  • Silicon Valley inventory levels seem to have reached a local peak in May and have begun to decrease in June.
  • Condos are spending approximately 2-3x longer on the market when compared to this time last year.

Note: You can find the charts/graphs for the Local Lowdown at the end of this section.

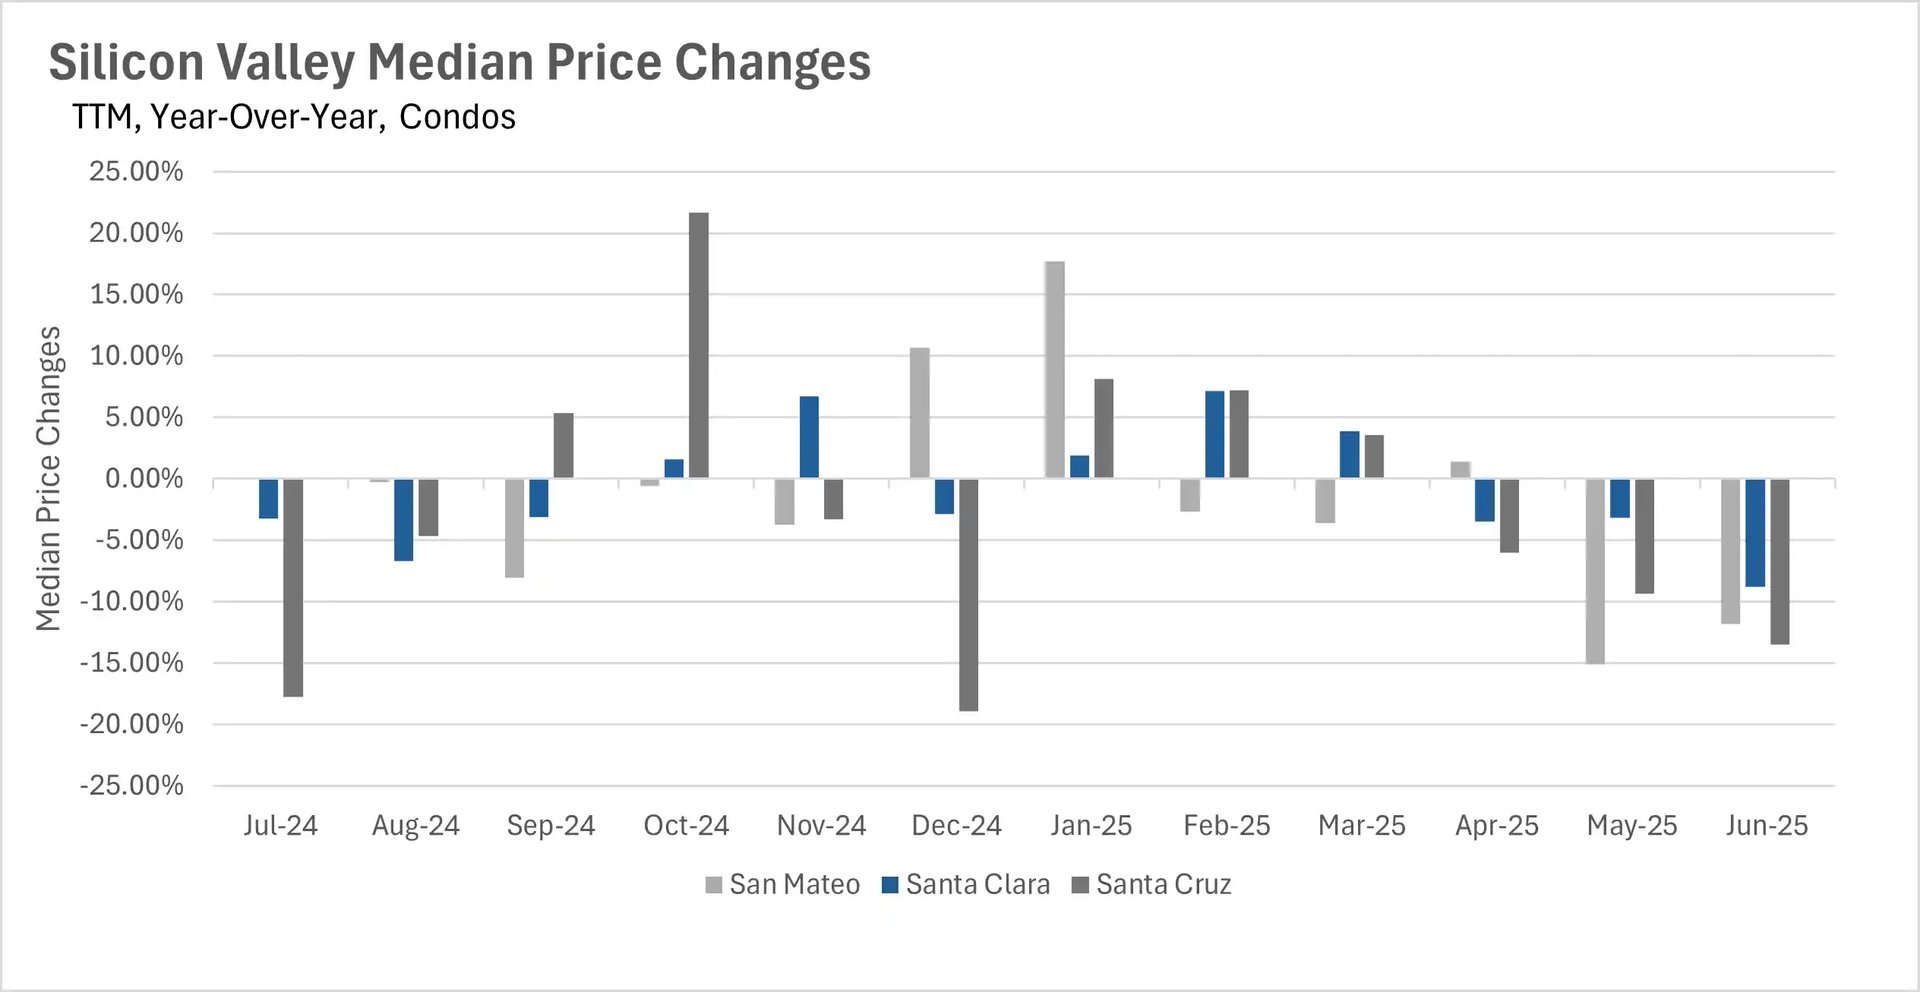
The third straight month of median sale price declines in the condo market

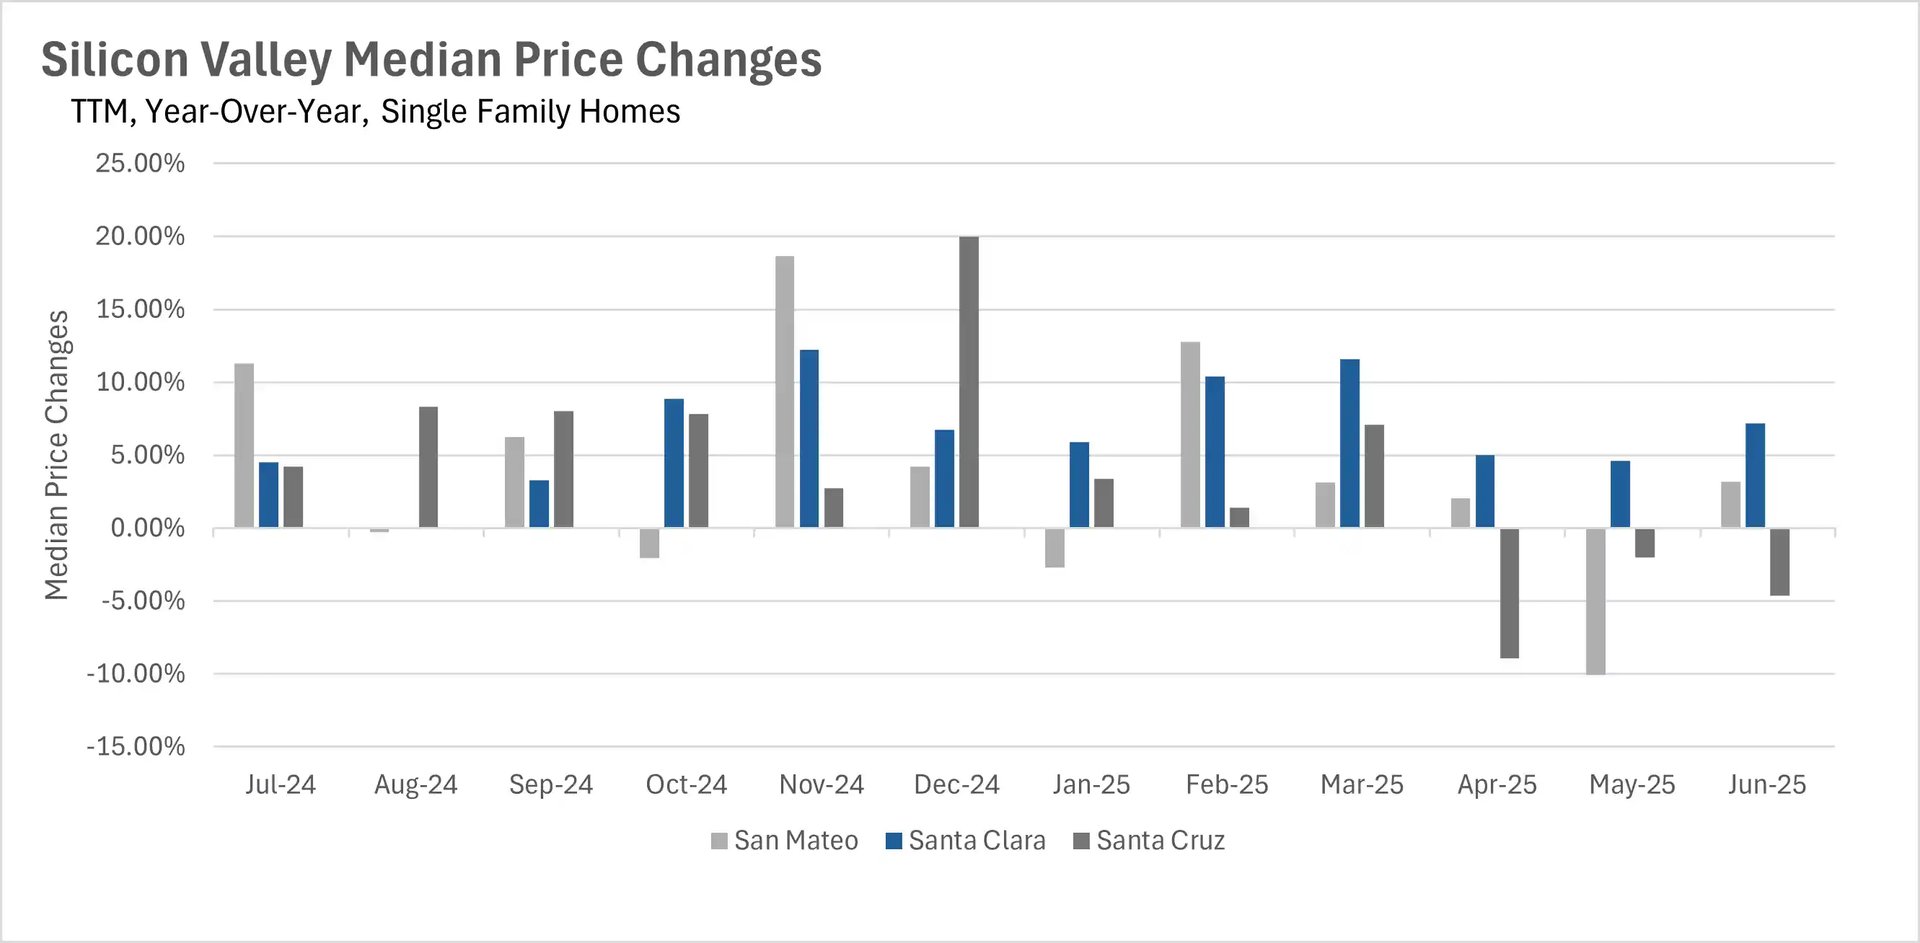
Although we saw some healthy growth throughout most of the single-family home market in June, with median sales prices up 3.21% and 7.18% on a year-over-year basis in San Mateo and Santa Clara counties, respectively, and down by 4.64% in Santa Cruz County, a much different story is playing out in the condo market. The condo market just saw its third straight month of median sale price declines, which were fairly drastic too. Santa Clara County median sale prices saw a year-over-year decline of 8.79%, San Mateo County decreased by 11.84%, and Santa Cruz County saw a huge 13.52% drop.

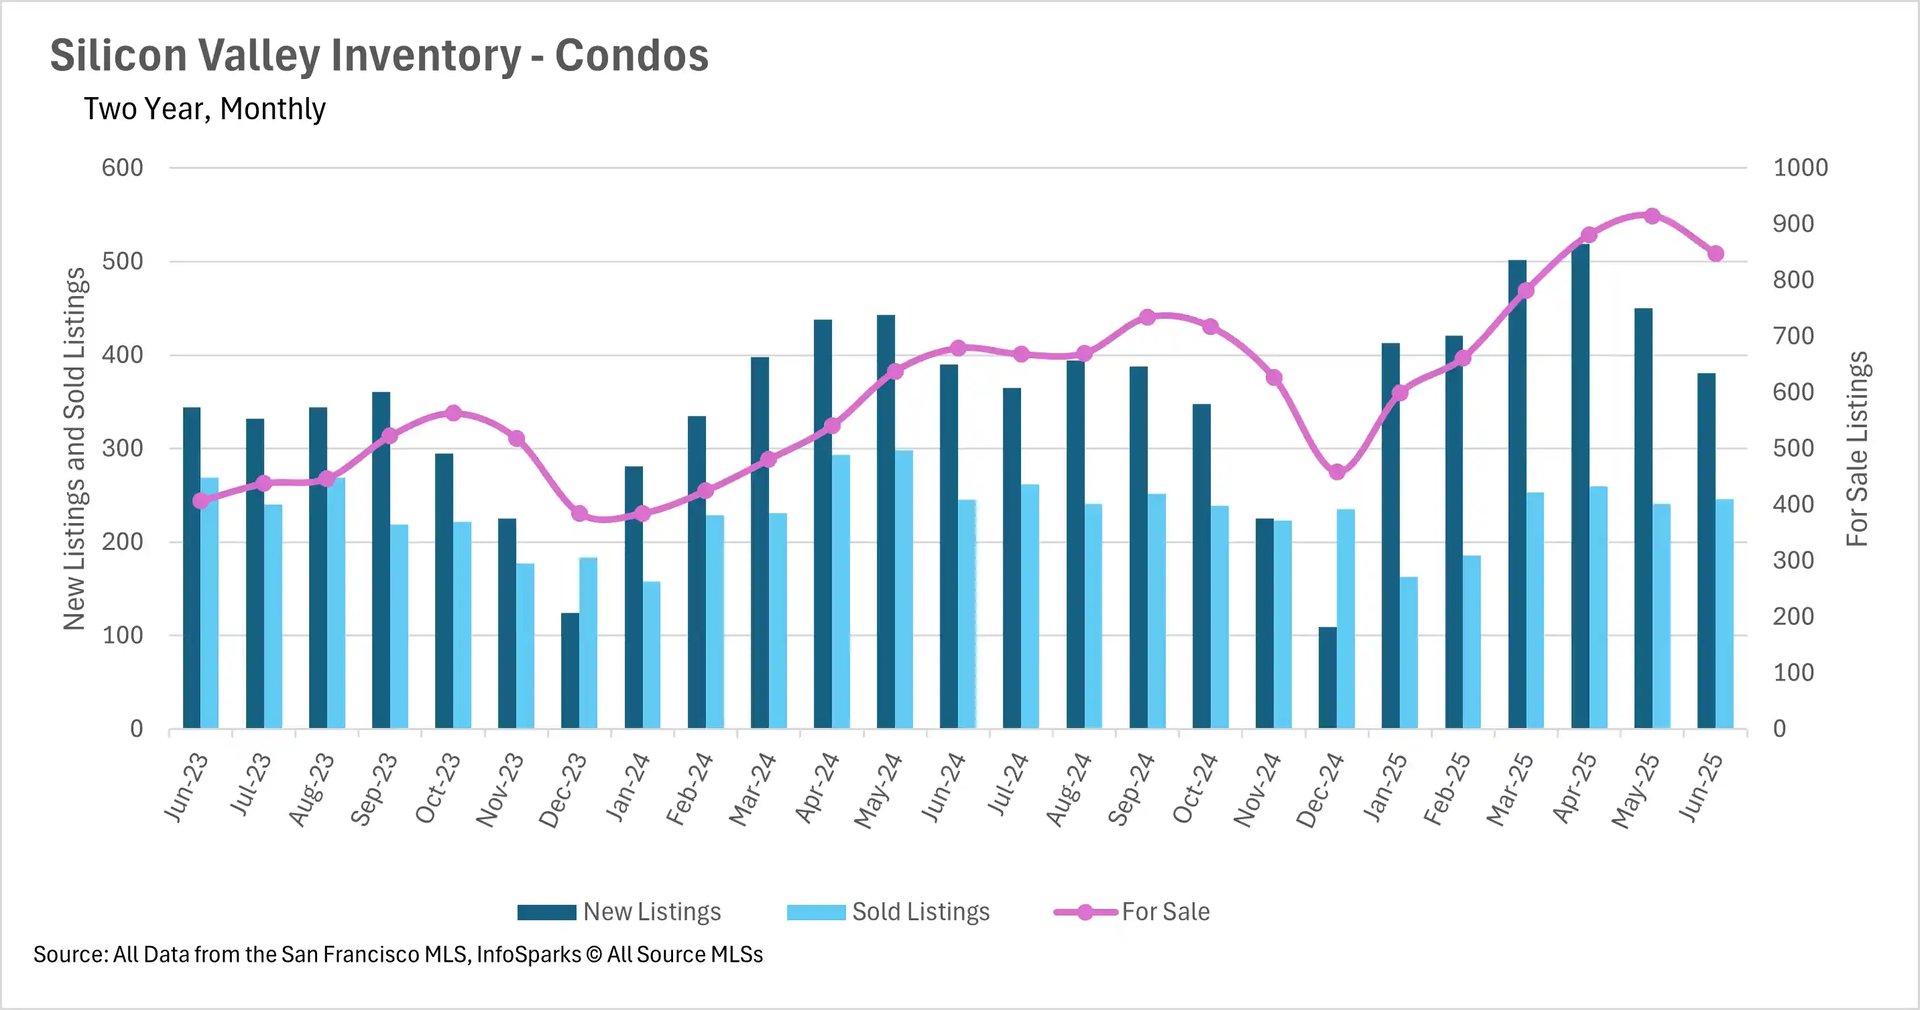
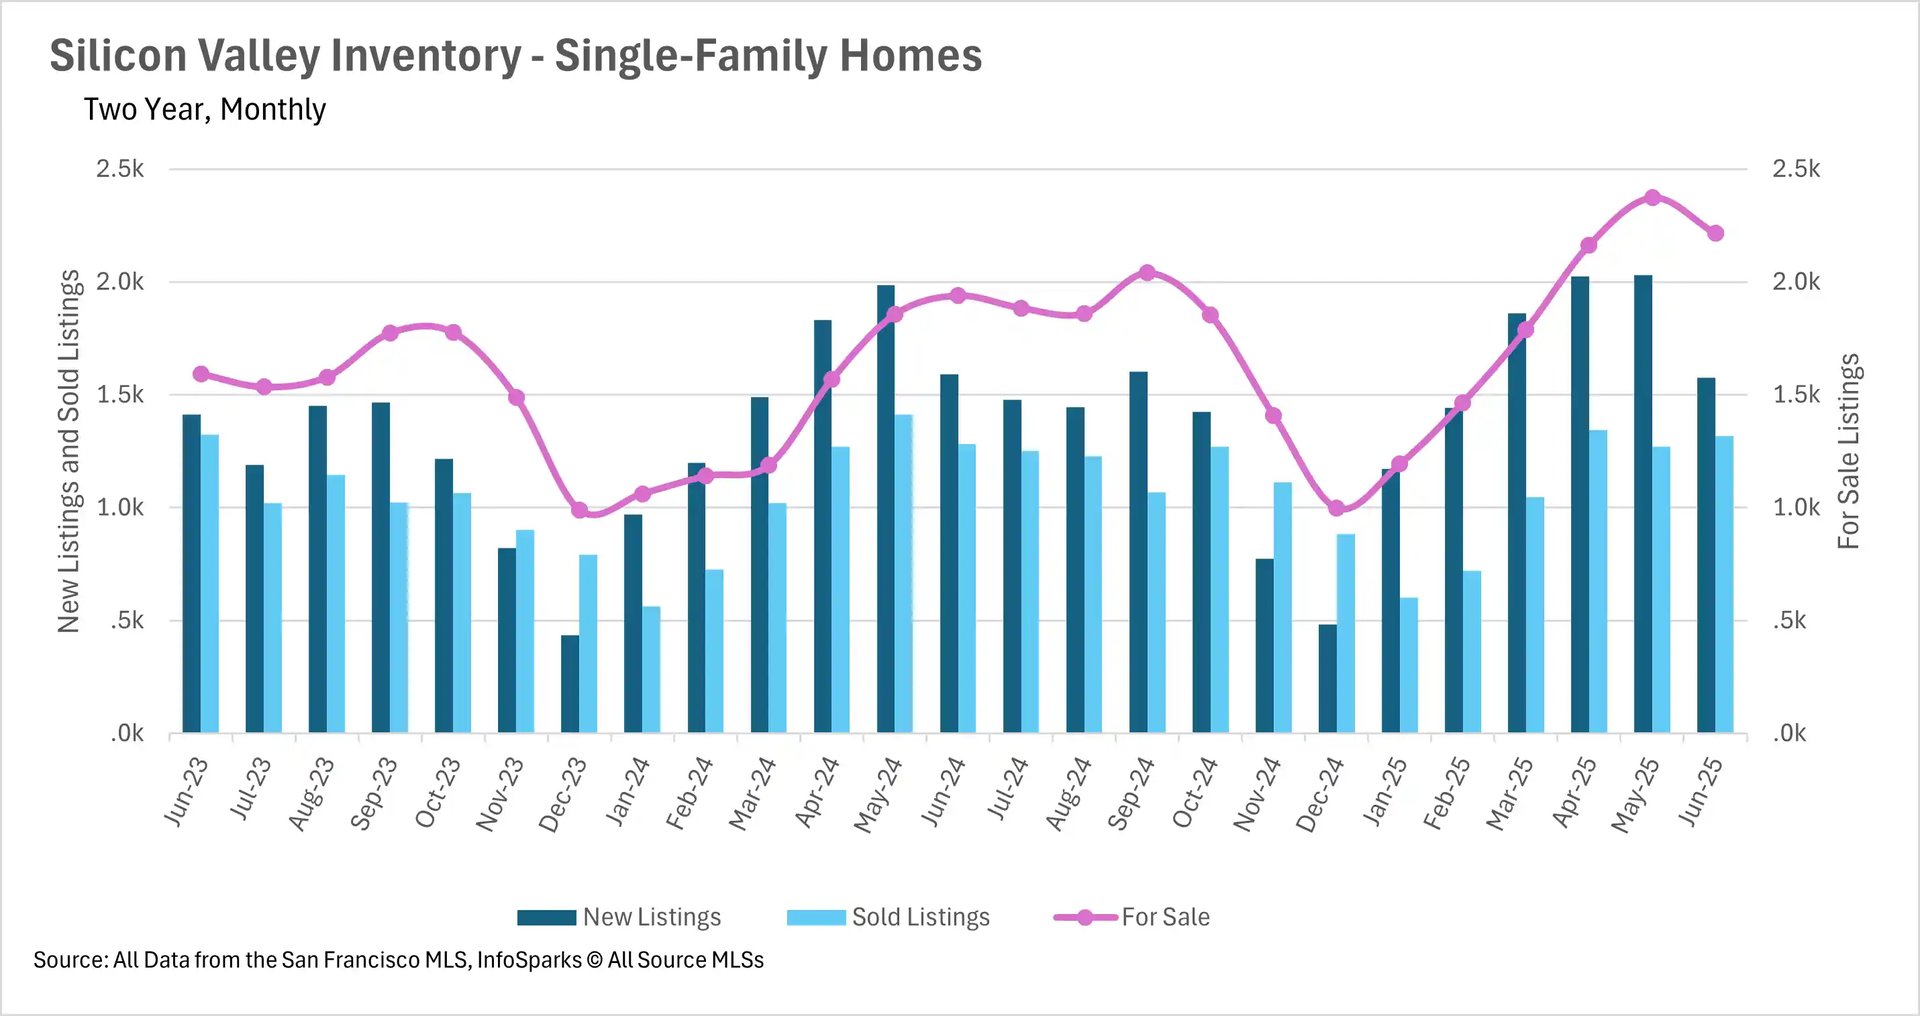
Inventories seem to have peaked for the year in Silicon Valley

It seems like inventories in both the single-family home and condo markets reached their local peak in the month of May, as inventories dropped in June. Despite this local peak, inventories are still much higher than they were around this time last year, with the single-family home market reporting 14.18% more active listings and the condo market reporting 24.89% more active listings. This is largely due to the fact that the number of new homes being added to the market is currently shrinking at a faster rate than the number of homes being sold.

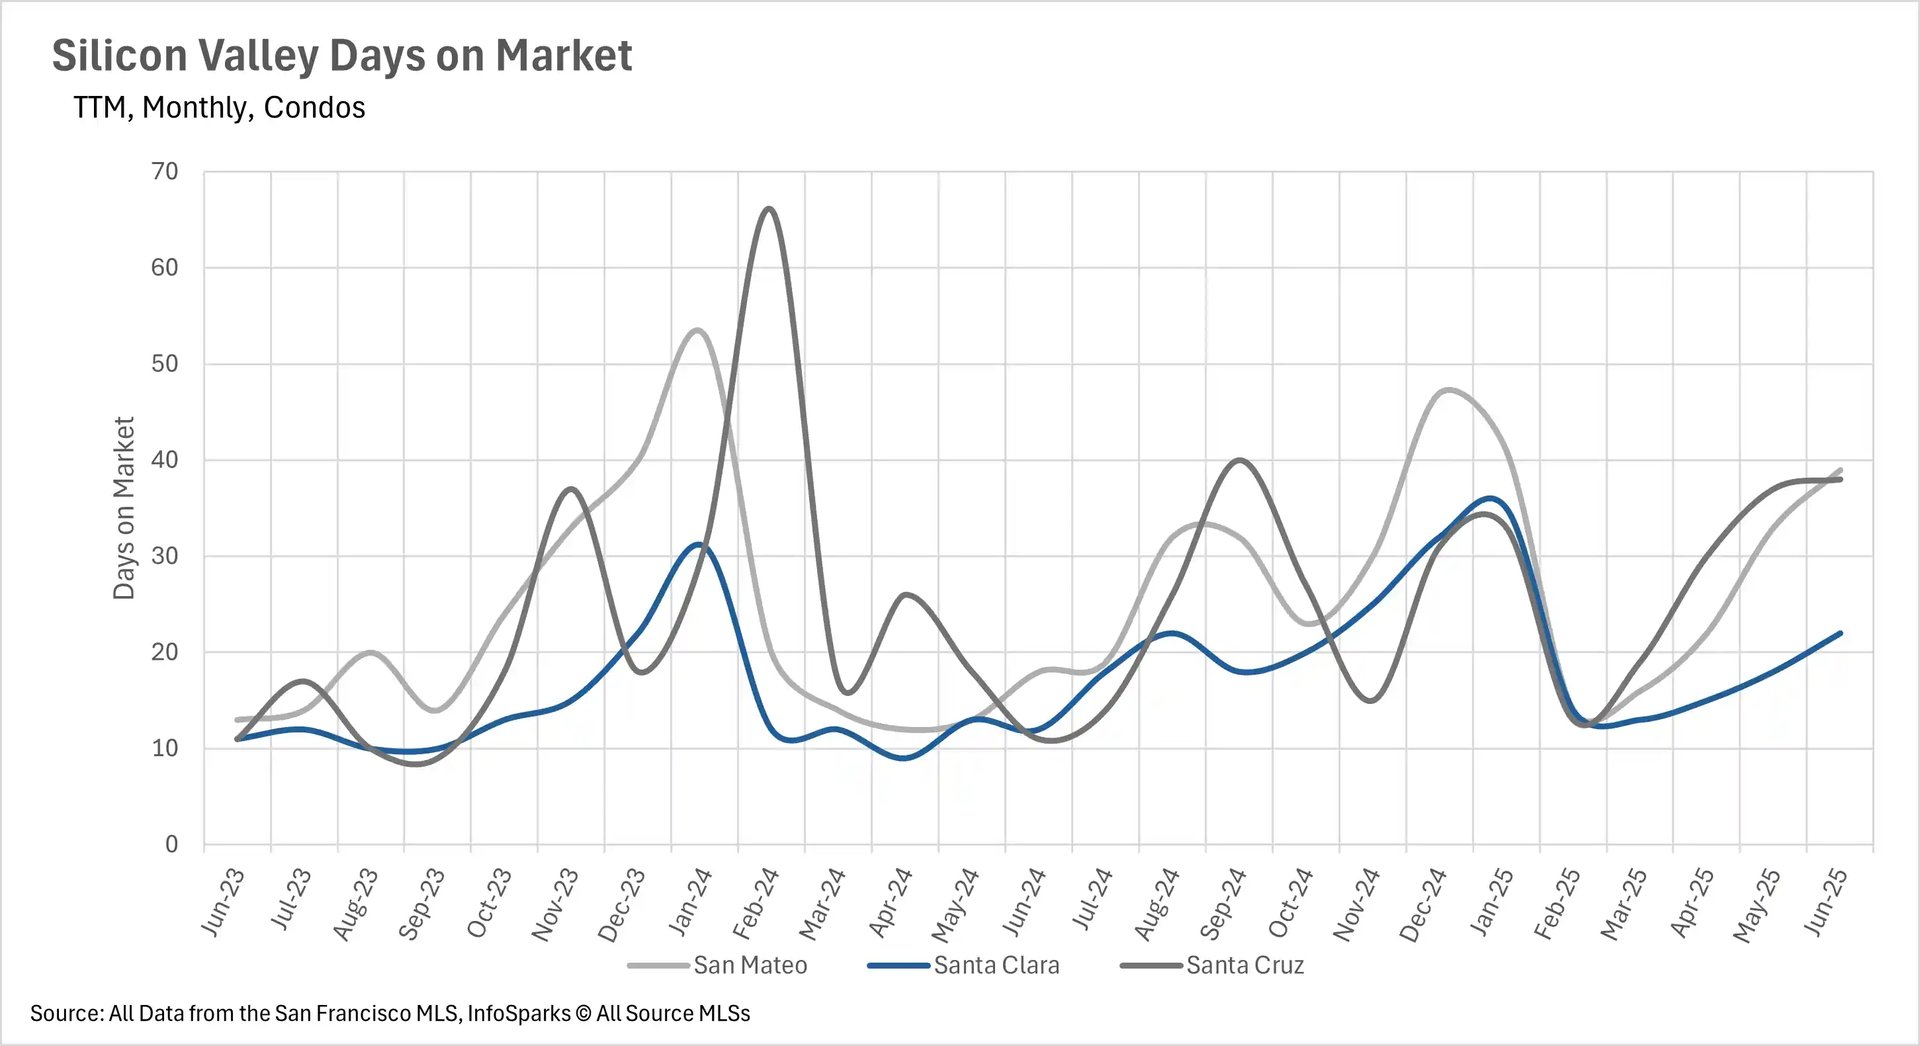
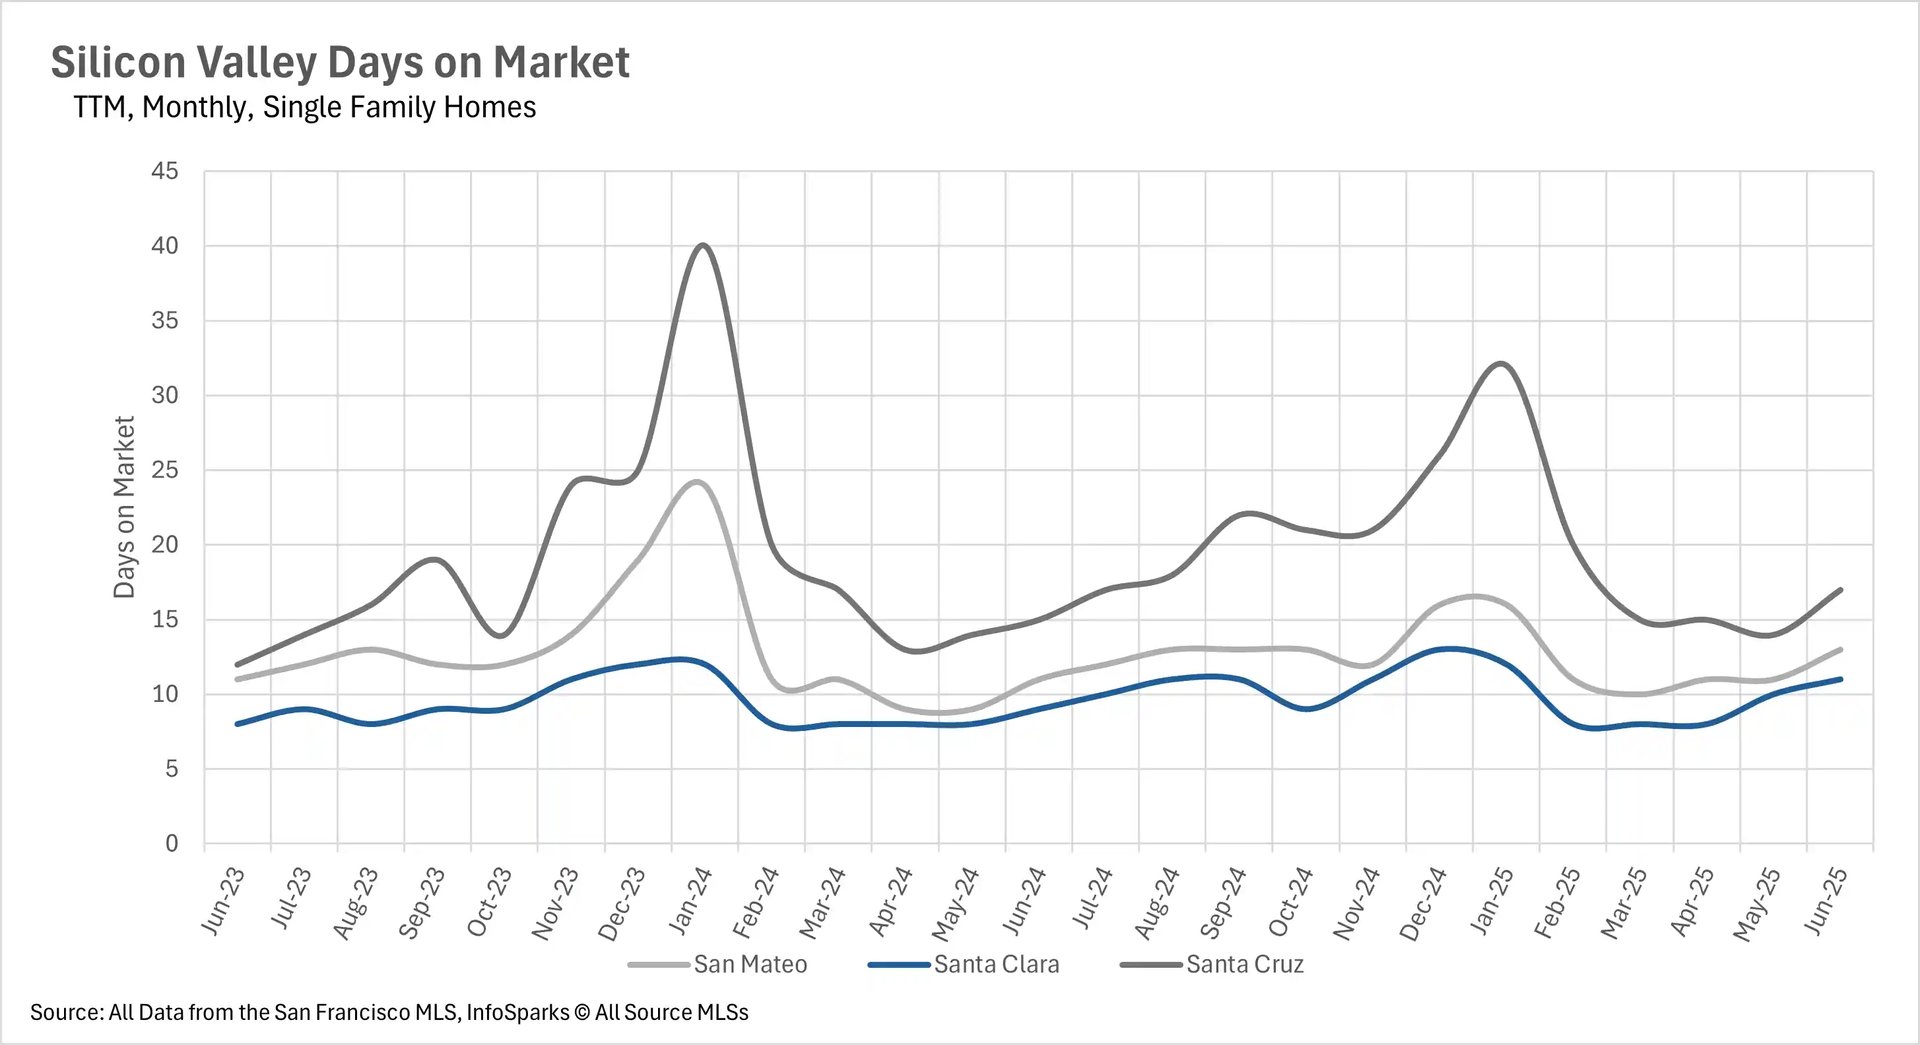
The average condo is spending 245% more time on the market in Santa Cruz County

The single-family home market remains an incredibly competitive market, with average listings in San Mateo, Santa Clara, and Santa Cruz counties being snapped up in 13, 11, and 17 days, respectively. However, condos are spending considerably more time on the market, with the average listing in San Mateo County spending 39 days on the market (a 116.67% increase year-over-year). Additionally, the average listings in Santa Clara and Santa Cruz Counties are spending 22 and 38 days on the market, representing 83.33% and 245.45% year-over-year increases!

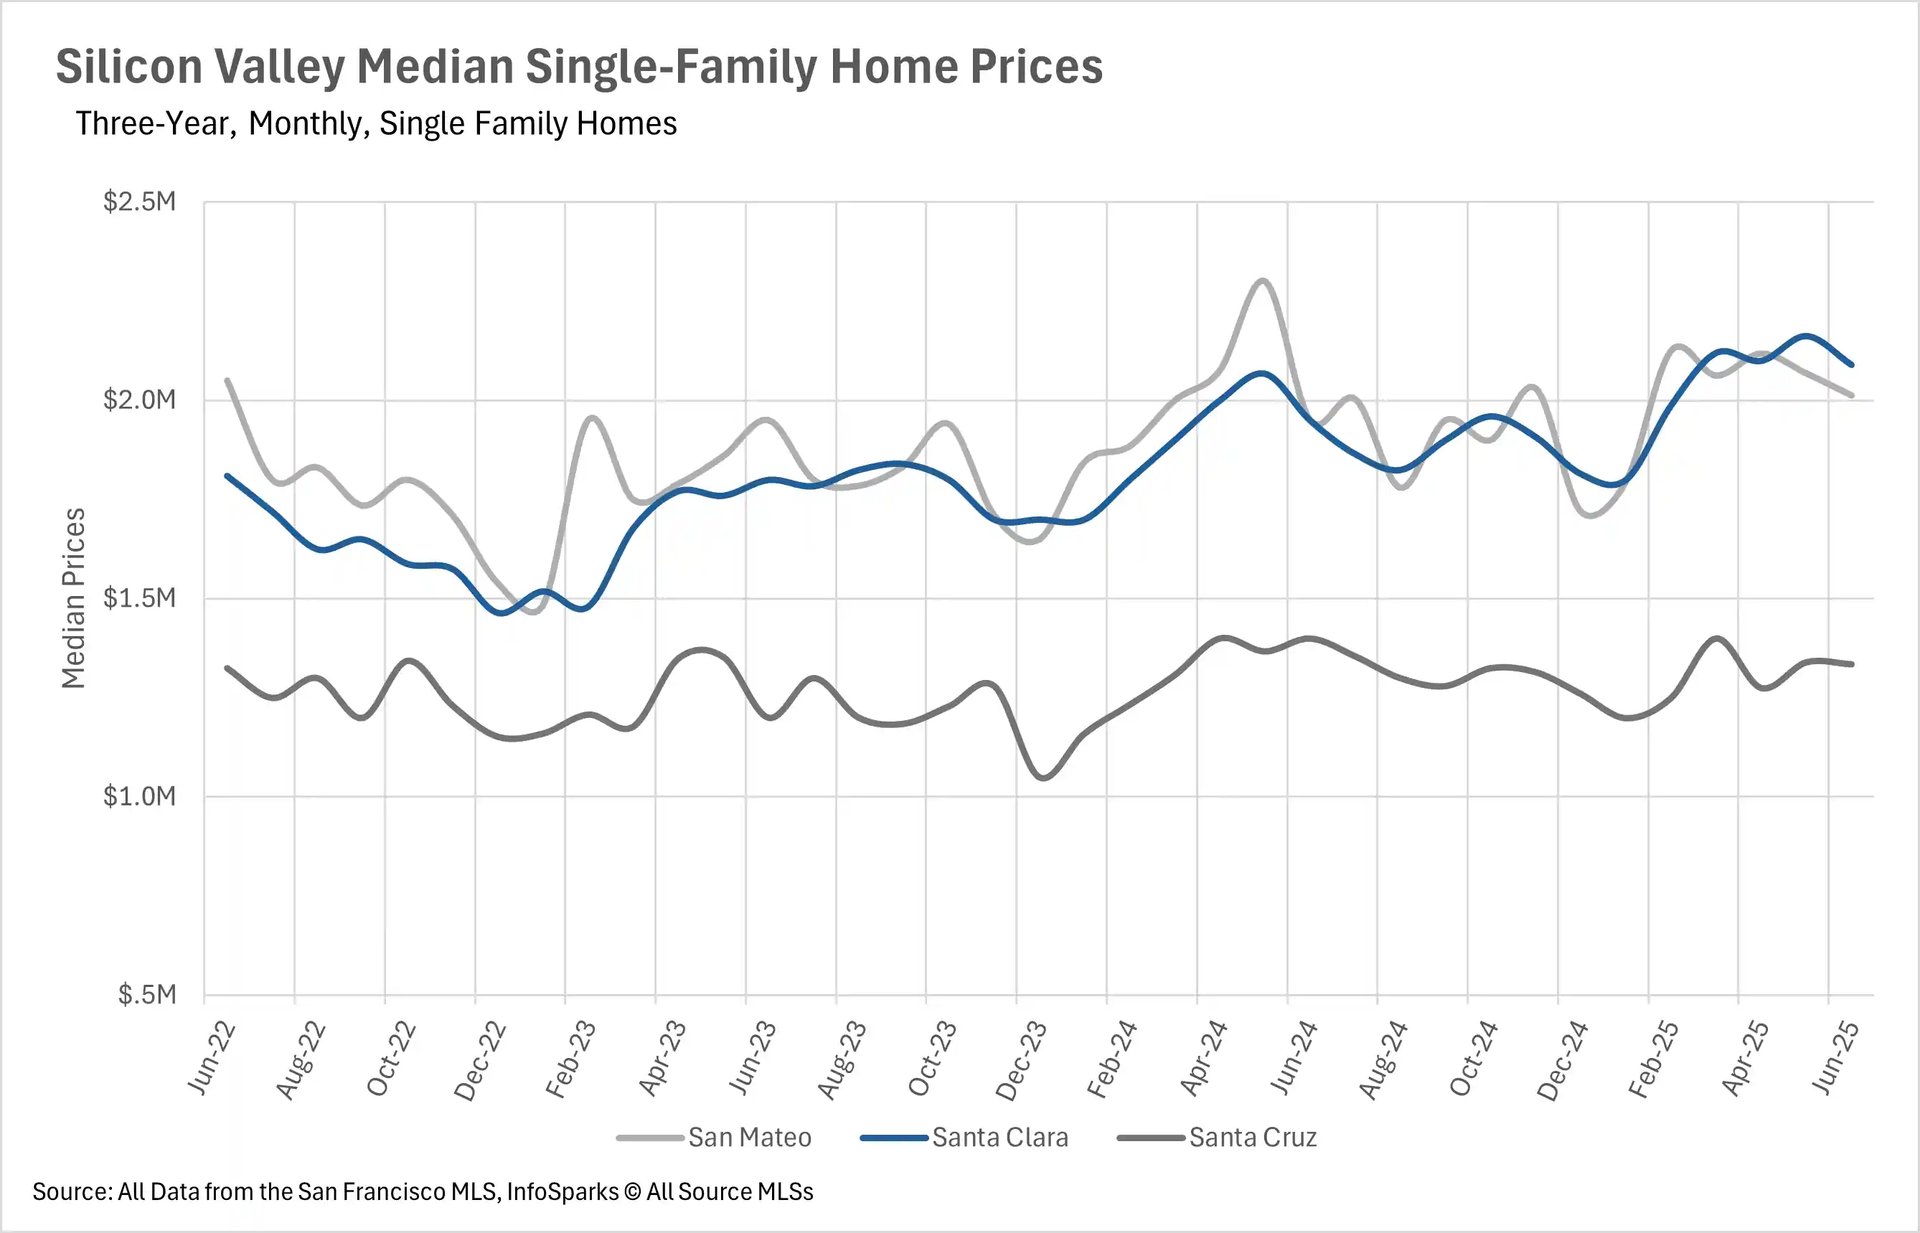
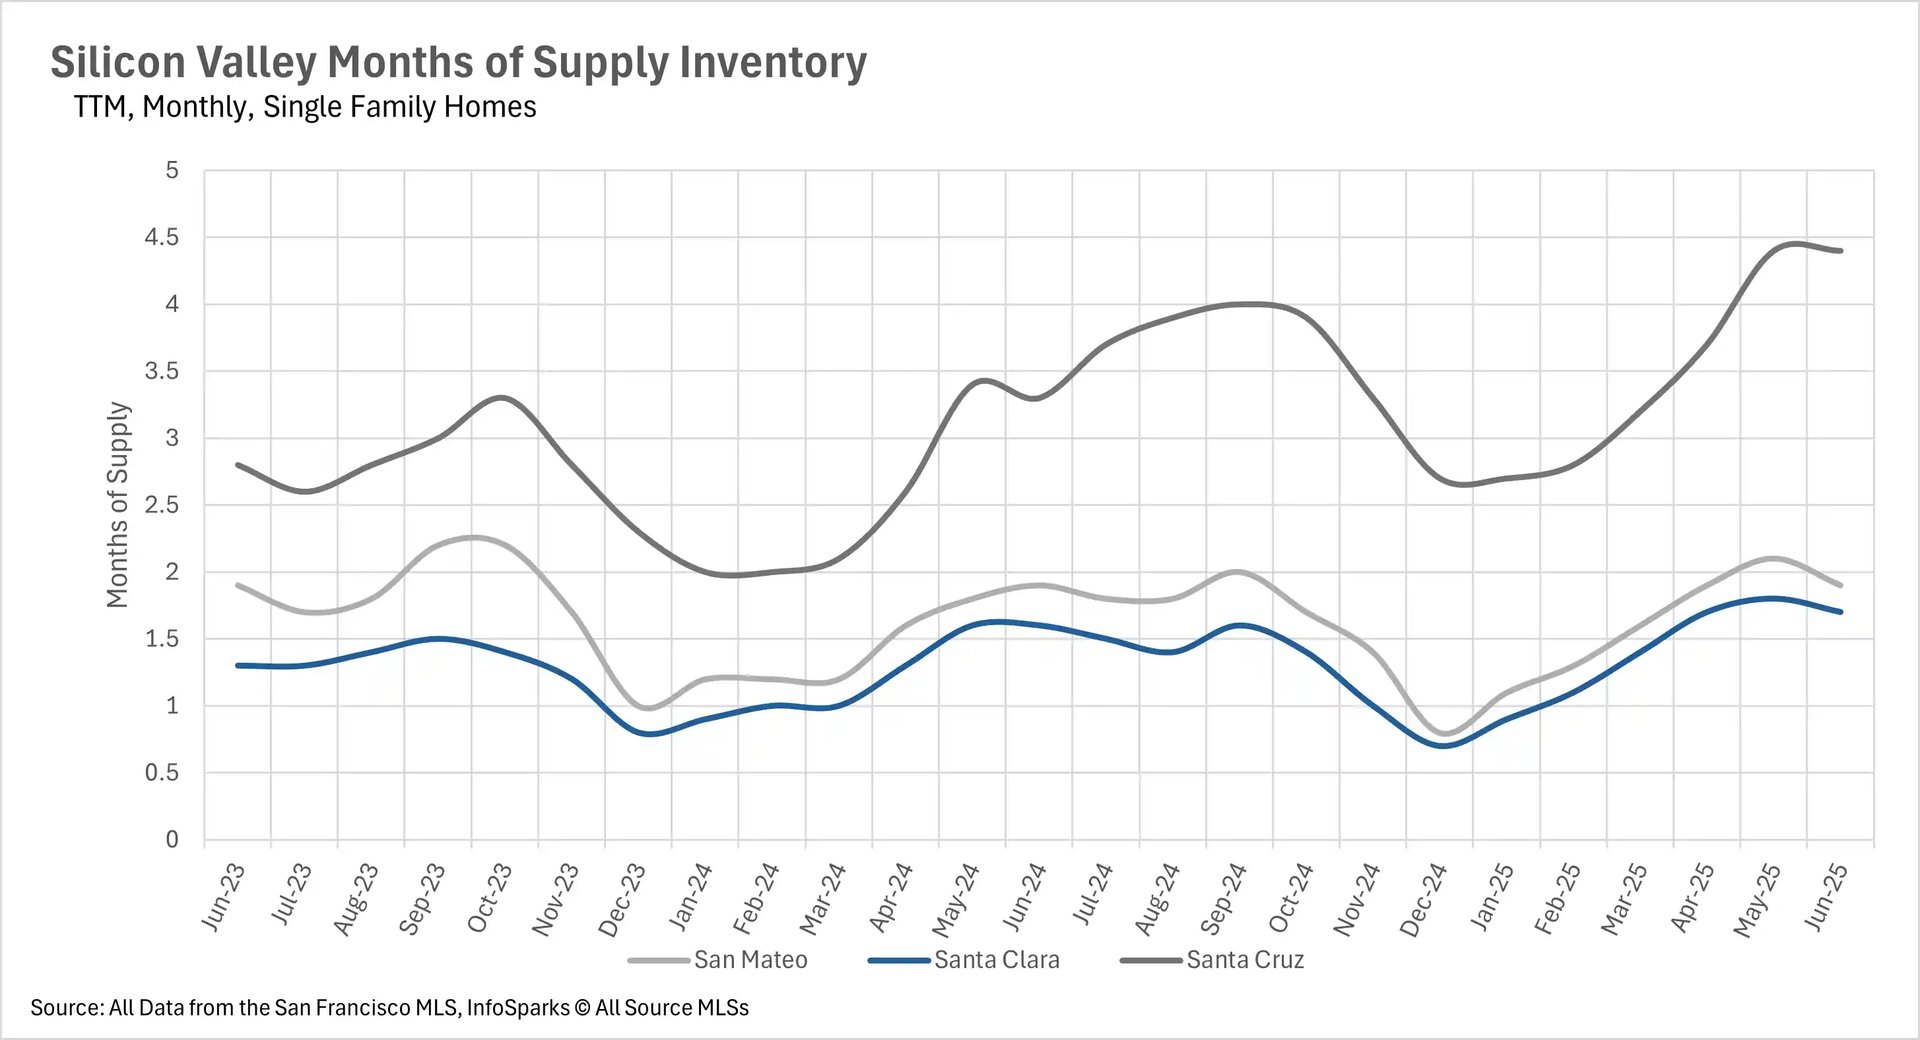
The Silicon Valley single-family home market remains incredibly competitive

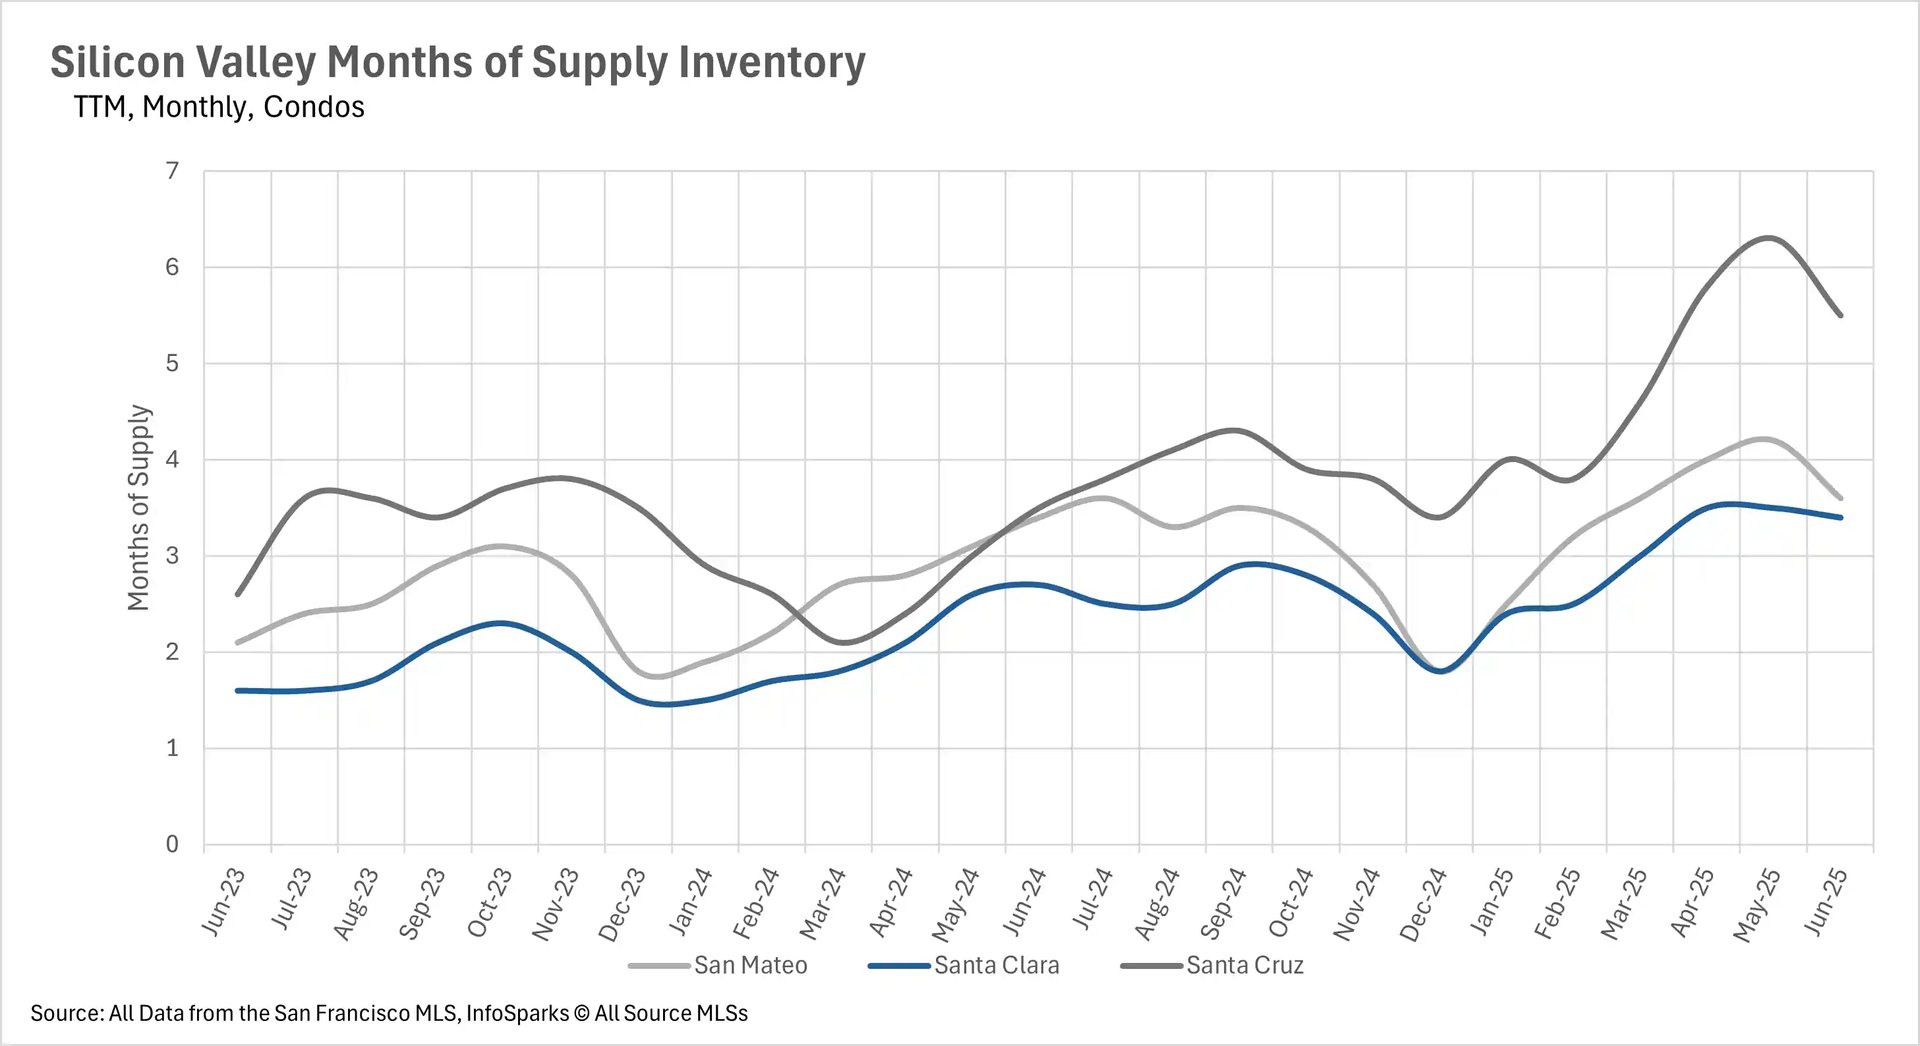
When determining whether a market is a buyers’ market or a sellers’ market, we look to the Months of Supply Inventory (MSI) metric. The state of California has historically averaged around three months of MSI, so any area with at or around three months of MSI is considered a balanced market. Any market that has lower than three months of MSI is considered a seller’s market, whereas markets with more than three months of MSI are considered buyers’ markets.

As you might expect, the single-family home market is pretty competitive, with San Mateo and Santa Clara Counties being sellers’ markets, with just 1.9 months and 1.7 months worth of inventory on the market, respectively. Whereas, Santa Cruz County is a buyer's market, with 4.4 months' worth of inventory on the market. On the other hand, the condo market is entirely a buyers' market, with 3.6 months, 3.4 months, and 5.5 months worth of inventory on the market in San Mateo, Santa Clara, and Santa Cruz Counties, respectively.

Local Lowdown Data

Line graph showing Silicon Valley Days on Market for condos across San Mateo, Santa Clara, and Santa Cruz counties from June 2023 to June 2025. San Mateo exhibits the highest days on market for condos, peaking at over 60 days in early 2024. Santa Clara generally has the lowest, staying below 25 days, while Santa Cruz is in the mid-range.

Line graph showing Silicon Valley Days on Market for single-family homes across San Mateo, Santa Clara, and Santa Cruz counties from June 2023 to June 2025. Santa Cruz consistently has the highest days on market, peaking over 40 days in early 2024 and over 30 days in early 2025. Santa Clara generally has the lowest days on market, staying below 15 days for most of the period. San Mateo is in between.

Bar and line chart depicting Silicon Valley Inventory for Condos over two years, monthly, from June 2023 to June 2025. Blue bars represent new listings, light blue bars represent sold listings, and the purple line indicates for-sale inventory. For-sale inventory peaked around 900 units in April-May 2025, while new and sold listings show monthly fluctuations, generally increasing from late 2024.

Bar and line chart showing Silicon Valley Inventory for Single-Family Homes over two years, monthly, from June 2023 to June 2025. Dark blue bars represent new listings, light blue bars represent sold listings, and the pink line indicates for-sale inventory. For-sale inventory generally trends upwards from late 2024, peaking around 2,250 units in May 2025. New and sold listings fluctuate monthly.

Bar chart illustrating Silicon Valley Median Price Changes year-over-year for condos in San Mateo, Santa Clara, and Santa Cruz from July 2024 to June 2025. Santa Cruz shows significant negative price changes, especially from December 2024 to June 2025 (ranging from -5% to -20%). San Mateo also experiences negative changes in latter months. Santa Clara shows more mixed results, with some positive changes in late 2024 and early 2025.

Line graph displaying Silicon Valley Median Condo Prices across San Mateo, Santa Clara, and Santa Cruz counties from June 2022 to June 2025. Prices for all three counties generally fluctuate between $600,000 and $900,000. Santa Clara prices are often at the higher end of this range, while Santa Cruz tends to be at the lower end.

Bar chart displaying Silicon Valley Median Price Changes year-over-year for single-family homes in San Mateo, Santa Clara, and Santa Cruz from July 2024 to June 2025. Santa Clara shows positive price changes for most of the period, notably in November and December 2024 (around 12-20%). San Mateo and Santa Cruz show more volatility, with significant negative changes in April and May 2025.

Line graph displaying Silicon Valley Median Single-Family Home Prices across San Mateo, Santa Clara, and Santa Cruz counties from June 2022 to June 2025. Santa Clara and San Mateo prices largely track each other, mostly between $1.7 million and $2.2 million, with Santa Clara slightly higher in mid-2025. Santa Cruz prices are consistently lower, generally between $1.0 million and $1.4 million.

Line graph illustrating Silicon Valley Months of Supply Inventory for condos across San Mateo, Santa Clara, and Santa Cruz counties from June 2023 to June 2025. Santa Cruz consistently has the highest months of supply, reaching over 6 months in May 2025. Santa Clara generally has the lowest, staying below 4 months, while San Mateo is in the middle.

Line graph showing Silicon Valley Months of Supply Inventory for single-family homes across San Mateo, Santa Clara, and Santa Cruz counties from June 2023 to June 2025. Santa Cruz consistently shows the highest months of supply, rising to over 4.5 by June 2025. San Mateo and Santa Clara generally track lower, with Santa Clara consistently the lowest, around 1.5 to 2.0 months by June 2025.

Let’s Talk

You’ve got questions and we can’t wait to answer them.

Follow Us on Instagram