Select a Market Report to Read:
- National Market Update Overview
- Bay Area Report
- North Bay Report
- East Bay Report
- Silicon Valley Report
- San Francisco Report
Welcome to the latest San Francisco Real Estate Market Report from Kinoko Real Estate! As your trusted local Real Estate experts in San Francisco, we're committed to providing you with the most accurate and insightful data to guide your home buying or selling journey in this dynamic city.
Quick Take
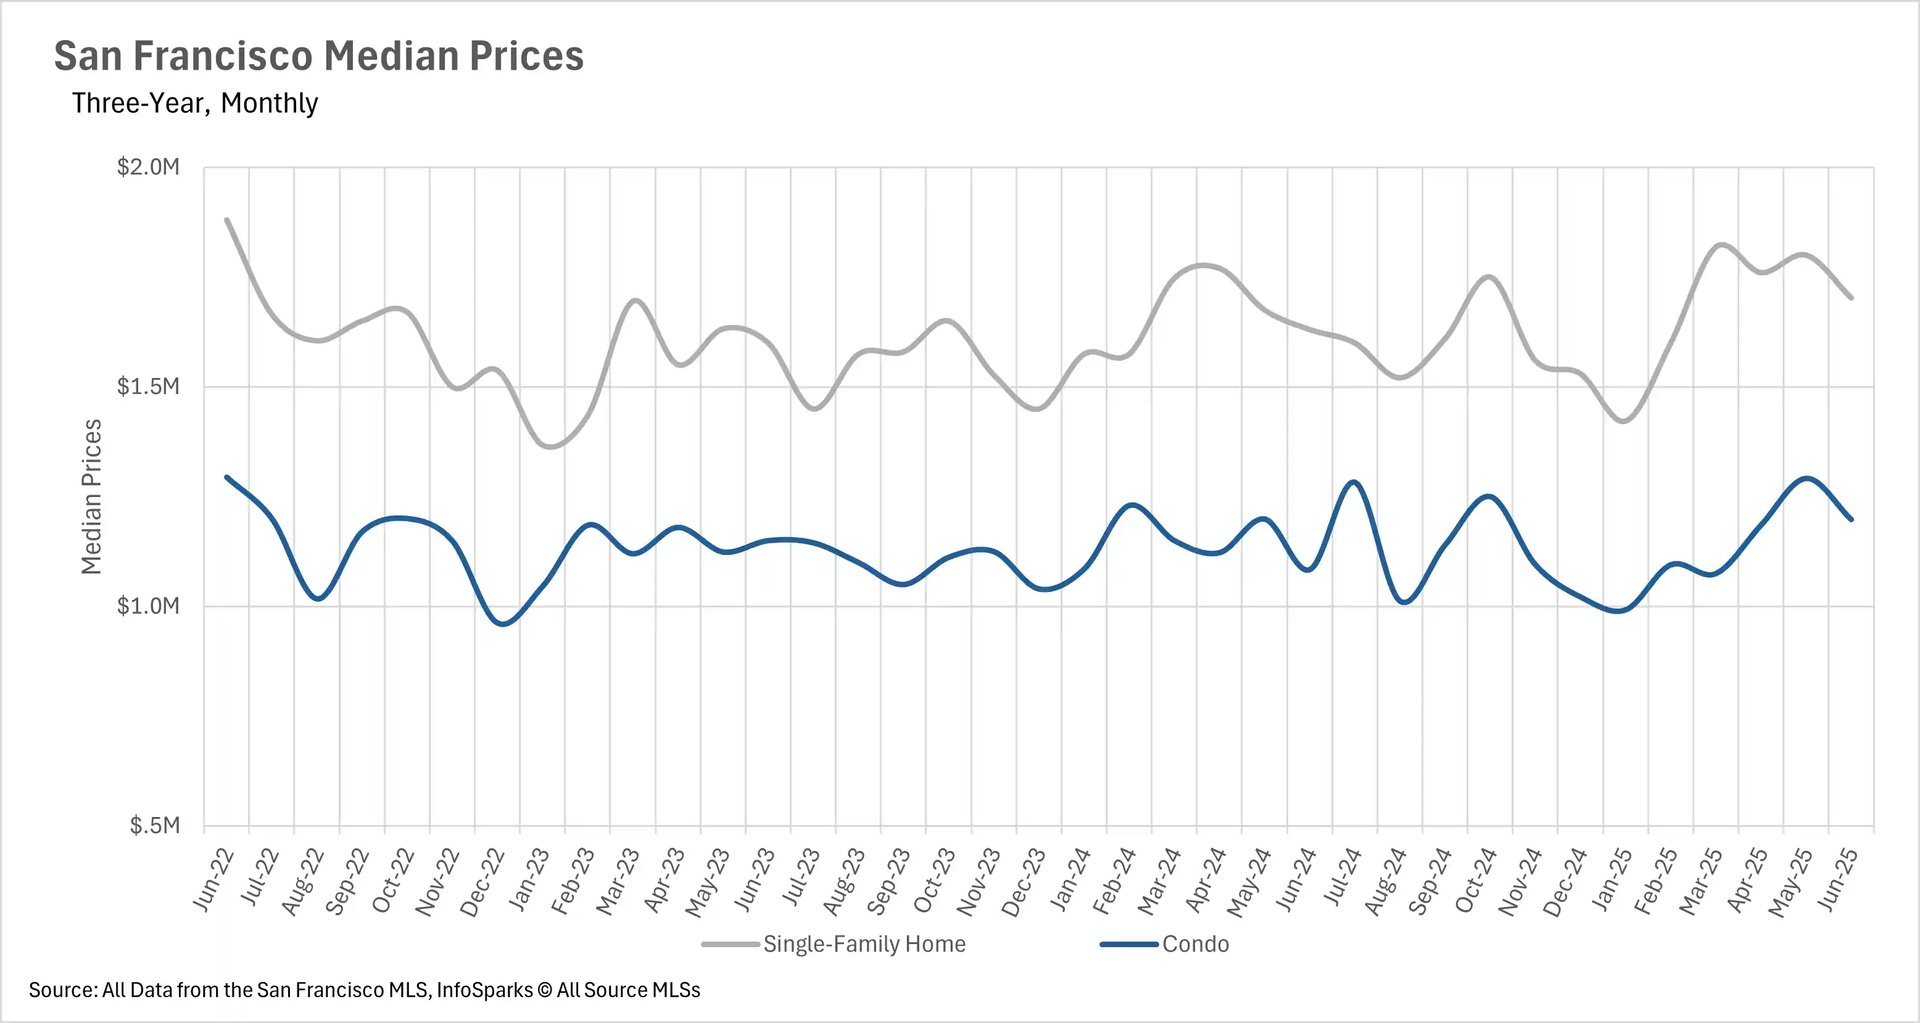
- San Francisco home prices continued their upward trajectory throughout June, with median sale prices increasing across the city
- Housing inventory shortage remains a critical challenge in San Francisco, with available listings continuing to decline
- Competitive market conditions persist as properties are purchased rapidly due to limited supply constraints
Note: You can find the charts/graphs for the Local Lowdown at the end of this section.
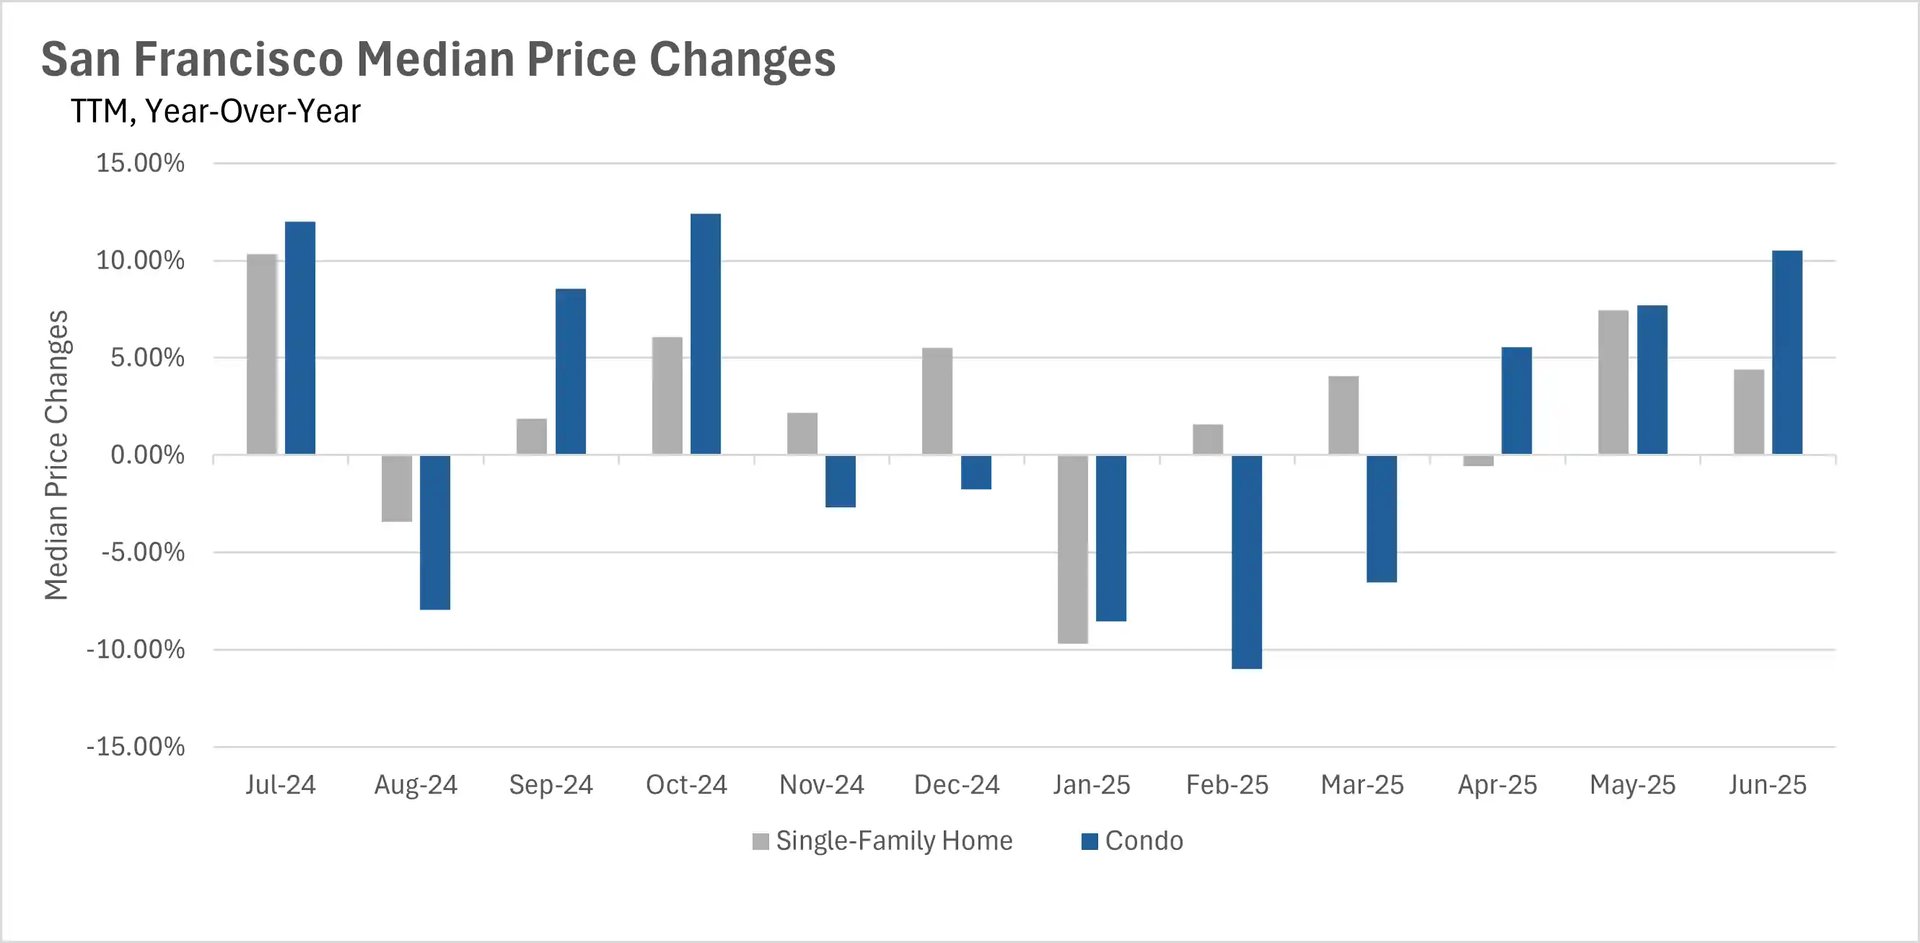
San Francisco Condo Values Surge Over 10% Year-Over-Year
San Francisco real estate market activity showed strong momentum in June, with condo values increasing by more than 10% over the past year. This significant appreciation reflects the ongoing demand pressures in the San Francisco housing market.
San Francisco home prices have maintained their upward trajectory over recent months, with June continuing this trend. Single-family home median sale prices rose by 4.42% on a year-over-year basis, while San Francisco condo median sale prices experienced even stronger growth at 10.52% year-over-year.
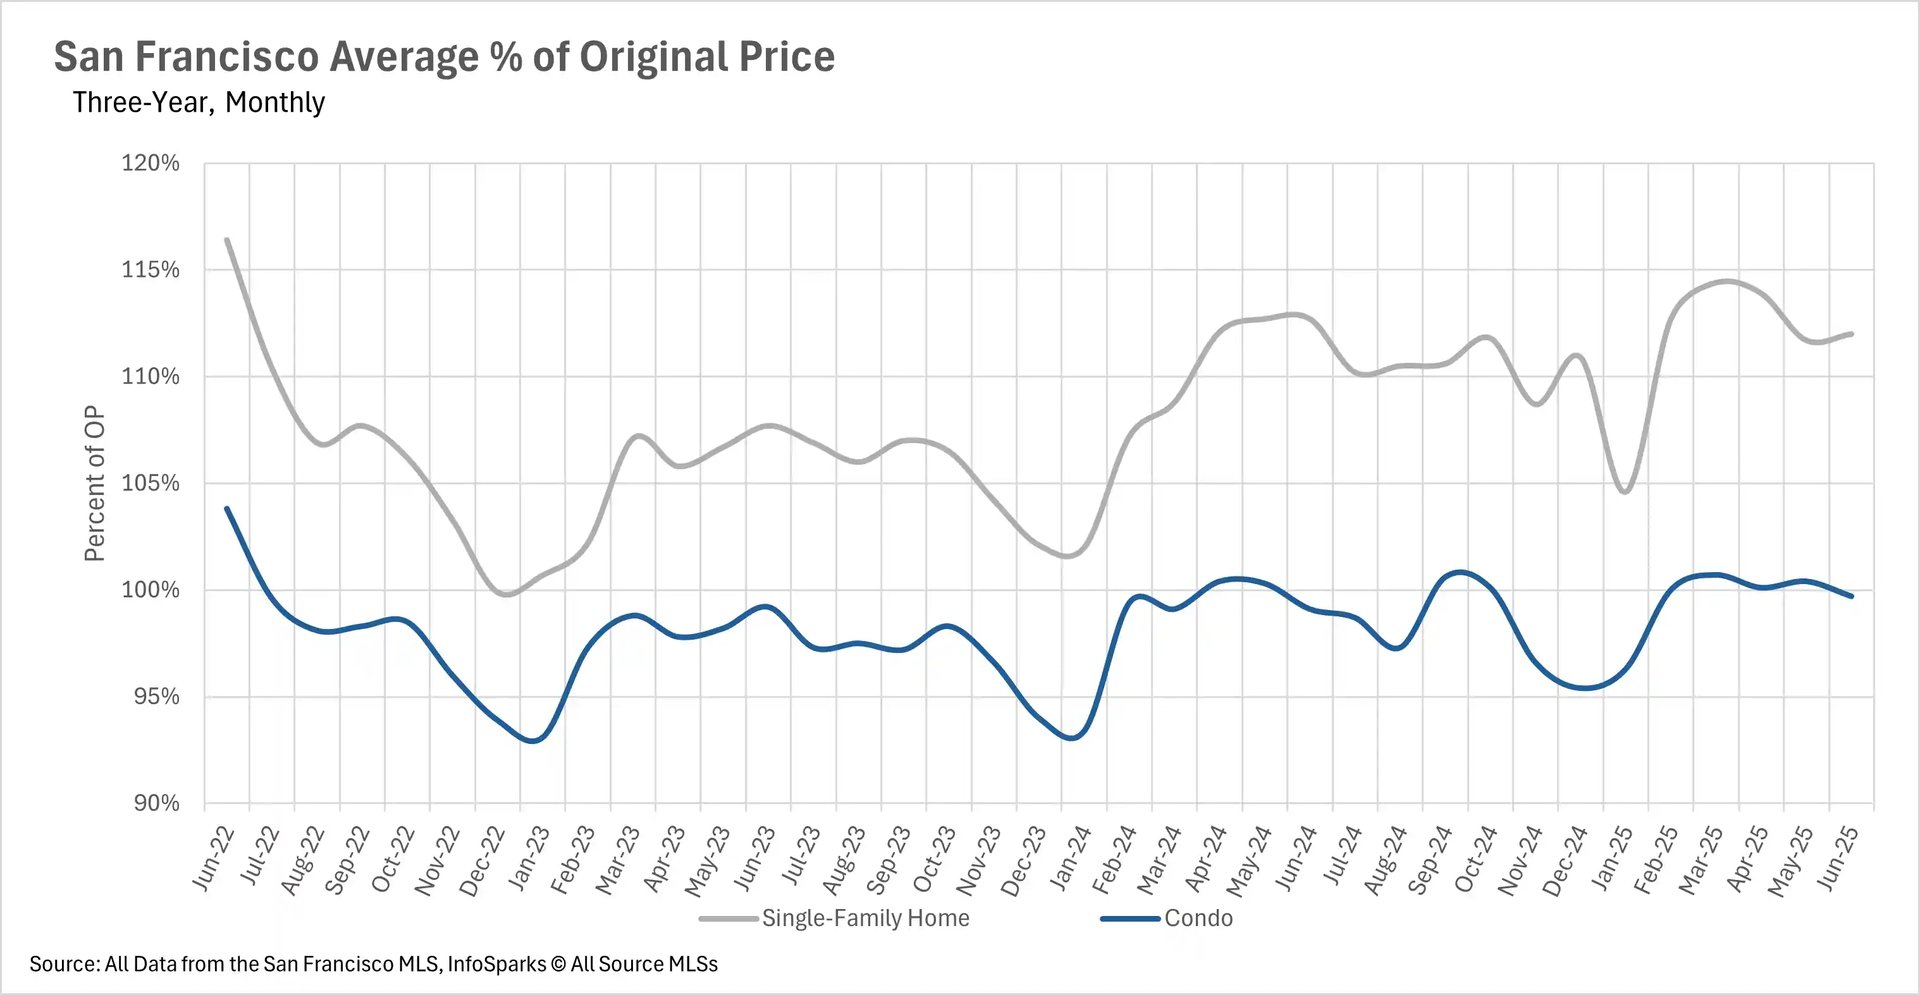
Market dynamics reveal that the average single-family home sells for 112% of the original listing price, demonstrating intense buyer competition. Meanwhile, the average San Francisco condo sells for 99.7% of the original listing price, offering slightly more negotiating room for buyers.
If you're considering entering this market, explore how to list your home with us to take advantage of current trends.
Inventories continue to dwindle, as homeowners are reluctant to sell their properties
The San Francisco housing shortage has been the primary driver behind the price increases observed throughout the market. Inventory levels continue to contract as homeowners remain hesitant to list their properties in the current environment.
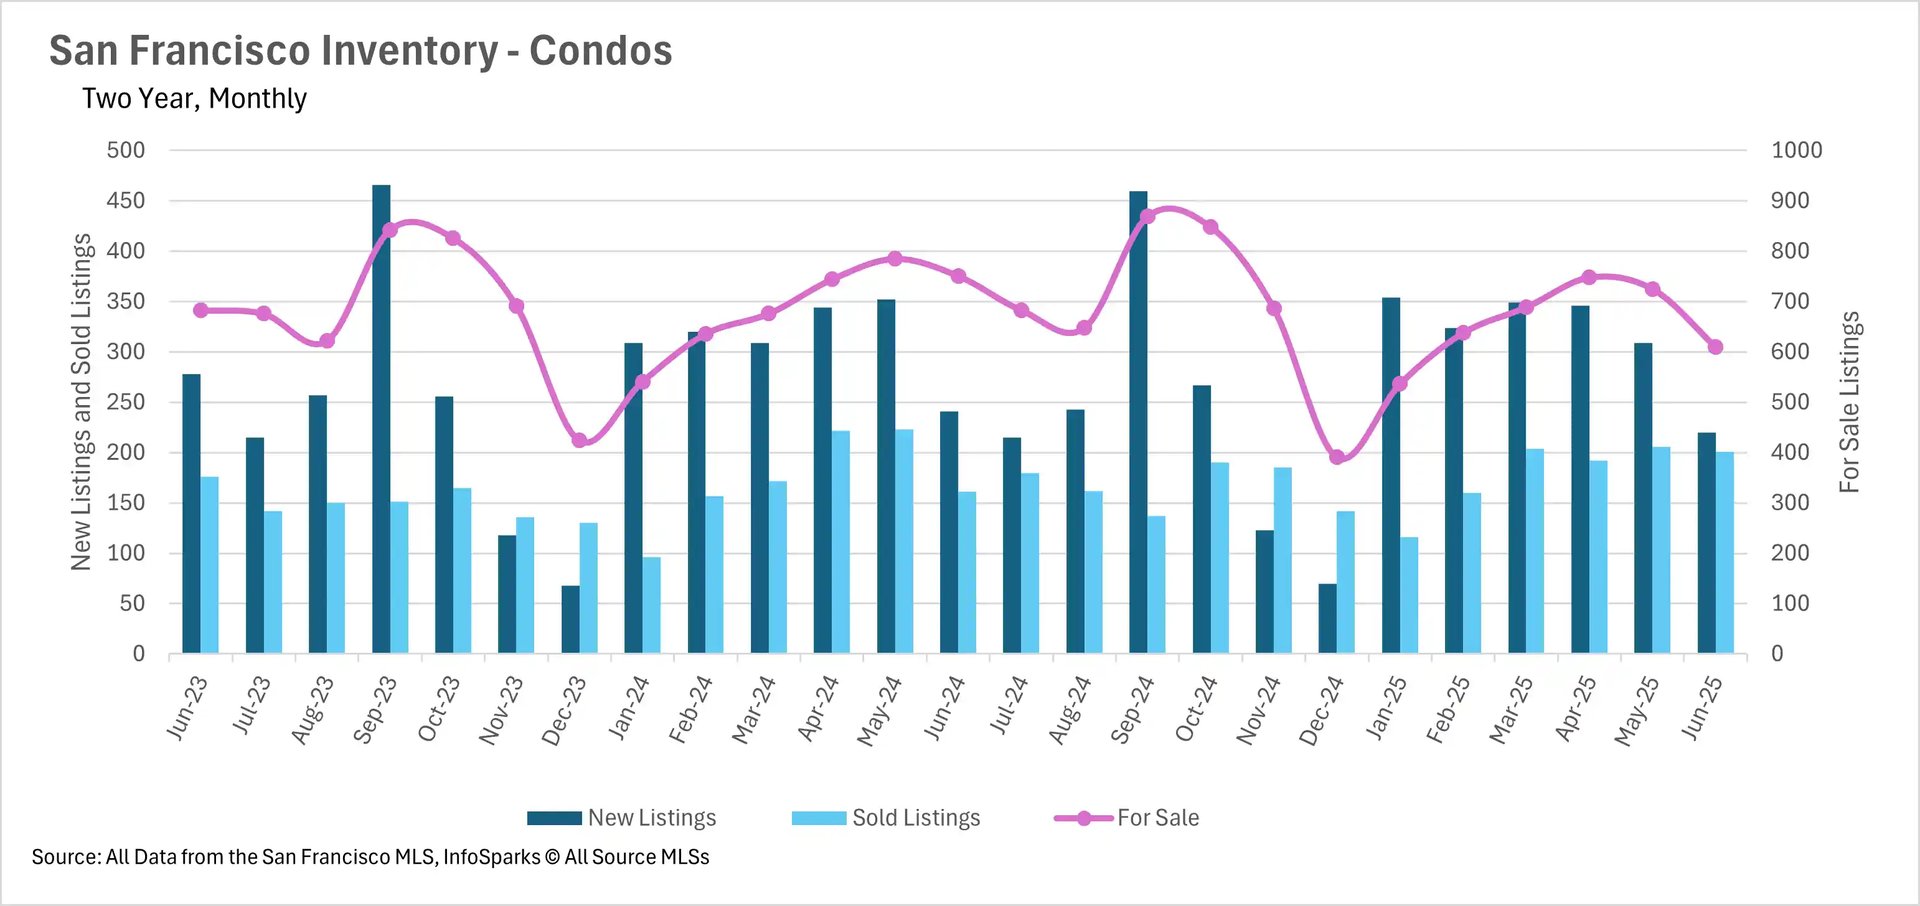
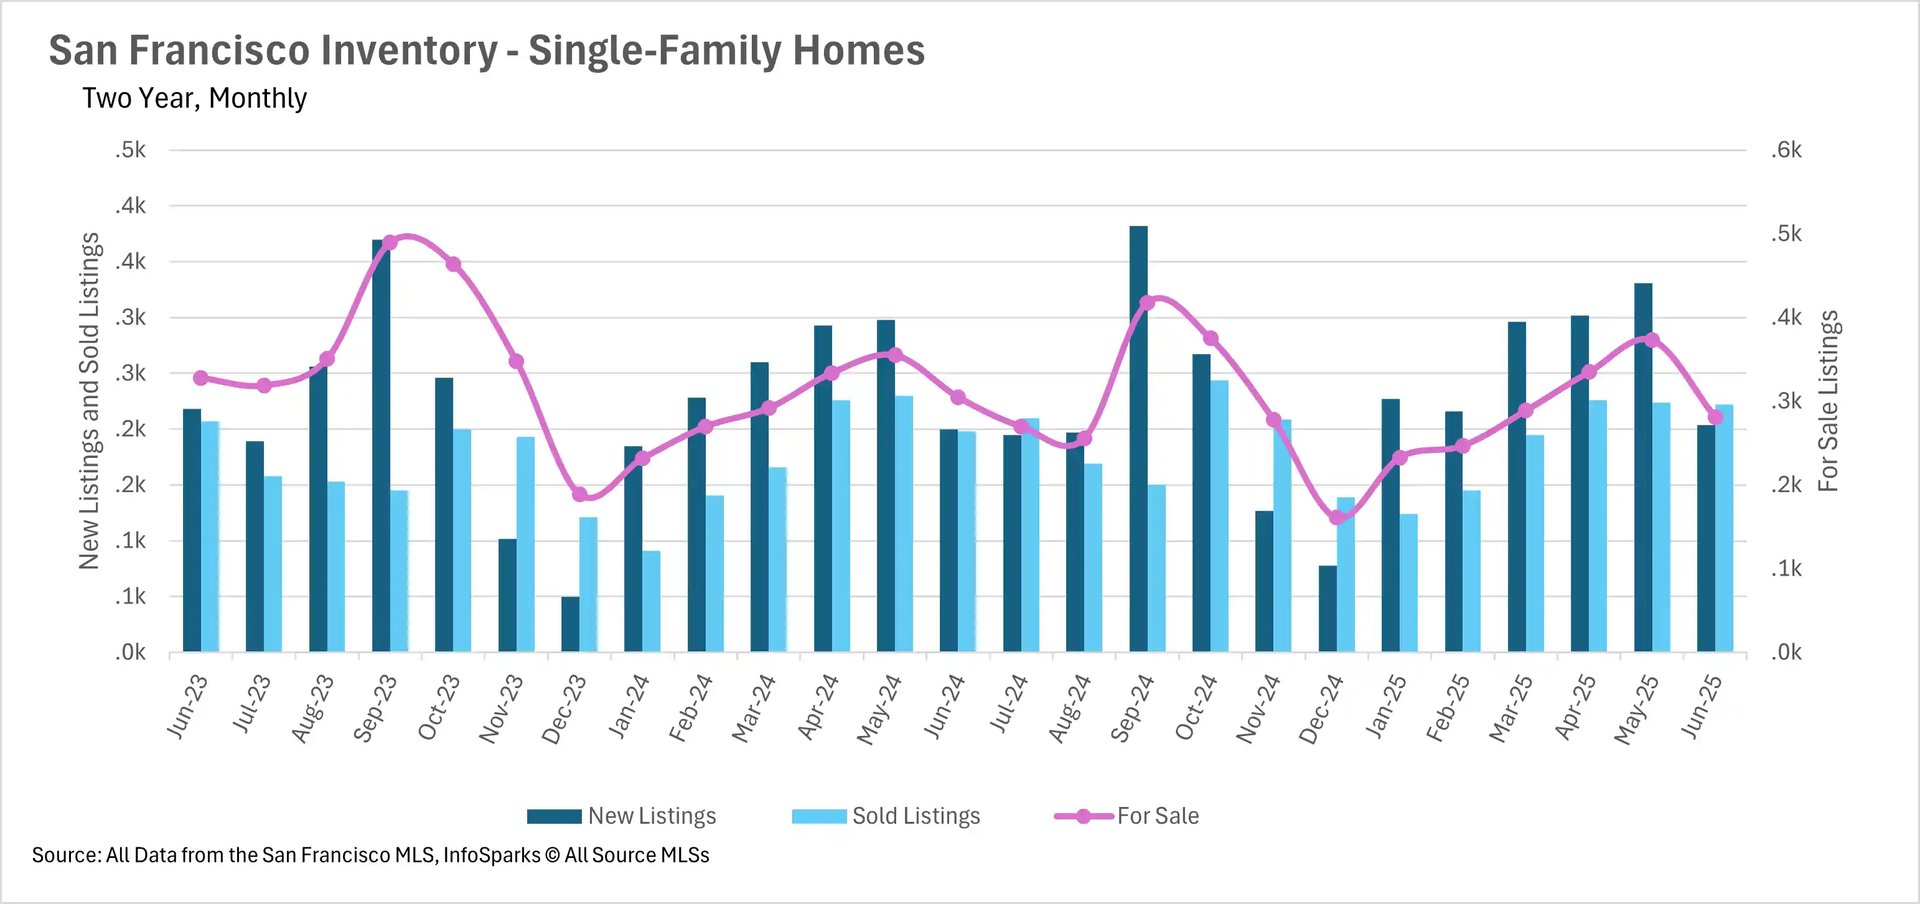
Housing inventory data for June reveals significant supply constraints across property types:
- Single-family homes: 7.87% fewer properties on the market compared to the same period last year
- San Francisco condos: 18.77% fewer listings available at the end of June versus the previous year
This limited housing supply creates a challenging environment for buyers while presenting opportunities for sellers considering entering the market.
San Francisco remains one of the few markets where we’re seeing listings spend less time on the market
San Francisco real estate remains one of the few markets nationally where properties spend less time on the market, reflecting the intense buyer demand and supply constraints affecting the region.
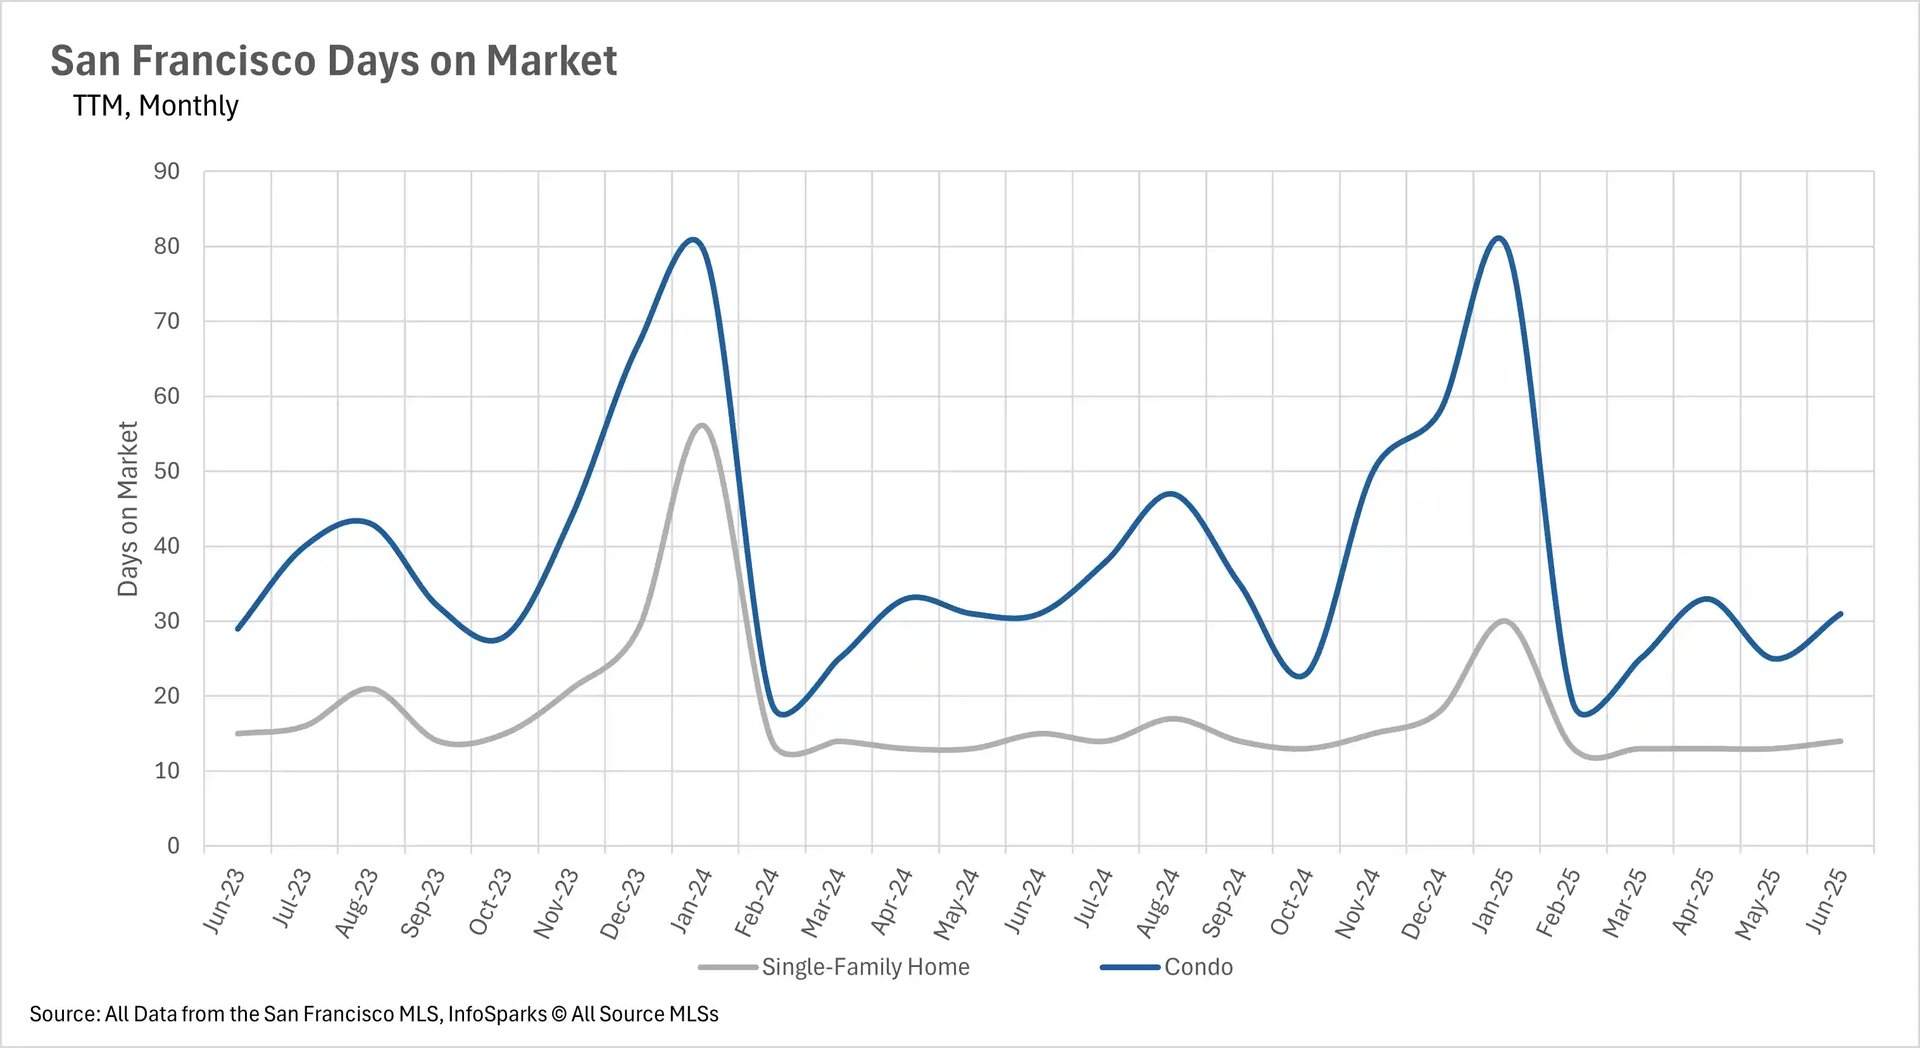
Days on market statistics for June demonstrate the competitive nature of San Francisco real estate:
- Single-family homes: Average of just 14 days on market
- San Francisco condos: Average of 31 days on market
These figures represent a 6.67% year-over-year decrease in market time for single-family homes, while the condo market showed no change in average days on market compared to the previous year.
For insights into different neighborhoods and what to expect when shopping for a home, check out our San Francisco Neighborhood Guide.
Market Conditions Favor Sellers, Especially in Single-Family Segment
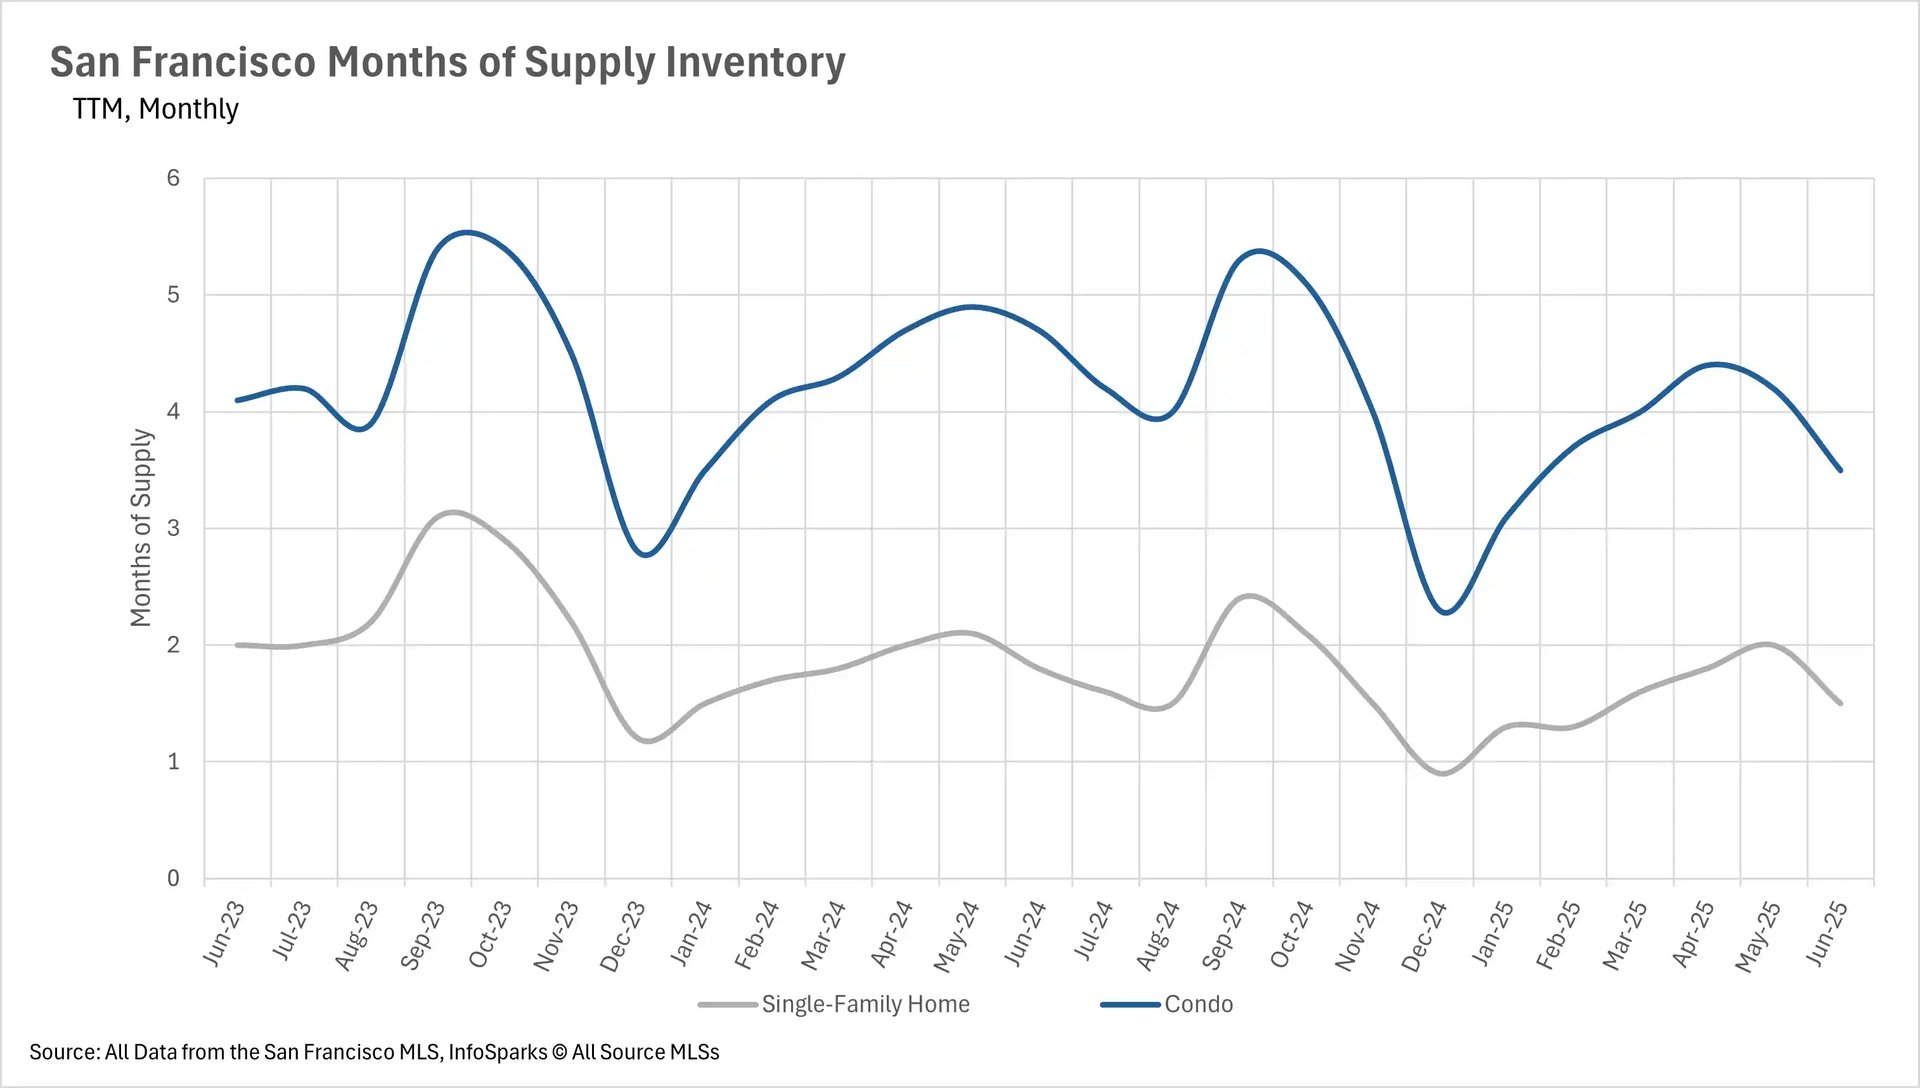
San Francisco real estate market analysis reveals distinct conditions based on property type. Real estate professionals use the Months of Supply Inventory (MSI) metric to determine whether market conditions favor buyers or sellers.
California has historically averaged around three months of MSI, making this the benchmark for balanced market conditions. Markets below three months of MSI are considered seller's markets, while those above three months provide buyer advantages.
Single-Family Home Market: Strong Seller Conditions
The single-family home market in San Francisco has maintained seller-dominated conditions, continuing this trend through June with just 1.5 months of inventory available. This represents a continuation of the seller-favorable environment that has characterized this market segment for an extended period.
Condo Market: Shifting Toward Balanced Conditions
San Francisco condo buyers retain some negotiating leverage, though this advantage continues to diminish as inventory levels decline. The condo market currently maintains 3.5 months of supply, still providing buyer opportunities but trending toward more balanced conditions.
Market Outlook for San Francisco Real Estate
The current San Francisco real estate trends indicate continued strength driven by persistent supply constraints and ongoing buyer demand. The combination of limited inventory and competitive market conditions suggests these dynamics will continue to influence pricing and market velocity in the coming months.
Both single-family homes and condos in San Francisco face supply challenges, though the degree of impact varies by property type and price segment.
About This Report: This San Francisco real estate market analysis is prepared by Kinoko Real Estate using current MLS data and market statistics. All figures and statistics are accurate as of the reporting period and reflect actual market conditions in San Francisco.