Elegant Home in Palo Alto California

Bay Area Real Estate Market Report - July 2025

Select a Market Report to Read:

Quick Take

  • The Bay Area real estate market in June shows a clear bifurcation between San Francisco's surging prices and widespread declines in other regions' condo markets.
  • Inventory levels have reached local peaks across most regions and are beginning to decline, with the sharpest drawdowns occurring in the North Bay and San Francisco.
  • Despite inventory reductions, listings are spending significantly more time on the market throughout the Bay Area, with condos experiencing particularly dramatic increases in market time.
  • The market continues to strongly favor single-family homes over condos, with the condo market presenting substantial opportunities for buyers across all regions.

Note: You can find the charts/graphs for the Local Lowdown at the end of this section.

San Francisco leads price appreciation while condo markets struggle regionwide

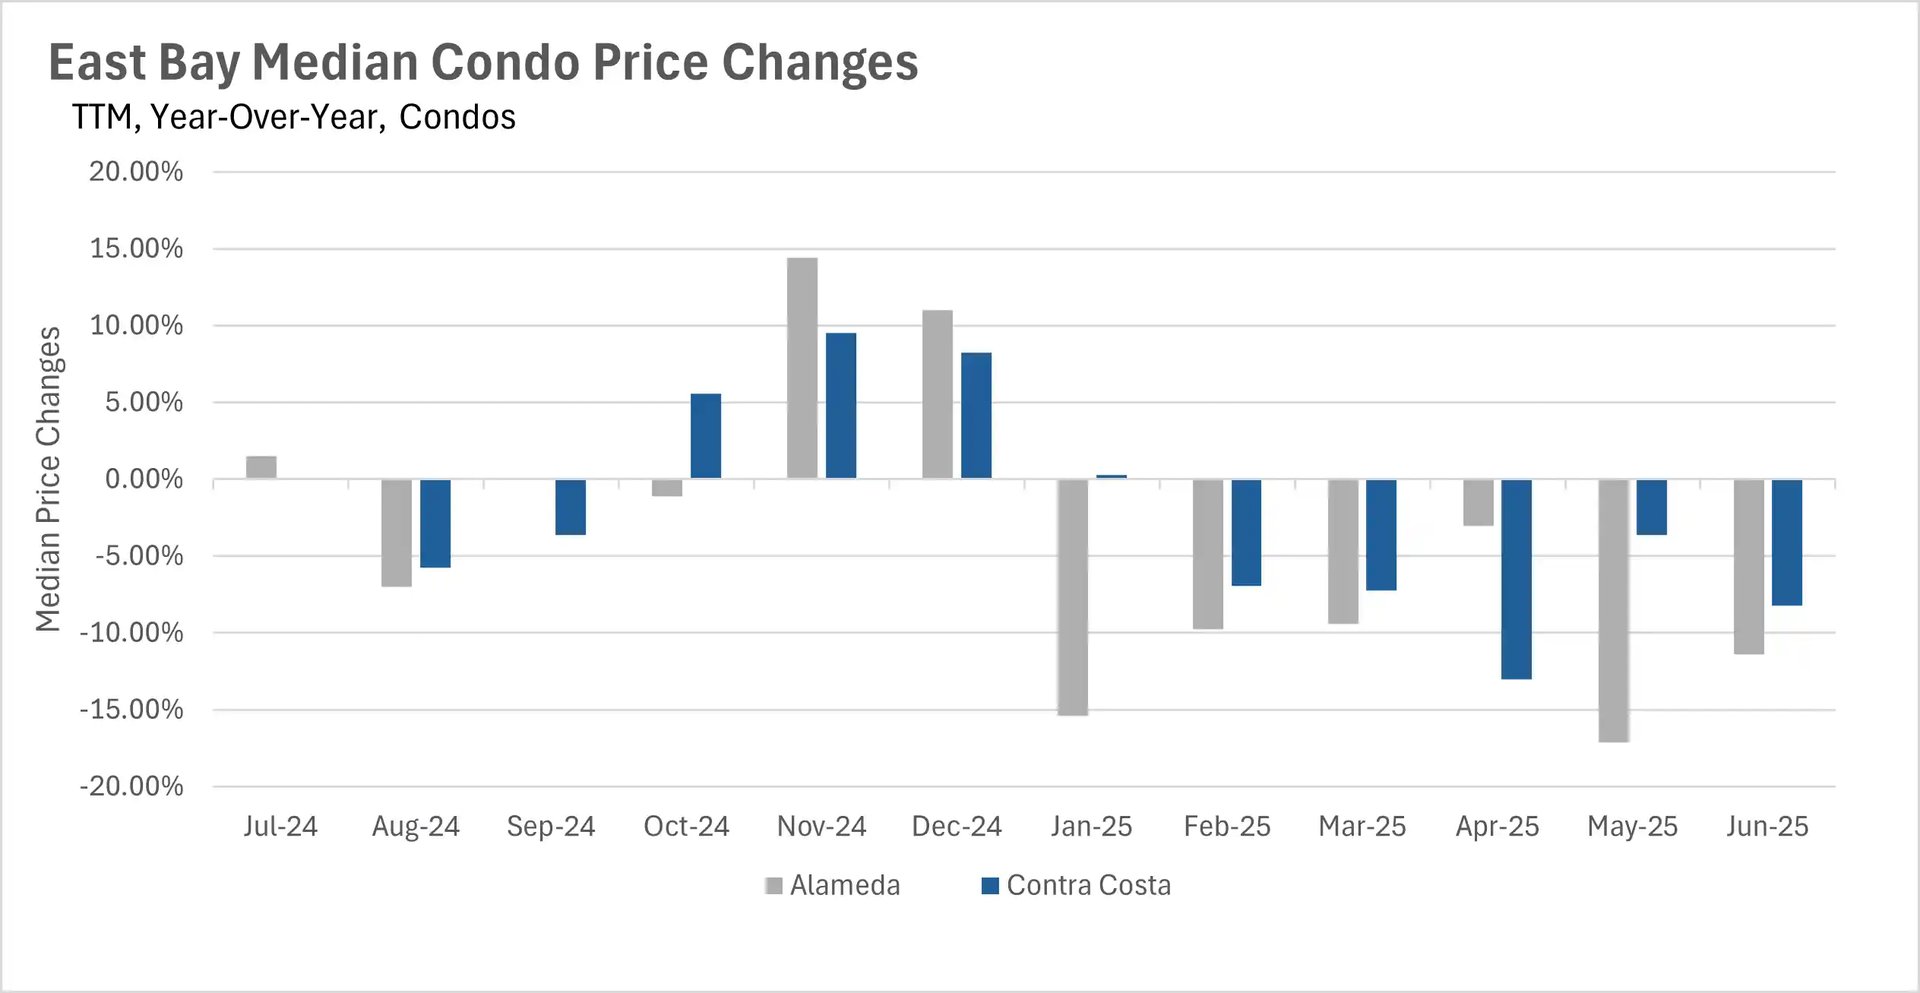
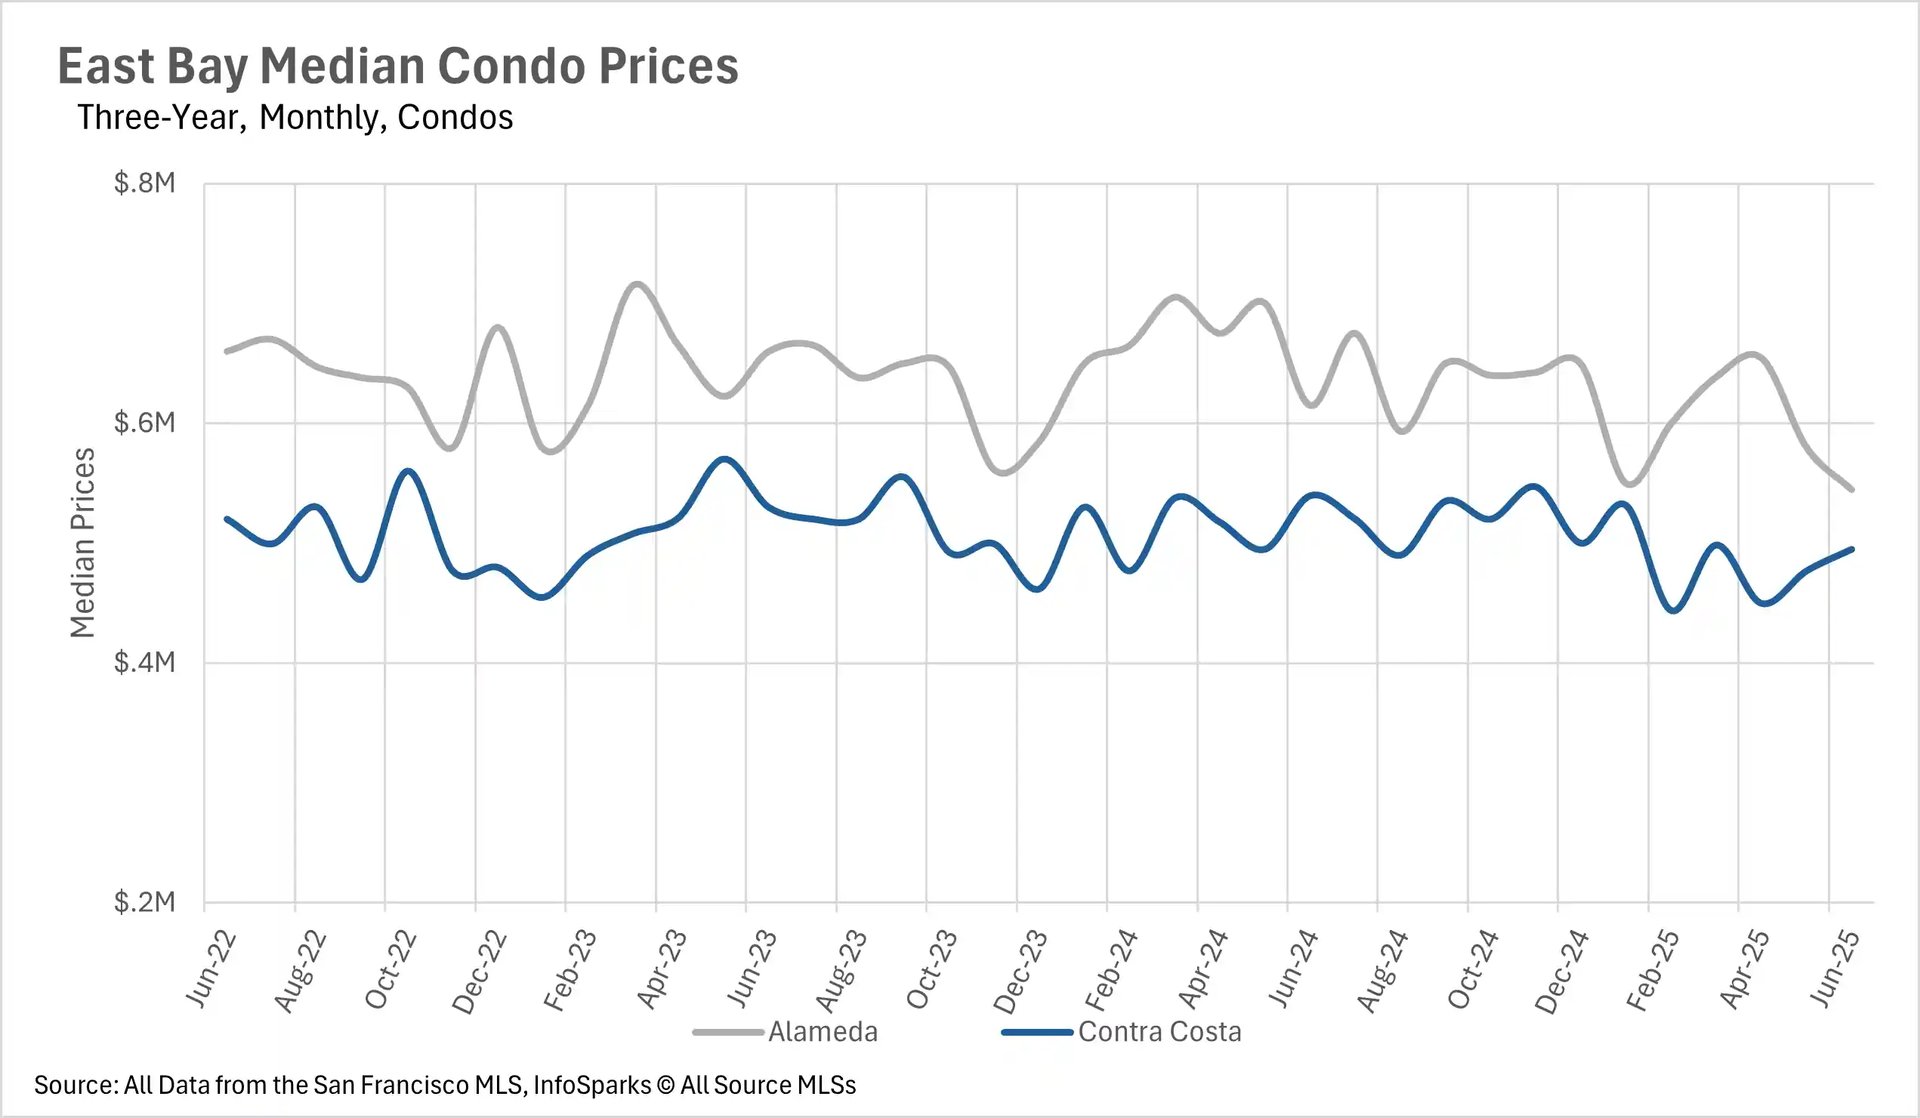
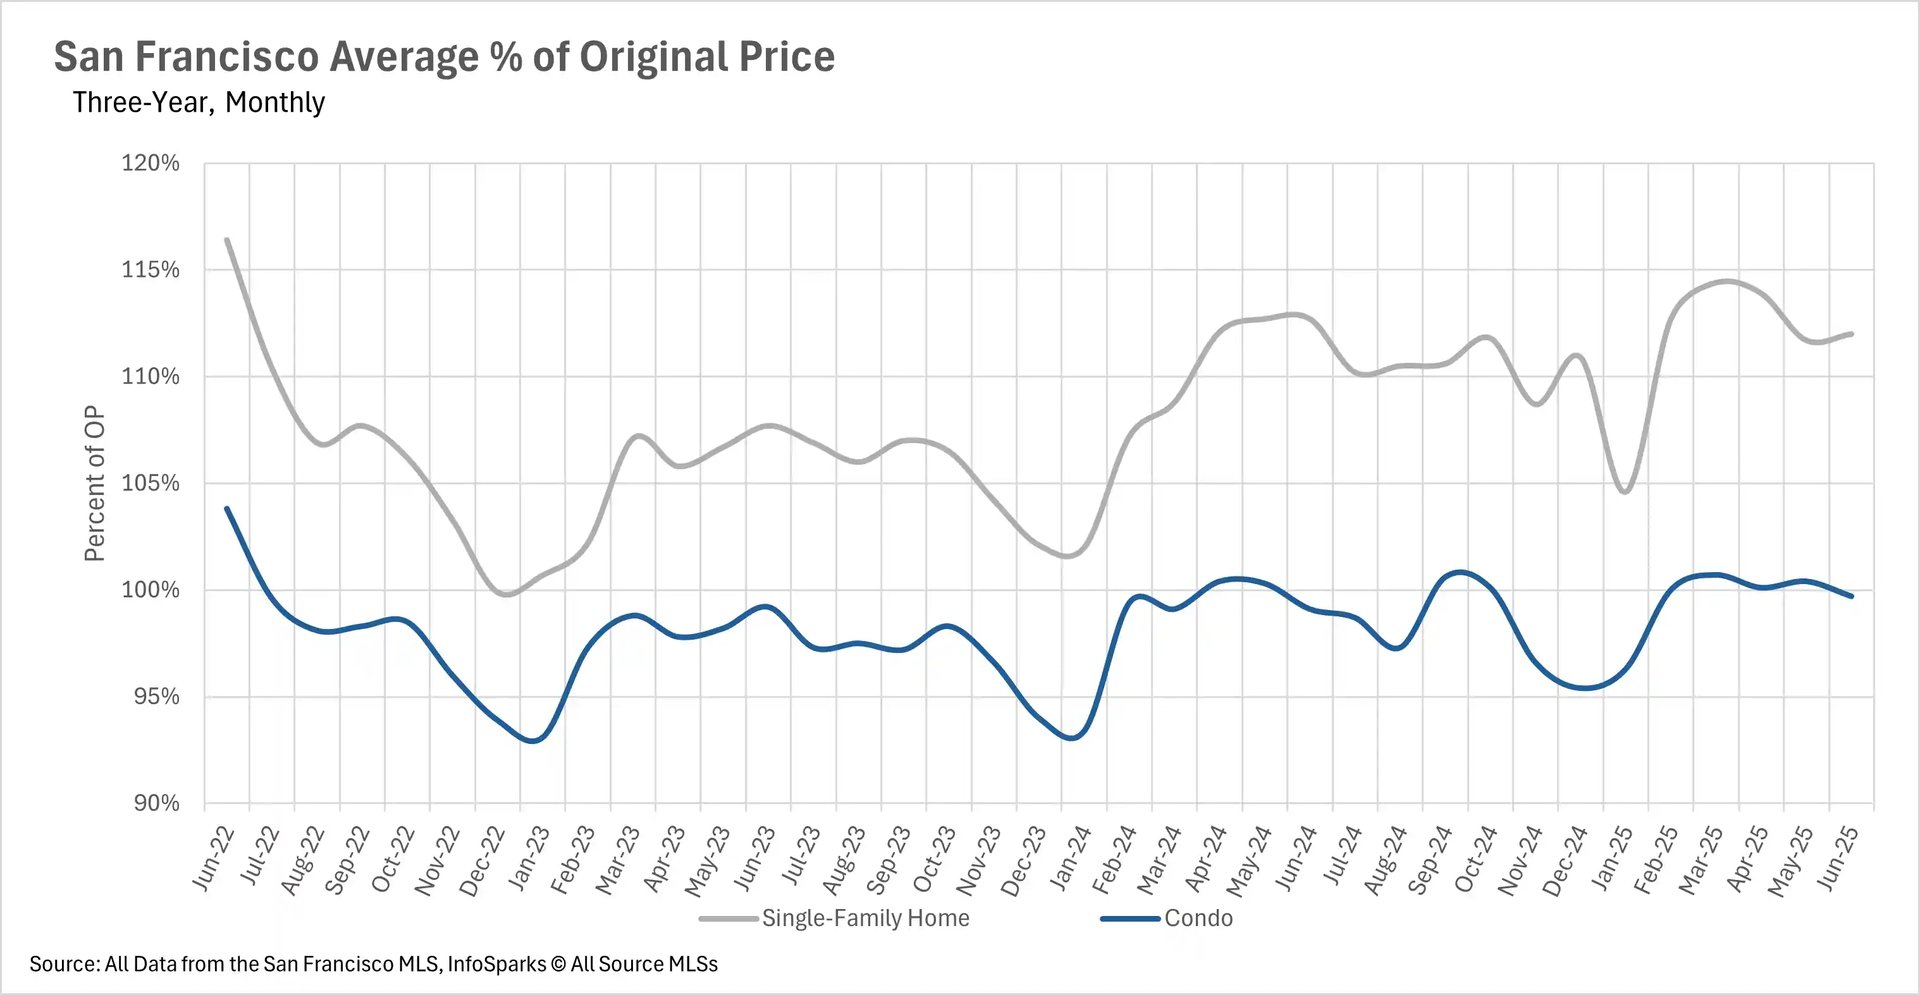
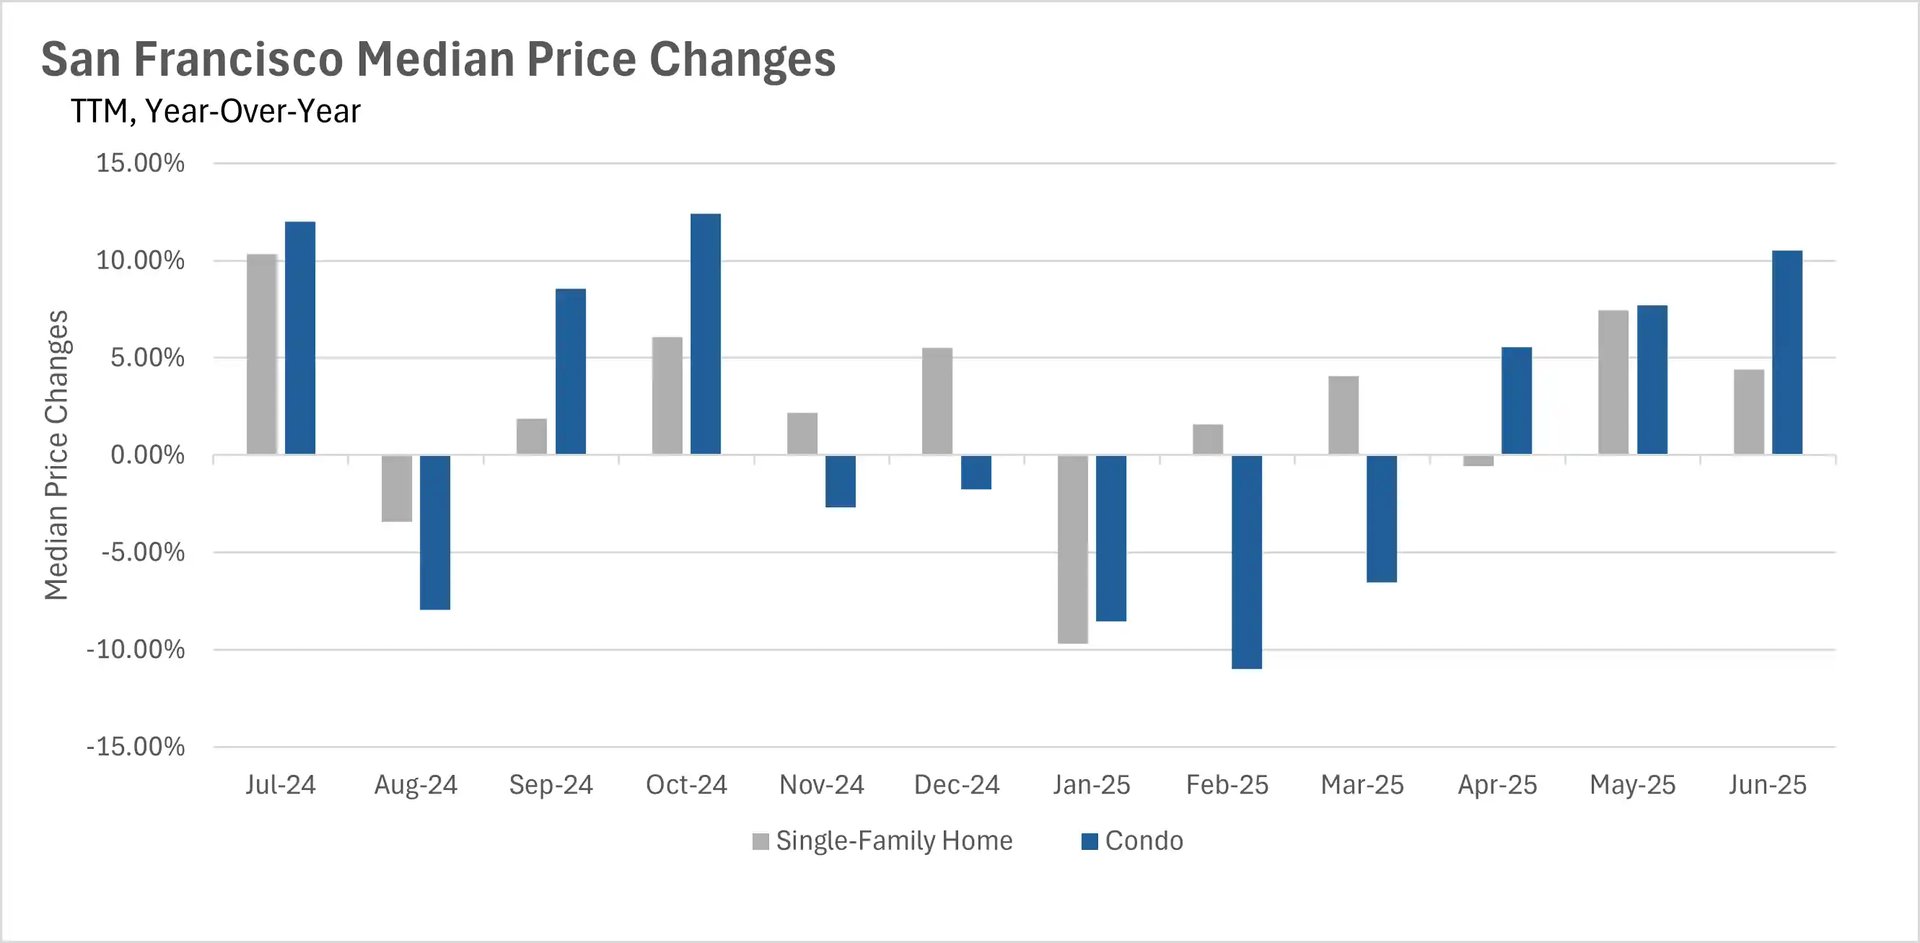
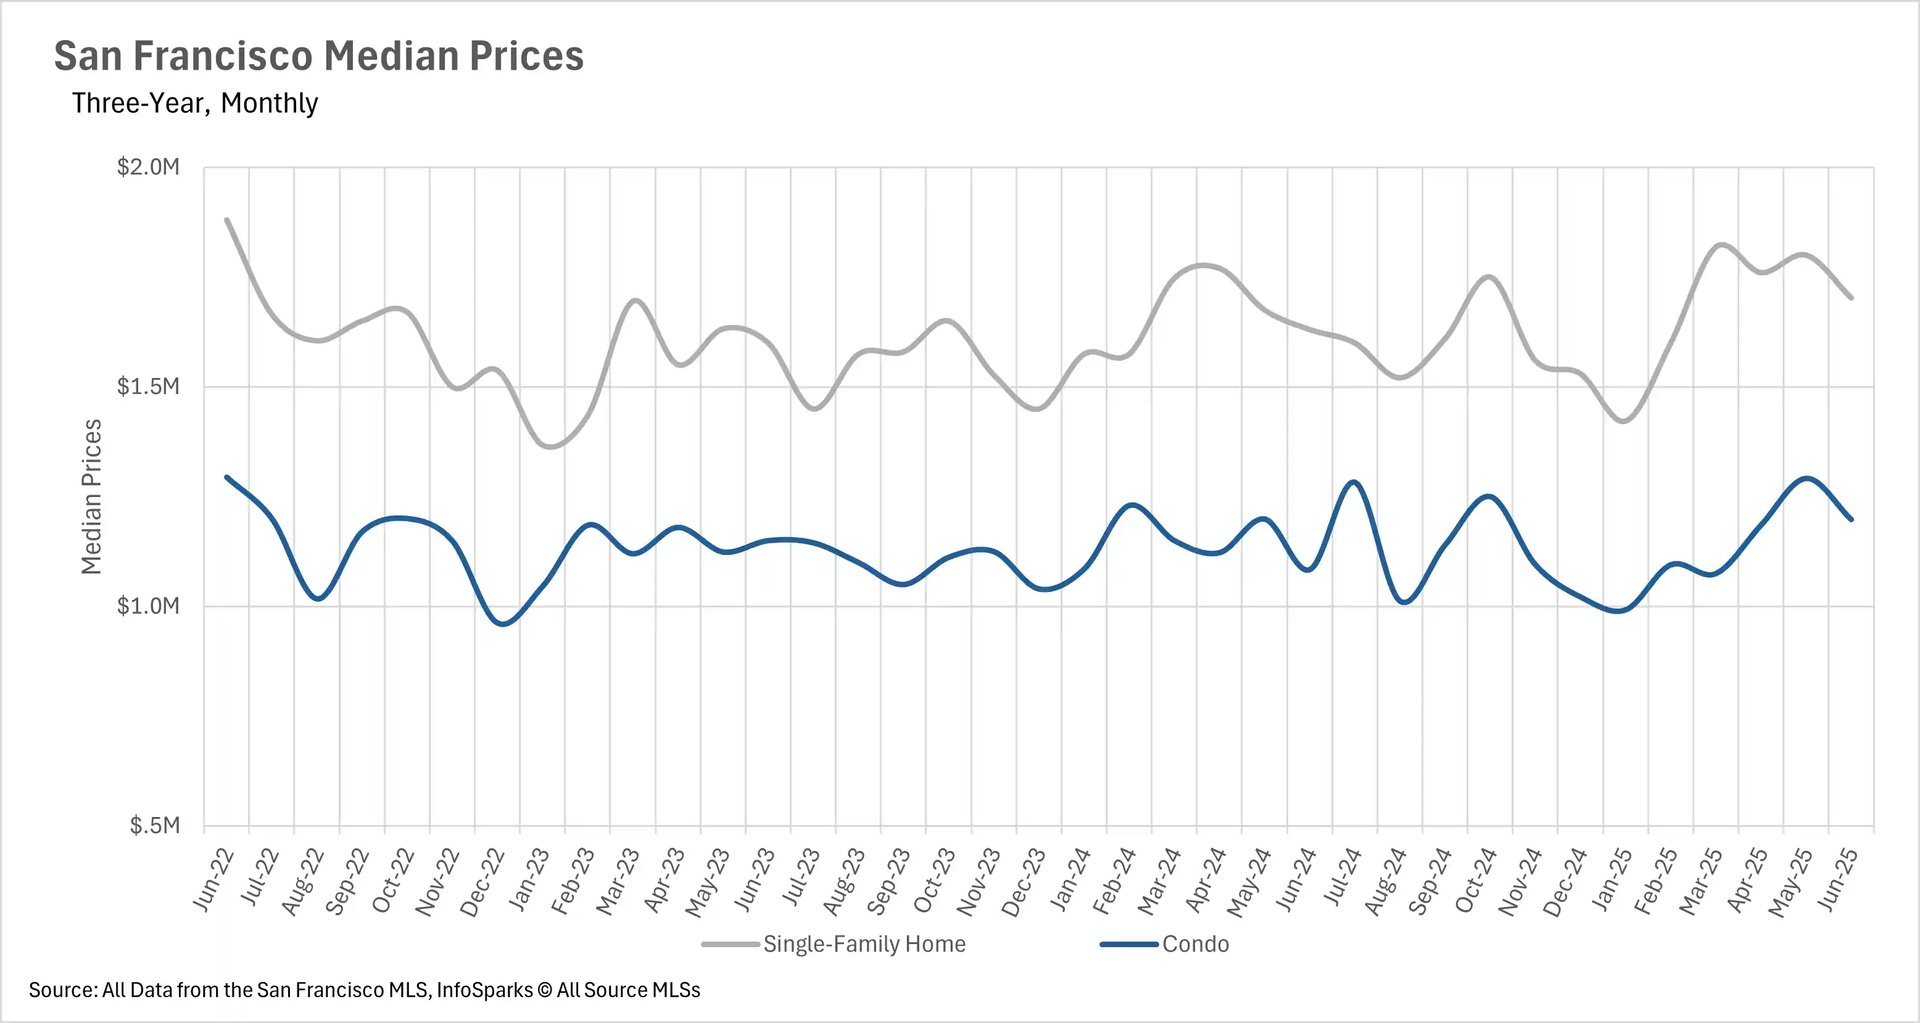
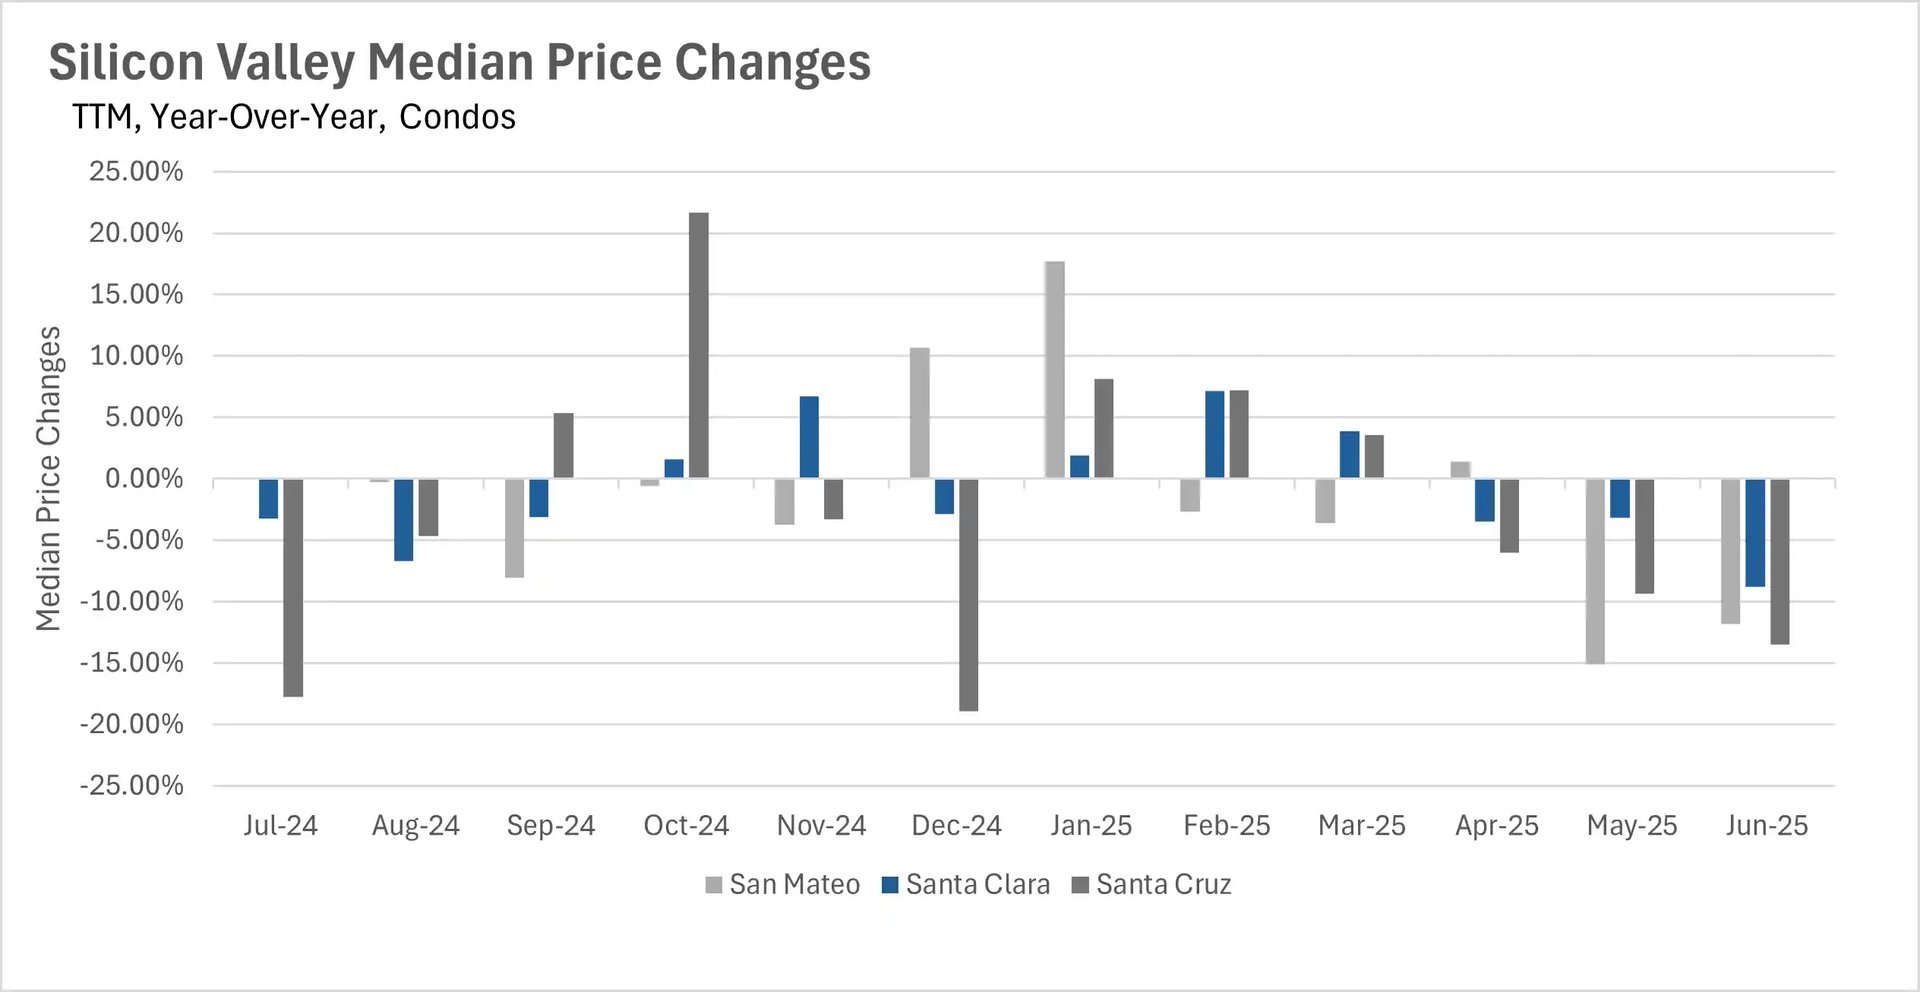
June showcased San Francisco's continued dominance in the Bay Area real estate market, with single-family home prices rising 4.42% year-over-year and condos surging an impressive 10.52% - marking over a year of consistent growth. This stands in stark contrast to the broader Bay Area, where condo markets are experiencing significant stress. The East Bay recorded its fifth consecutive month of year-over-year condo price declines, with condos down 11.41% in Alameda County and 8.25% in Contra Costa County. Silicon Valley's condo market also continued its downward trajectory for the third straight month, with Santa Clara County down 8.79%, San Mateo County declining 11.84%, and Santa Cruz County experiencing a dramatic 13.52% drop.

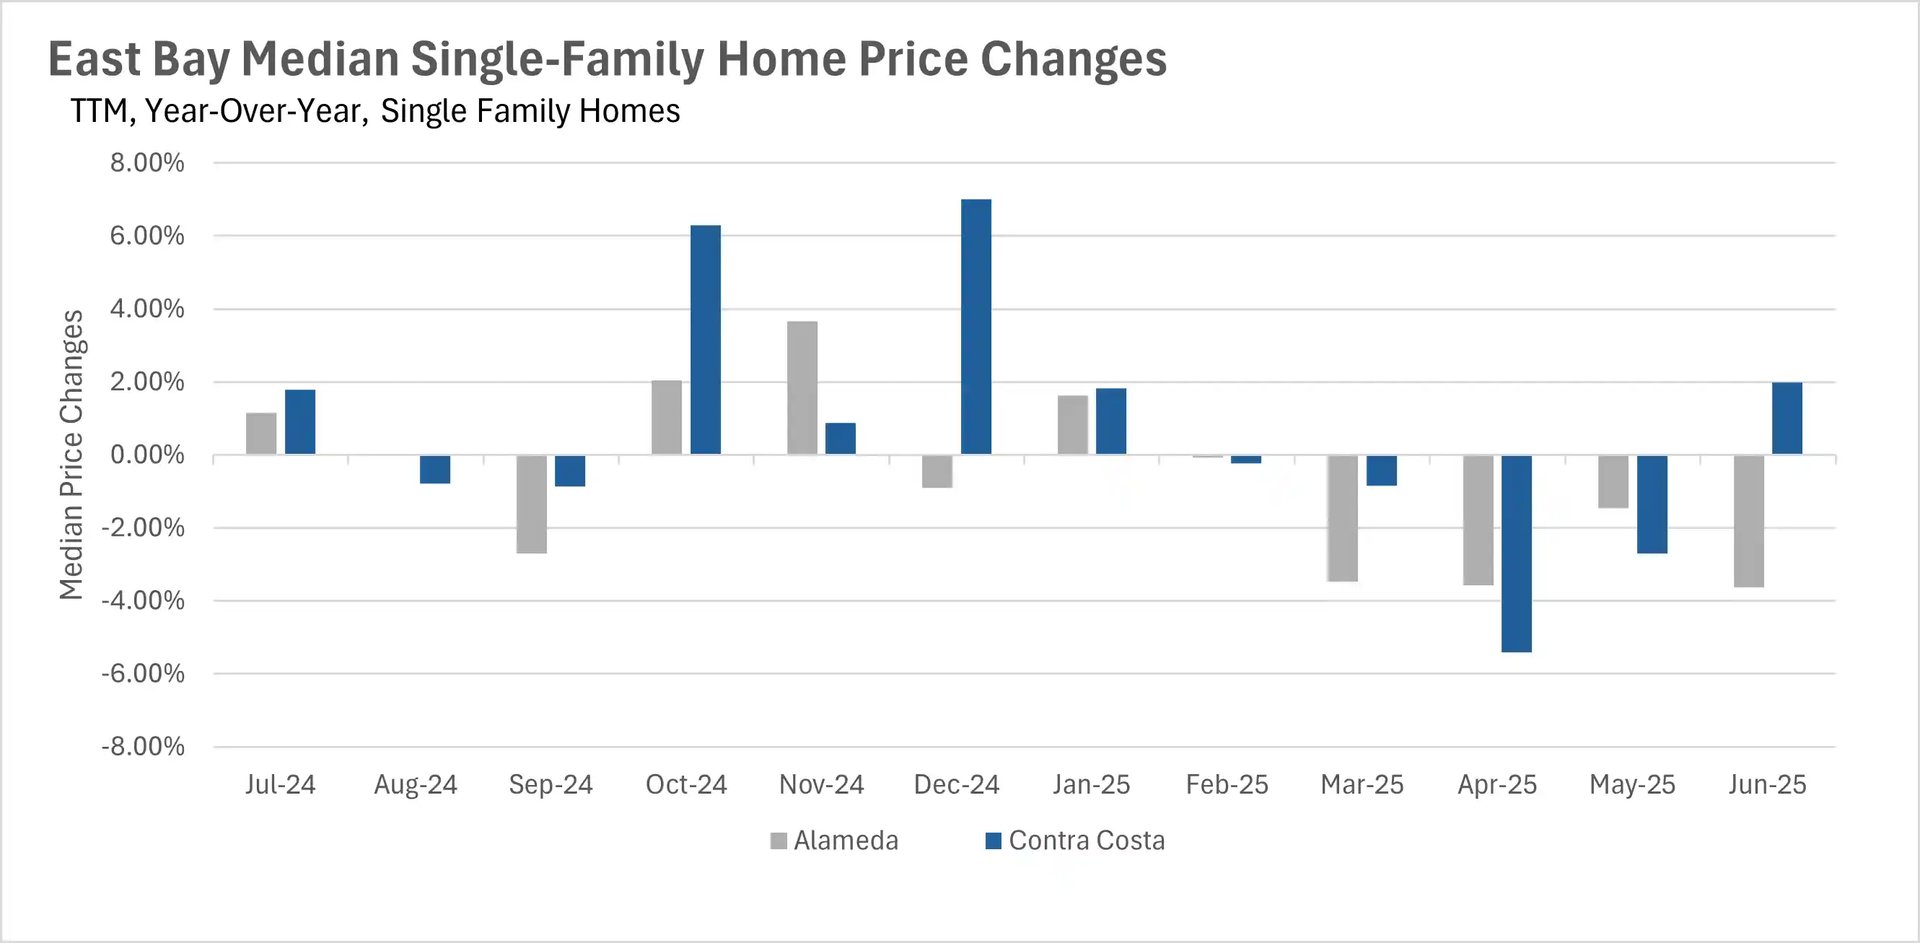
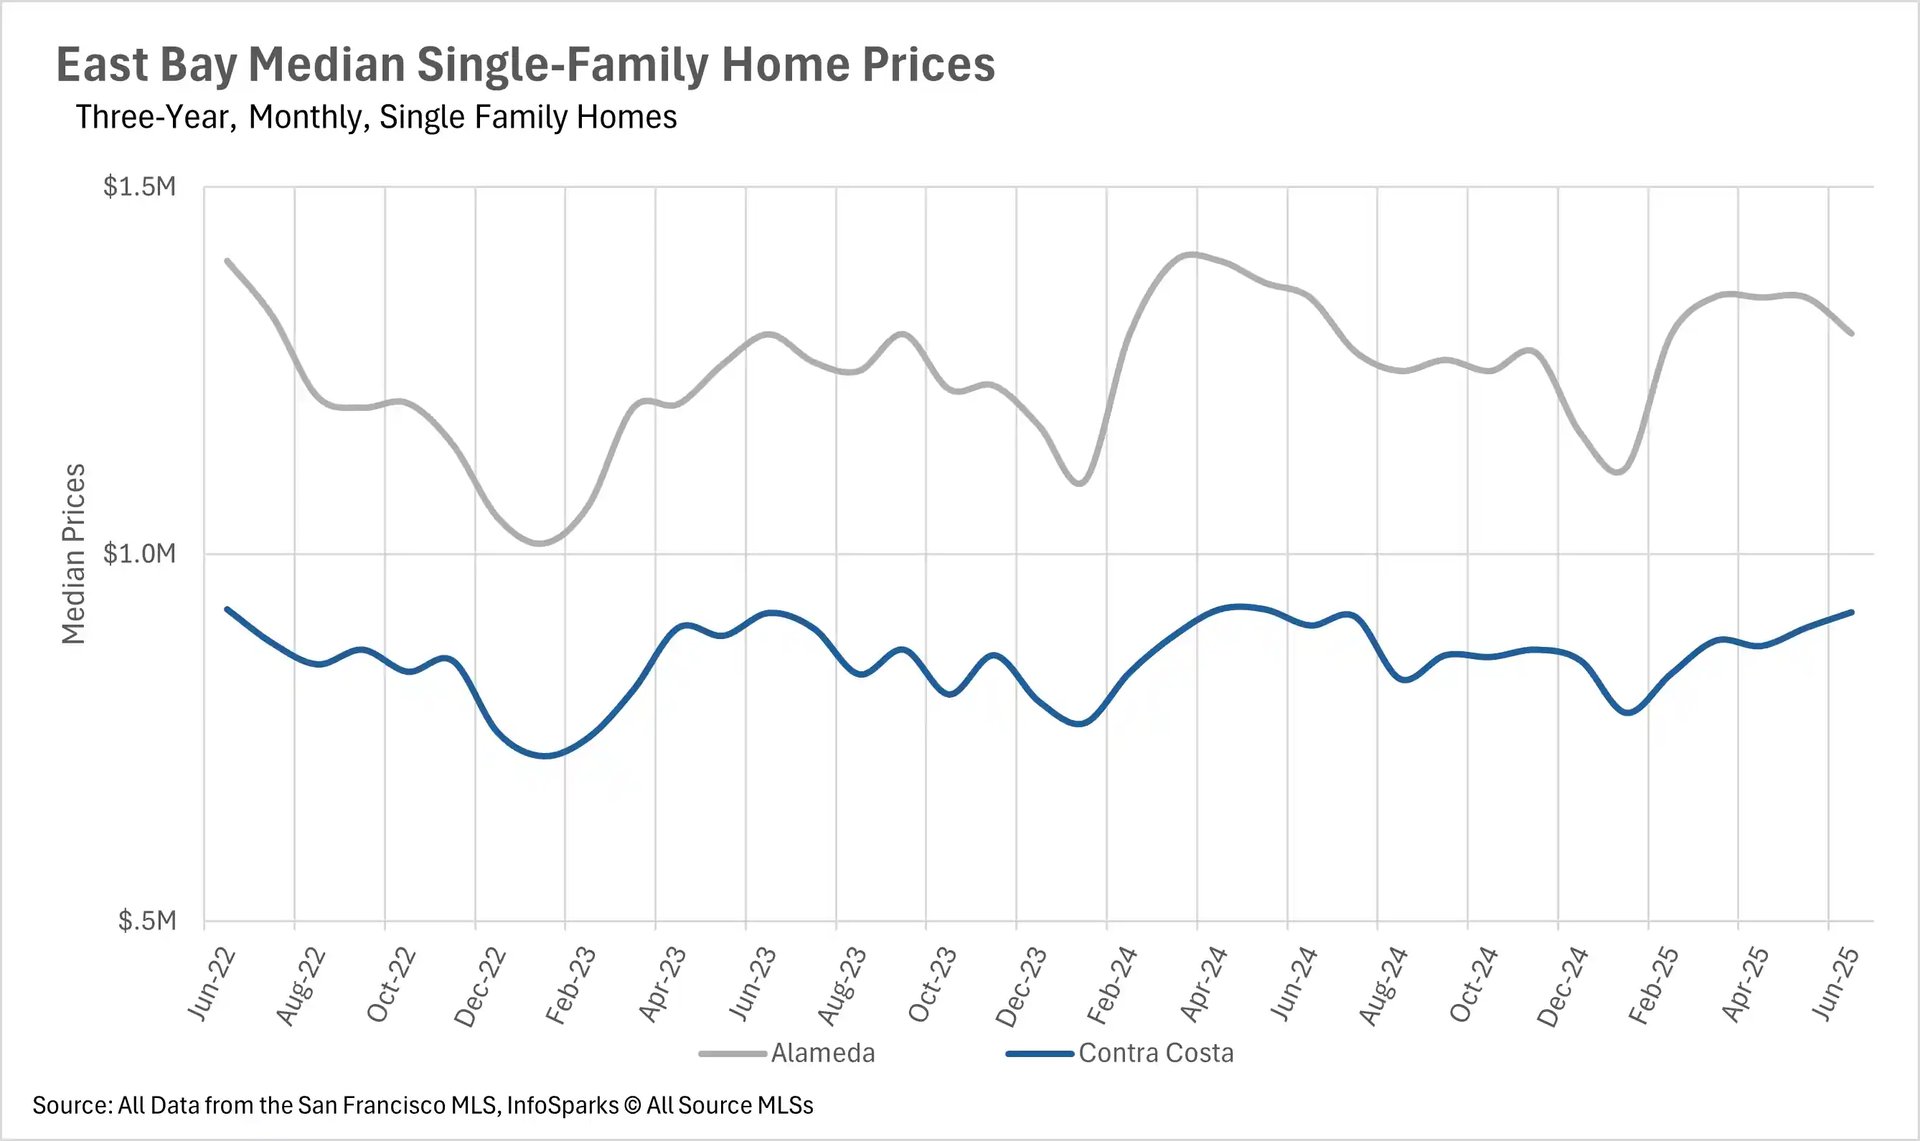
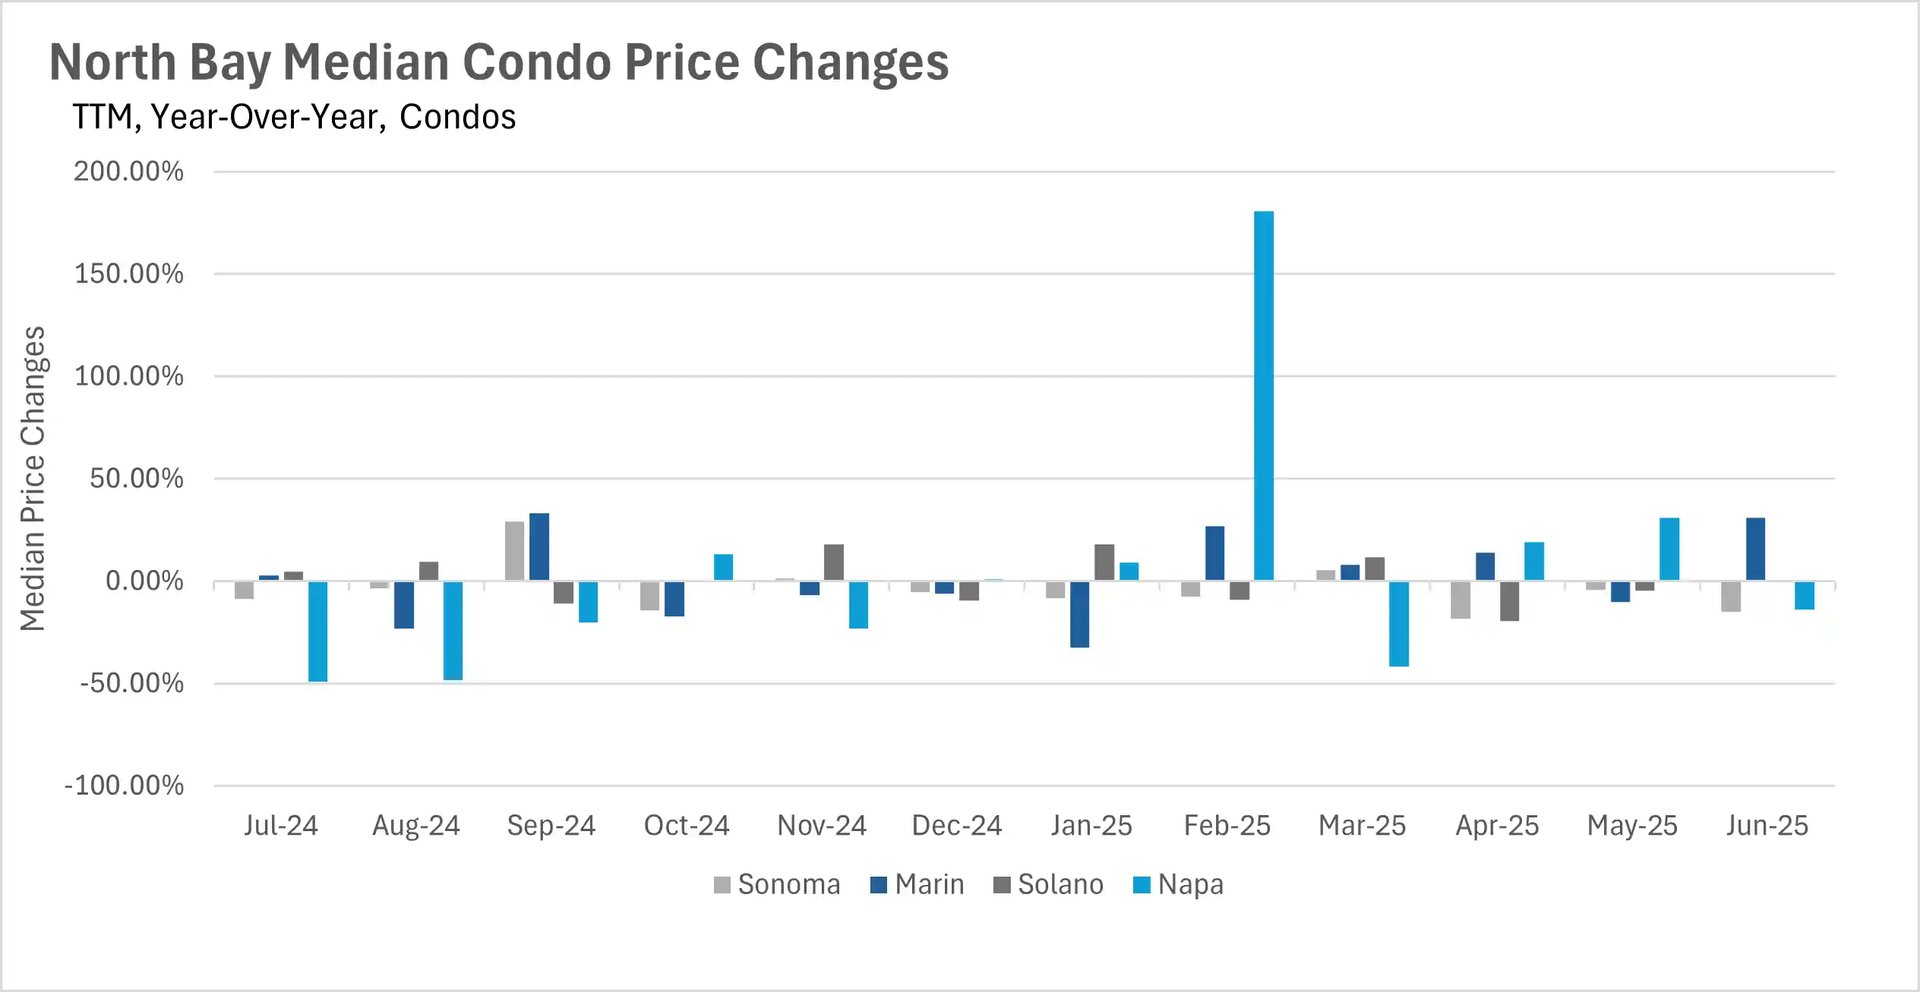
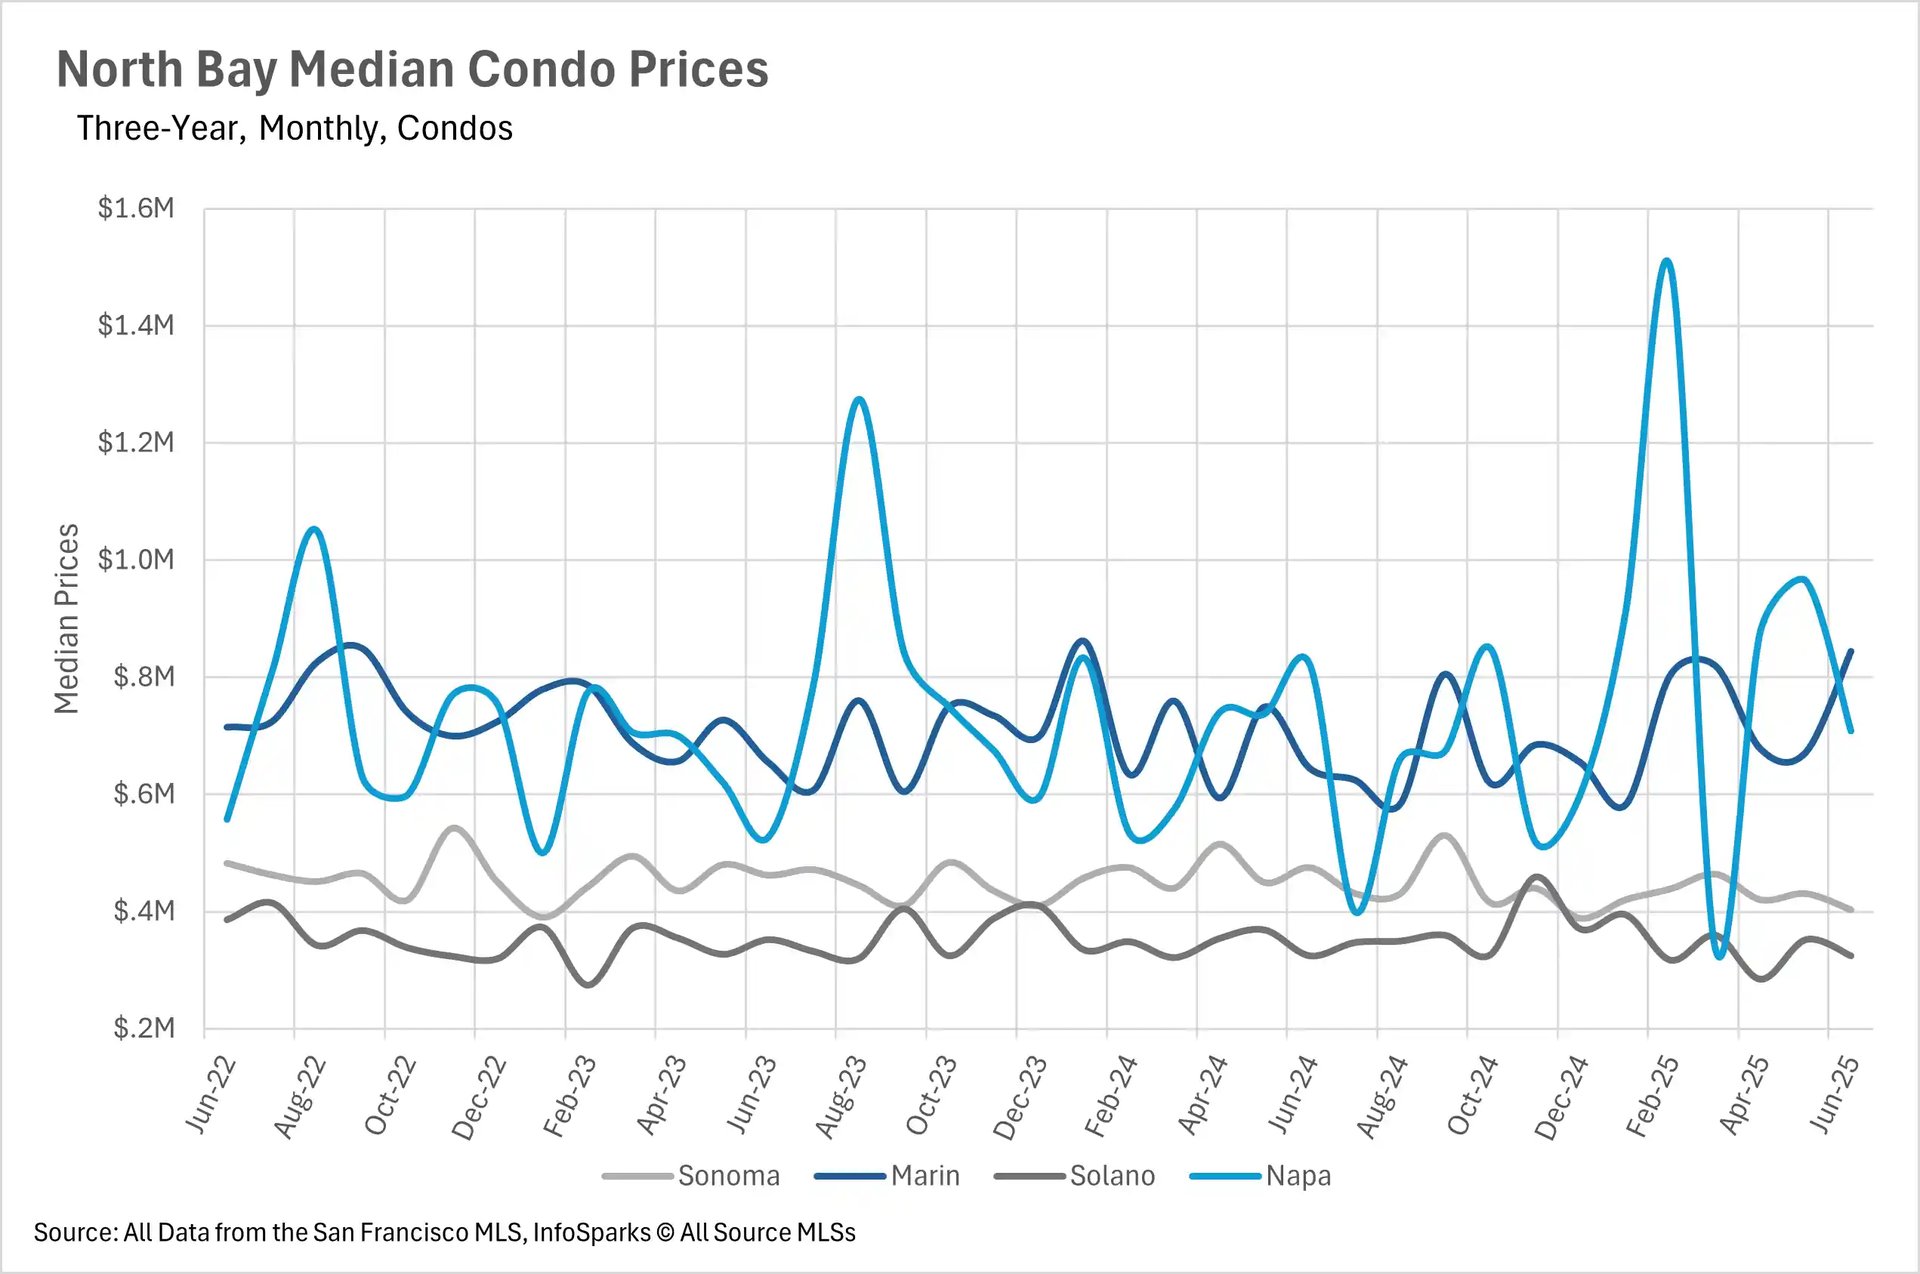
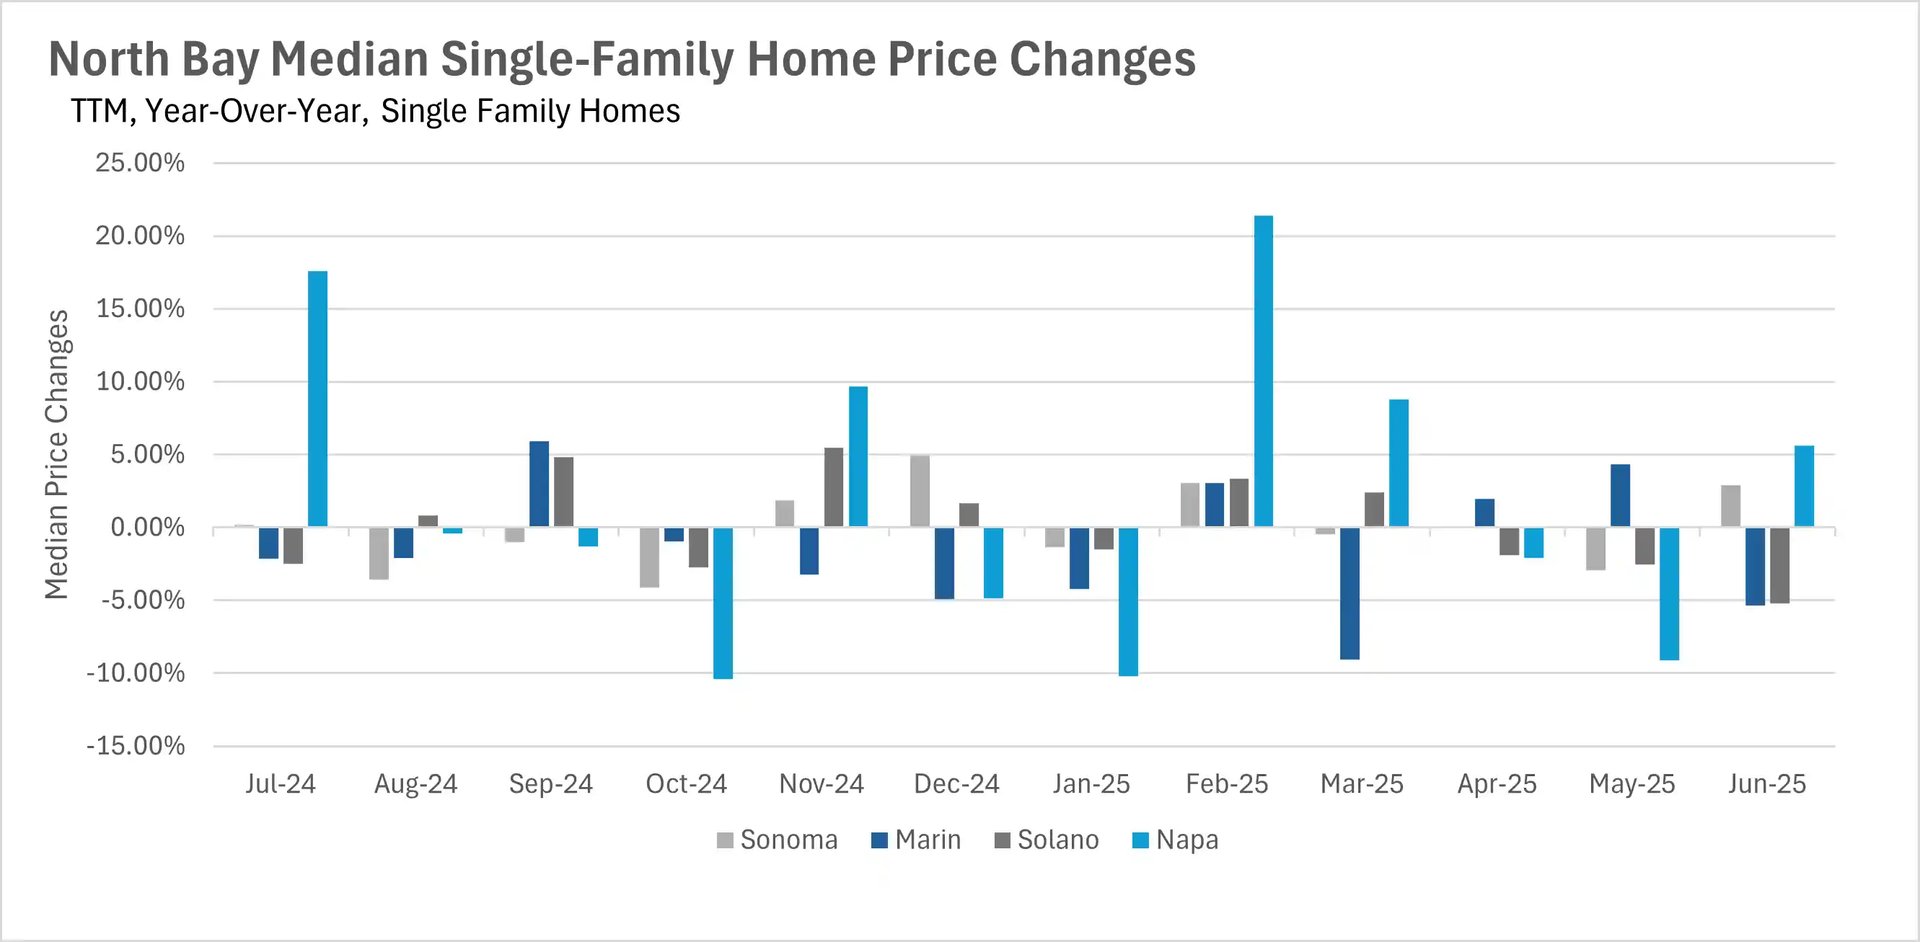
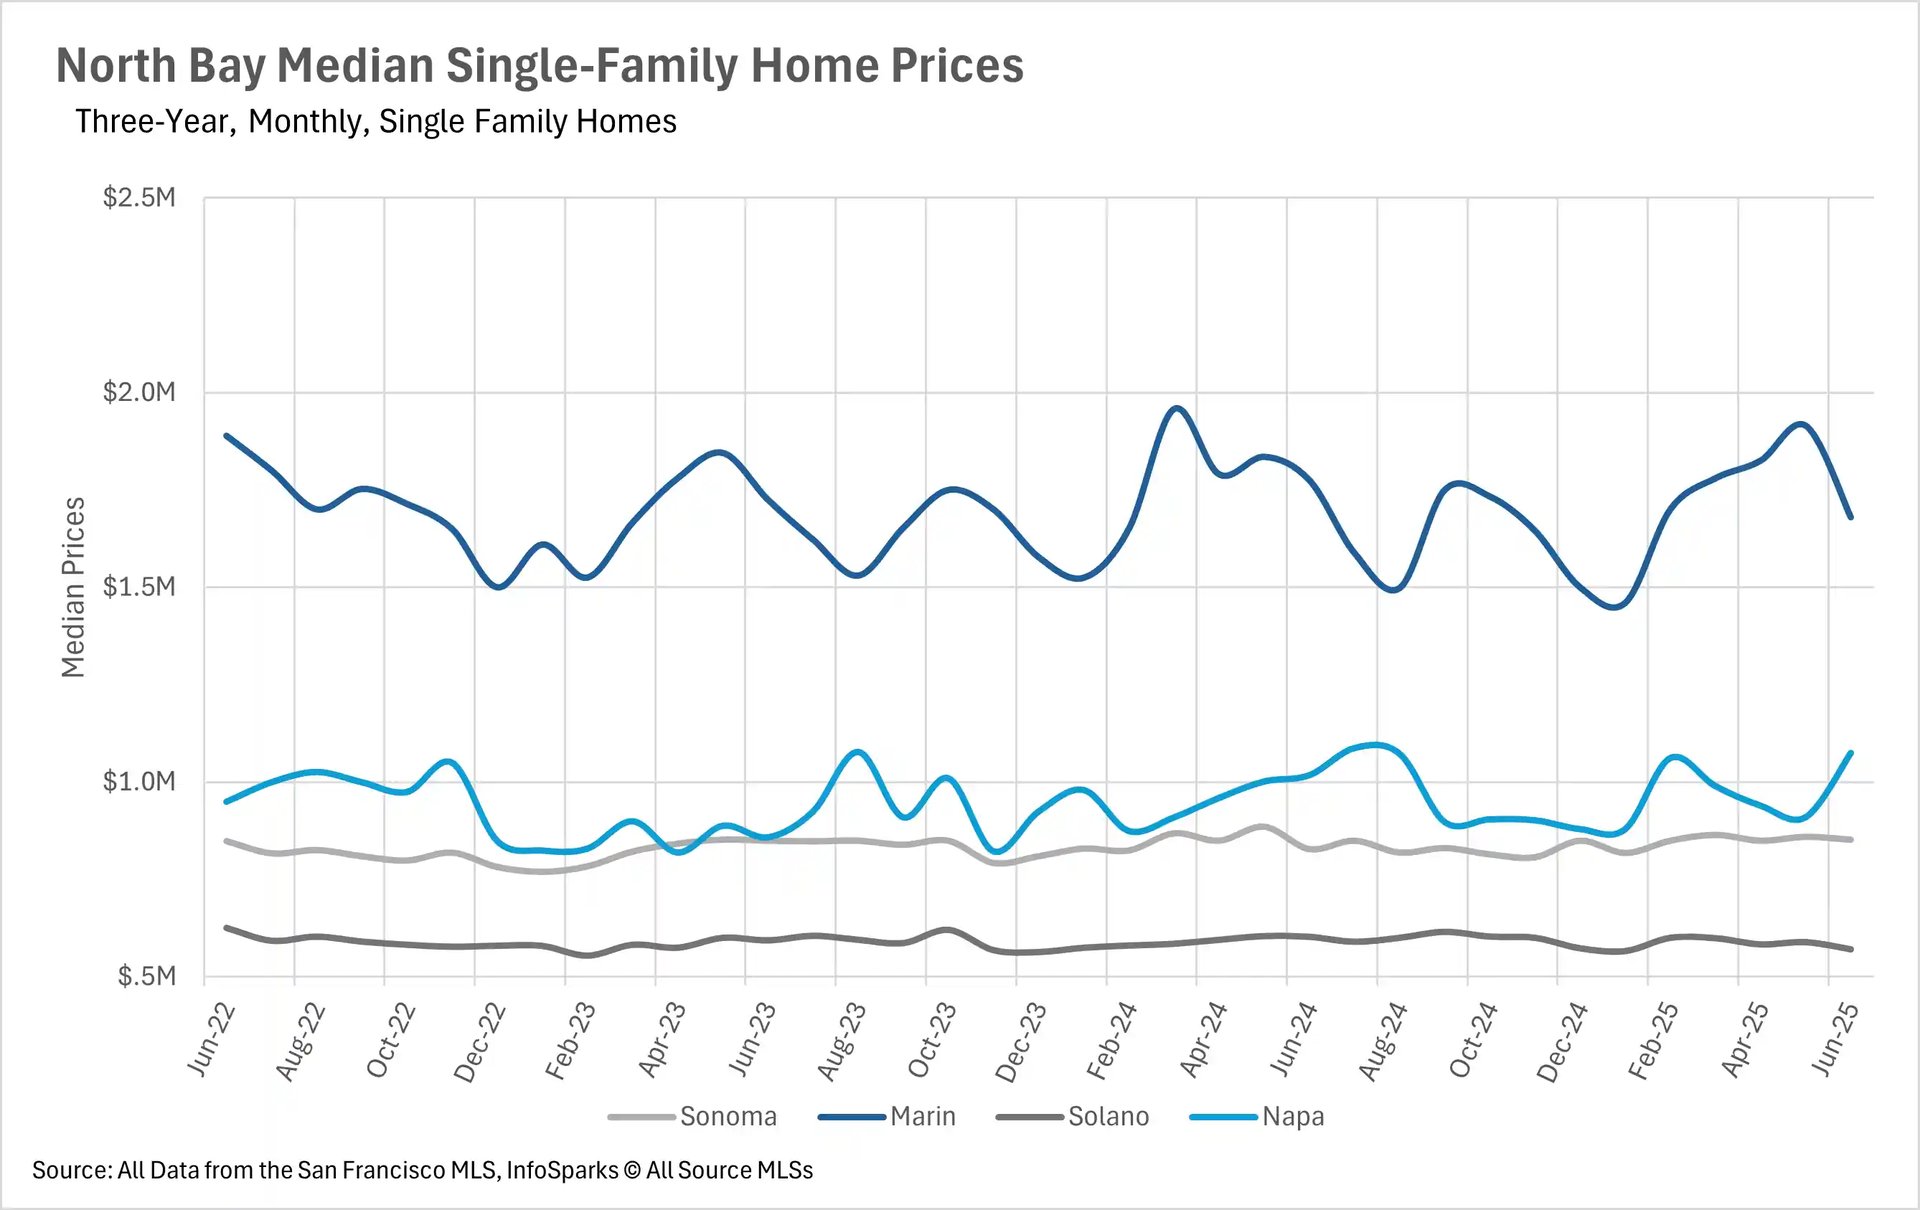
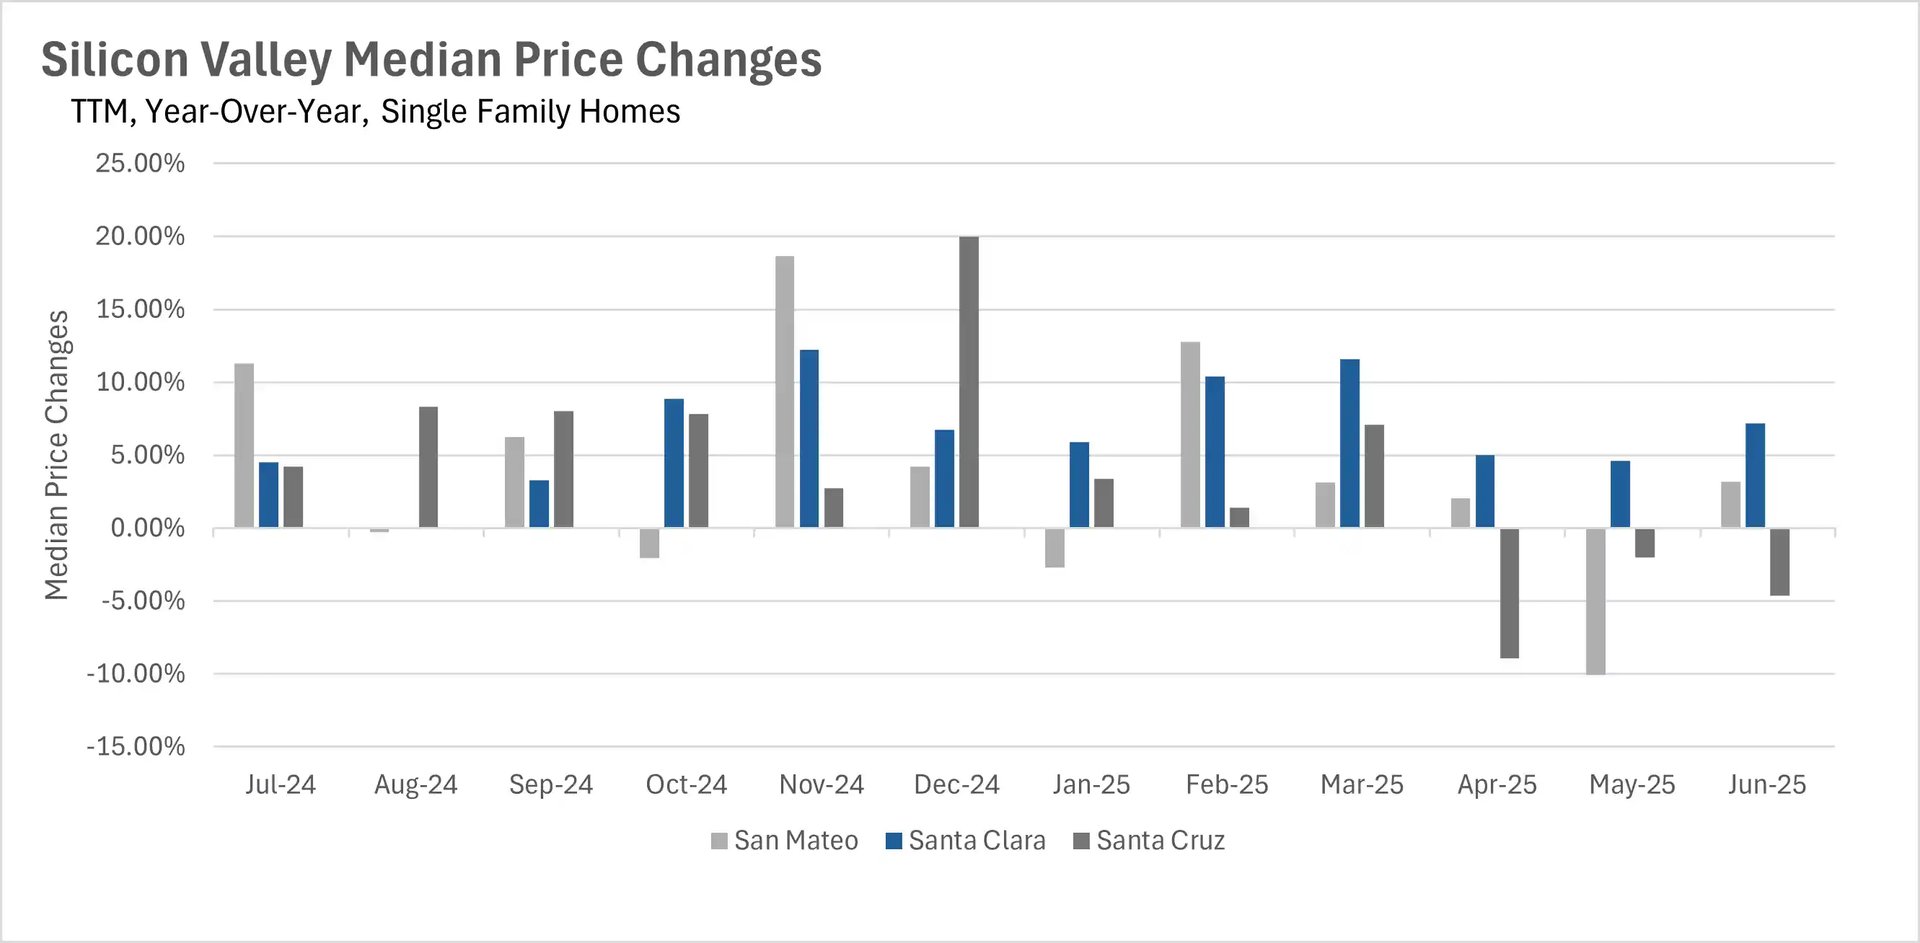
The North Bay showed the most stability in single-family homes, with Sonoma County up 2.92% and Napa County rising 5.60%, though Solano and Marin Counties saw declines of 5.23% and 5.35% respectively. Single-family homes in Silicon Valley demonstrated resilience with San Mateo and Santa Clara Counties posting gains of 3.21% and 7.18%, while only Santa Cruz County declined by 4.64%. The East Bay's single-family market showed mixed results with Contra Costa County managing a modest 1.99% increase while Alameda County continued its five-month decline.

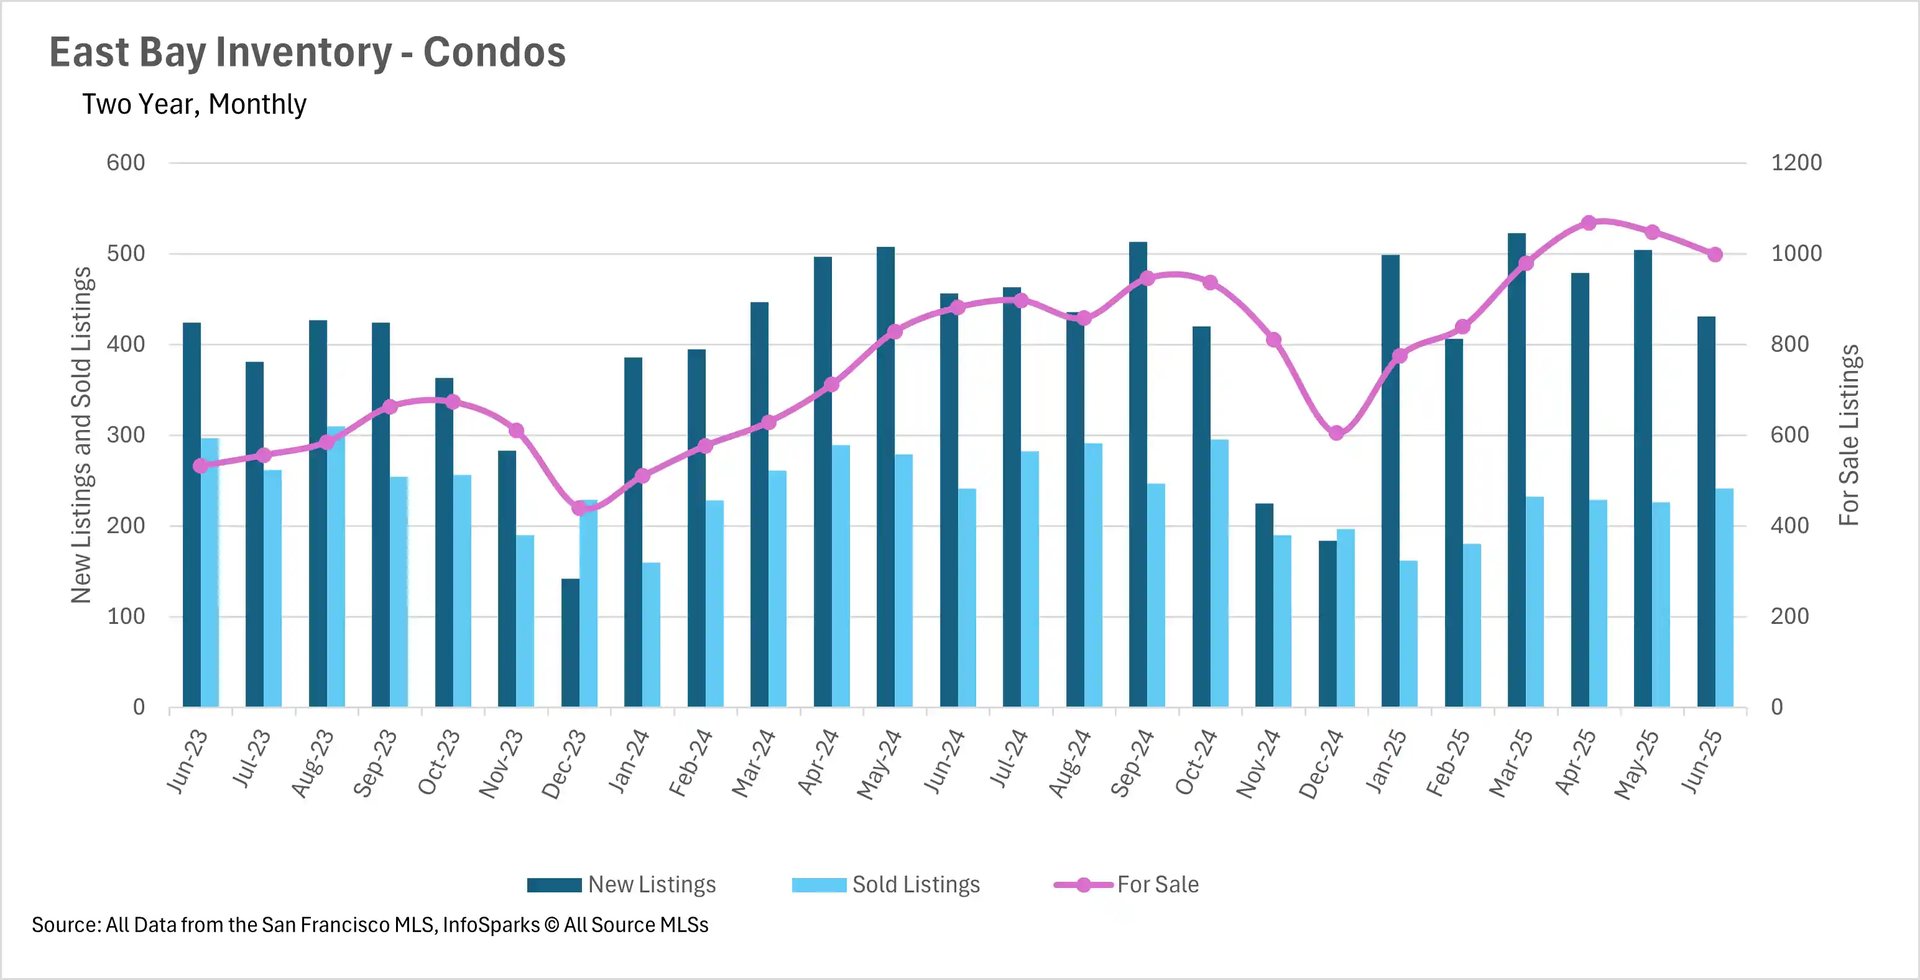
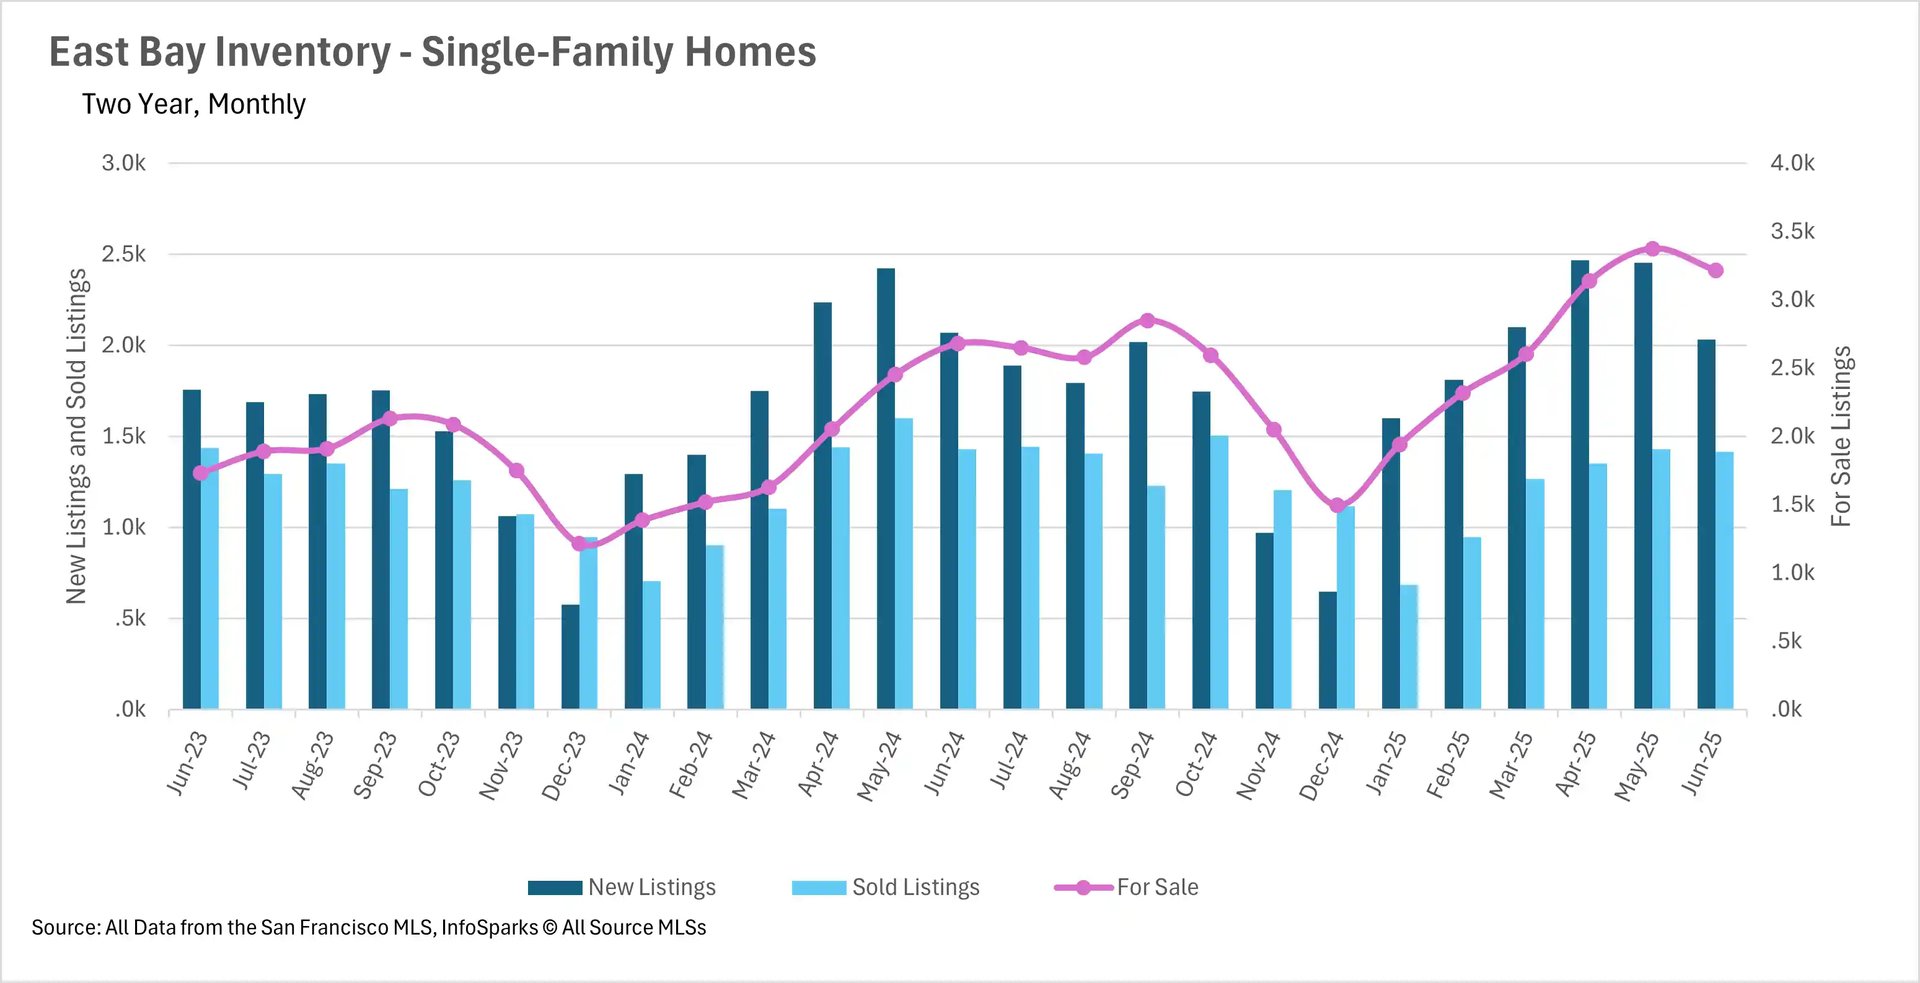
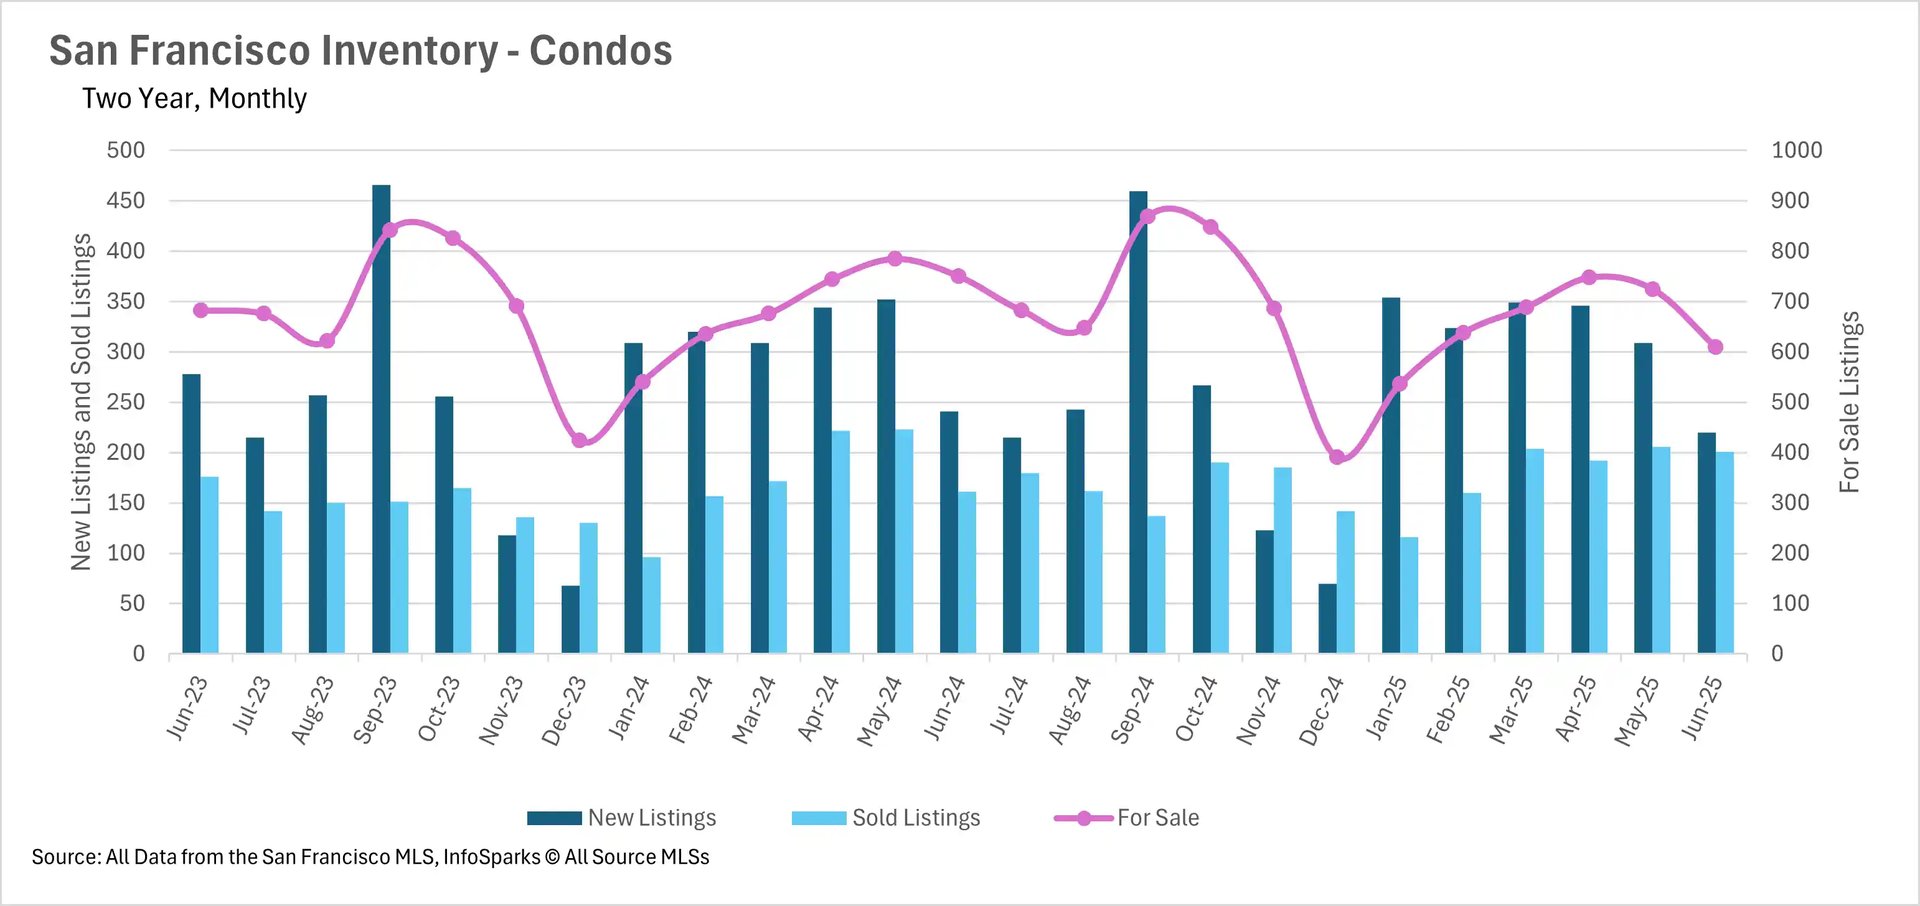
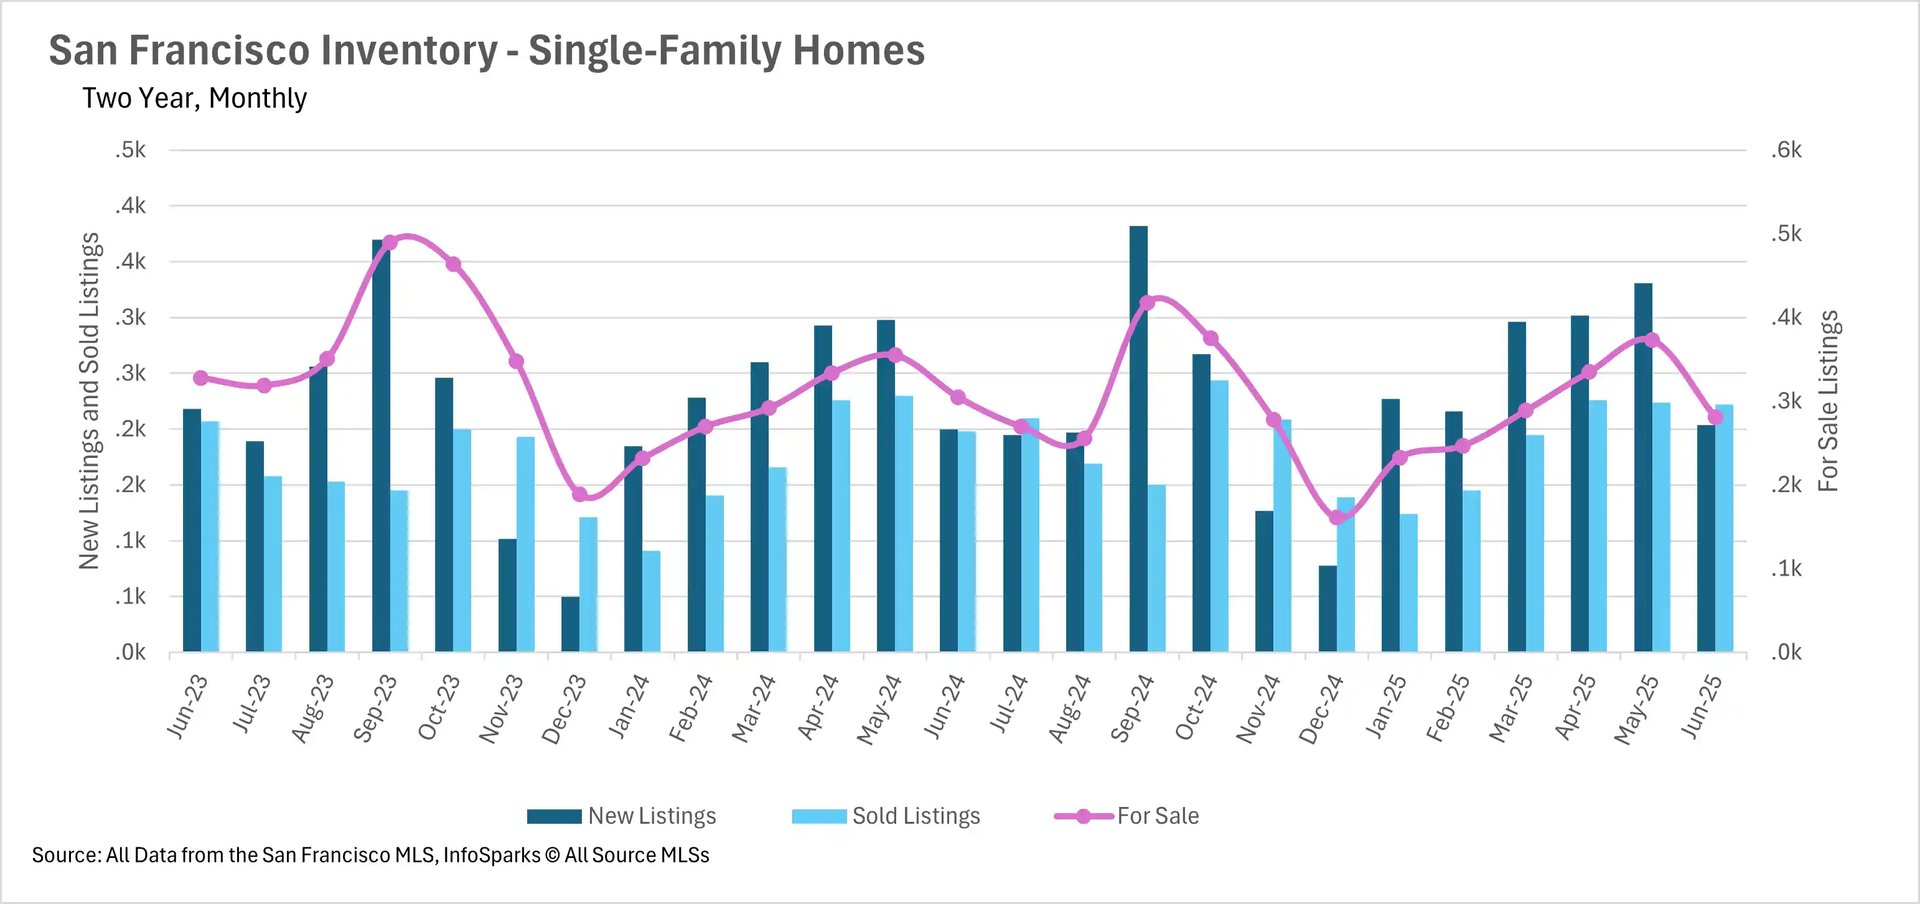
Regional inventory trends reveal market consolidation

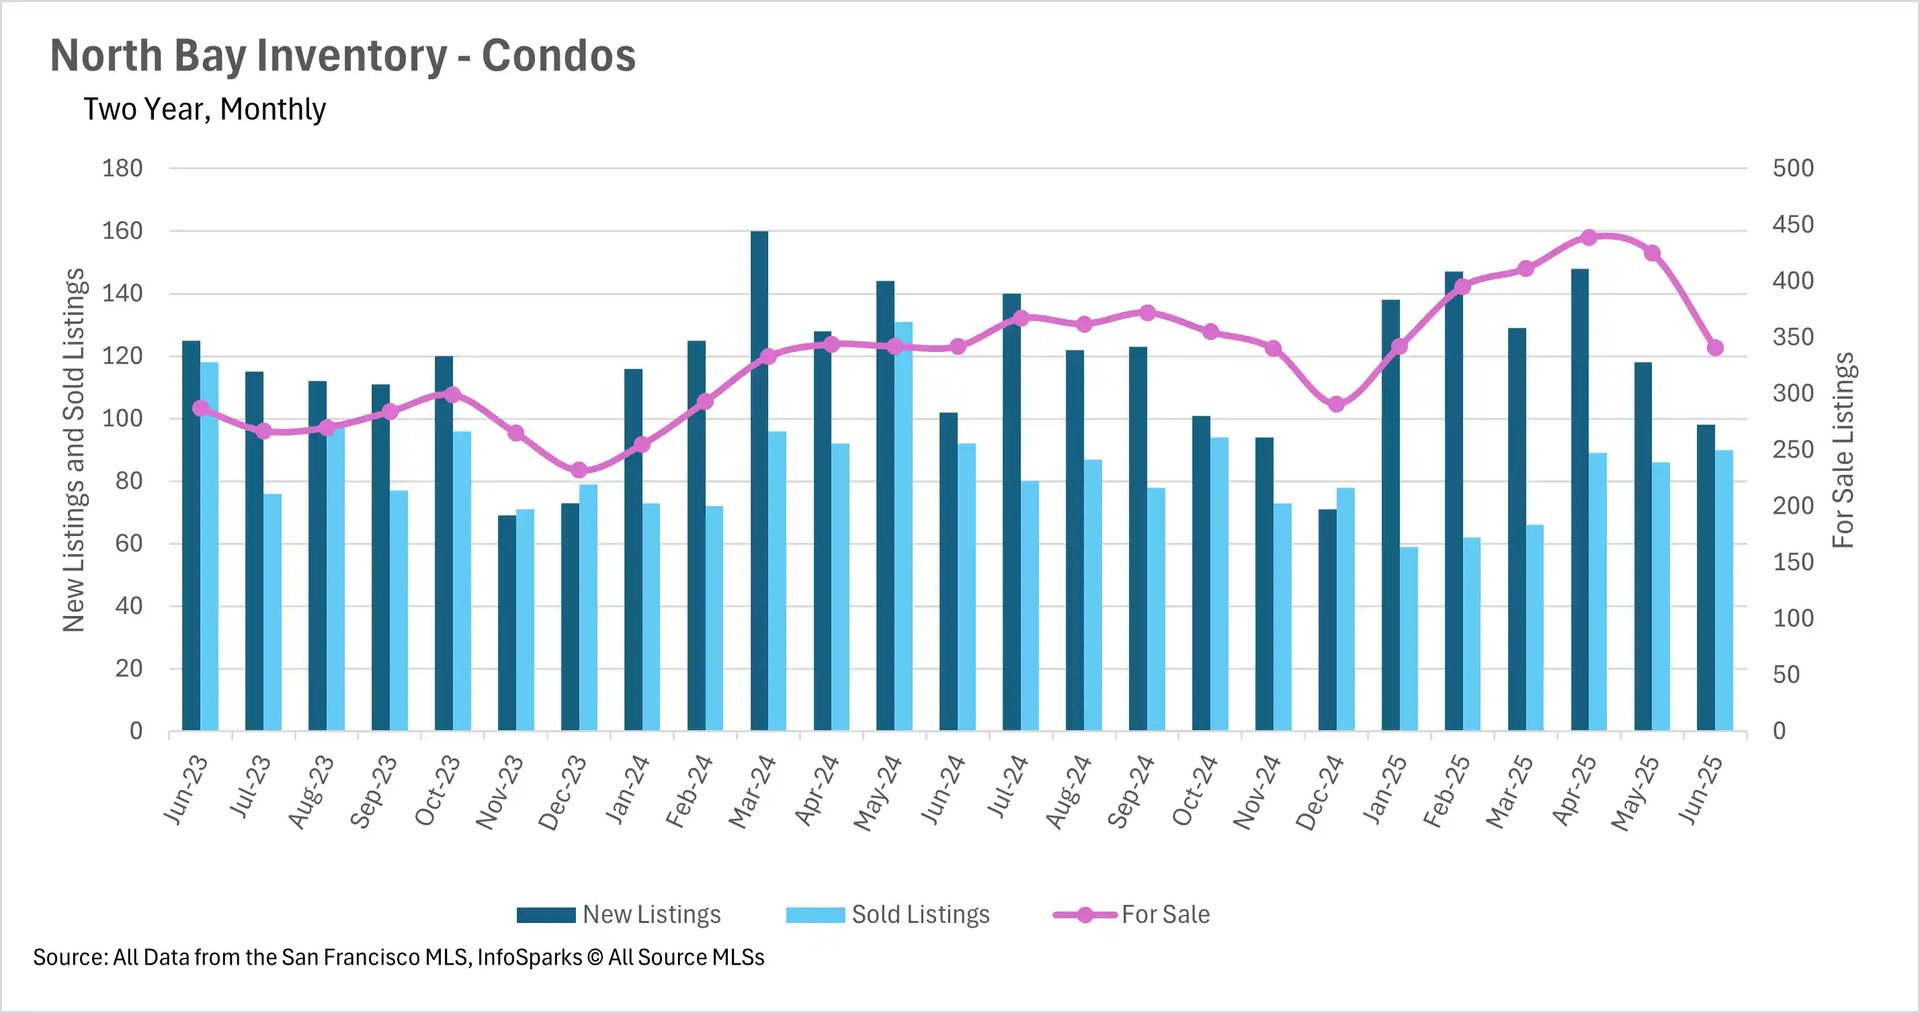
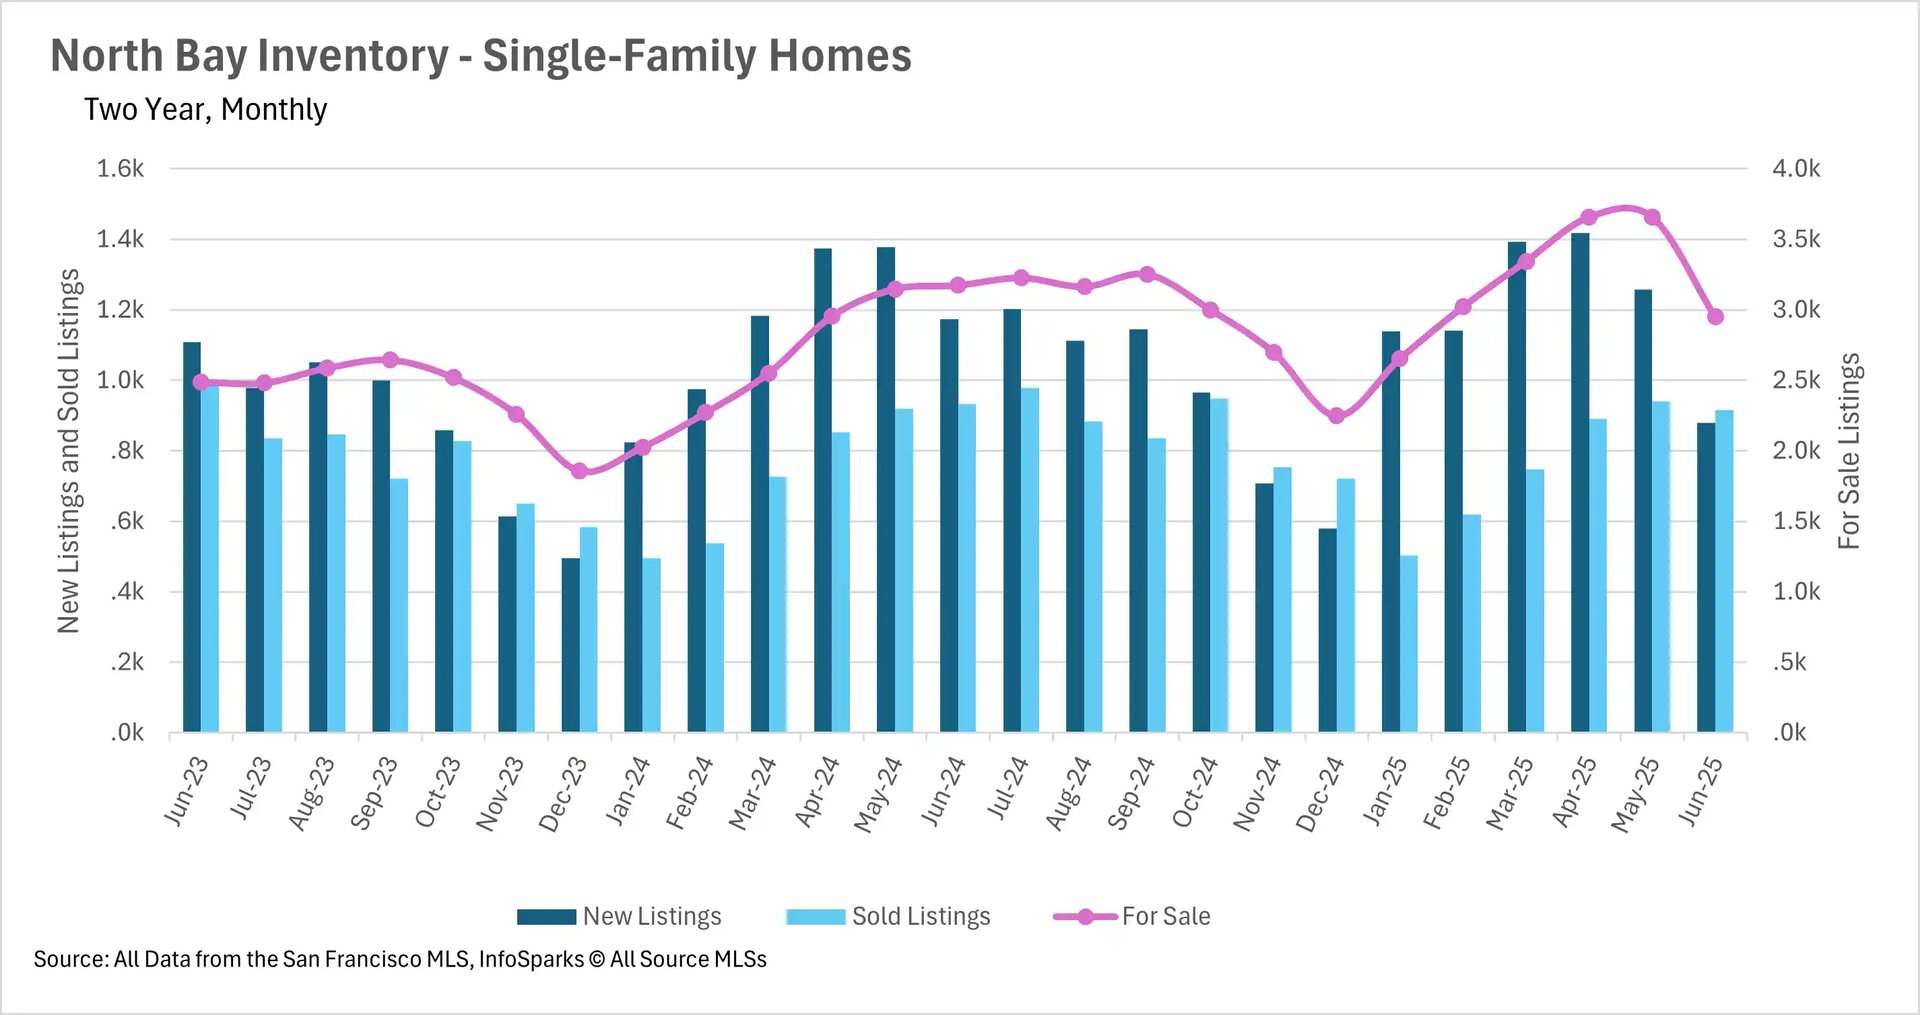
June marked a significant shift in inventory dynamics across the Bay Area, with most regions experiencing substantial month-over-month declines after reaching local peaks in May. The North Bay witnessed one of the sharpest inventory declines in recent history, with single-family home inventory falling 19.34% month-over-month (though still down only 7.09% year-over-year) and condo inventory dropping 19.76% month-over-month. San Francisco continued its multi-year inventory decline trend with single-family homes down 7.87% year-over-year and condos showing an even steeper 18.77% decline.

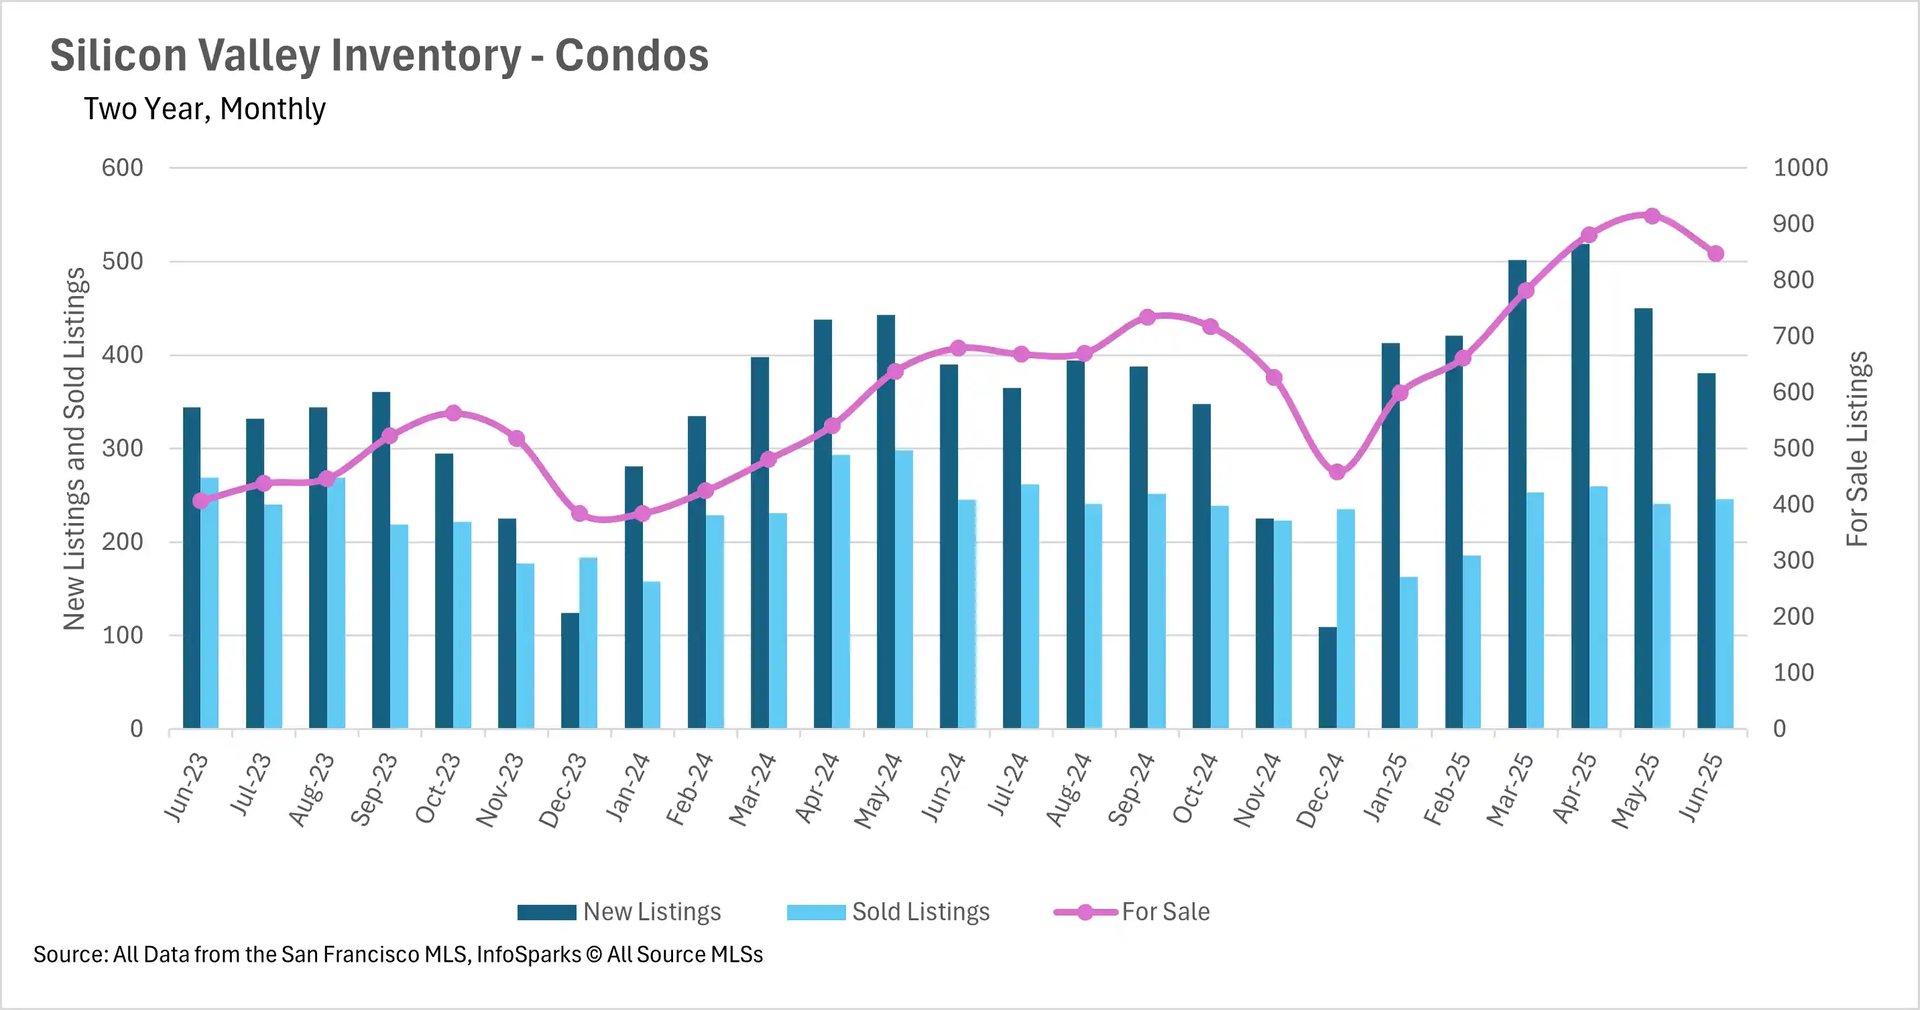
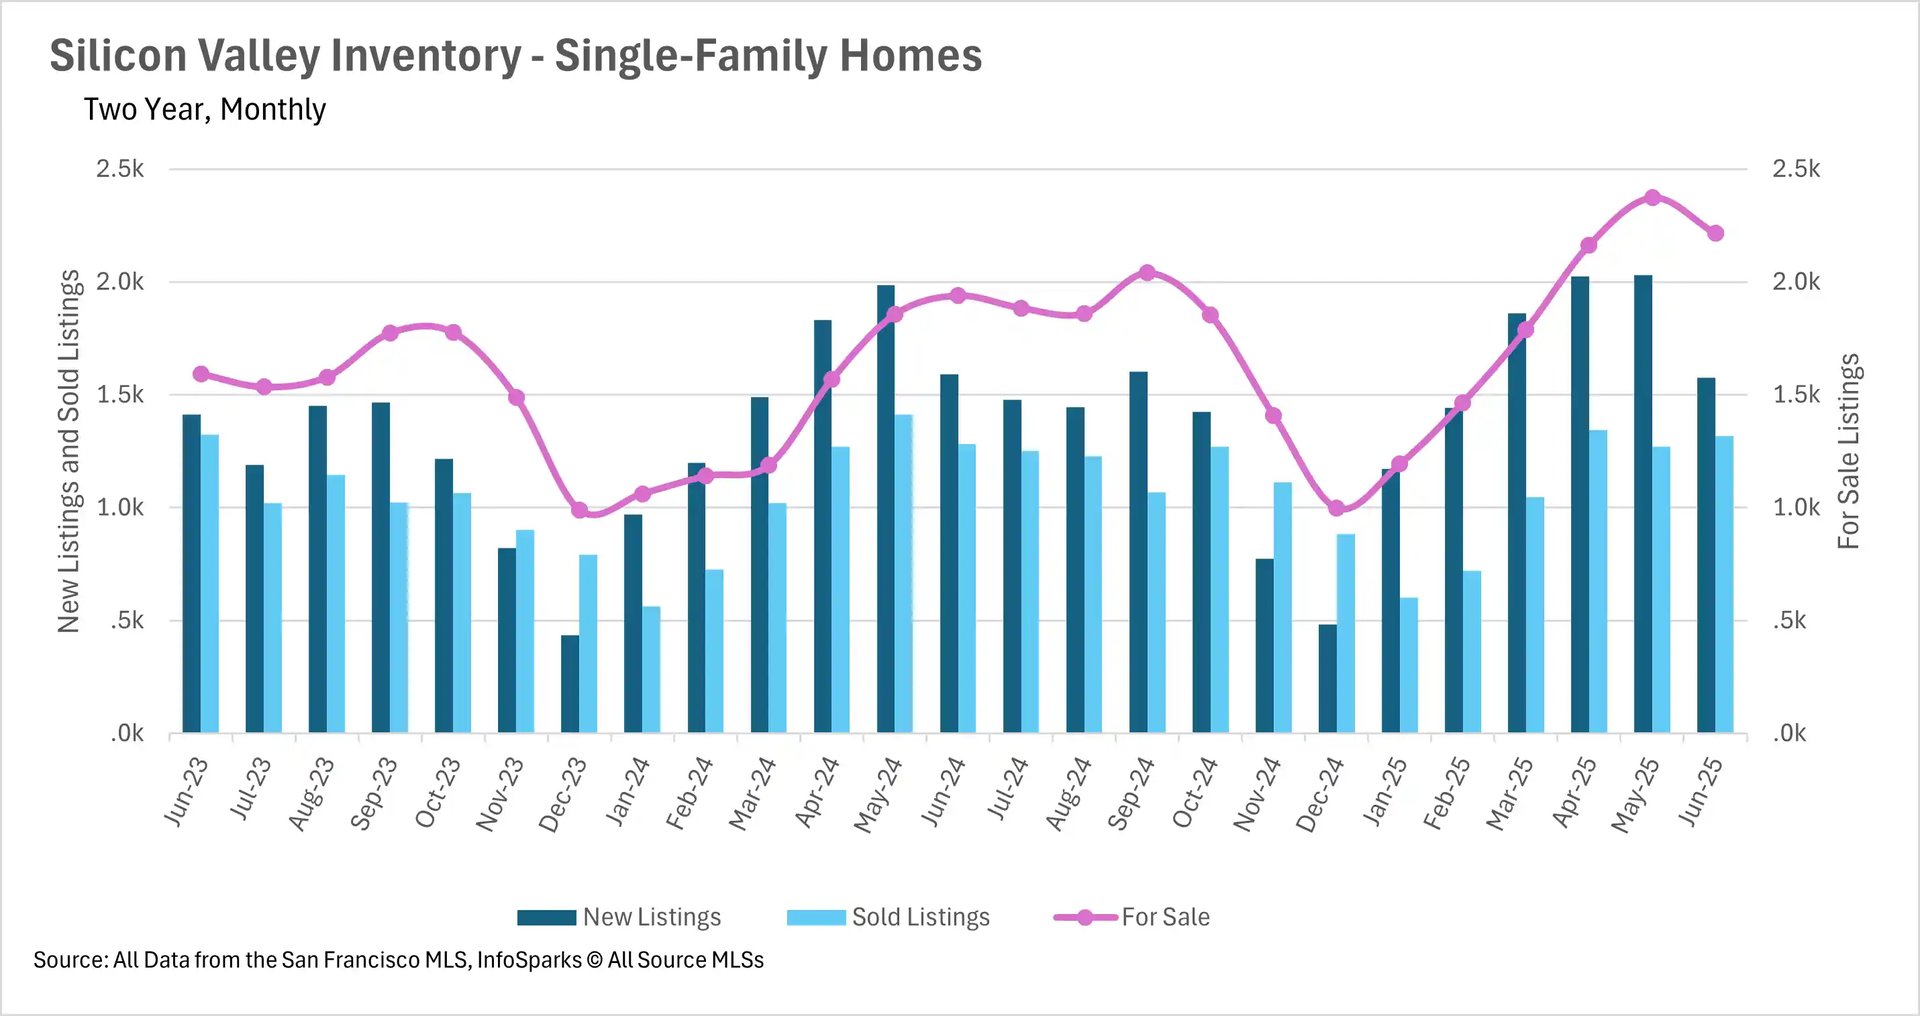
Silicon Valley and the East Bay appear to have reached their inventory peaks, with both regions seeing decreases in June despite maintaining significantly higher levels than last year. The East Bay still shows single-family inventory 20.05% higher year-over-year and condo inventory 13.15% higher, while Silicon Valley maintains 14.18% more single-family listings and 24.89% more condo listings than June 2024. The common thread across all regions is that inventory declines are being driven more by fewer new listings hitting the market rather than increased sales activity, suggesting seller hesitancy rather than buyer demand.

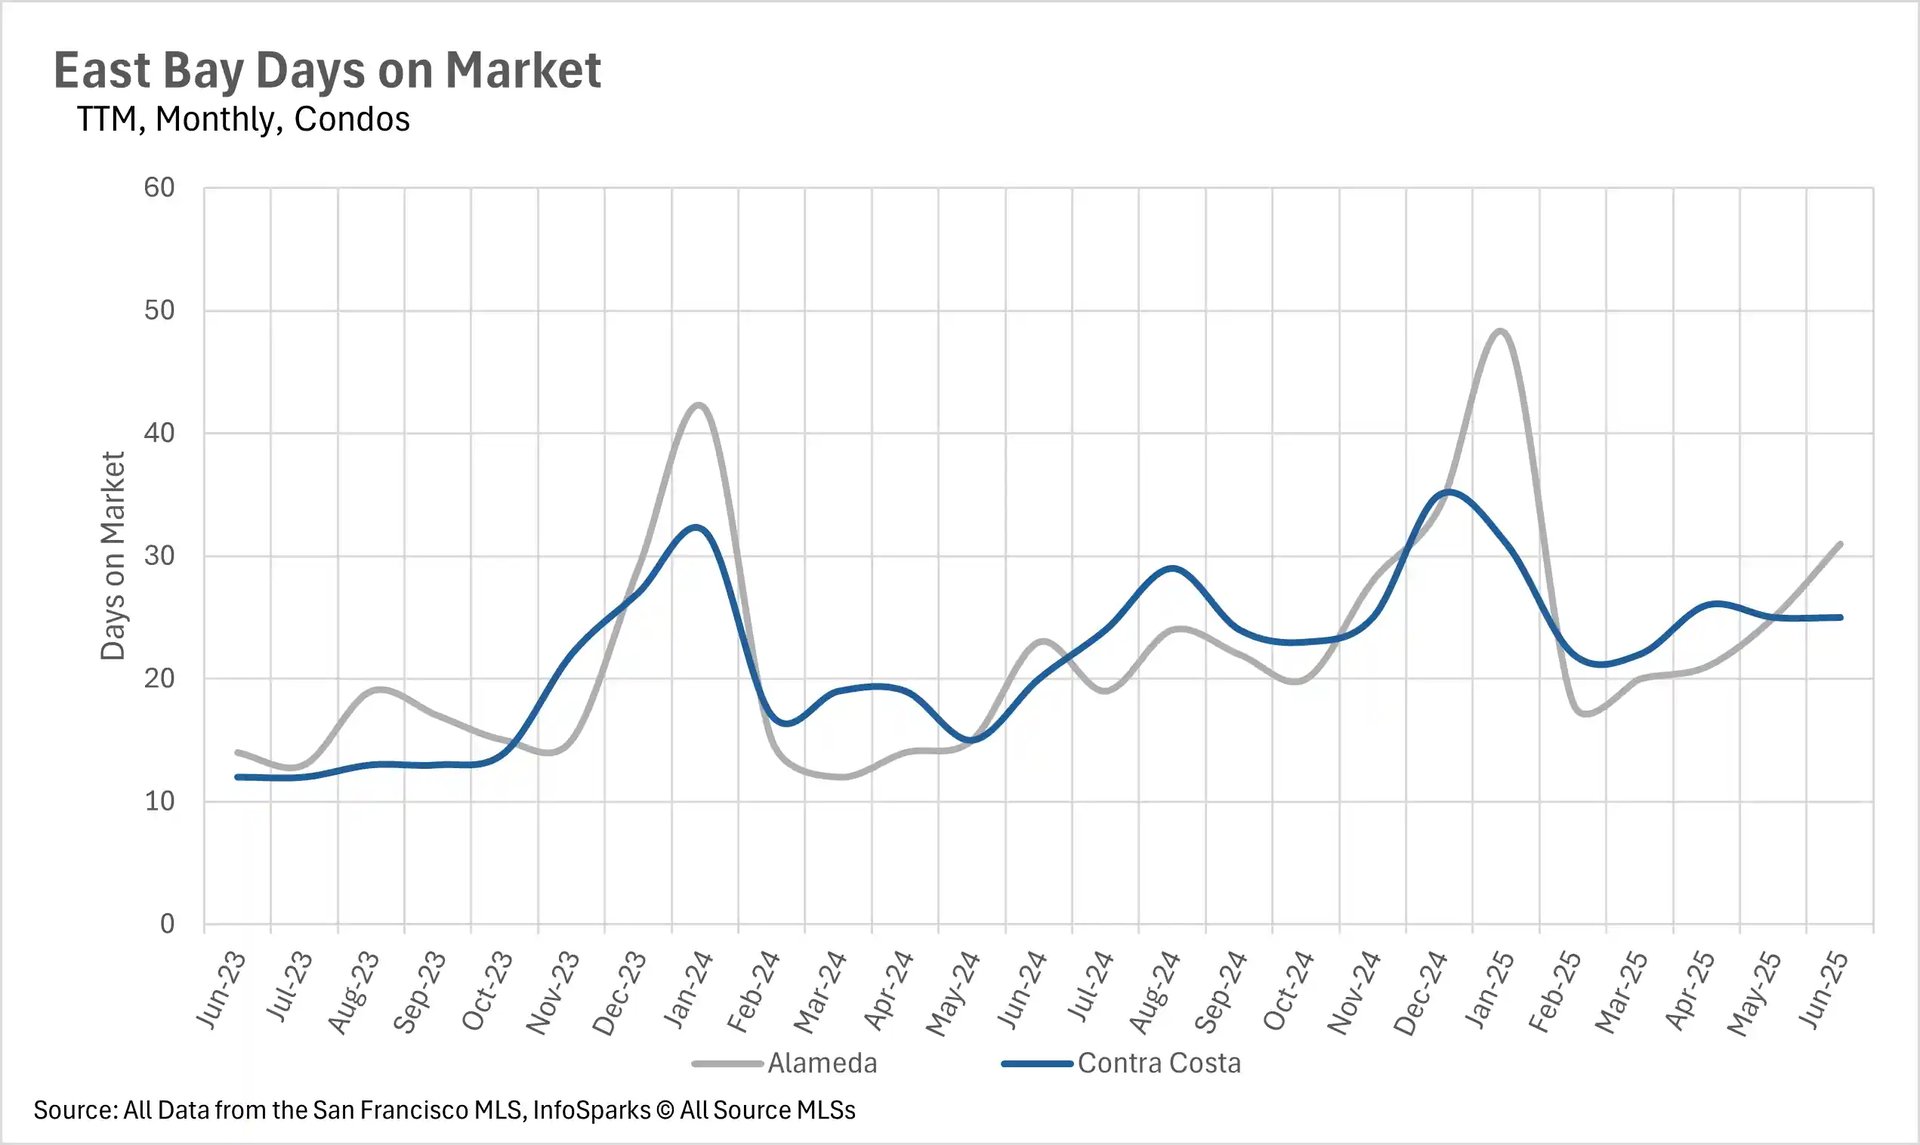
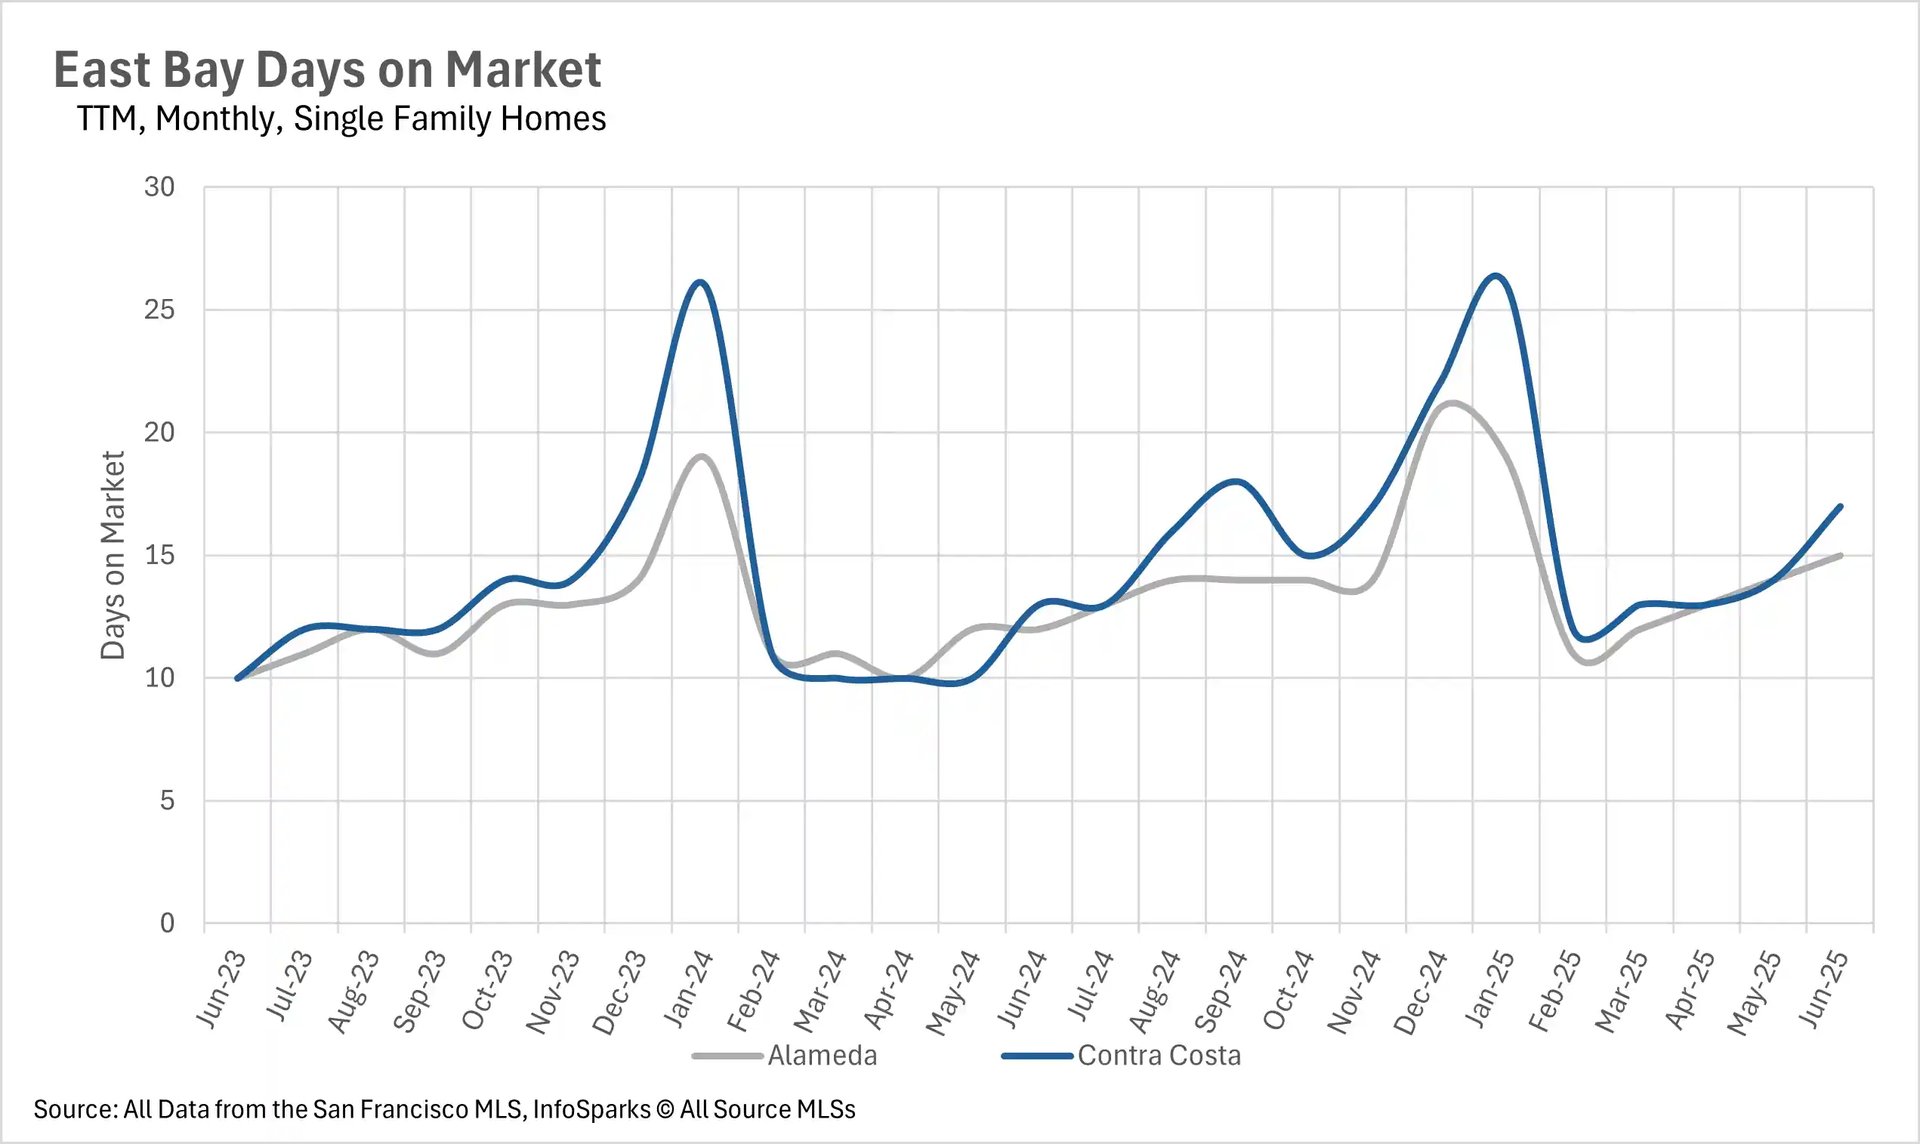
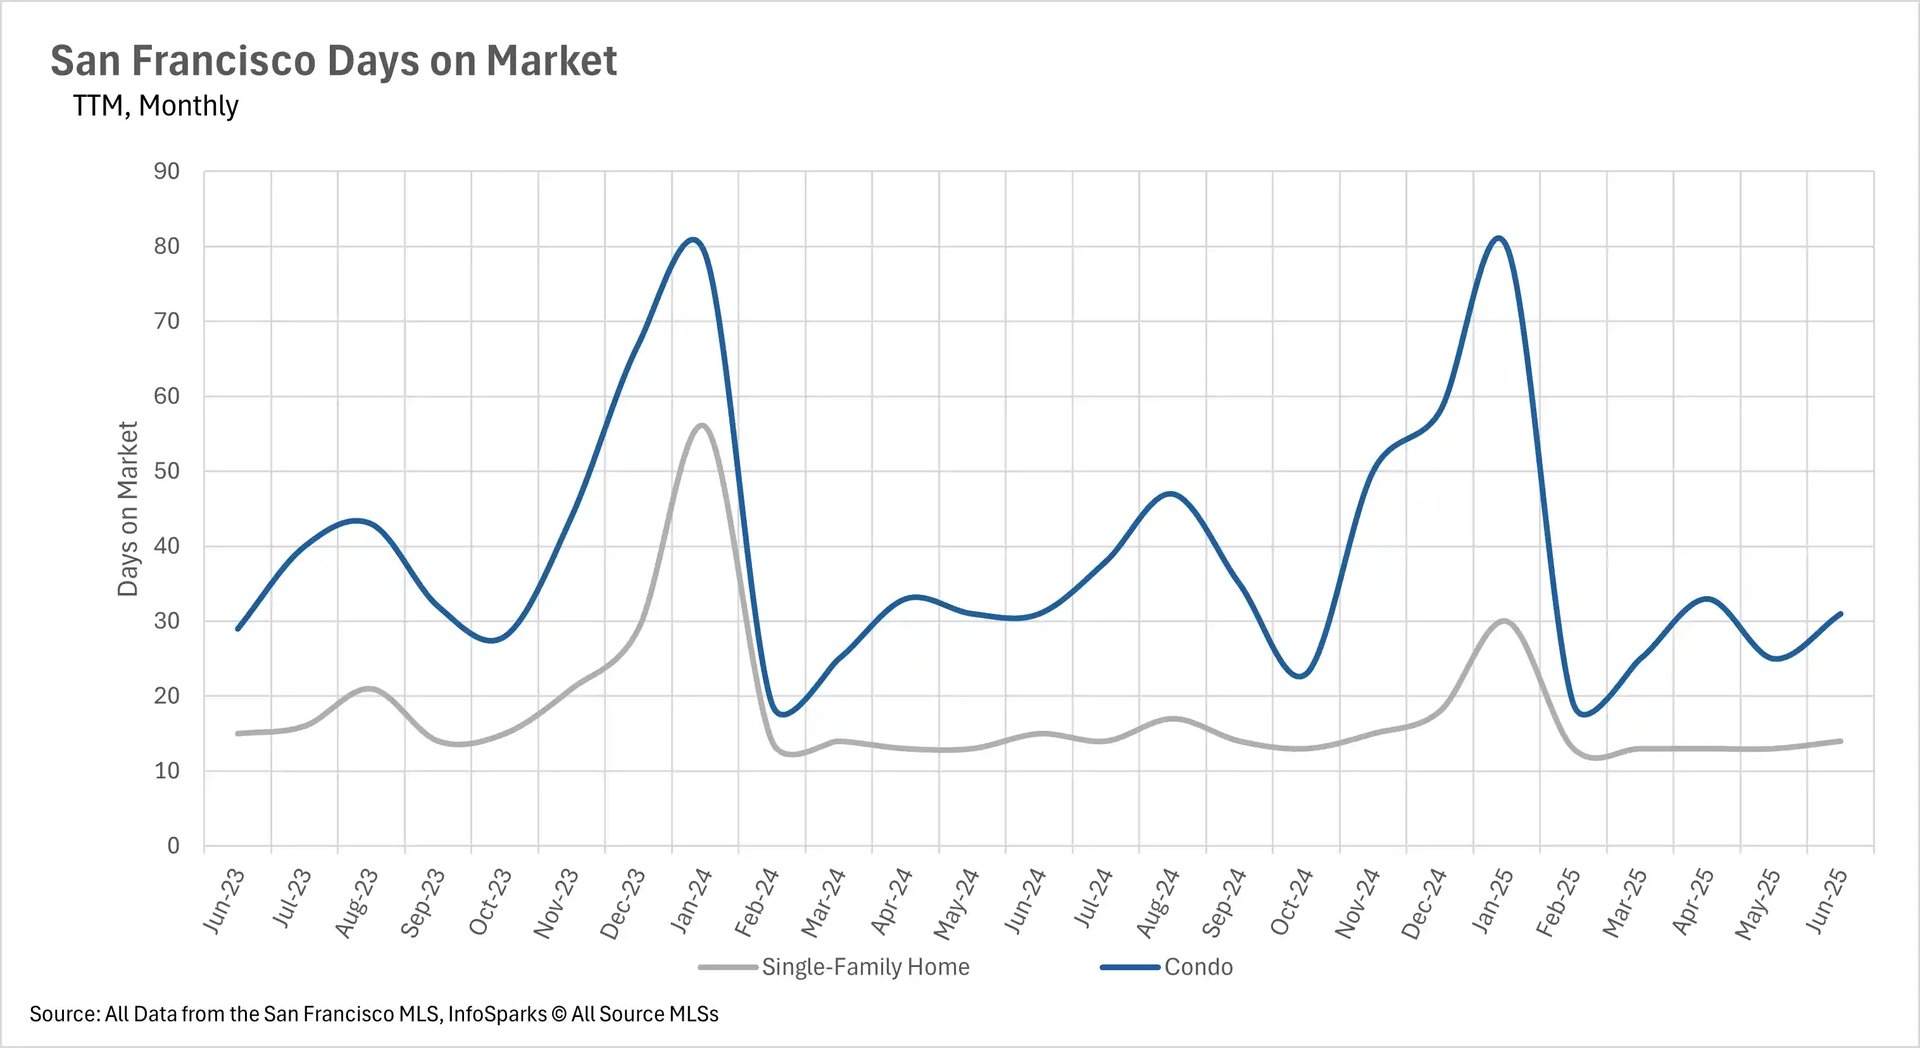
Days on market increase dramatically despite inventory declines

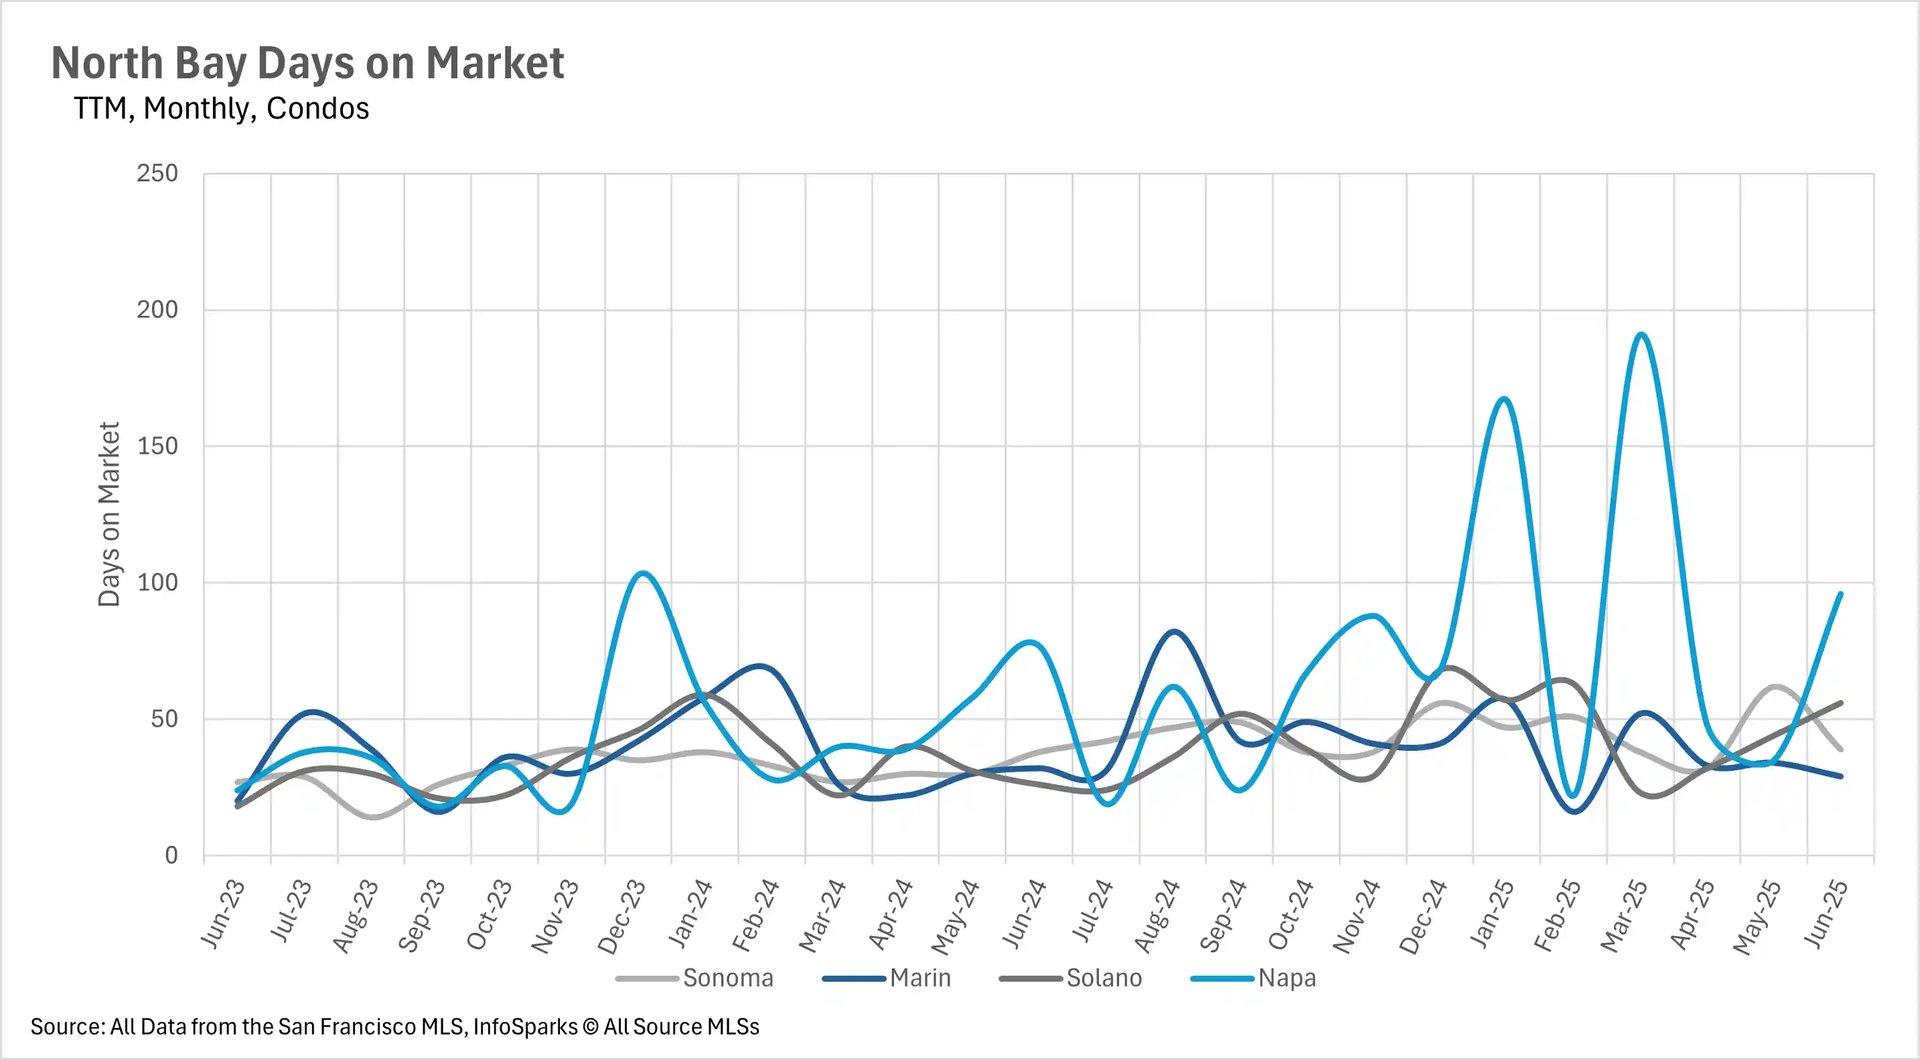
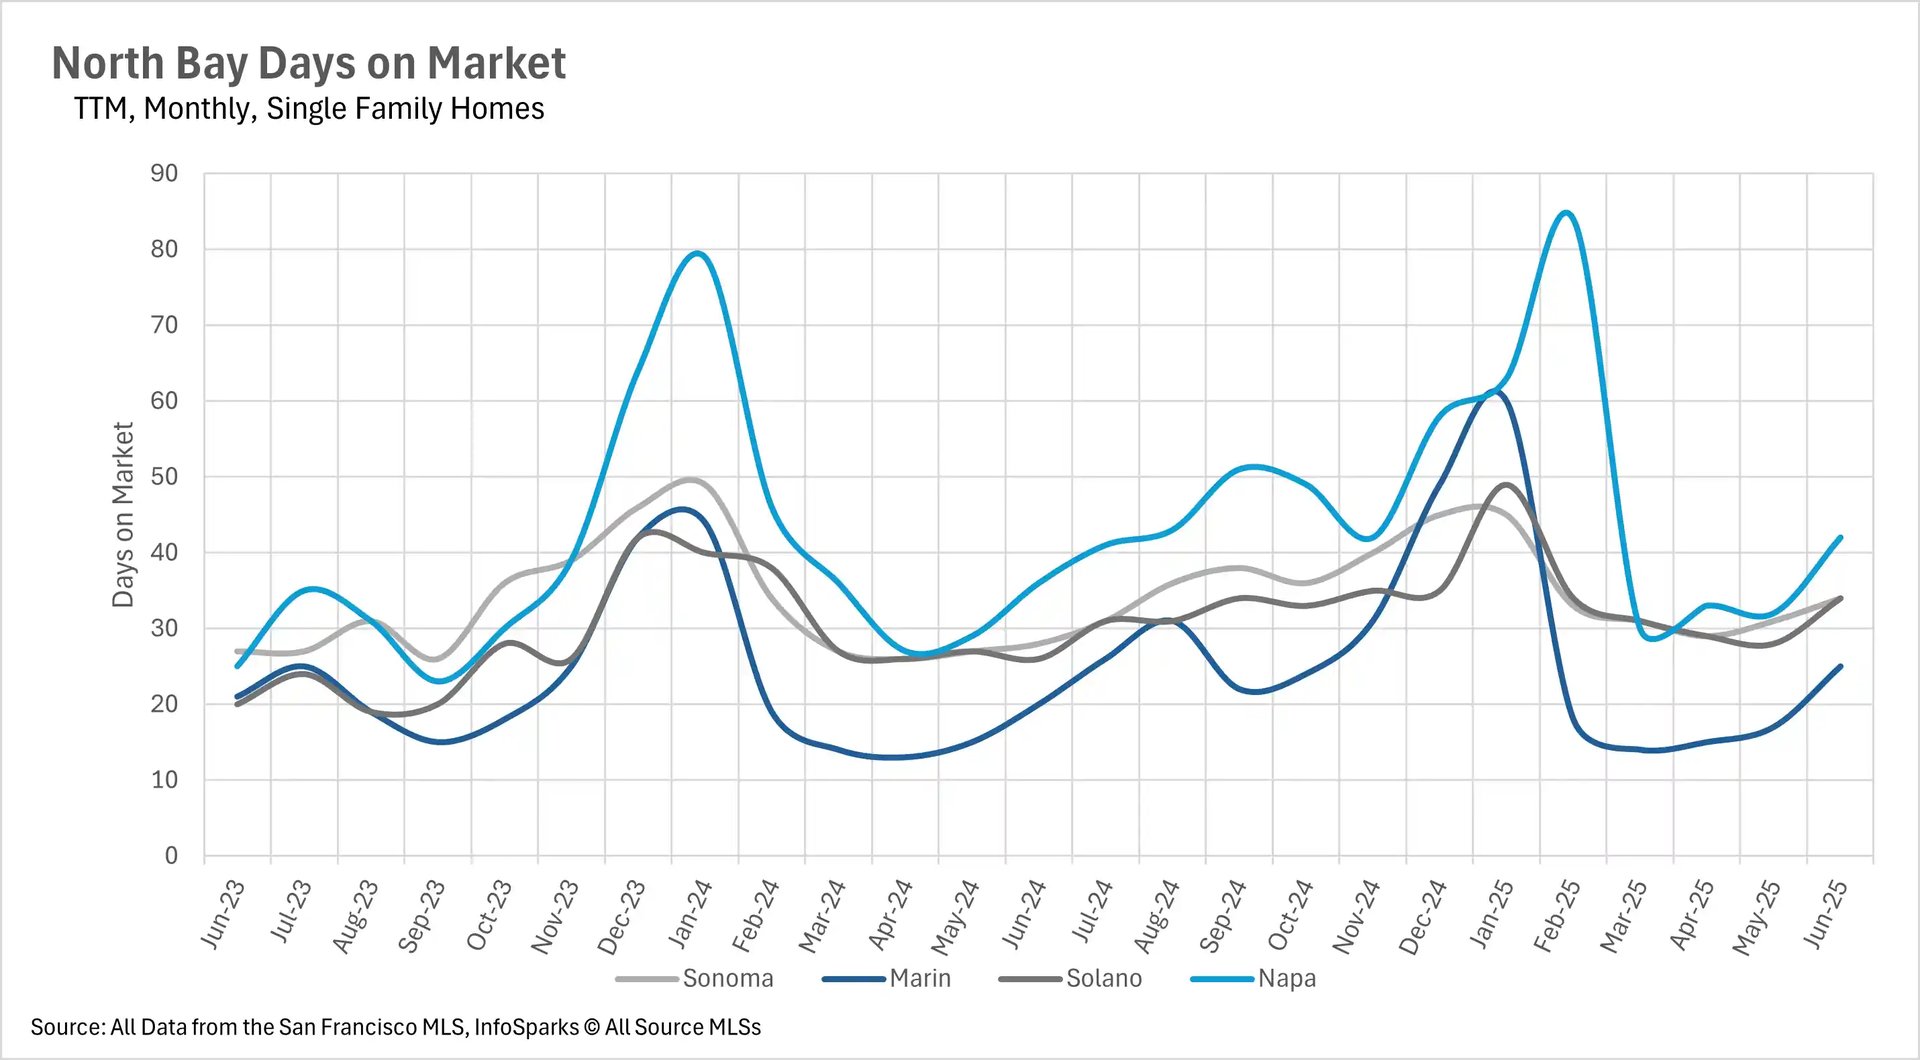
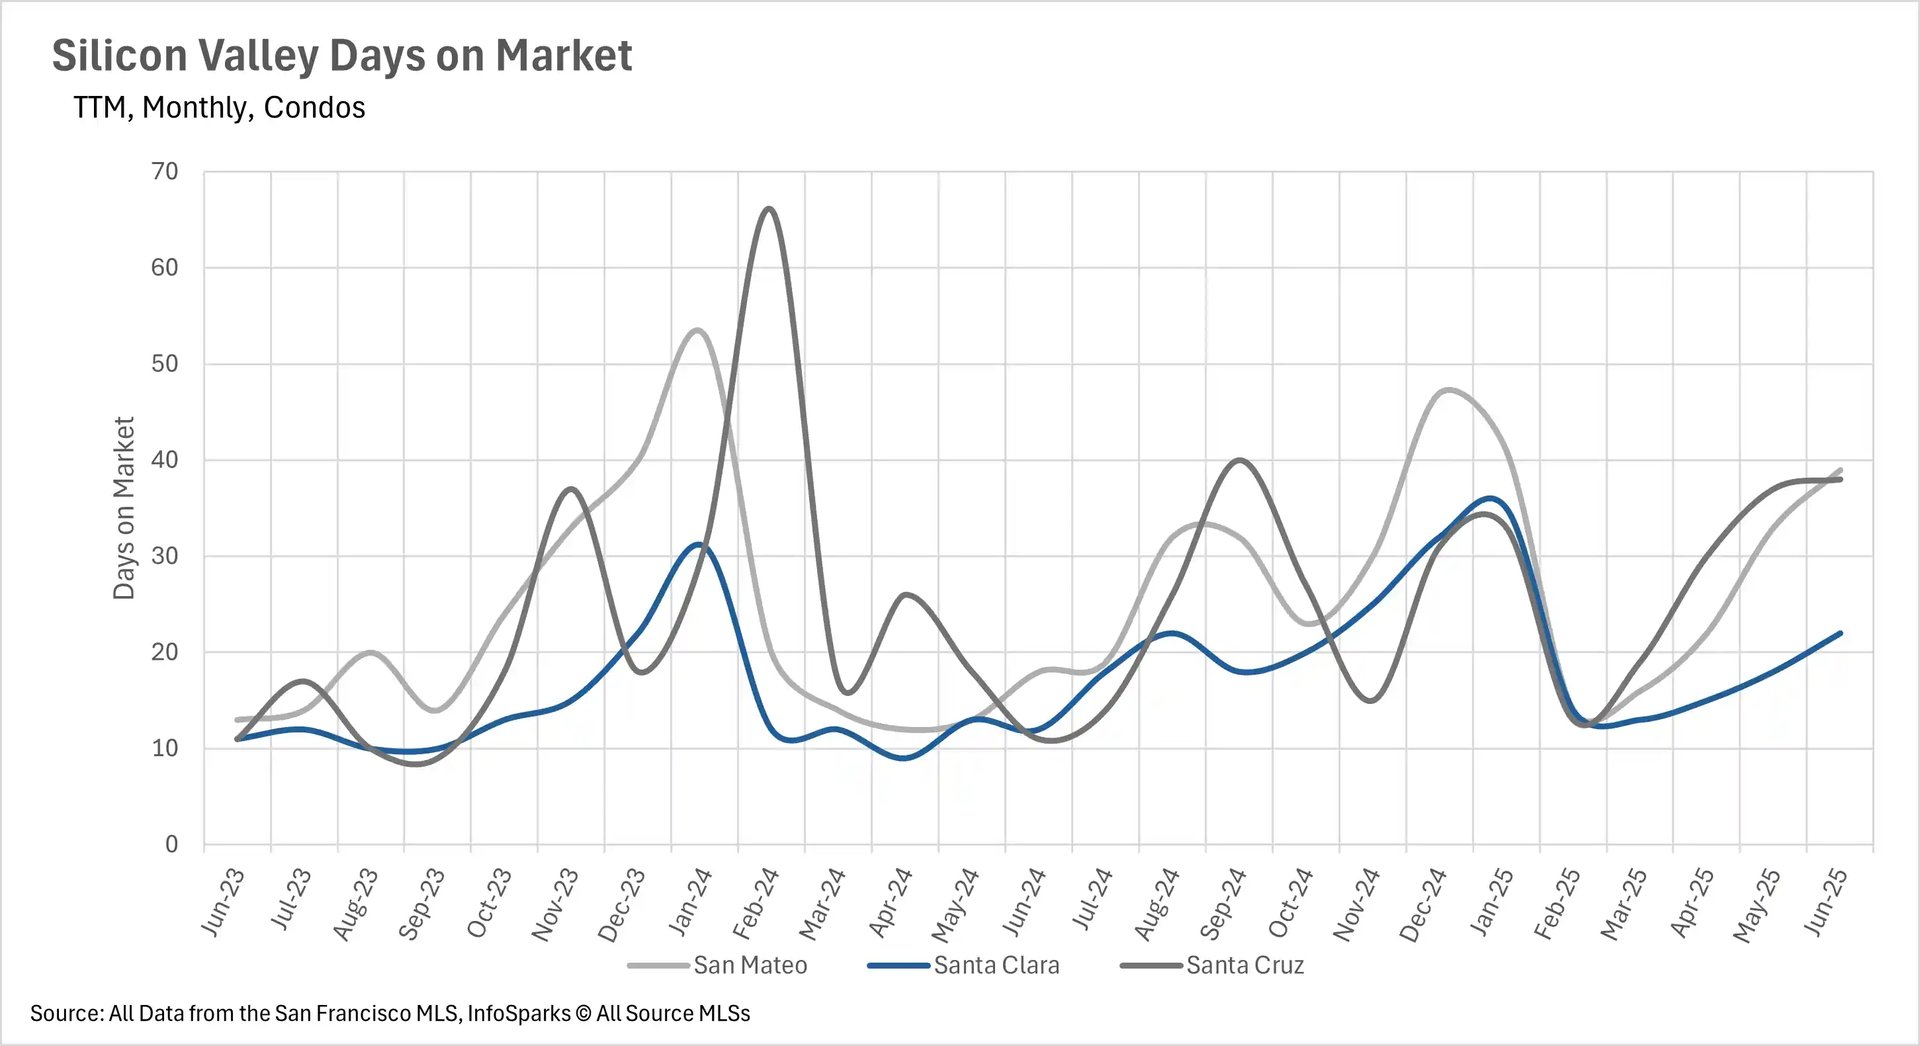
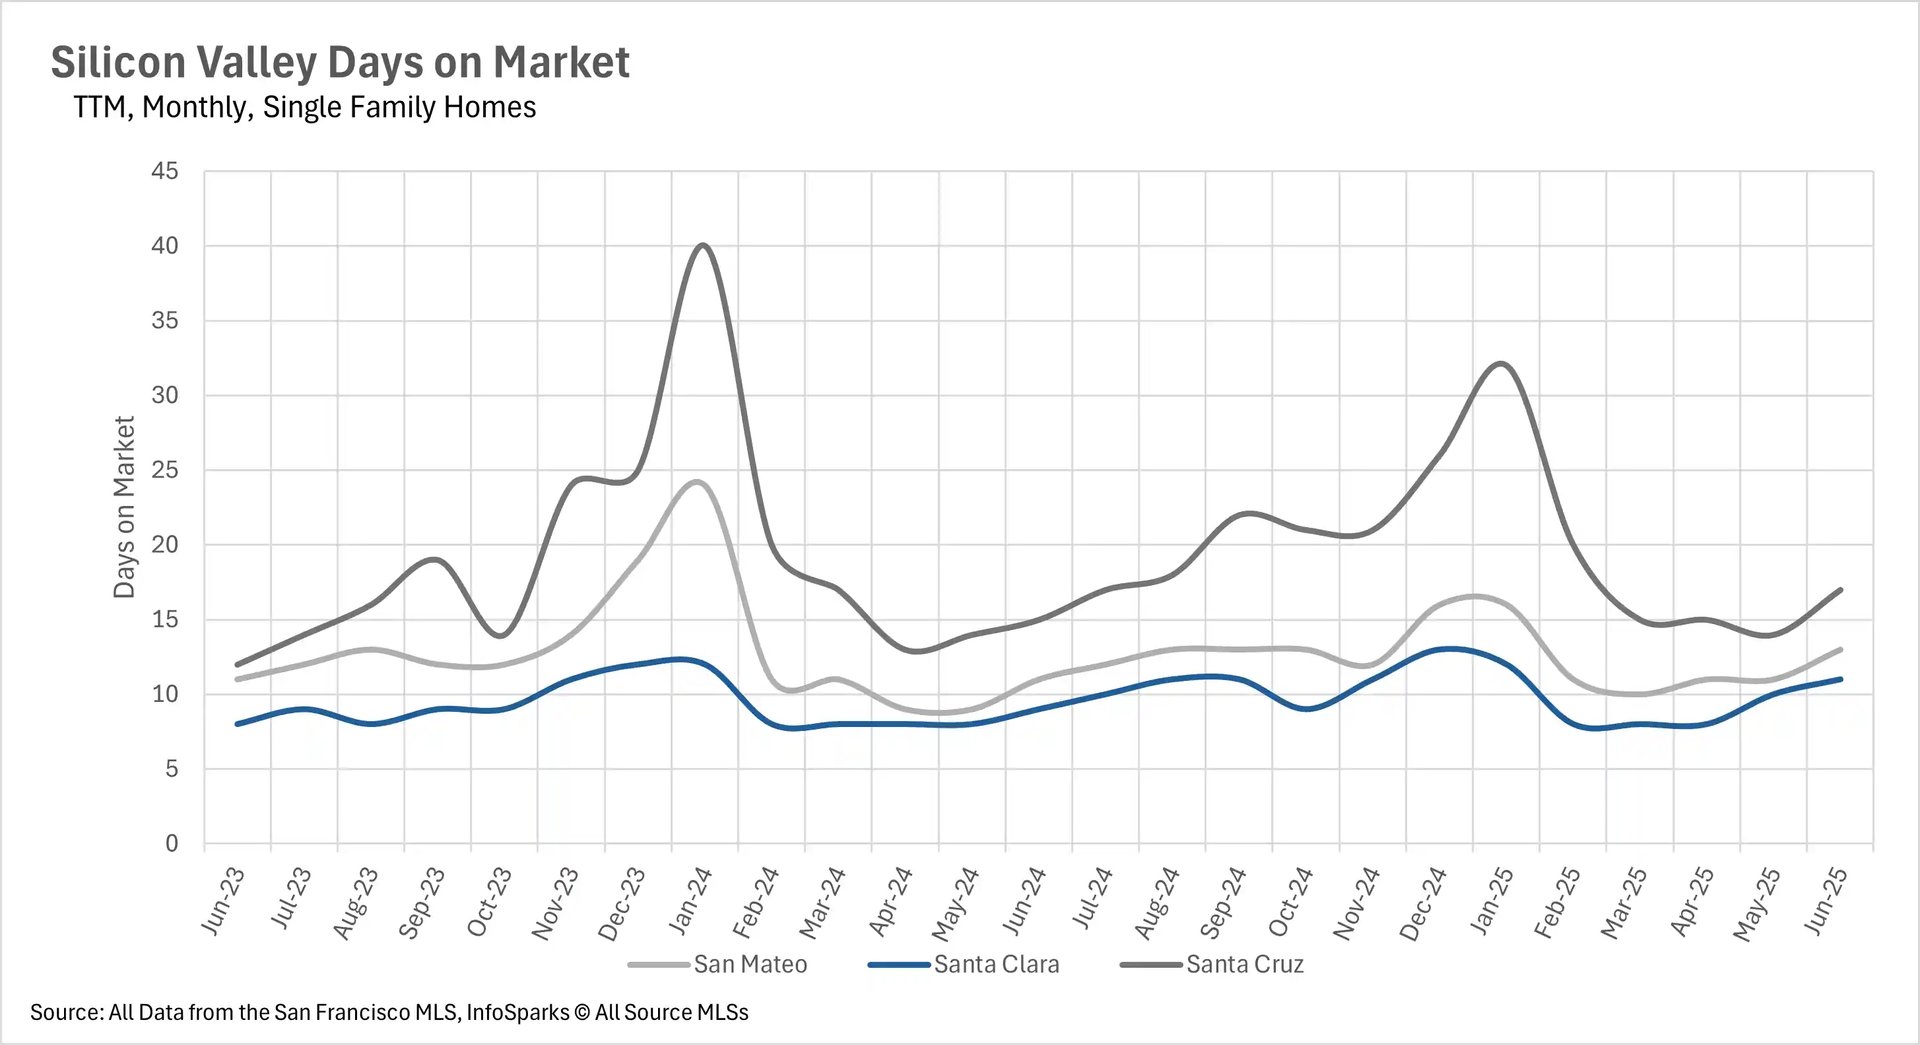
One of the most striking trends in June was the significant increase in days on market across all Bay Area regions, despite the substantial inventory declines. The North Bay saw the most consistent pattern with single-family homes spending 21.43% longer on market in Sonoma County, 25% longer in Marin County, 30.77% longer in Solano County, and 16.67% longer in Napa County year-over-year. Silicon Valley's condo market experienced the most dramatic increases, with Santa Cruz County condos spending 245.45% more time on market, San Mateo County condos up 116.67%, and Santa Clara County condos increasing 83.33%.

Even San Francisco, typically the Bay Area's fastest-moving market, saw single-family homes take 14 days on average (down 6.67% from last year) while condos remained flat at 31 days. The East Bay showed more modest but still significant increases of 25-35% more time on market year-over-year, though absolute numbers remained relatively quick with single-family homes selling in 15-17 days and condos in 25-31 days. This pattern suggests that while inventory is declining, buyer selectivity is increasing, creating a more deliberate purchasing environment.

Market dynamics increasingly favor property type over geography

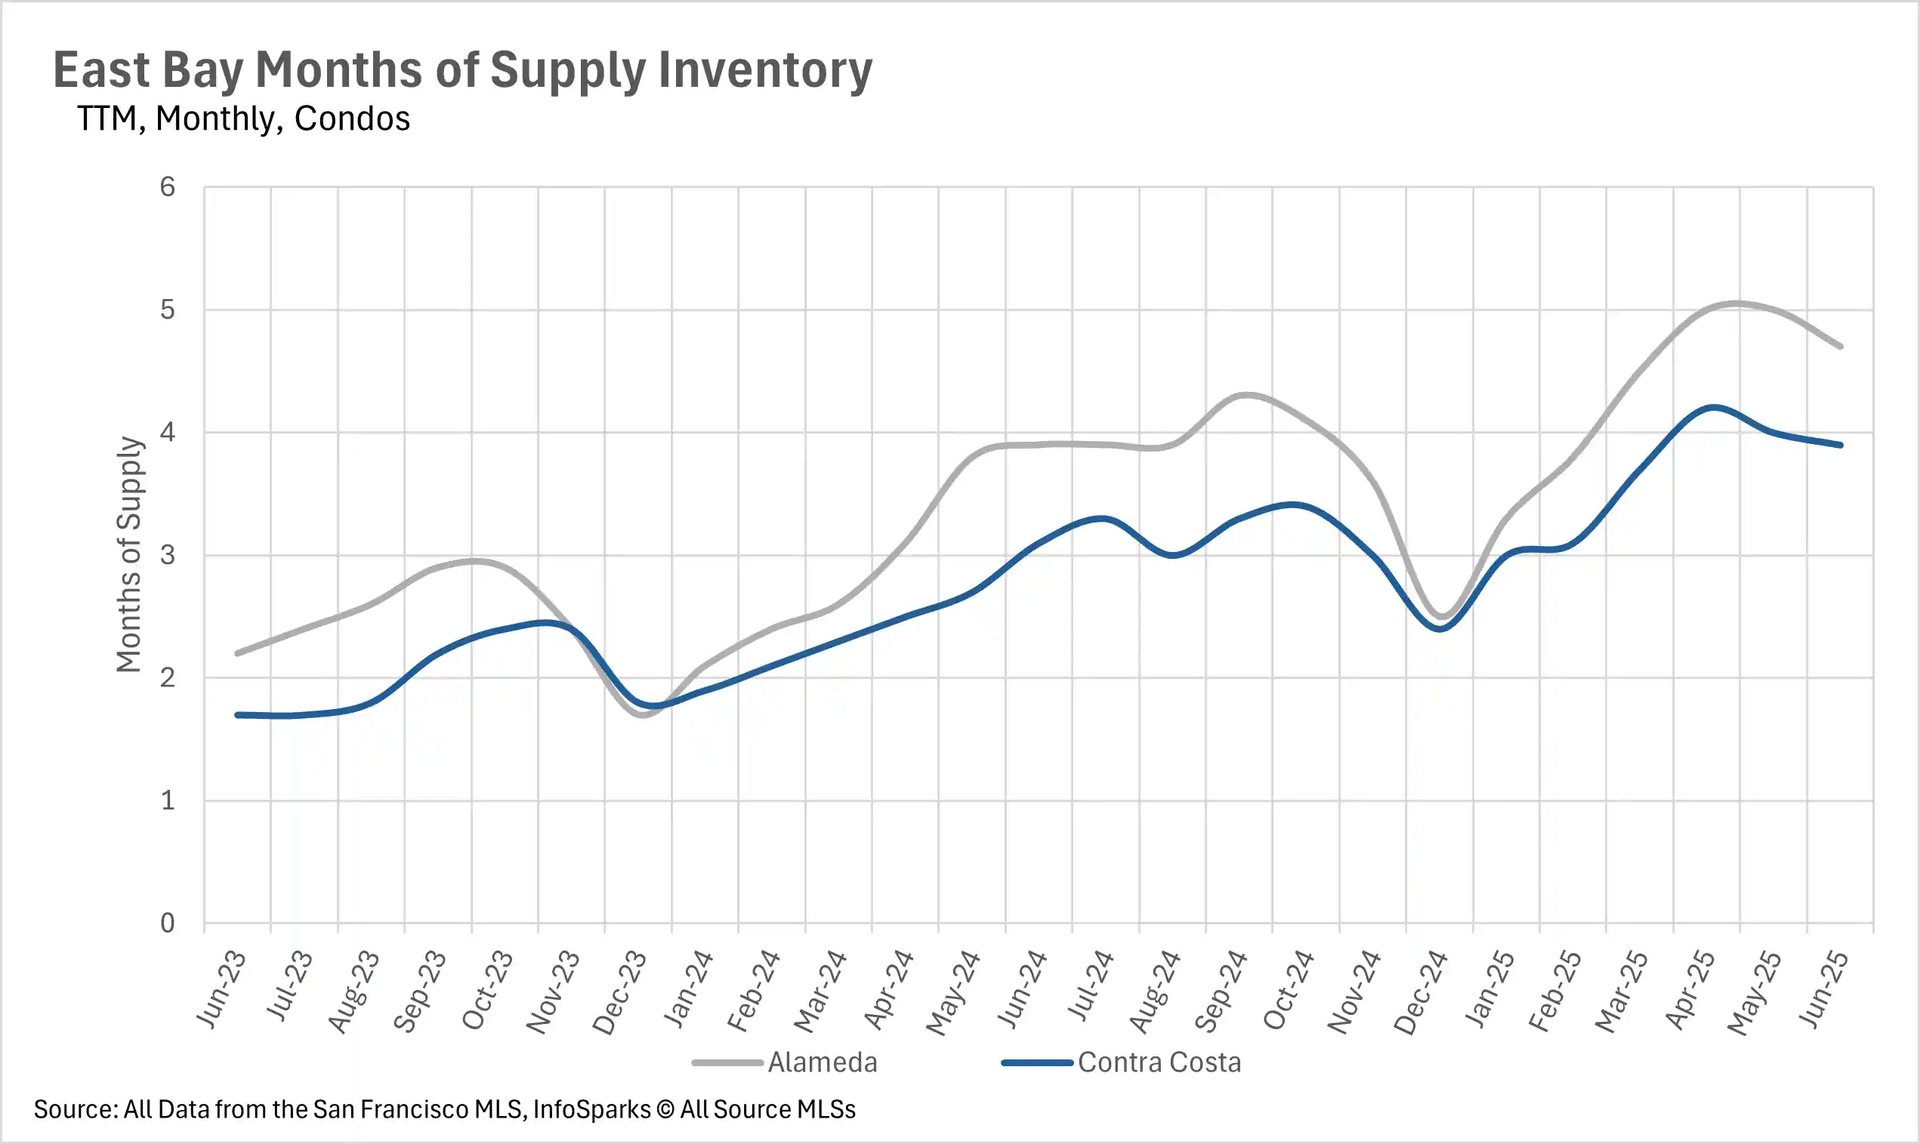
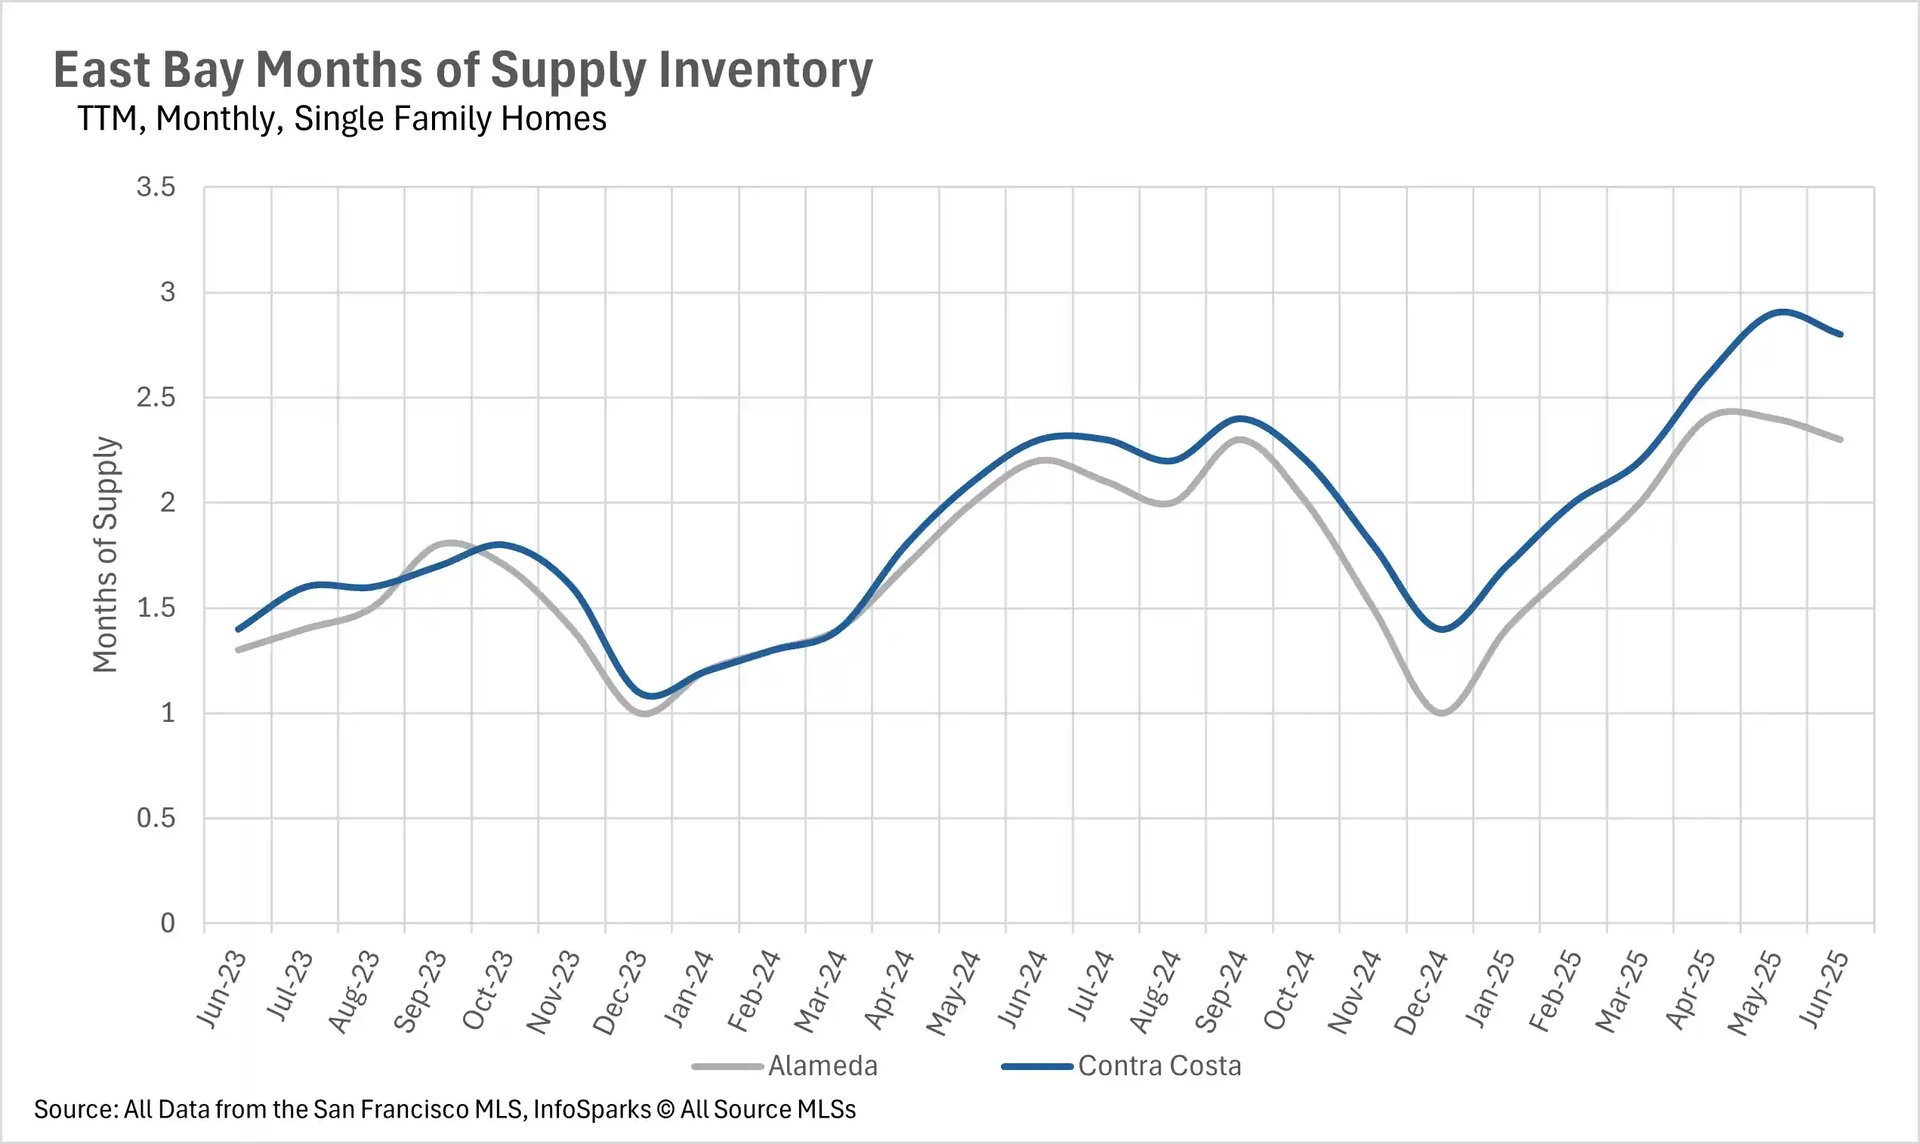
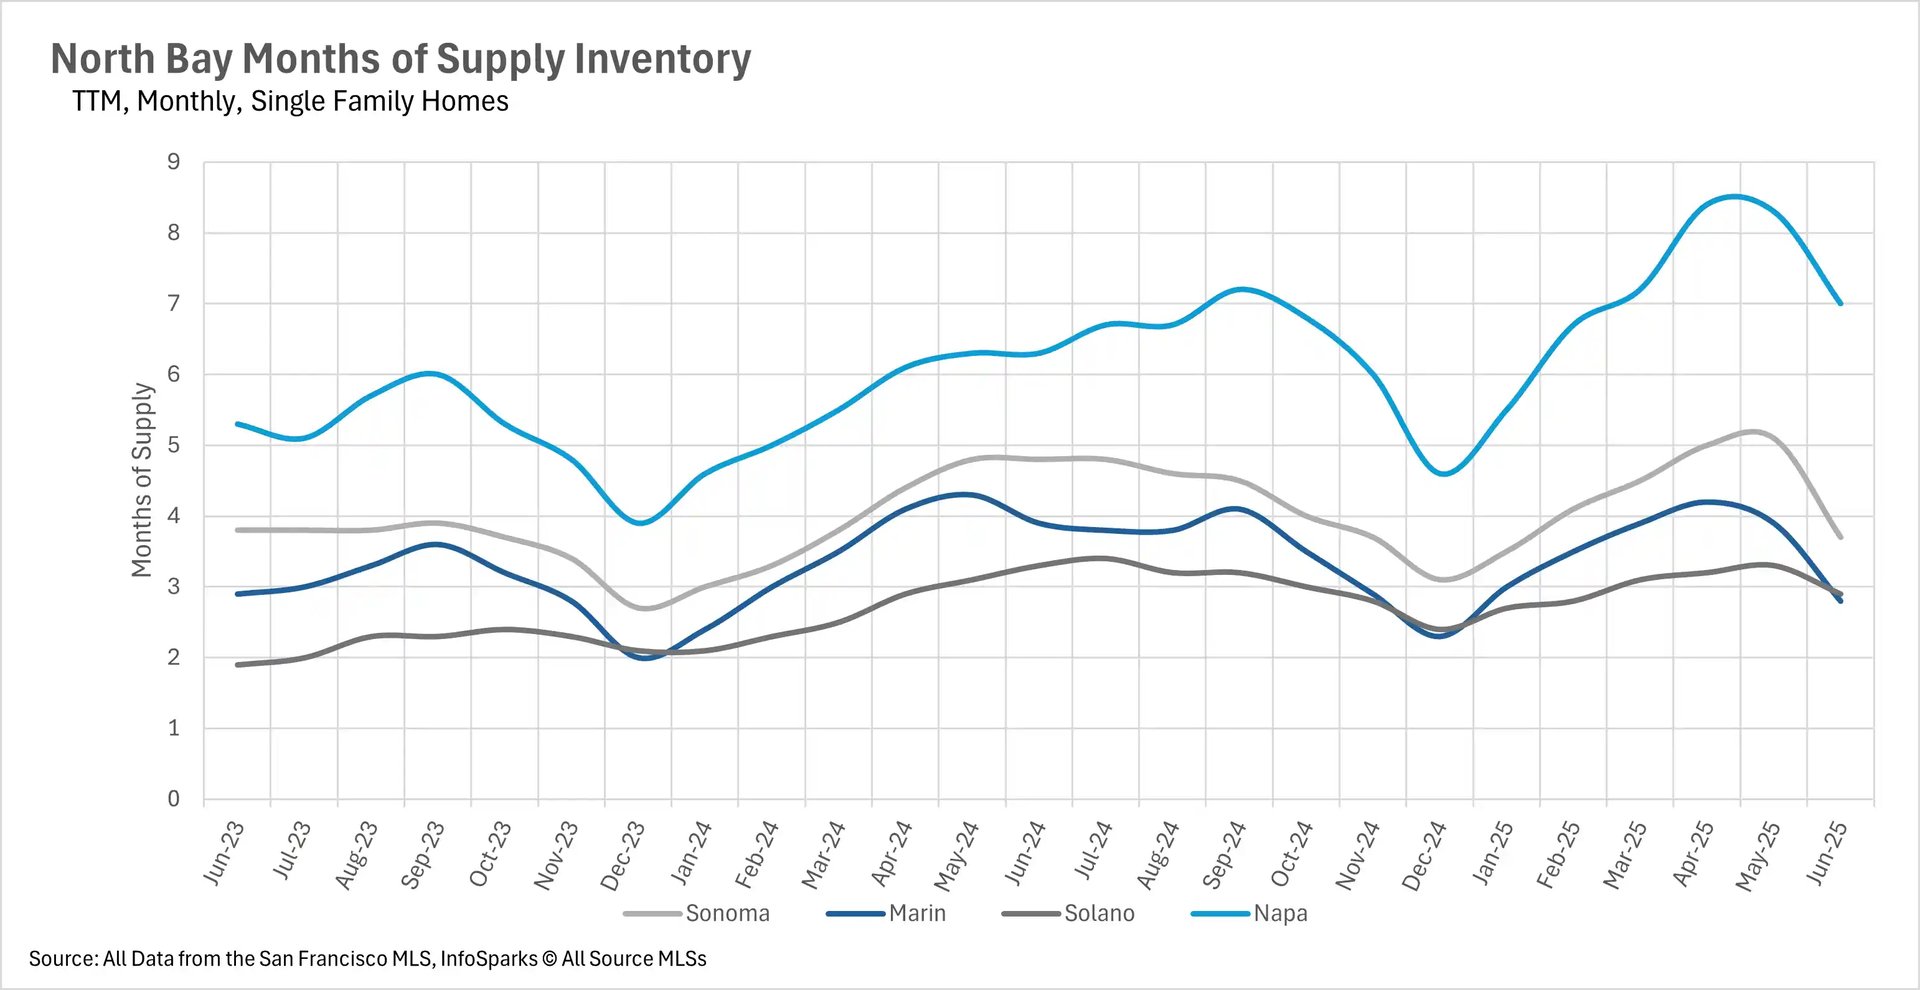
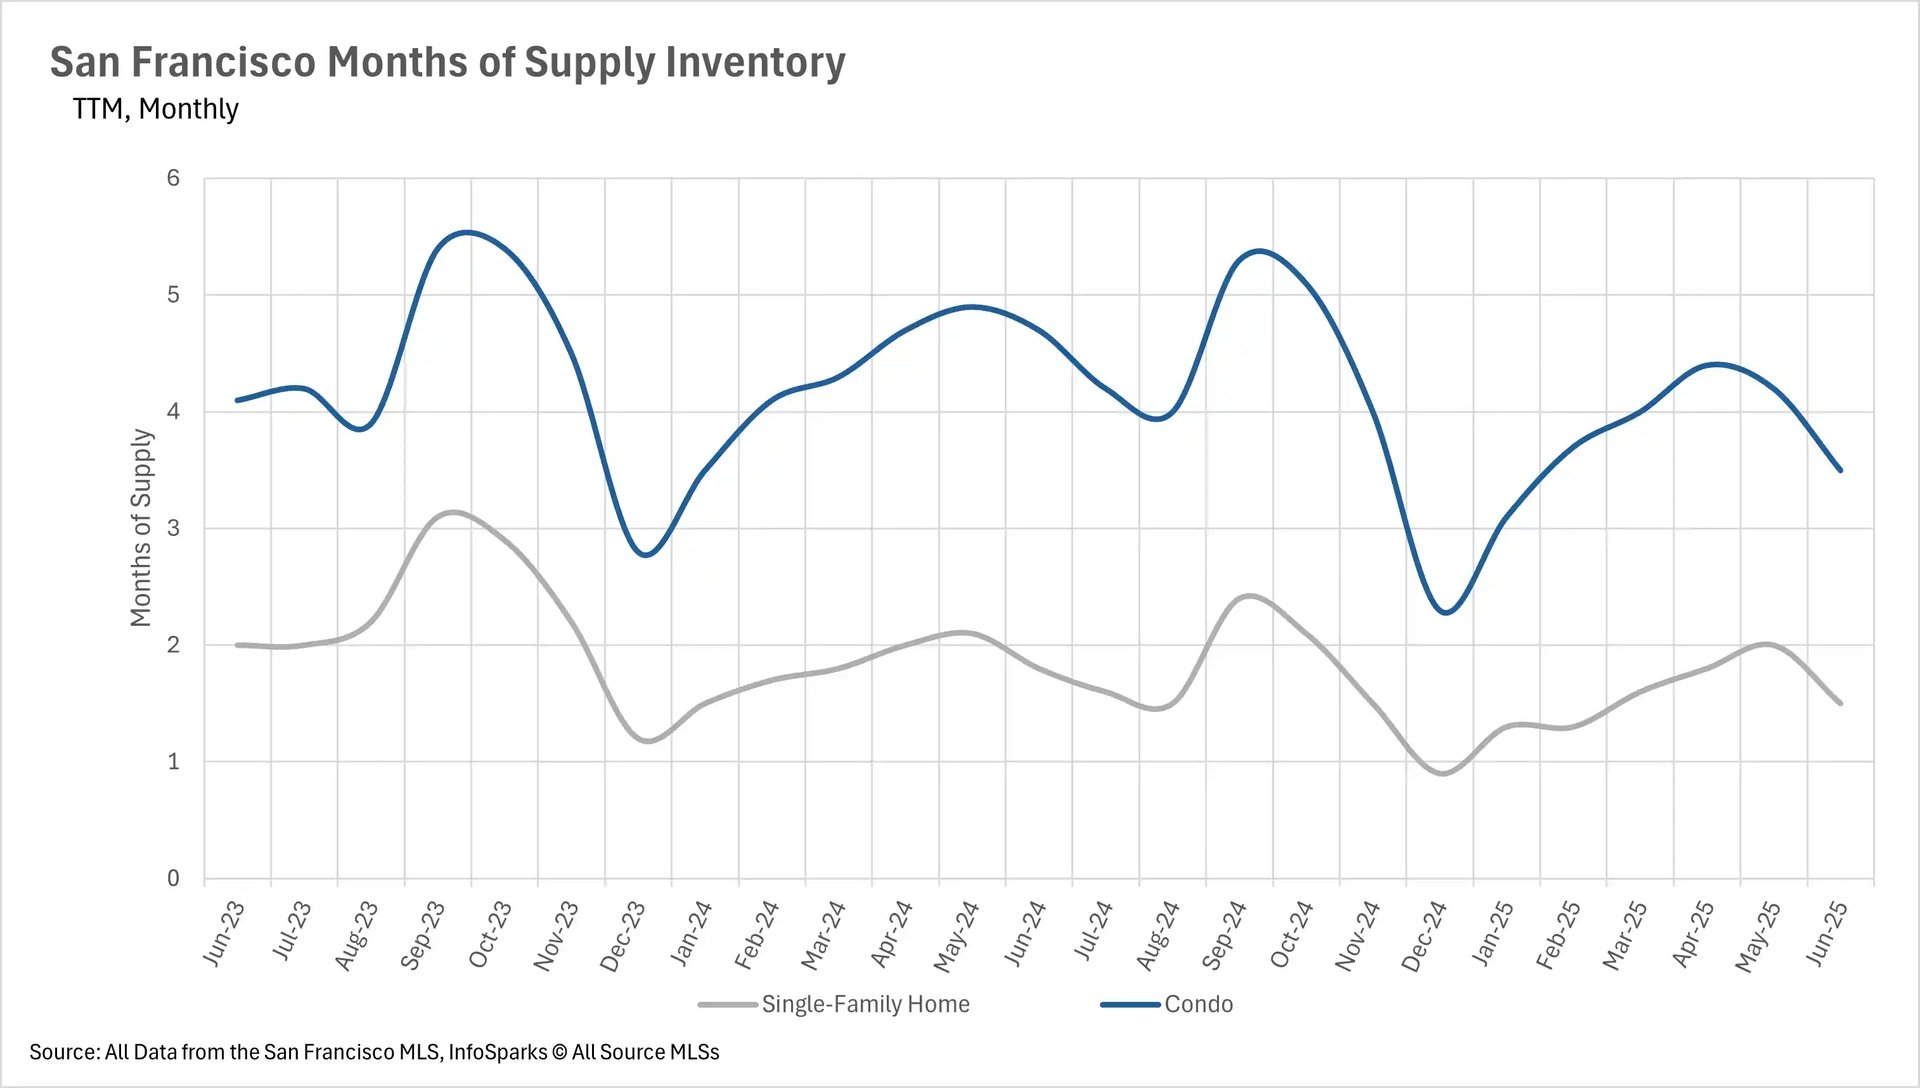
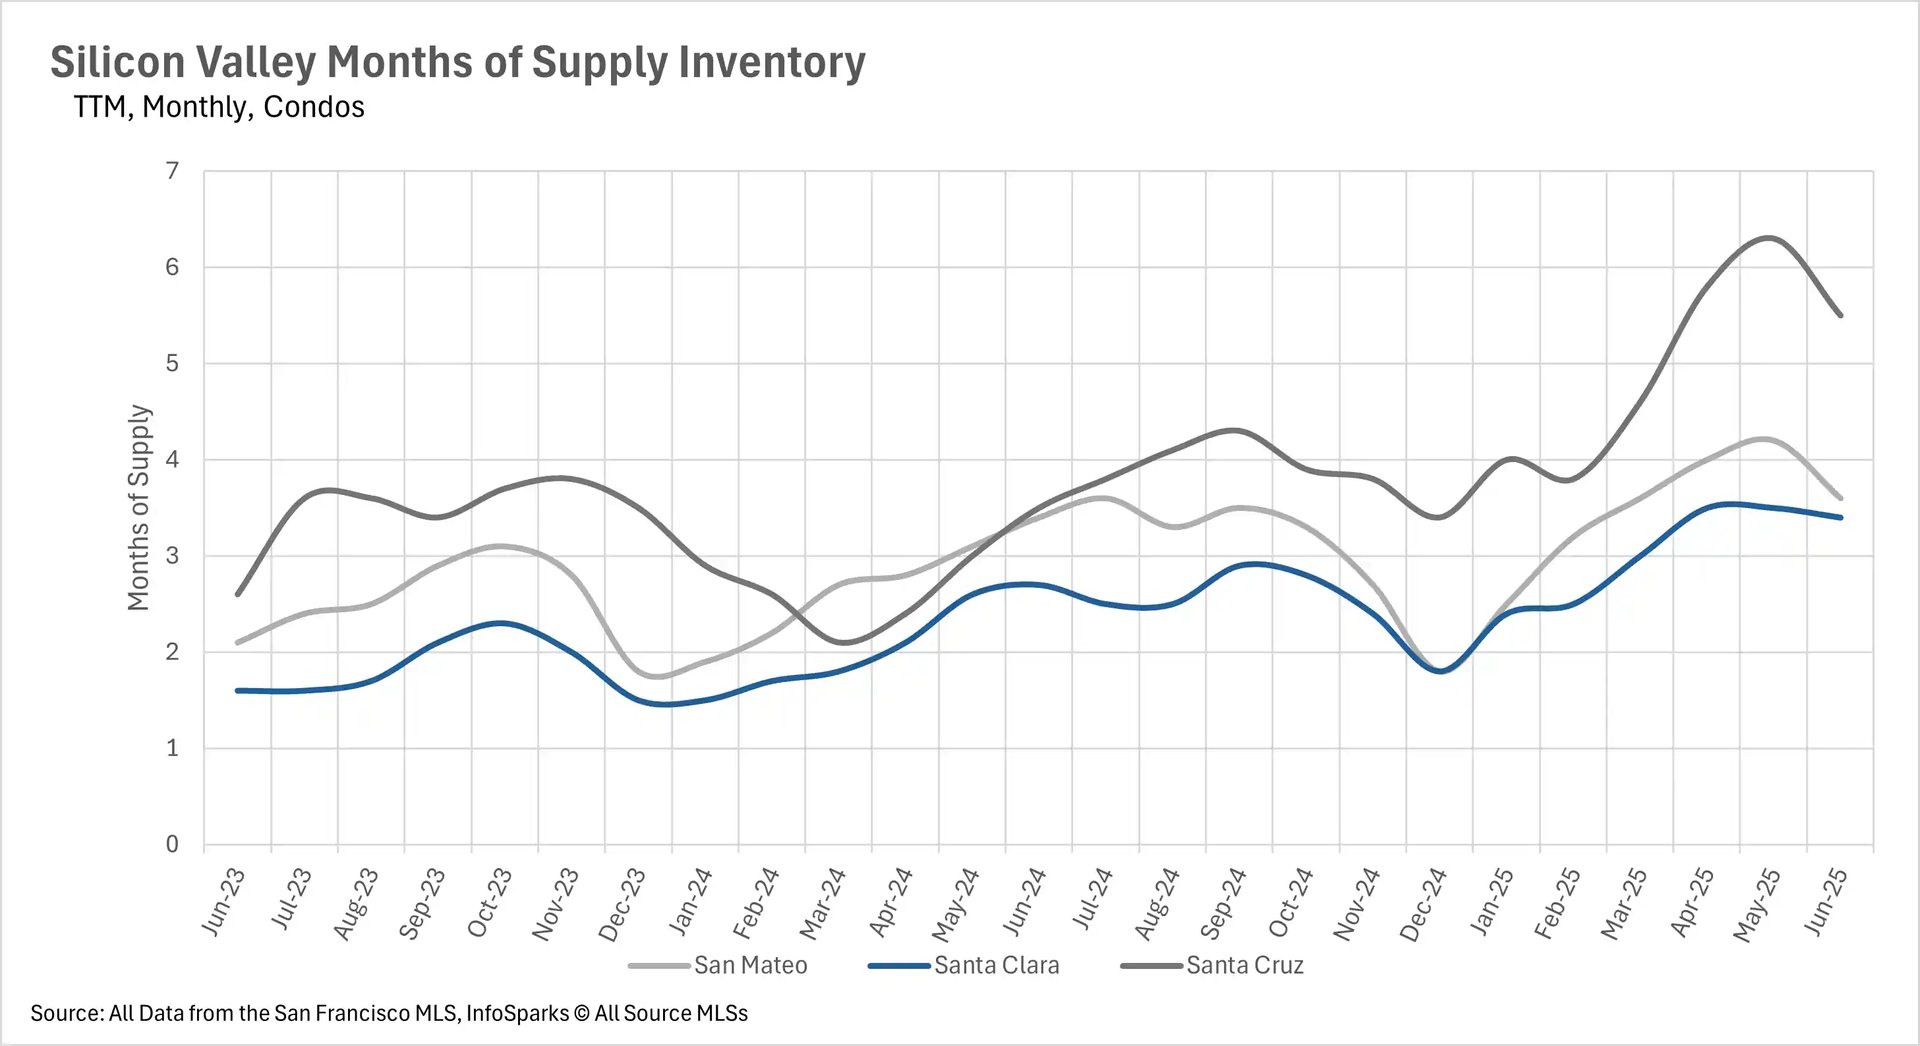
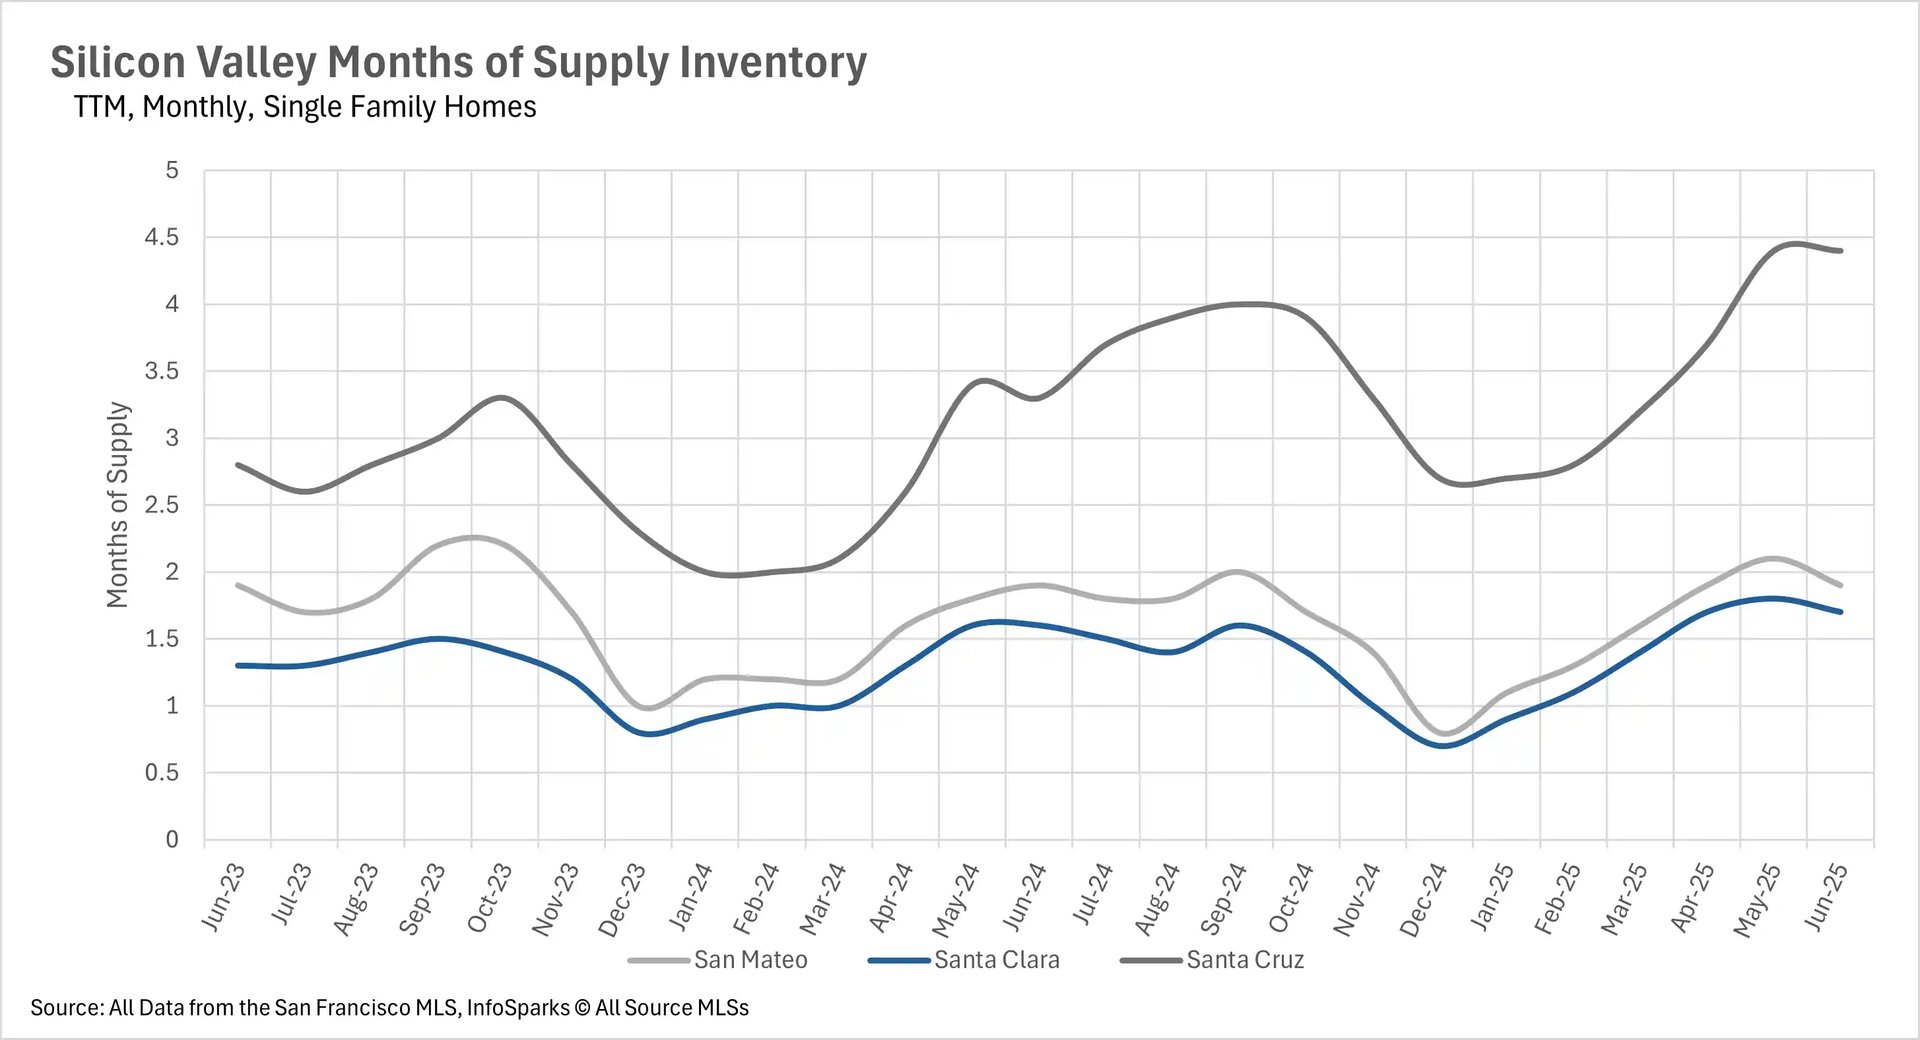
The months of supply inventory metric reveals a consistent Bay Area-wide pattern where single-family homes remain in seller's market territory while condos have shifted decisively toward buyer's markets. San Francisco exemplifies this trend with single-family homes at just 1.5 months of supply (strong seller's market) while condos sit at 3.5 months (buyer's market). Silicon Valley shows San Mateo and Santa Clara Counties maintaining seller's markets for single-family homes at 1.9 and 1.7 months respectively, while all three Silicon Valley counties present buyer's markets for condos ranging from 3.4 to 5.5 months of supply.

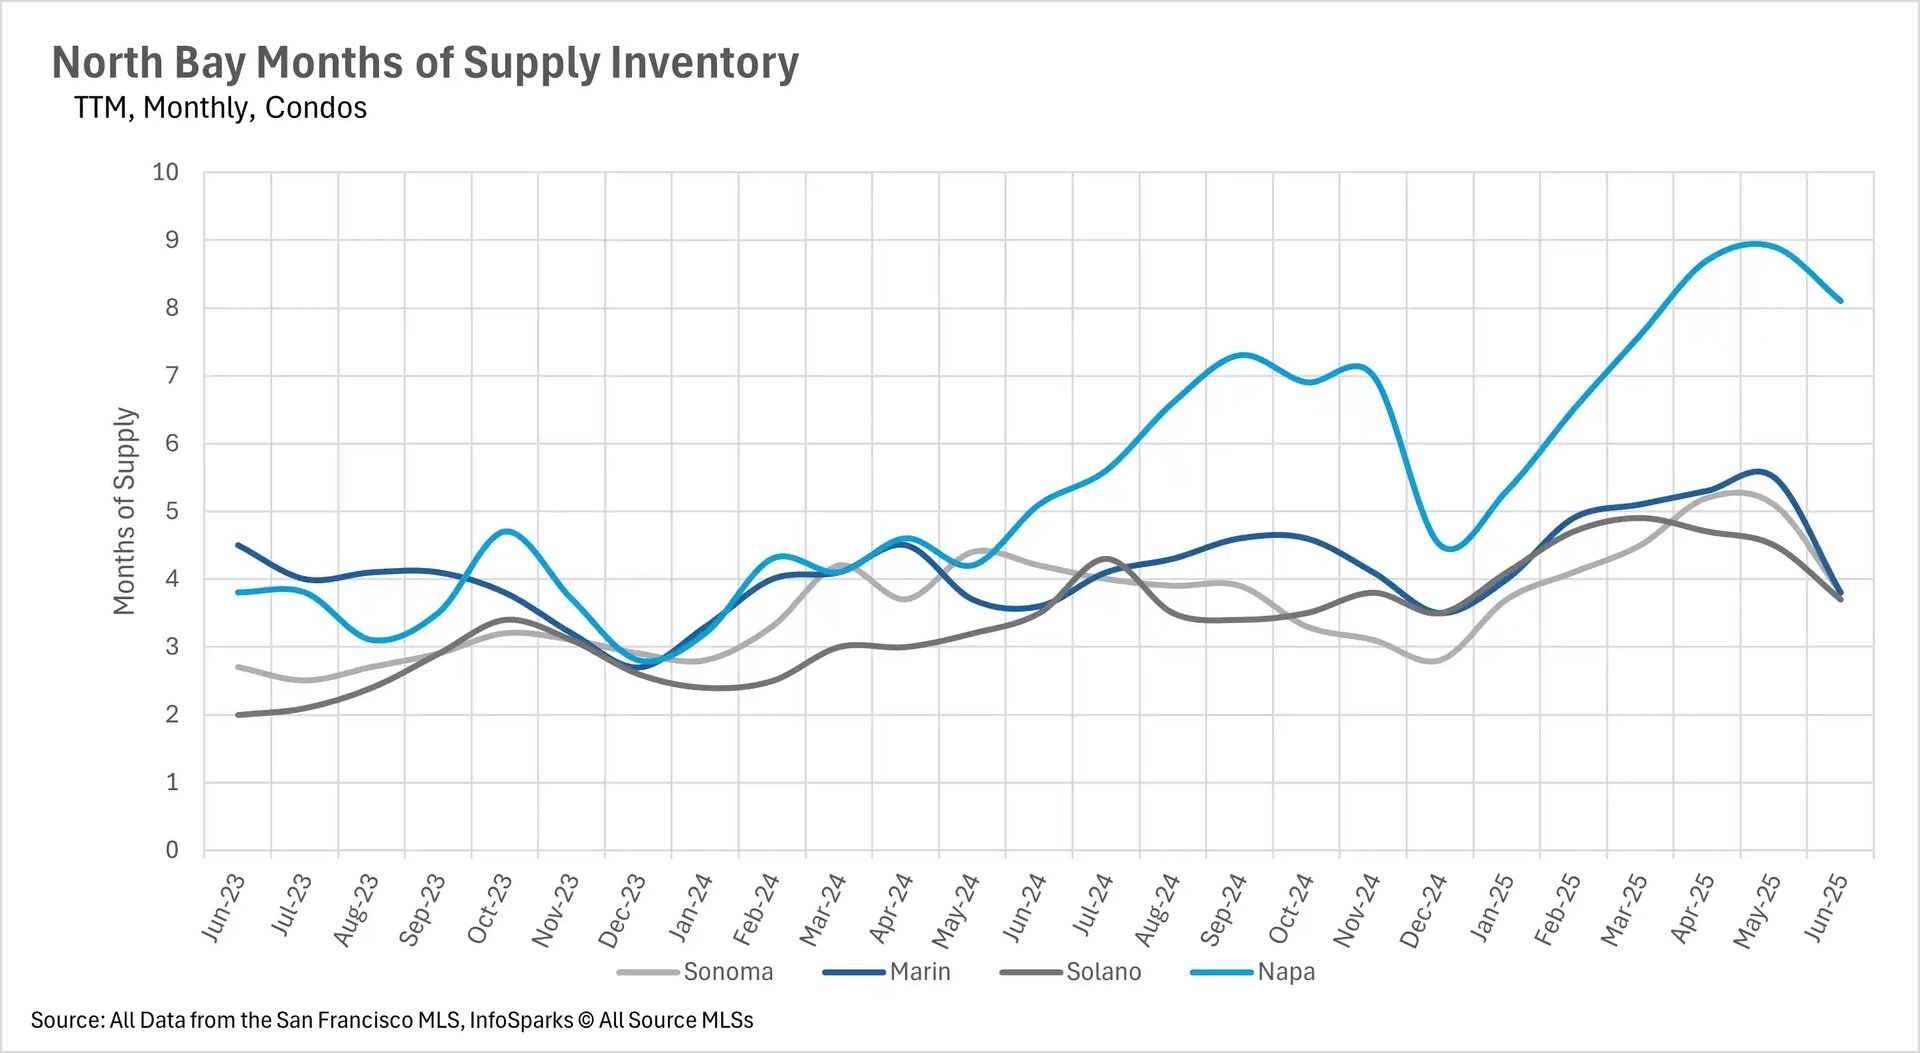
The East Bay maintains its traditional split with single-family homes at 2.3 months in Alameda and 2.8 months in Contra Costa (seller's markets), while condos favor buyers with 4.7 and 3.9 months respectively. The North Bay shows the most variation, with Marin and Solano Counties approaching balanced markets for single-family homes at 2.8 and 2.9 months, while Sonoma (3.7 months) and Napa (7 months) favor buyers. However, all North Bay counties present buyer's markets for condos, with Napa County showing an extreme 8.1 months of condo supply. This pattern suggests that across the Bay Area, single-family homes retain their premium status and seller advantage, while the condo market presents increasingly attractive opportunities for buyers willing to navigate longer timelines and more inventory choices.

Local Lowdown Data

Line chart showing East Bay condo days on market (TTM, monthly) for Alameda and Contra Costa from June 2023 to June 2025, generally between 10 and 48 days.

Line chart showing East Bay single-family home days on market (TTM, monthly) for Alameda and Contra Costa from June 2023 to June 2025, generally between 10 and 26 days.

Bar and line chart showing East Bay condo inventory (New Listings, Sold Listings, For Sale) from June 2023 to June 2025. For Sale inventory increased over the period.

Bar and line chart showing East Bay single-family home inventory (New Listings, Sold Listings, For Sale) from June 2023 to June 2025. For Sale inventory generally increased over the period.

Bar chart showing East Bay median condo price changes (TTM, year-over-year) for Alameda and Contra Costa from July 2024 to June 2025, showing mixed and then negative growth.

Line chart showing East Bay median condo prices (monthly, three-year) for Alameda and Contra Costa from June 2022 to June 2025, generally between $400K and $700K.

Bar chart showing East Bay median single-family home price changes (TTM, year-over-year) for Alameda and Contra Costa from July 2024 to June 2025, showing initial positive then negative growth.

Line chart showing East Bay median single-family home prices (monthly, three-year) for Alameda and Contra Costa from June 2022 to June 2025, generally between $750K and $1.4M.

Line chart showing East Bay condo months of supply inventory (TTM, monthly) for Alameda and Contra Costa from June 2023 to June 2025, increasing from under 2 to over 5 months.

Line chart showing East Bay single-family home months of supply inventory (TTM, monthly) for Alameda and Contra Costa from June 2023 to June 2025, increasing from under 1.5 to nearly 3 months.

Line graph showing North Bay Days on Market for Condos (TTM, Monthly) across Sonoma, Marin, Solano, and Napa counties from June 2023 to June 2025, with Napa generally showing higher days on market.

Line graph displaying North Bay Days on Market for Single Family Homes (TTM, Monthly) across Sonoma, Marin, Solano, and Napa counties from June 2023 to June 2025.

Bar and line chart illustrating North Bay Condo Inventory (Two Year, Monthly) showing New Listings, Sold Listings, and For Sale trends from June 2023 to June 2025.

Bar and line chart depicting North Bay Single-Family Homes Inventory (Two Year, Monthly) for New Listings, Sold Listings, and For Sale from June 2023 to June 2025.

Bar chart showing North Bay Median Condo Price Changes (TTM, Year-Over-Year) for Sonoma, Marin, Solano, and Napa counties from July 2024 to June 2025.

Line graph illustrating North Bay Median Condo Prices (Three-Year, Monthly) across Sonoma, Marin, Solano, and Napa counties from June 2022 to June 2025.

Bar chart displaying North Bay Median Single-Family Home Price Changes (TTM, Year-Over-Year) for Sonoma, Marin, Solano, and Napa counties from July 2024 to June 2025.

Line graph depicting North Bay Median Single-Family Home Prices (Three-Year, Monthly) for Sonoma, Marin, Solano, and Napa counties from June 2022 to June 2025, with Marin prices notably higher.

Line graph showing North Bay Months of Supply Inventory for Condos (TTM, Monthly) across Sonoma, Marin, Solano, and Napa counties from June 2023 to June 2025.

Line graph illustrating North Bay Months of Supply Inventory for Single Family Homes (TTM, Monthly) across Sonoma, Marin, Solano, and Napa counties from June 2023 to June 2025.

Line graph titled 'San Francisco Average % of Original Price' showing three-year, monthly data for single-family homes and condos from June 2022 to June 2025. The 'Single-Family Home' line (gray) consistently shows a higher percentage, mostly above 105%, indicating sales above original price. The 'Condo' line (blue) fluctuates closer to 100% and dips below, indicating sales closer to or below original price.

Line graph titled 'San Francisco Days on Market' showing TTM, monthly data for single-family homes and condos from June 2023 to June 2025. The 'Condo' line (blue) generally shows higher days on market than the 'Single-Family Home' line (gray). Both lines peak in January 2024 and February 2025, with condos reaching over 80 days and single-family homes around 55 days in January 2024.

Bar and line graph titled 'San Francisco Inventory - Condos' showing two-year, monthly data for new listings, sold listings, and for-sale listings. New listings (dark blue bars) and sold listings (light blue bars) are on the left y-axis, while for-sale listings (pink line) are on the right y-axis. The for-sale listings show a peak around September 2023 and September 2024, exceeding 800 units, and dips in December of both years.

Bar and line graph titled 'San Francisco Inventory - Single-Family Homes' showing two-year, monthly data for new listings, sold listings, and for-sale listings. New listings (dark blue bars) and sold listings (light blue bars) are on the left y-axis, while for-sale listings (pink line) are on the right y-axis. For-sale listings peak around September 2023 and September 2024, nearing 4.5k units, and dip around December of both years.

Bar chart titled 'San Francisco Median Price Changes' showing TTM, year-over-year percentage changes for single-family homes and condos from July 2024 to June 2025. Positive changes are shown for both categories in July 2024, October 2024, and May-June 2025. Negative changes are seen particularly in August 2024, January 2025, and February 2025, especially for condos.

Line graph titled 'San Francisco Median Prices' showing three-year, monthly data for single-family homes and condos from June 2022 to June 2025. The 'Single-Family Home' line (gray) consistently shows higher median prices, generally above $1.4 million, while the 'Condo' line (blue) fluctuates mostly between $1.0 million and $1.3 million.

Line graph titled 'San Francisco Months of Supply Inventory' showing TTM, monthly data for single-family homes and condos from June 2023 to June 2025. The 'Condo' line (blue) consistently shows a higher months of supply, generally between 3 and 5.5 months, while the 'Single-Family Home' line (gray) is lower, mostly between 1 and 3.5 months.

Line graph showing Silicon Valley Days on Market for condos across San Mateo, Santa Clara, and Santa Cruz counties from June 2023 to June 2025. San Mateo exhibits the highest days on market for condos, peaking at over 60 days in early 2024. Santa Clara generally has the lowest, staying below 25 days, while Santa Cruz is in the mid-range.

Line graph showing Silicon Valley Days on Market for single-family homes across San Mateo, Santa Clara, and Santa Cruz counties from June 2023 to June 2025. Santa Cruz consistently has the highest days on market, peaking over 40 days in early 2024 and over 30 days in early 2025. Santa Clara generally has the lowest days on market, staying below 15 days for most of the period. San Mateo is in between.

Bar and line chart depicting Silicon Valley Inventory for Condos over two years, monthly, from June 2023 to June 2025. Blue bars represent new listings, light blue bars represent sold listings, and the purple line indicates for-sale inventory. For-sale inventory peaked around 900 units in April-May 2025, while new and sold listings show monthly fluctuations, generally increasing from late 2024.

Bar and line chart showing Silicon Valley Inventory for Single-Family Homes over two years, monthly, from June 2023 to June 2025. Dark blue bars represent new listings, light blue bars represent sold listings, and the pink line indicates for-sale inventory. For-sale inventory generally trends upwards from late 2024, peaking around 2,250 units in May 2025. New and sold listings fluctuate monthly.

Bar chart illustrating Silicon Valley Median Price Changes year-over-year for condos in San Mateo, Santa Clara, and Santa Cruz from July 2024 to June 2025. Santa Cruz shows significant negative price changes, especially from December 2024 to June 2025 (ranging from -5% to -20%). San Mateo also experiences negative changes in latter months. Santa Clara shows more mixed results, with some positive changes in late 2024 and early 2025.

Line graph displaying Silicon Valley Median Condo Prices across San Mateo, Santa Clara, and Santa Cruz counties from June 2022 to June 2025. Prices for all three counties generally fluctuate between $600,000 and $900,000. Santa Clara prices are often at the higher end of this range, while Santa Cruz tends to be at the lower end.

Bar chart displaying Silicon Valley Median Price Changes year-over-year for single-family homes in San Mateo, Santa Clara, and Santa Cruz from July 2024 to June 2025. Santa Clara shows positive price changes for most of the period, notably in November and December 2024 (around 12-20%). San Mateo and Santa Cruz show more volatility, with significant negative changes in April and May 2025.

Line graph displaying Silicon Valley Median Single-Family Home Prices across San Mateo, Santa Clara, and Santa Cruz counties from June 2022 to June 2025. Santa Clara and San Mateo prices largely track each other, mostly between $1.7 million and $2.2 million, with Santa Clara slightly higher in mid-2025. Santa Cruz prices are consistently lower, generally between $1.0 million and $1.4 million.

Line graph illustrating Silicon Valley Months of Supply Inventory for condos across San Mateo, Santa Clara, and Santa Cruz counties from June 2023 to June 2025. Santa Cruz consistently has the highest months of supply, reaching over 6 months in May 2025. Santa Clara generally has the lowest, staying below 4 months, while San Mateo is in the middle.

Line graph showing Silicon Valley Months of Supply Inventory for single-family homes across San Mateo, Santa Clara, and Santa Cruz counties from June 2023 to June 2025. Santa Cruz consistently shows the highest months of supply, rising to over 4.5 by June 2025. San Mateo and Santa Clara generally track lower, with Santa Clara consistently the lowest, around 1.5 to 2.0 months by June 2025.

Let’s Talk

You’ve got questions and we can’t wait to answer them.

Follow Us on Instagram