Select a Market Report to Read:
- National Market Update Overview
- Bay Area Report
- North Bay Report
- East Bay Report
- Silicon Valley Report
- San Francisco Report
Quick Take
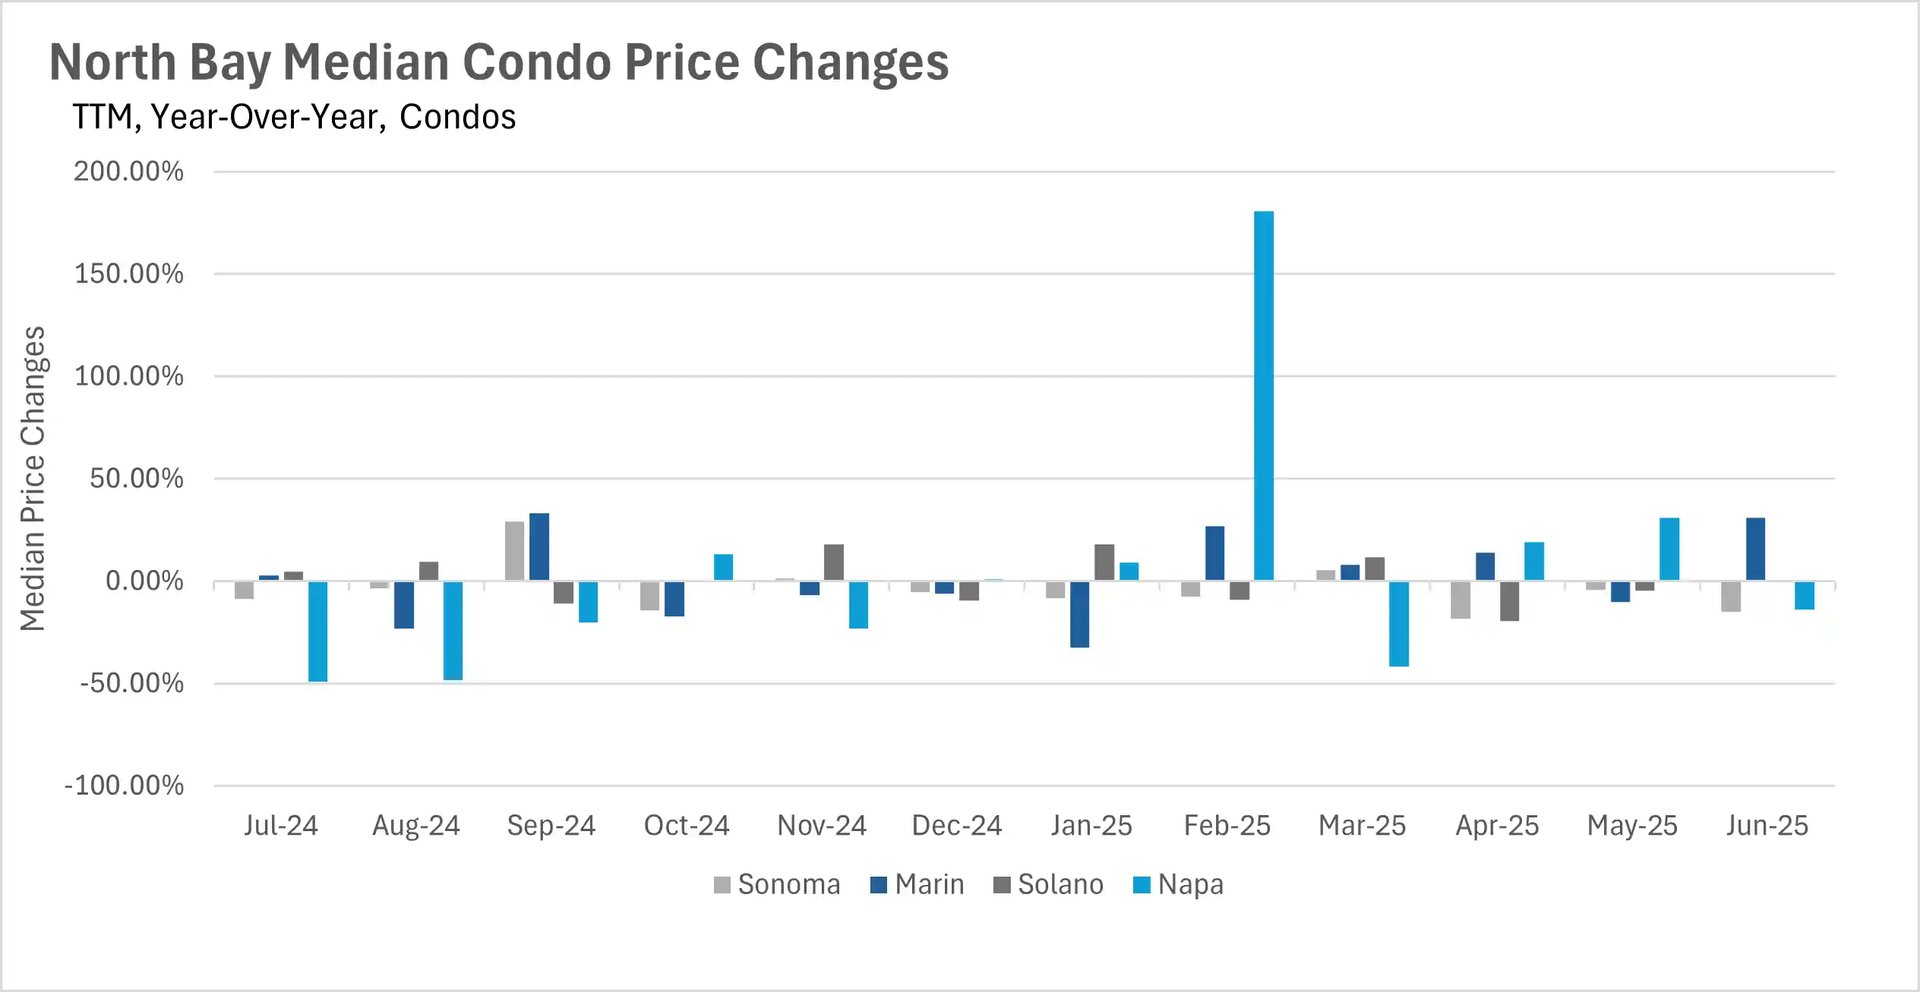
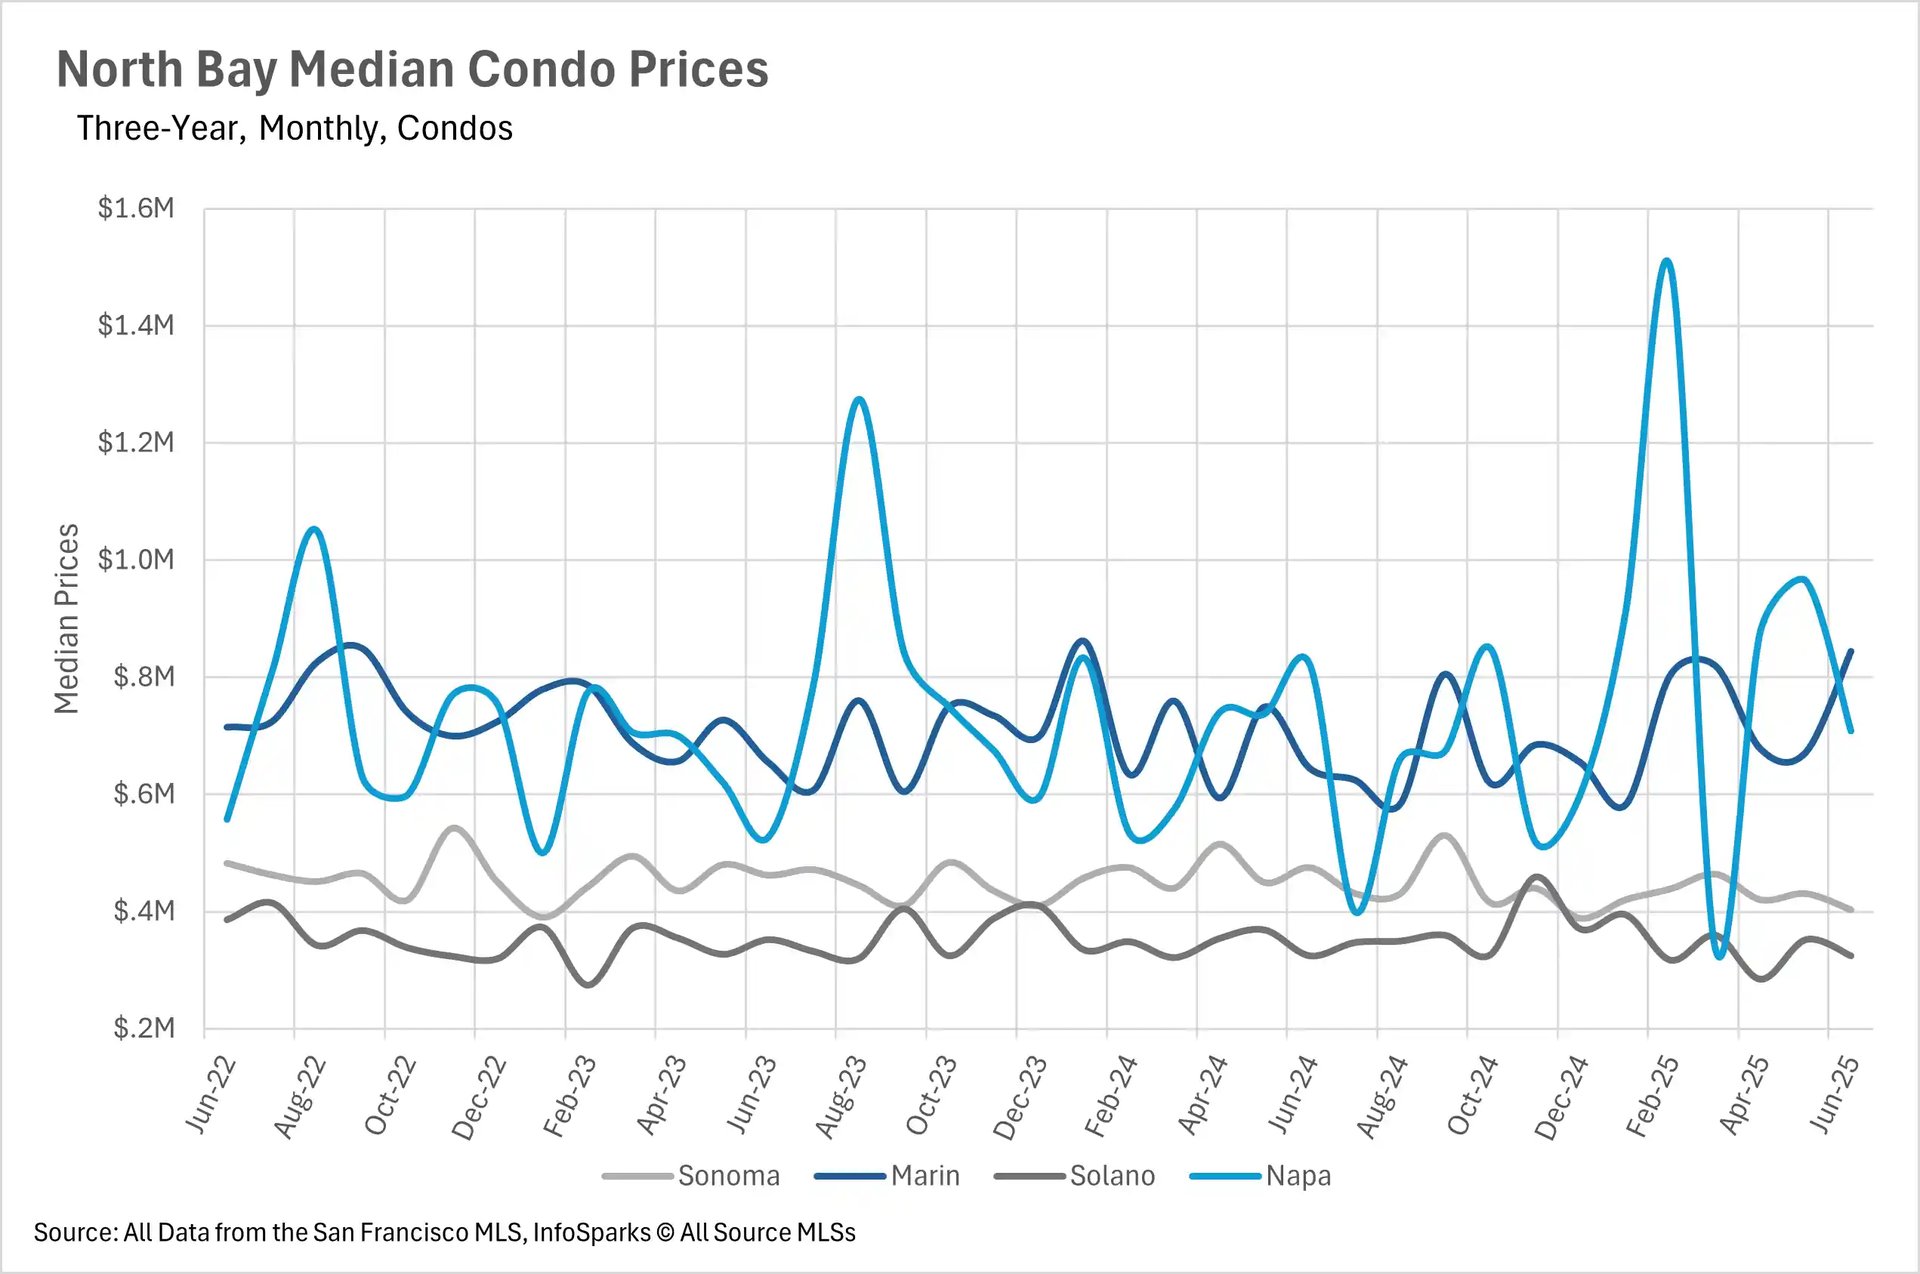
- The condo market continues to be incredibly volatile, while the single-family home market has remained relatively stable.
- In June, we saw a sharp decline in the amount of inventory on the market, as fewer new listings were added.
- Despite the drastic drawdown in inventory, the average listing is still sitting on the market for longer than it was last year.
Note: You can find the charts/graphs for the Local Lowdown at the end of this section.
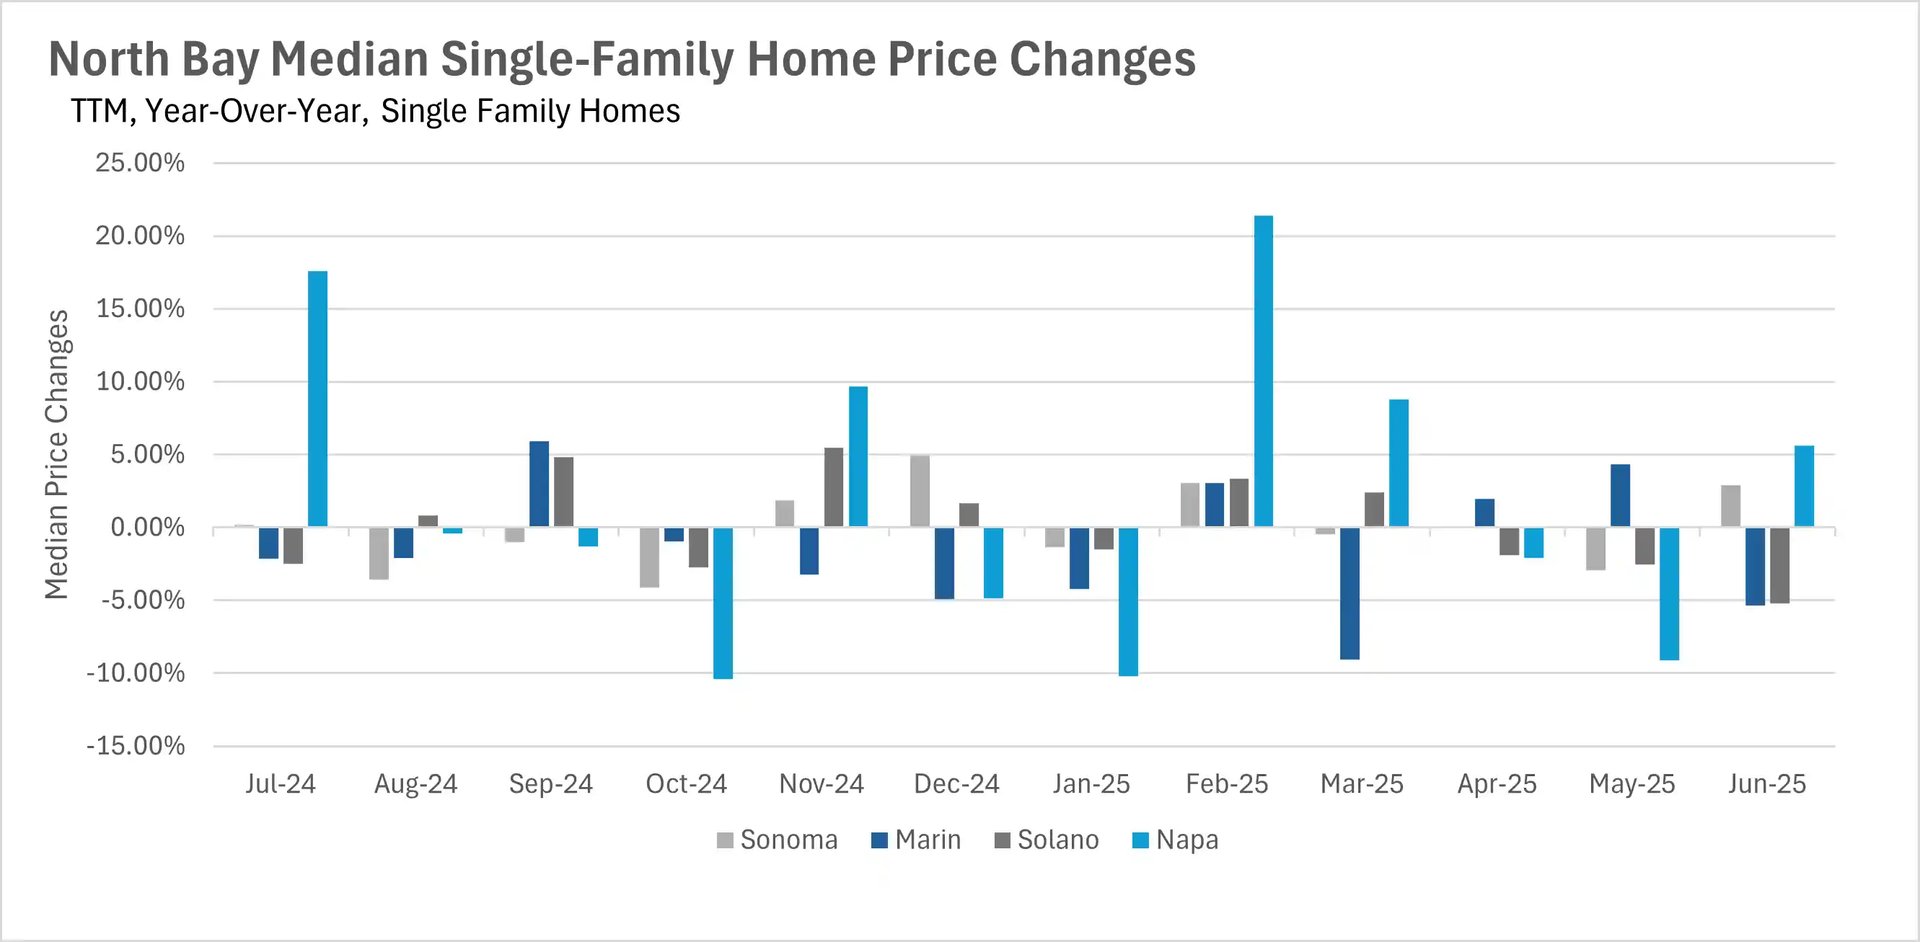
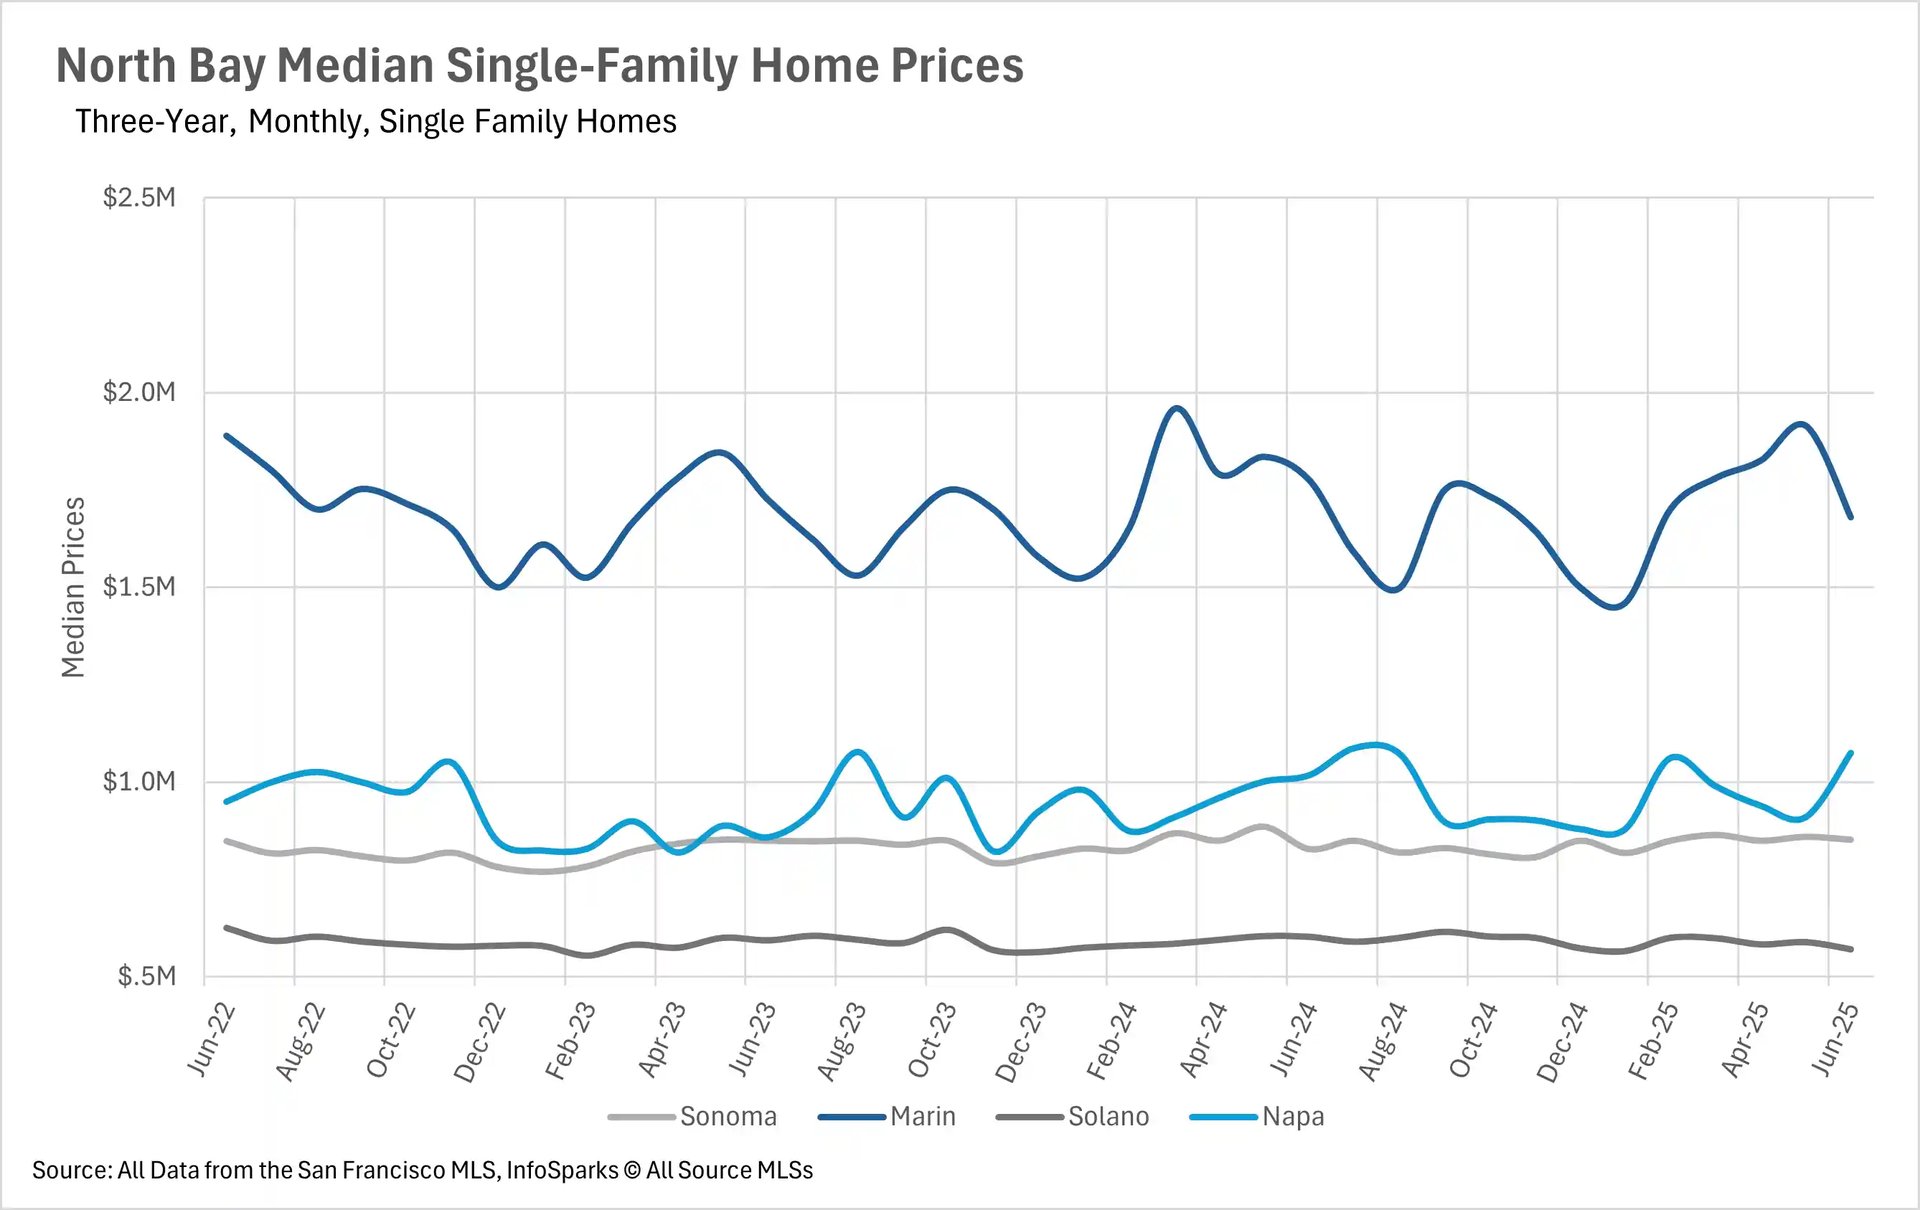
Continued stability in the single-family home market
In June, the North Bay saw another month of relative stability, with single-family home median sale prices increasing by 2.92% on a year-over-year basis in Sonoma County and 5.60% in Napa County, and decreasing by 5.23% in Solano County and 5.35% in Marin County. However, when you look at the graph of median sale prices over time, you can see that the most recent data points are well within the “band” of pricing that homes have sold for over the past few years. Median sale prices for condos have remained volatile in Marin and Napa Counties, while Sonoma and Solano County condo median sale prices have stayed within their respective bands.
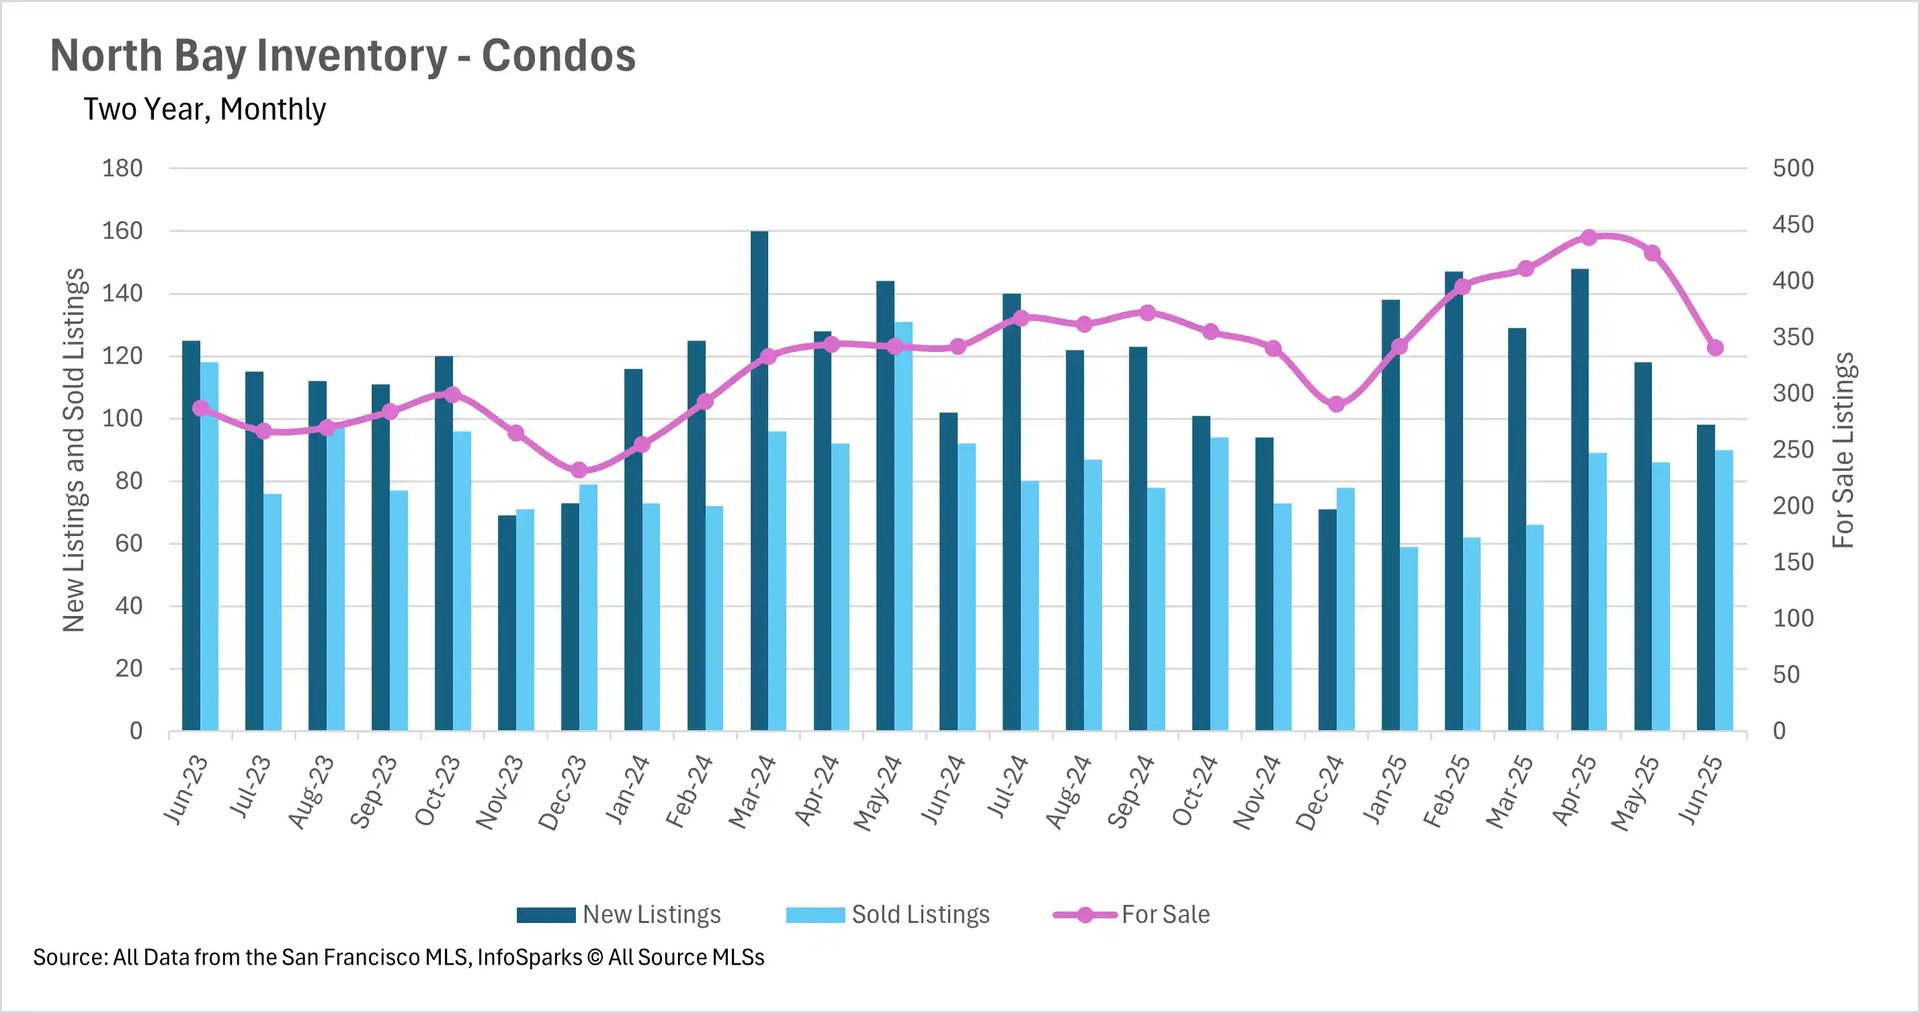
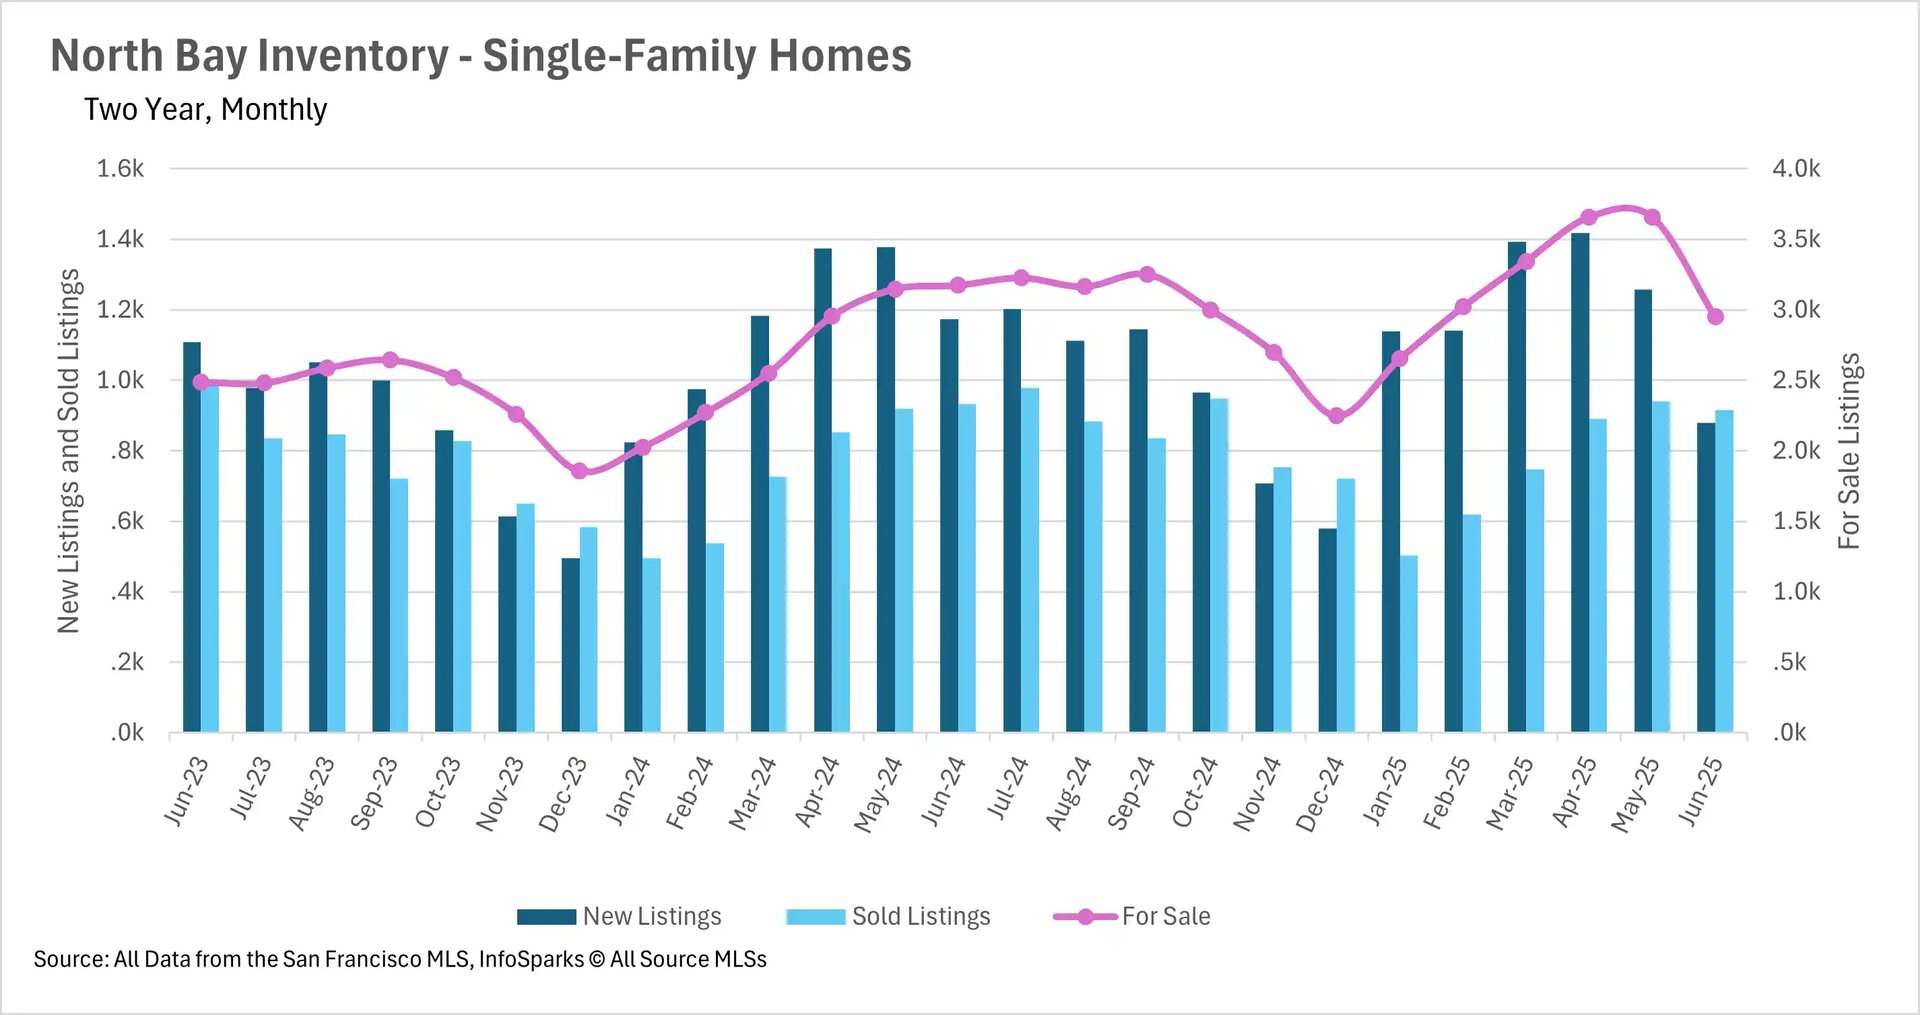
Inventories declined by nearly 20% from May to June
Over the course of the past month, we’ve witnessed one of the sharpest declines in inventory in recent history, with single-family home inventory falling by 19.34% on a month-over-month (7.09% on a year-over-year basis) and condo inventory falling by 19.76% (0.29% year-over-year). This was driven in part by the fact that there were considerably fewer new listings added in June, as we recorded the slowest June that we’ve seen in recent years. The number of sold listings was roughly in line with what we saw last year, but there was certainly some hesitancy in putting homes up for sale last month. This unusual phenomenon will be worth tracking over the coming months.
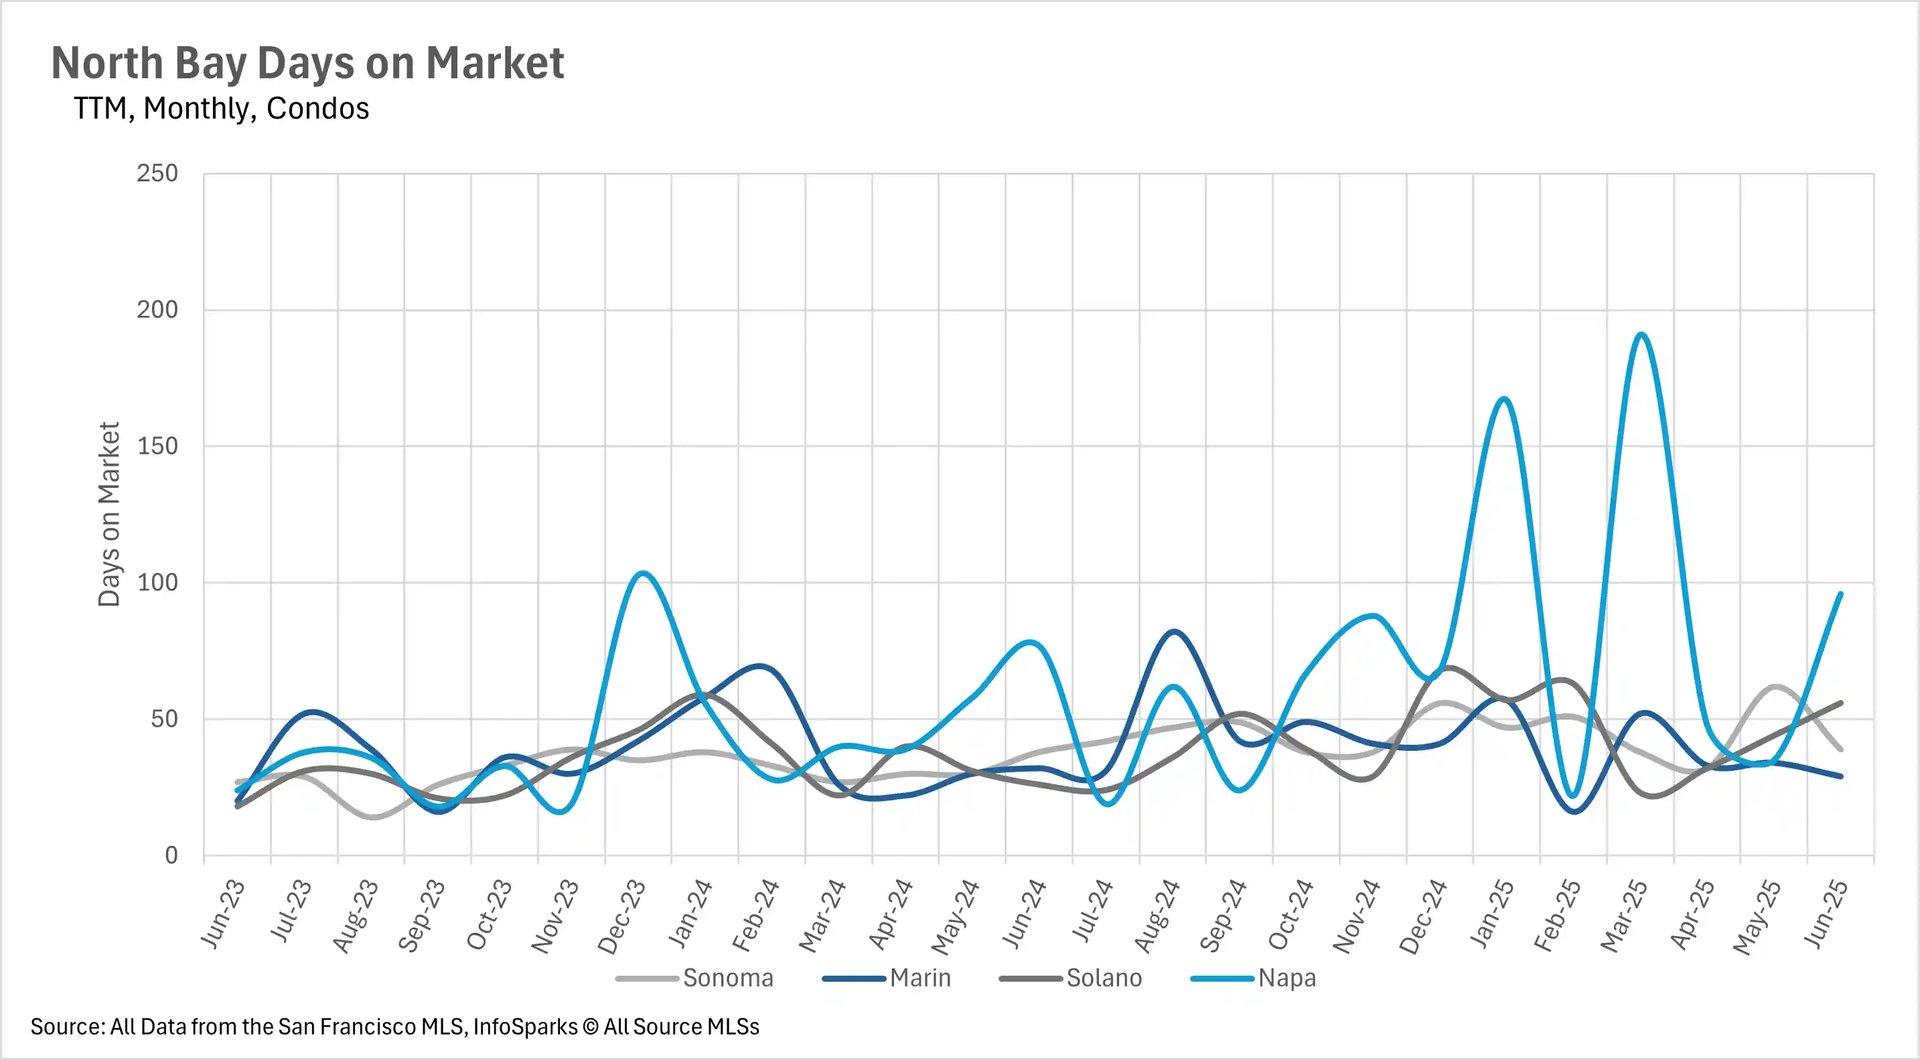
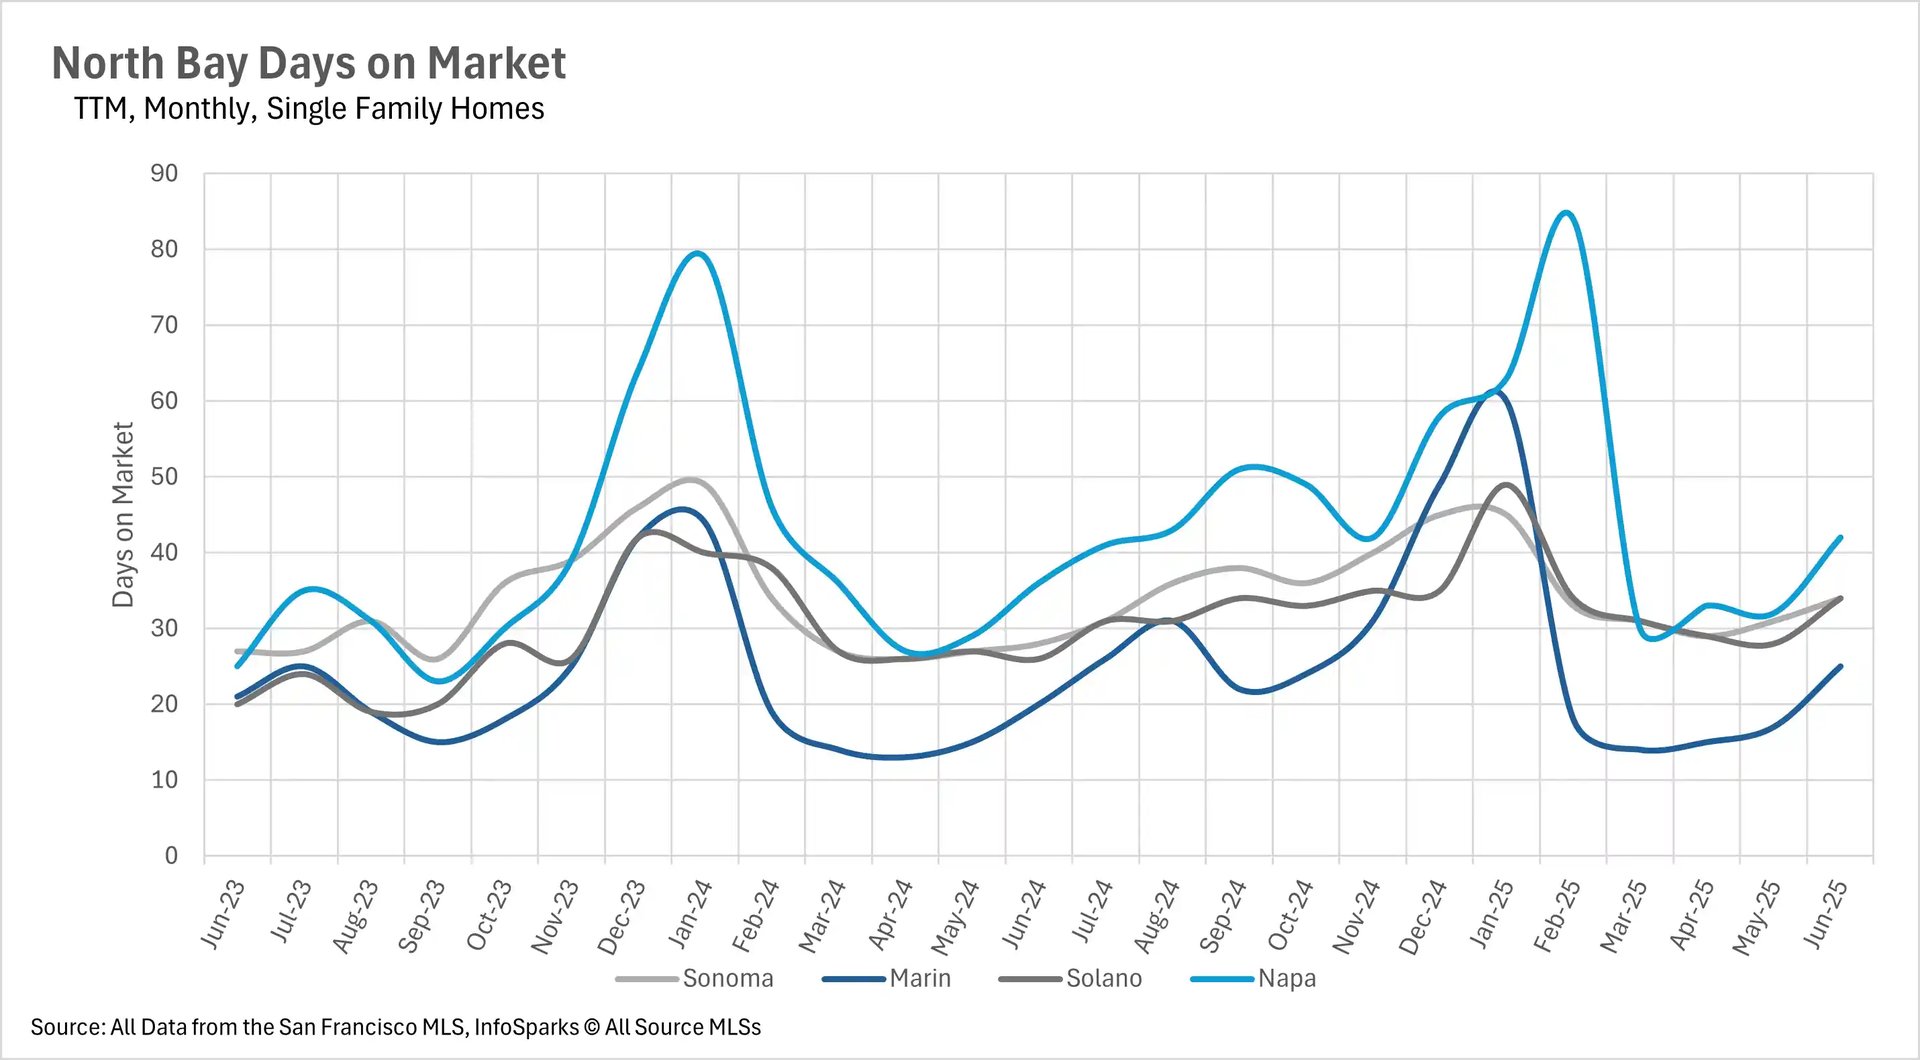
Although inventories dropped off, listings are spending 20%+ more time on the market
While you might expect the number of days a listing spends on the market to drop off drastically when inventories plummet the way they did last month, they didn’t. In reality, the median single-family home listing spent 21.43% longer on the market in Sonoma County, 25% longer in Marin County, 30.77% longer in Solano County, and 16.67% longer in Napa County on a year-over-year basis. This is more than likely due to the fact that time on market is a lagging indicator, given that it can take several weeks to close a real estate transaction. However, it will be important to pay attention to this metric moving forward over the next couple of months.
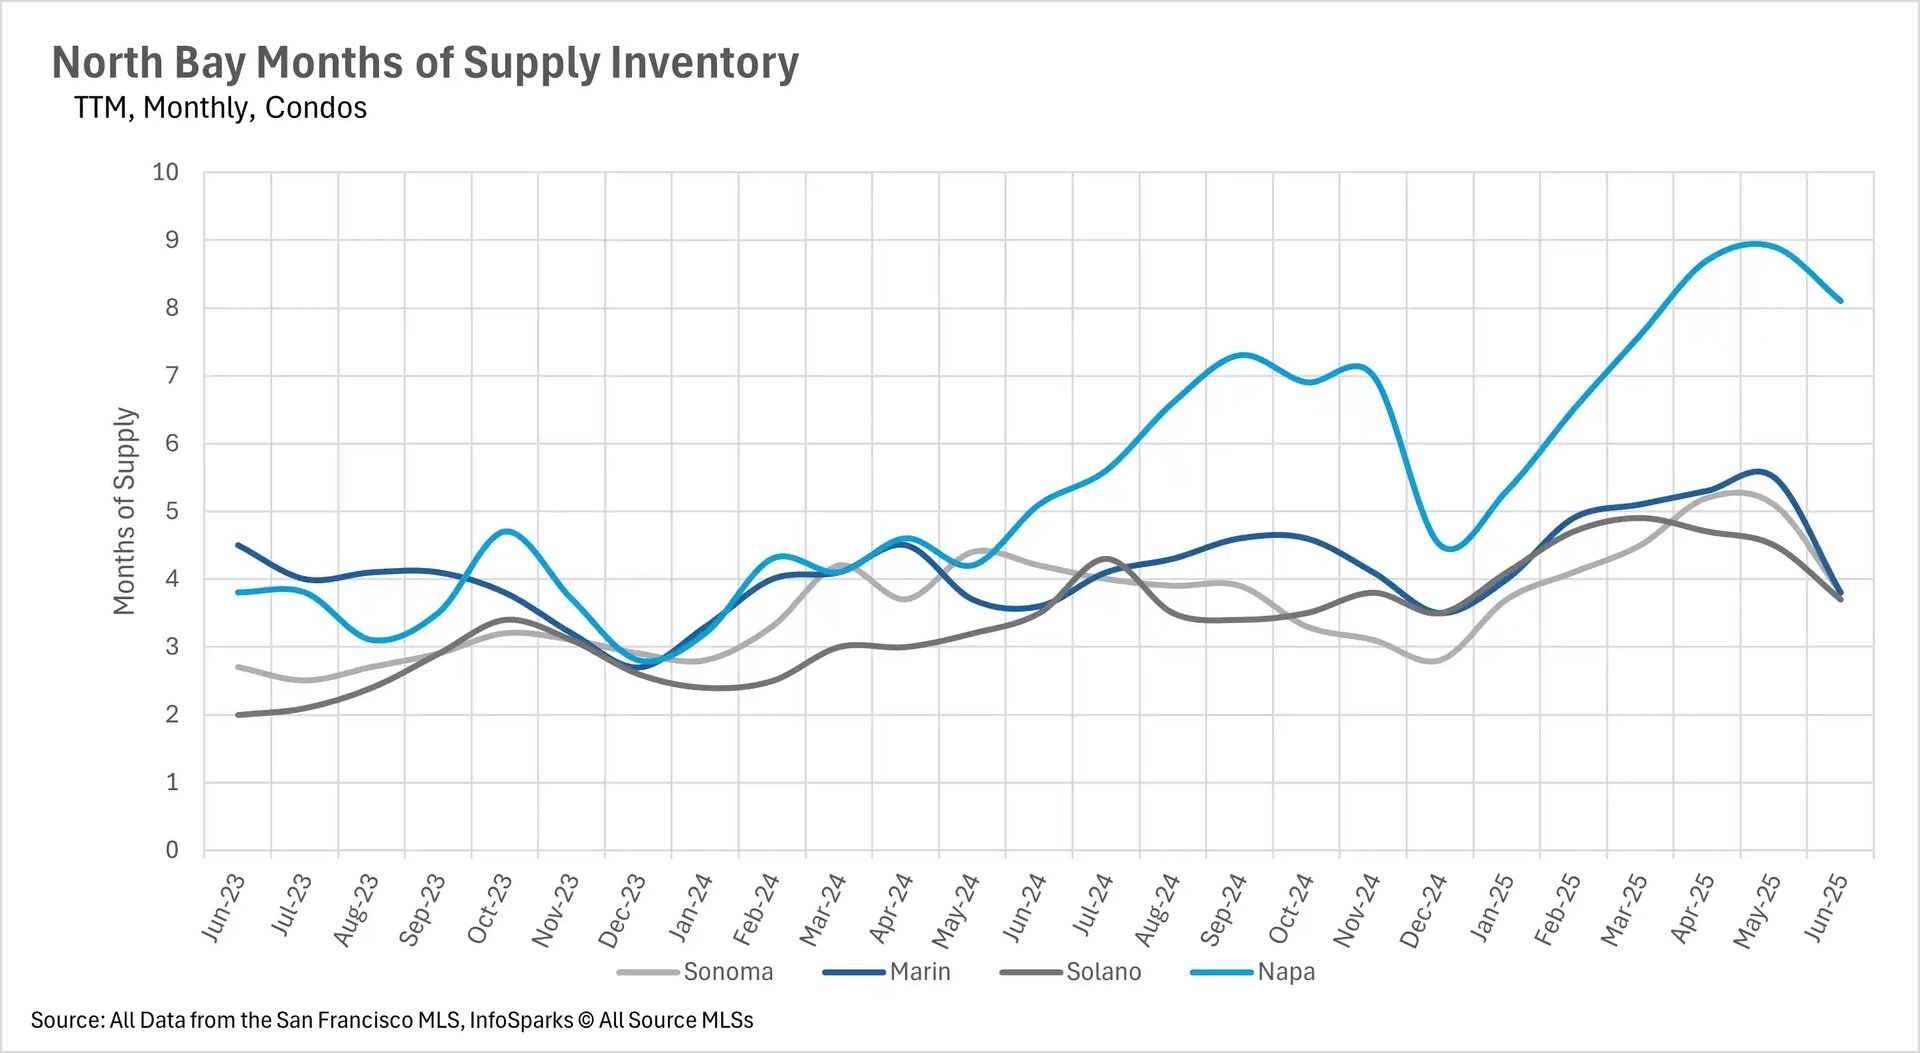
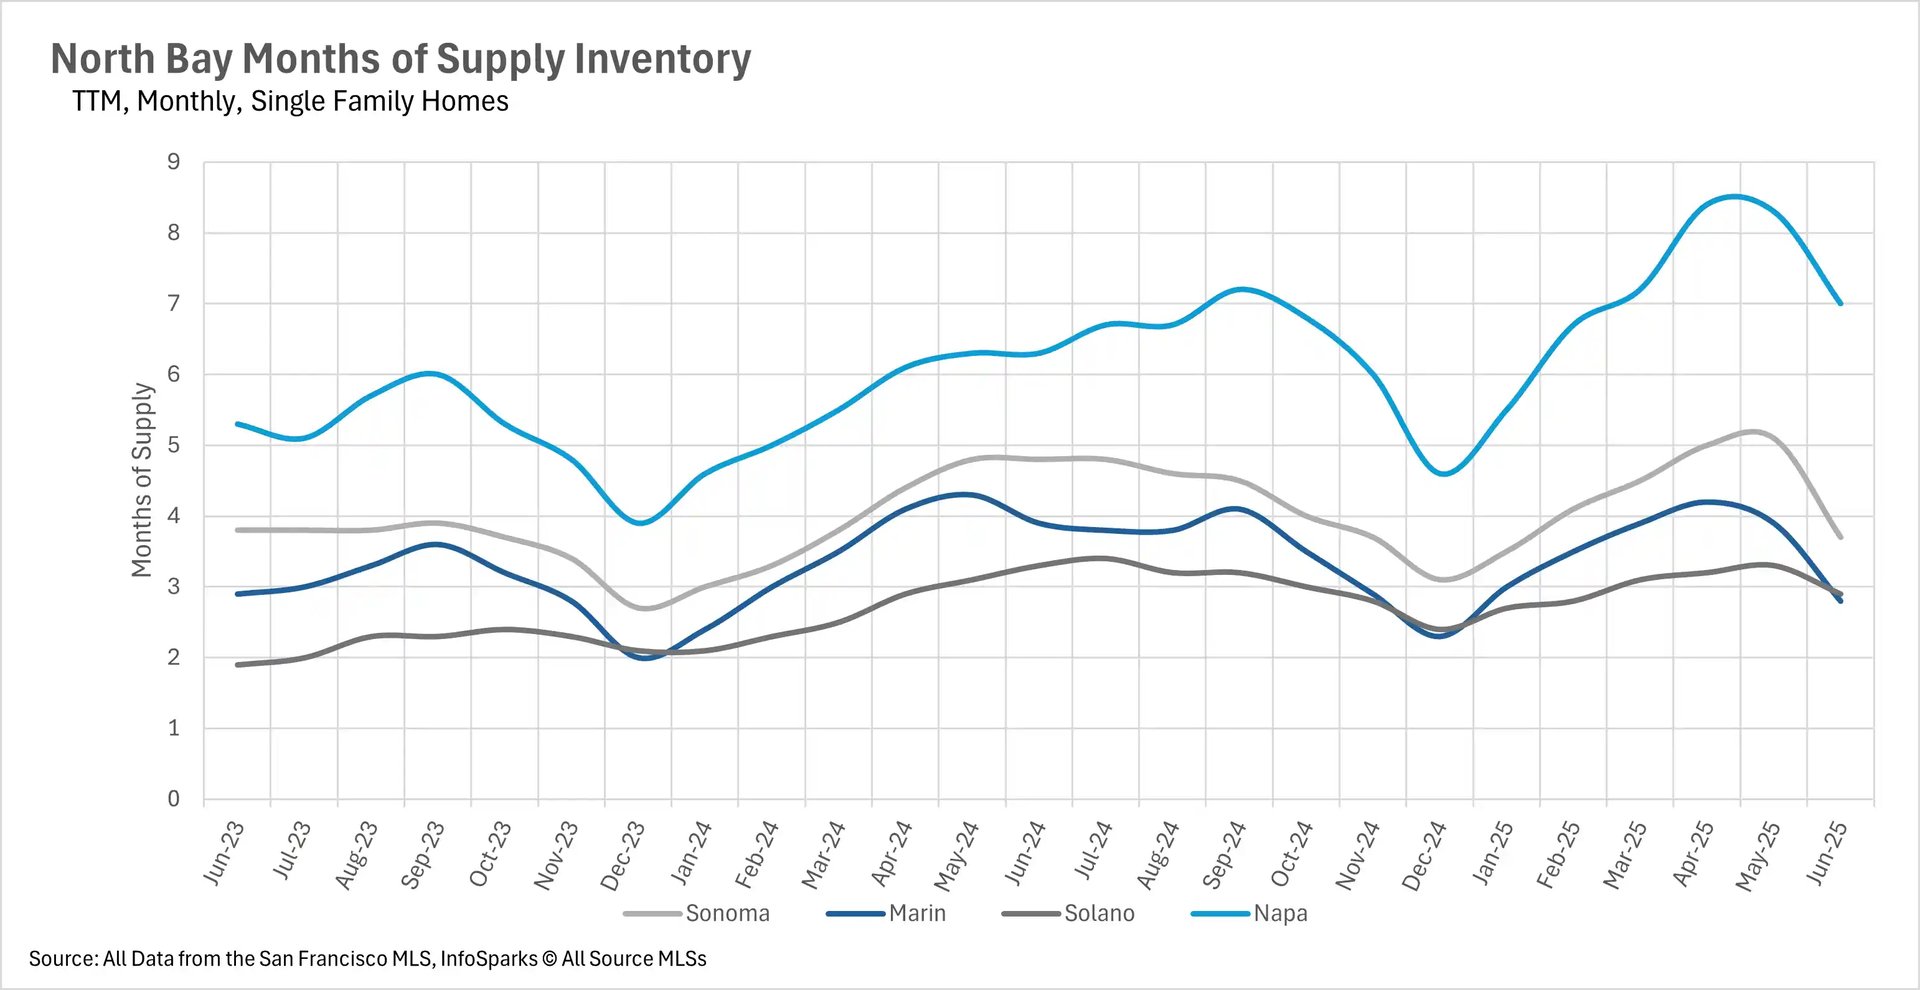
Marin and Solano Counties are close to balanced, while Sonoma and Napa Counties are buyer’s markets
When determining whether a market is a buyers’ market or a sellers’ market, we look to the Months of Supply Inventory (MSI) metric. The state of California has historically averaged around three months of MSI, so any area with at or around three months of MSI is considered a balanced market. Any market that has lower than three months of MSI is considered a seller’s market, whereas markets with more than three months of MSI are considered buyers’ markets.
When we look at the single-family market, Marina and Solano Counties have swung back to neutral this month, with 2.8 and 2.9 months of inventory on the market, respectively. Meanwhile, Sonoma and Napa Counties are still buyer's markets with 3.7 and 7 months of inventory on the market, respectively. However, when we turn to the condo market, all areas are buyers' markets, with Sonoma and Marin Counties having 3.8 months of inventory on the market, Solano County having 3.7 months of inventory on the market, and Napa County having a massive 8.1 months of inventory!