Select a Market Report to Read:
National Market Update Overview
Bay Area
North Bay
East Bay
Silicon Valley
San Francisco
The Local Lowdown
Quick Take:
- Single-family median sale prices rebounded across most of Silicon Valley in December, with San Mateo County posting nearly 10% year-over-year gains.
- Inventory levels have plummeted to their lowest levels in years, with single-family home inventory down more than 21% year-over-year.
- Despite the inventory crunch, listings in Santa Cruz County are spending significantly more time on the market compared to last year.
Note: You can find the charts/graphs for the Local Lowdown at the end of this section.
*National Association of REALTORS® data is released two months behind, so we estimate the most recent month's data when possible and appropriate.
A December rebound brings prices back up across most of Silicon Valley
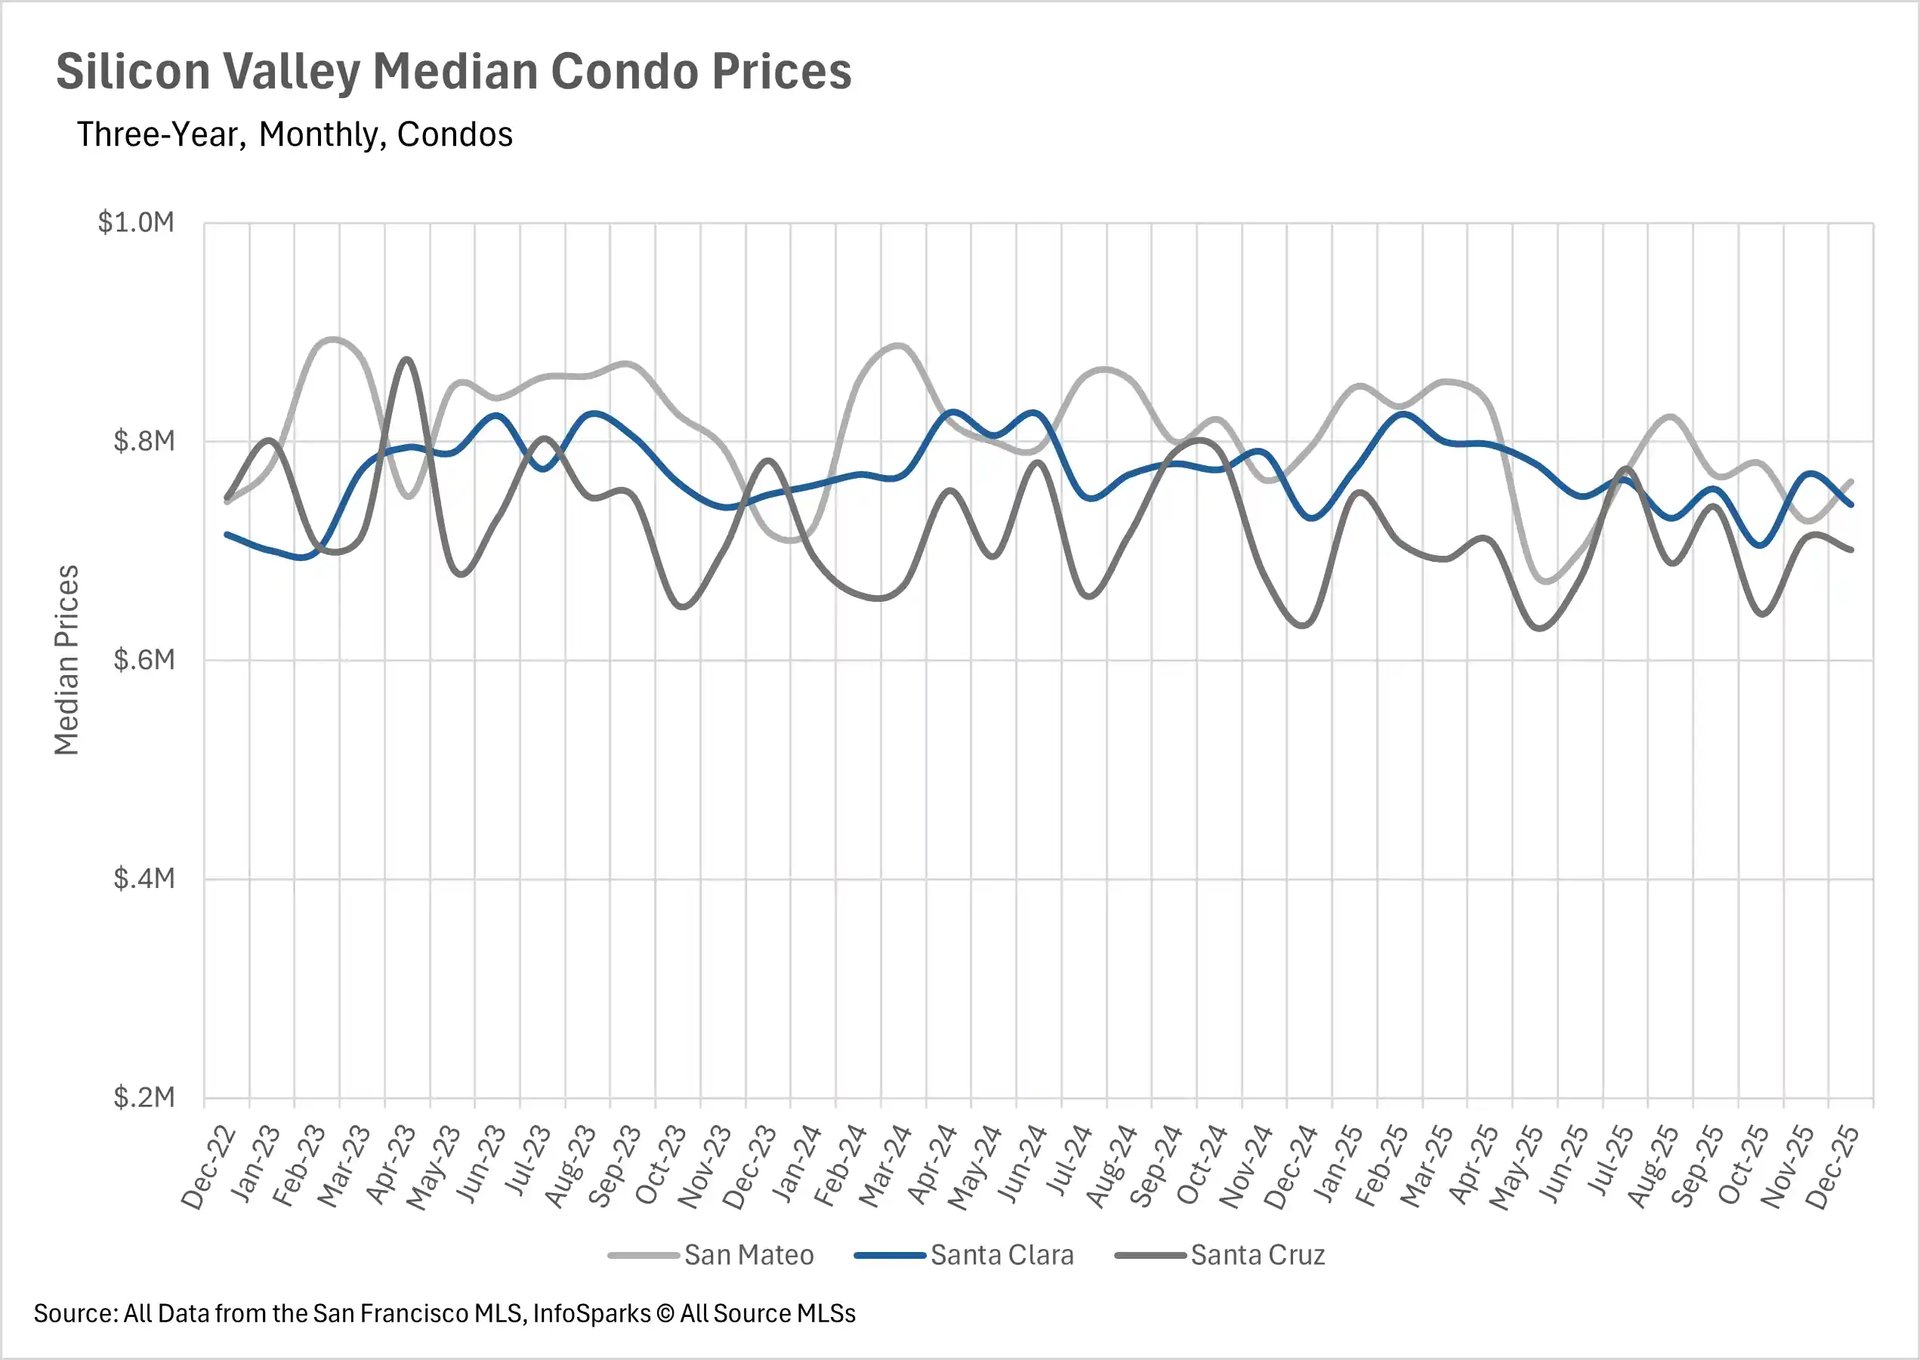
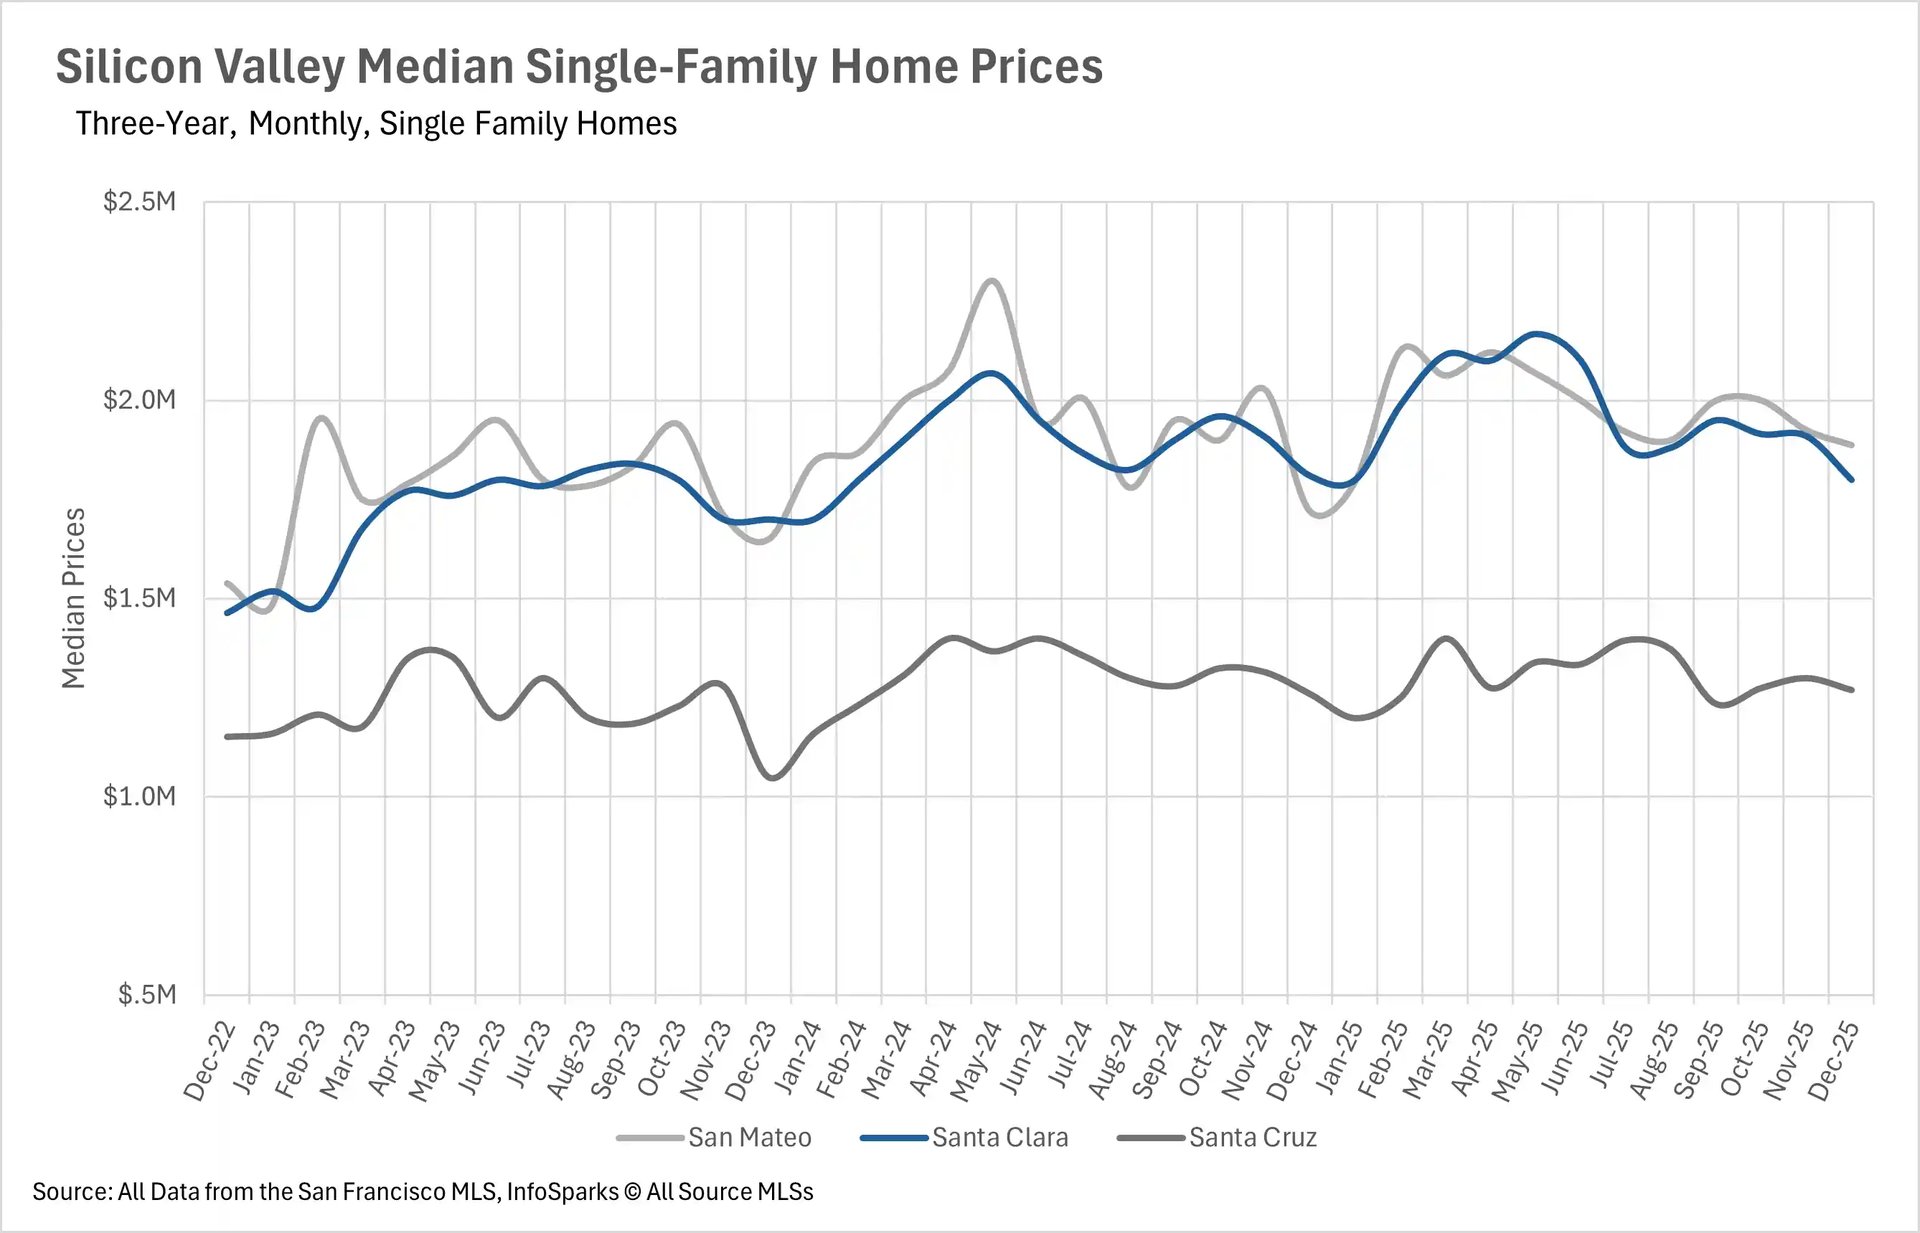
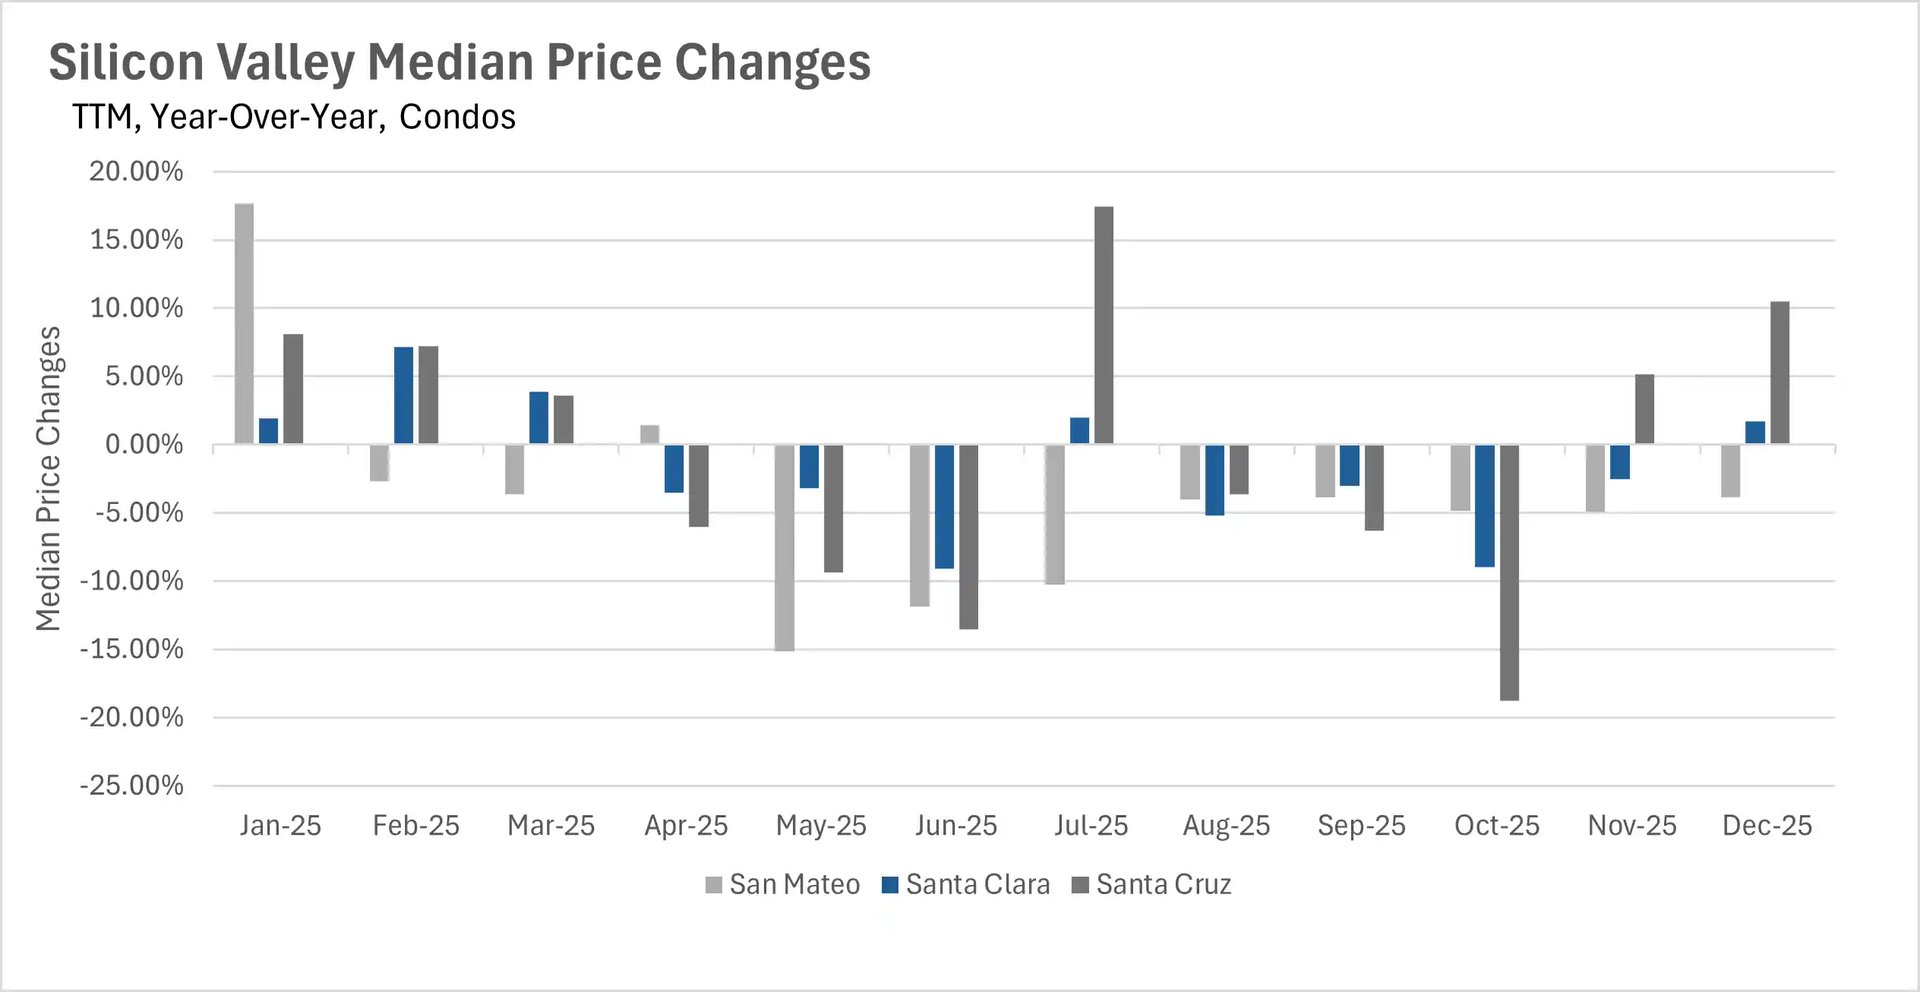
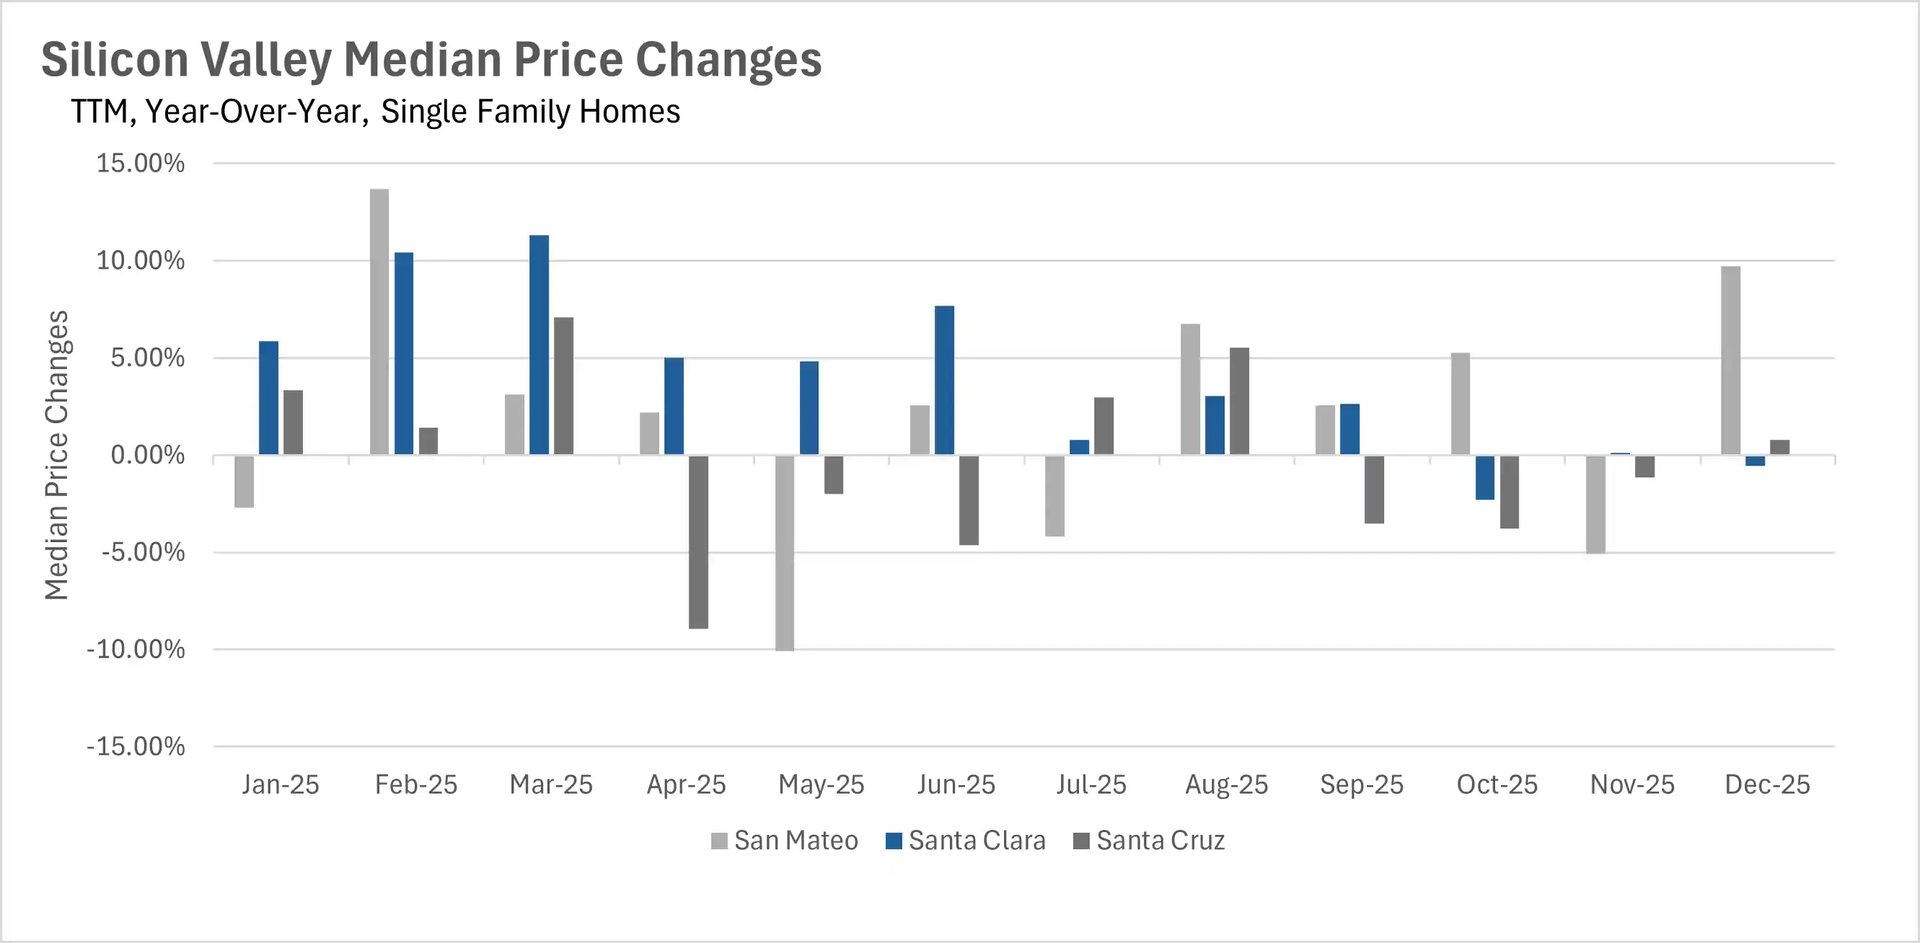
After November's rare across-the-board price declines, the single-family home market in Silicon Valley bounced back in a big way to close out 2025. San Mateo County led the charge with a 9.74% year-over-year increase in median sale price, bringing the median home to $1,887,500. Meanwhile, Santa Clara County saw a modest 0.55% year-over-year decline, with the median home selling for $1,800,000. Santa Cruz County remained relatively stable, posting a 0.79% year-over-year increase, with the median home selling for $1,270,000. The condo market told a slightly different story, with San Mateo County condos declining by 3.84% year-over-year, while Santa Clara County condos increased by 1.71%, and Santa Cruz County condos surged by an impressive 10.48%!
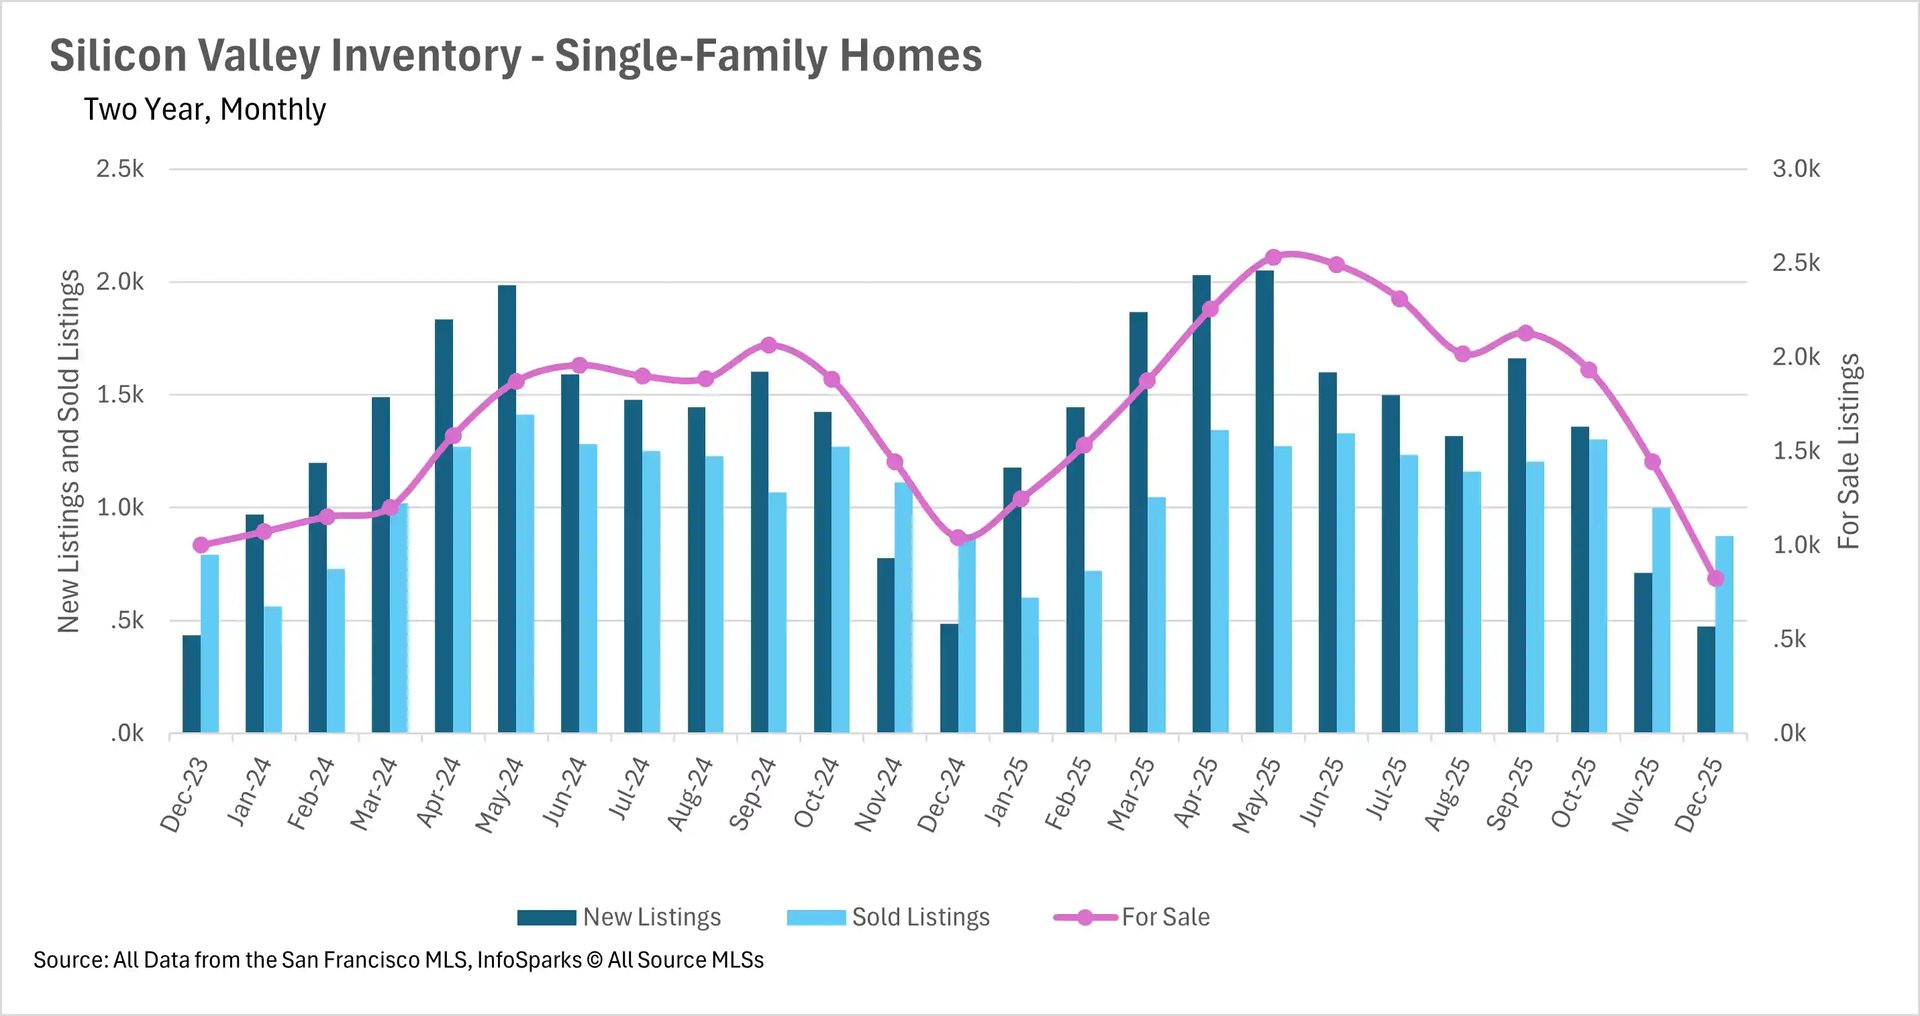
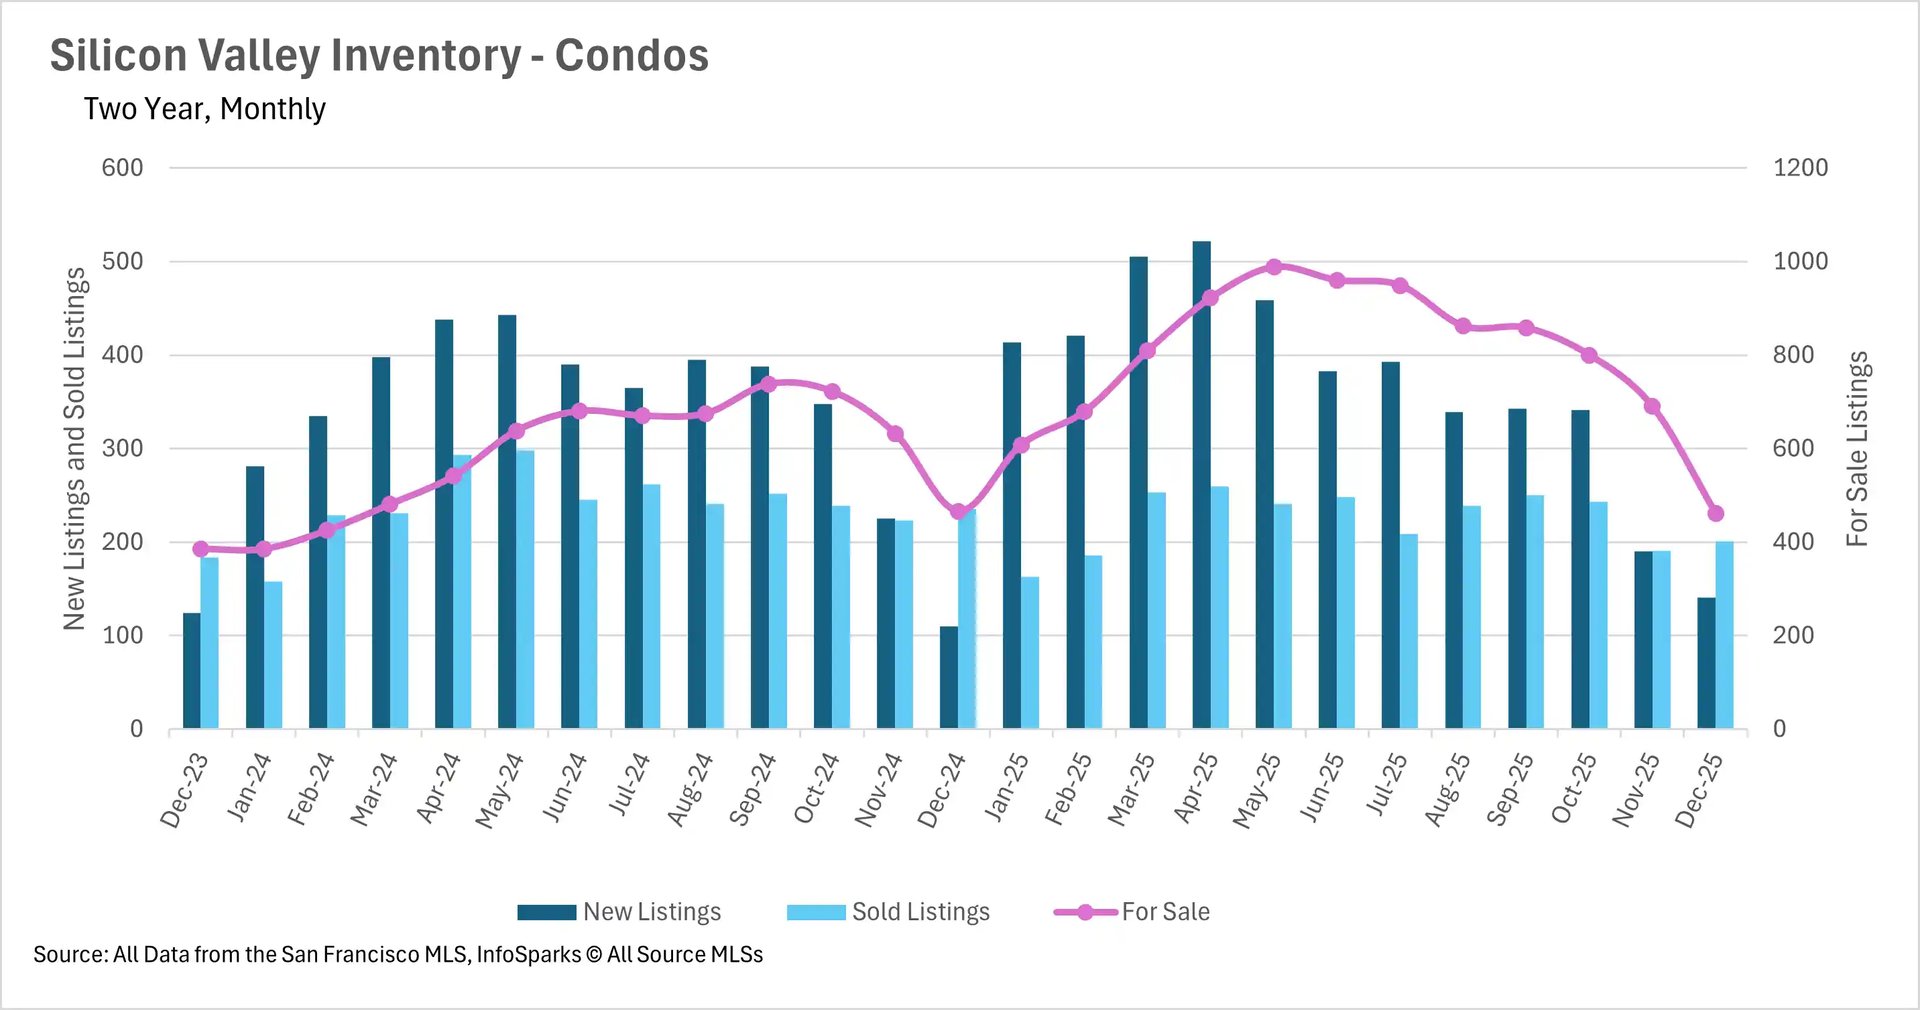
Inventory drops to critically low levels heading into the new year
The inventory situation in Silicon Valley has reached critical levels as we enter 2026. Single-family home inventory dropped by a staggering 43.01% month-over-month and 21.02% year-over-year, leaving just 823 homes for sale across the region. This represents the tightest inventory conditions we've seen in years, and it's a stark reversal from the inventory buildup we saw during the summer months. The condo market tells a similar story, with inventory down 33.04% month-over-month and essentially flat year-over-year. With so few options available, buyers will need to move quickly when they find a property that meets their needs!
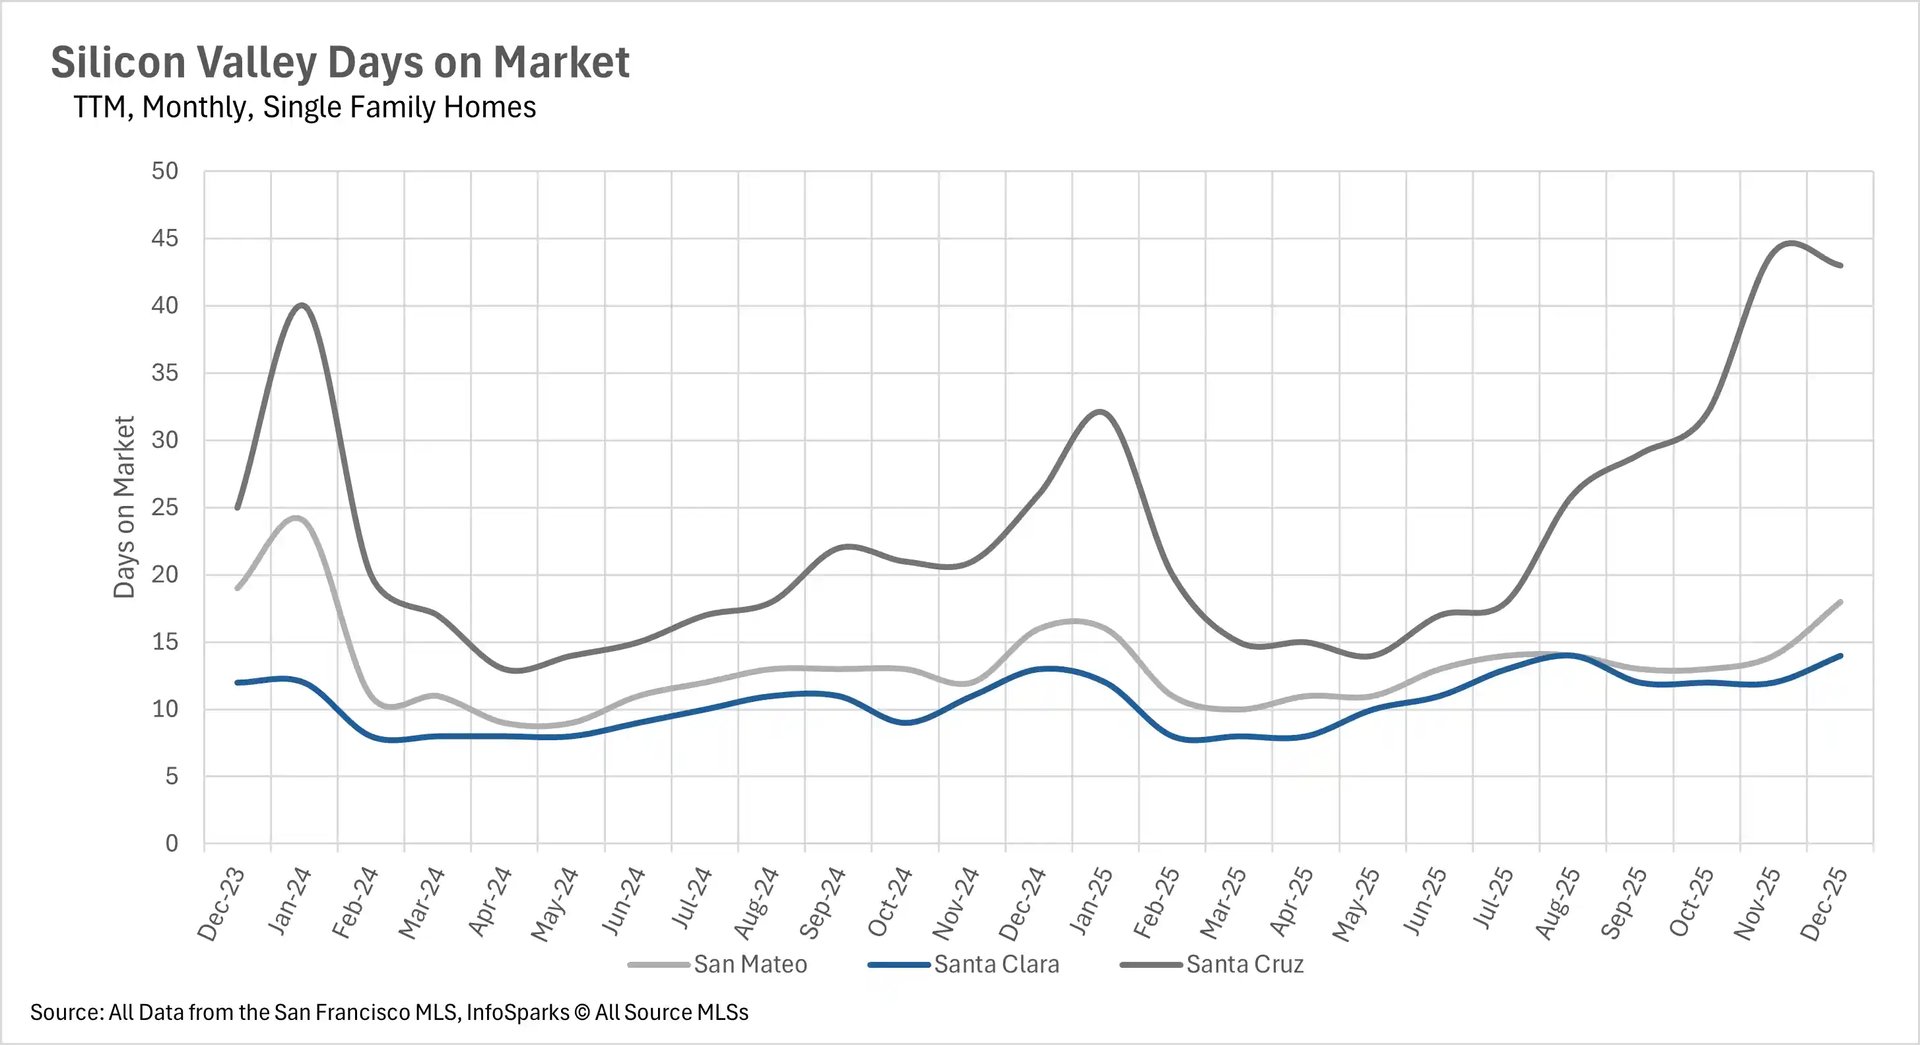
Santa Cruz single-family homes are taking much longer to sell
Despite the severe inventory crunch, not all markets are seeing properties fly off the shelves. Santa Cruz County single-family homes are spending 65.38% more time on the market compared to last year, with the average home taking 43 days to sell. This stands in stark contrast to San Mateo and Santa Clara Counties, where homes are selling in just 18 and 14 days, respectively, though even these represent year-over-year increases of 12.50% and 7.69%. When we turn to the condo market, we see a mixed picture: San Mateo and Santa Clara County condos are taking slightly longer to sell (6.38% and 3.13% increases, respectively), while Santa Cruz County condos are actually moving faster, with a 16.13% year-over-year decrease in days on market.
A deeply entrenched seller's market across most of Silicon Valley.
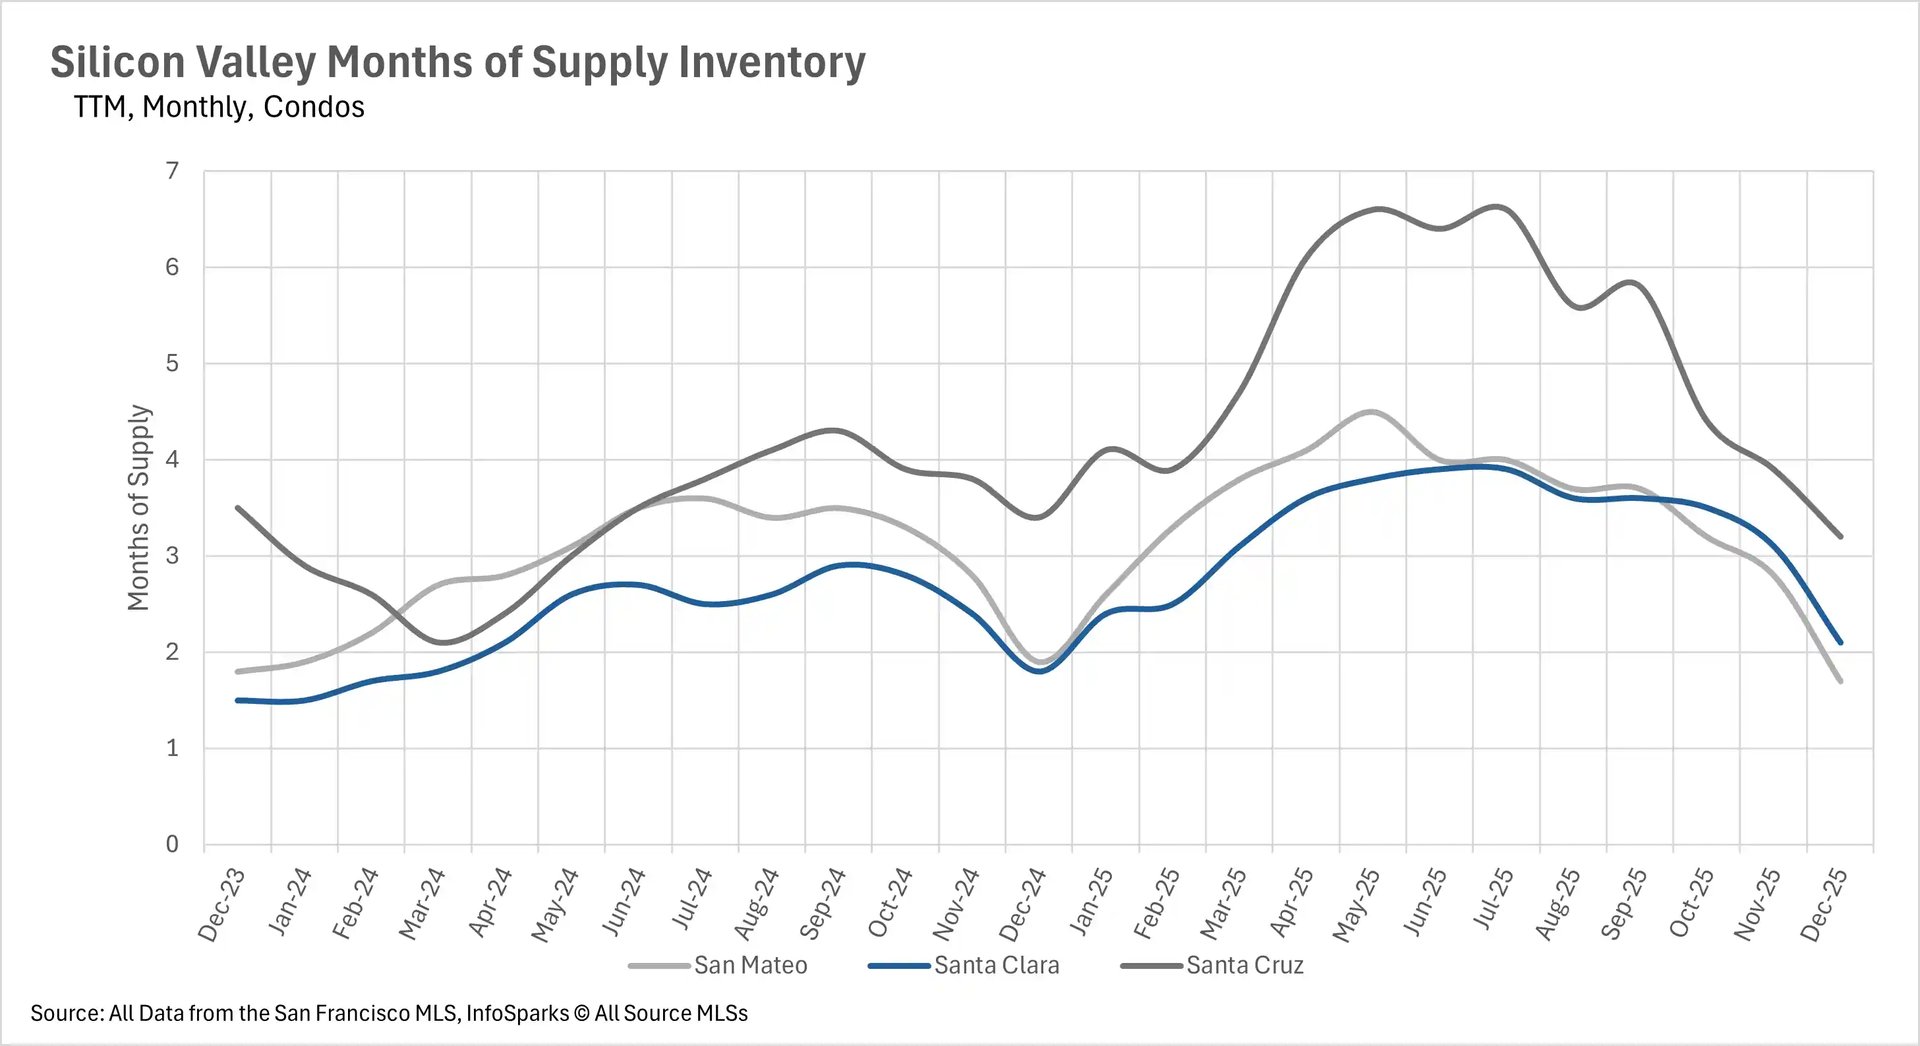
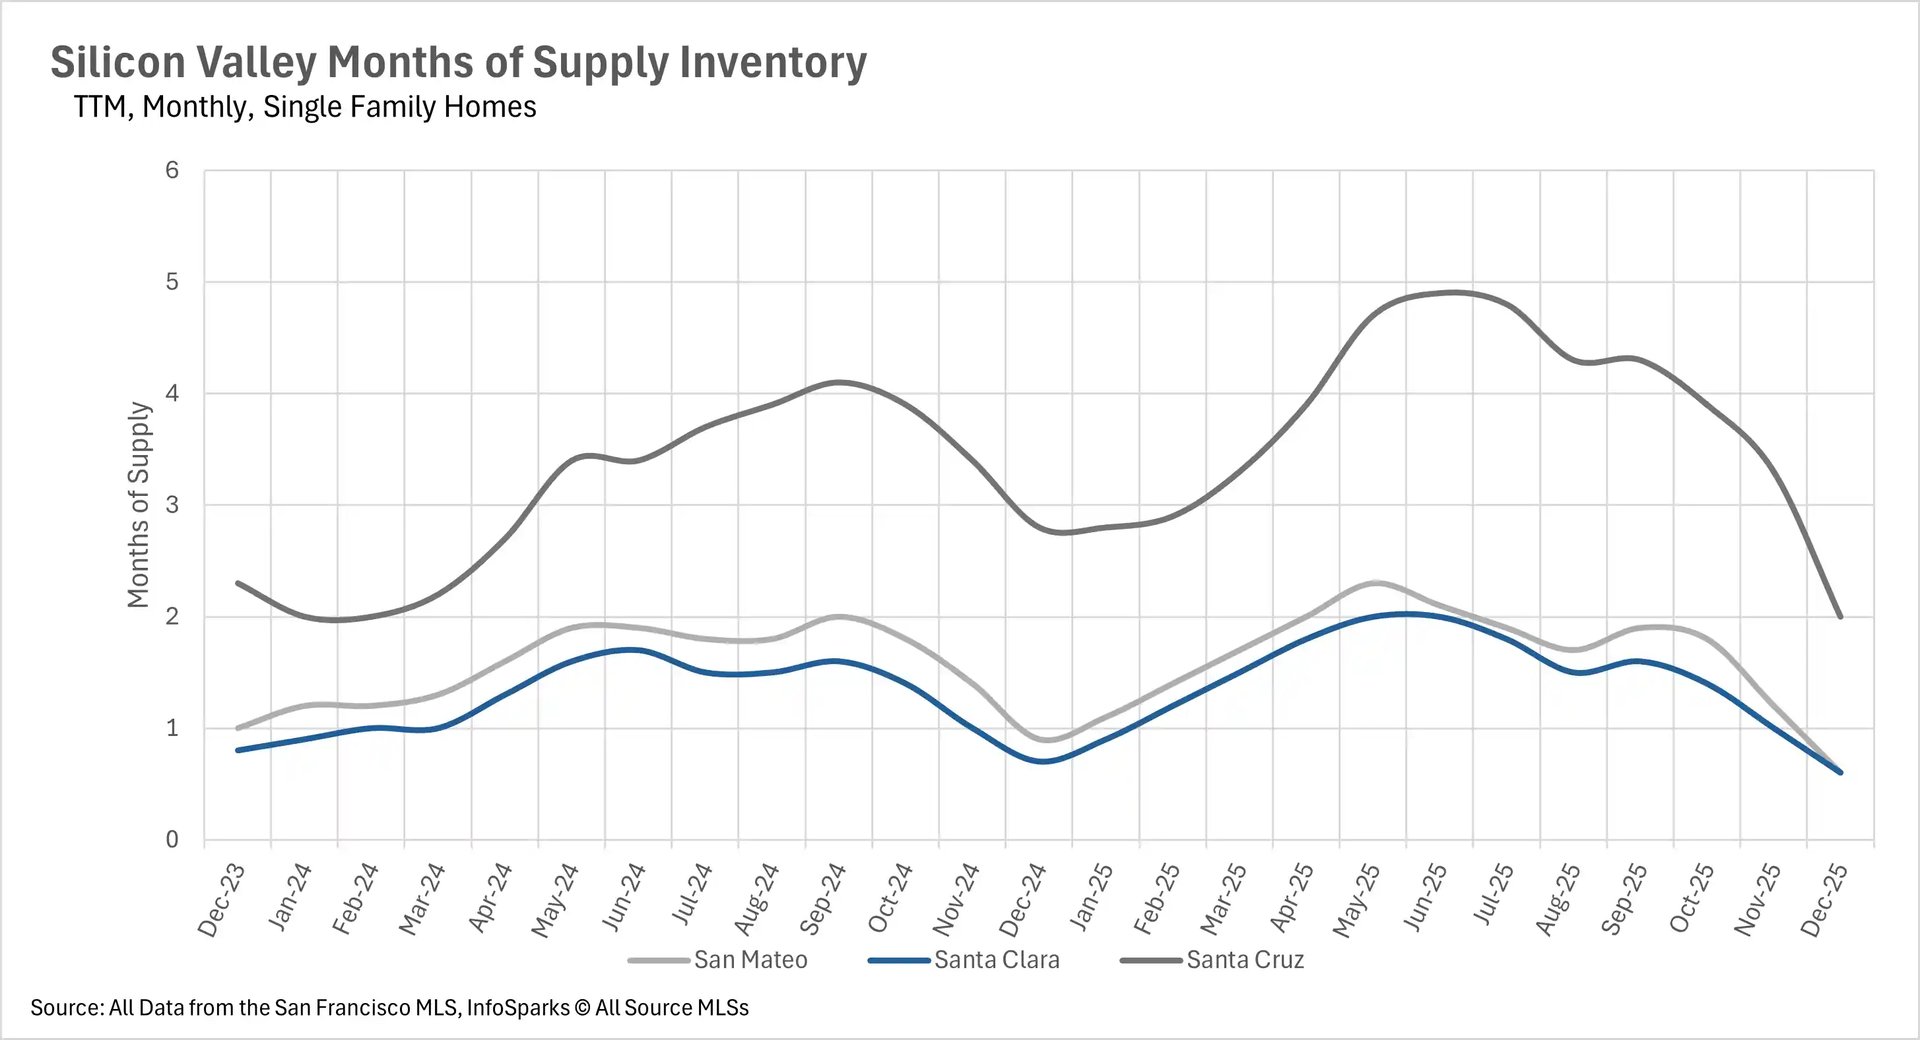
When determining whether a market is a buyers’ market or a sellers’ market, we look to the Months of Supply Inventory (MSI) metric. The state of California has historically averaged around three months of MSI, so any area with at or around three months of MSI is considered a balanced market. Any market that has lower than three months of MSI is considered a seller’s market, whereas markets with more than three months of MSI are considered buyers’ markets.
The dramatic inventory drop has pushed Silicon Valley deeper into seller's market territory than we've seen in quite some time. San Mateo and Santa Clara Counties both have just 0.6 months of single-family home supply, representing year-over-year decreases of 33.33% and 14.29%, respectively. Even Santa Cruz County, which has maintained higher inventory levels throughout the year, has dropped to just 2 months of supply, a 28.57% year-over-year decrease. The condo market offers slightly more balance, with San Mateo County at 1.7 months, Santa Clara County at 2.1 months, and Santa Cruz County at 3.2 months of supply. However, with inventory continuing to dwindle and demand remaining strong, buyers should expect stiff competition heading into the spring market!