Select a Market Report to Read:
National Market Update Overview
Bay Area
North Bay
East Bay
Silicon Valley
San Francisco
The Local Lowdown
Quick Take:
- The Bay Area closed out 2025 with unprecedented inventory contraction, with most regions experiencing 20-40% year-over-year inventory declines as the holiday season accelerated a dramatic shift toward seller's markets.
- San Francisco led regional price appreciation with single-family homes up 8.63% and inventory hitting historic lows of just 93 homes for sale, while other regions showed more mixed results with pockets of softness.
- Days on market trends diverged sharply across the region, with San Francisco and parts of the East Bay accelerating while other areas like Santa Cruz County experienced significant slowdowns despite tight inventory.
- The entire Bay Area has transformed into a seller's market territory across nearly all property types, with several regions reaching extreme supply constraints not seen in years.
Note: You can find the charts/graphs for the Local Lowdown at the end of this section.
*National Association of REALTORS® data is released two months behind, so we estimate the most recent month's data when possible and appropriate.
Price trends reveal regional divergence as the year closes
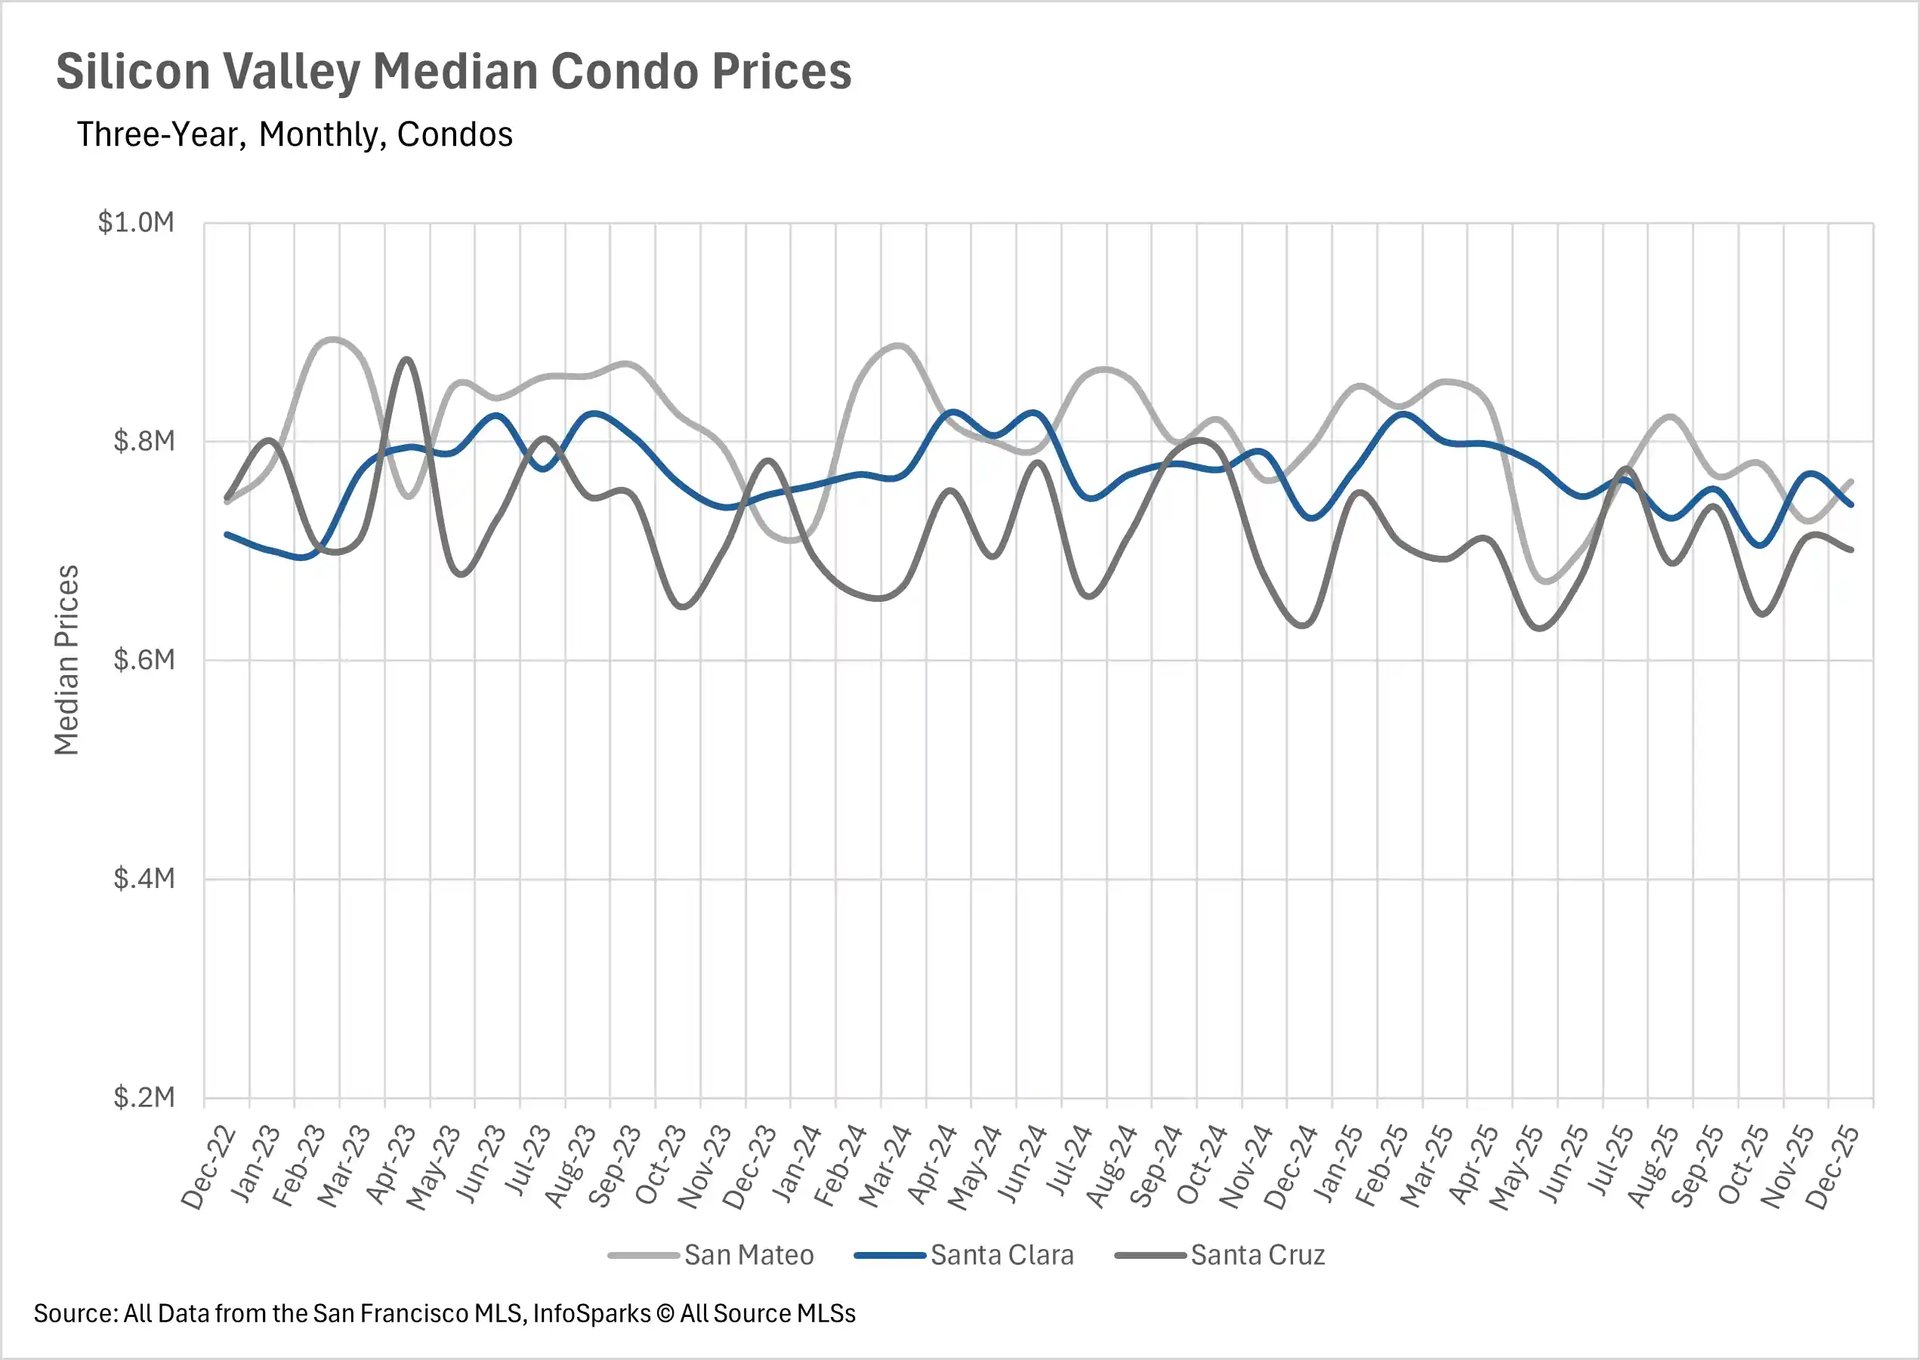
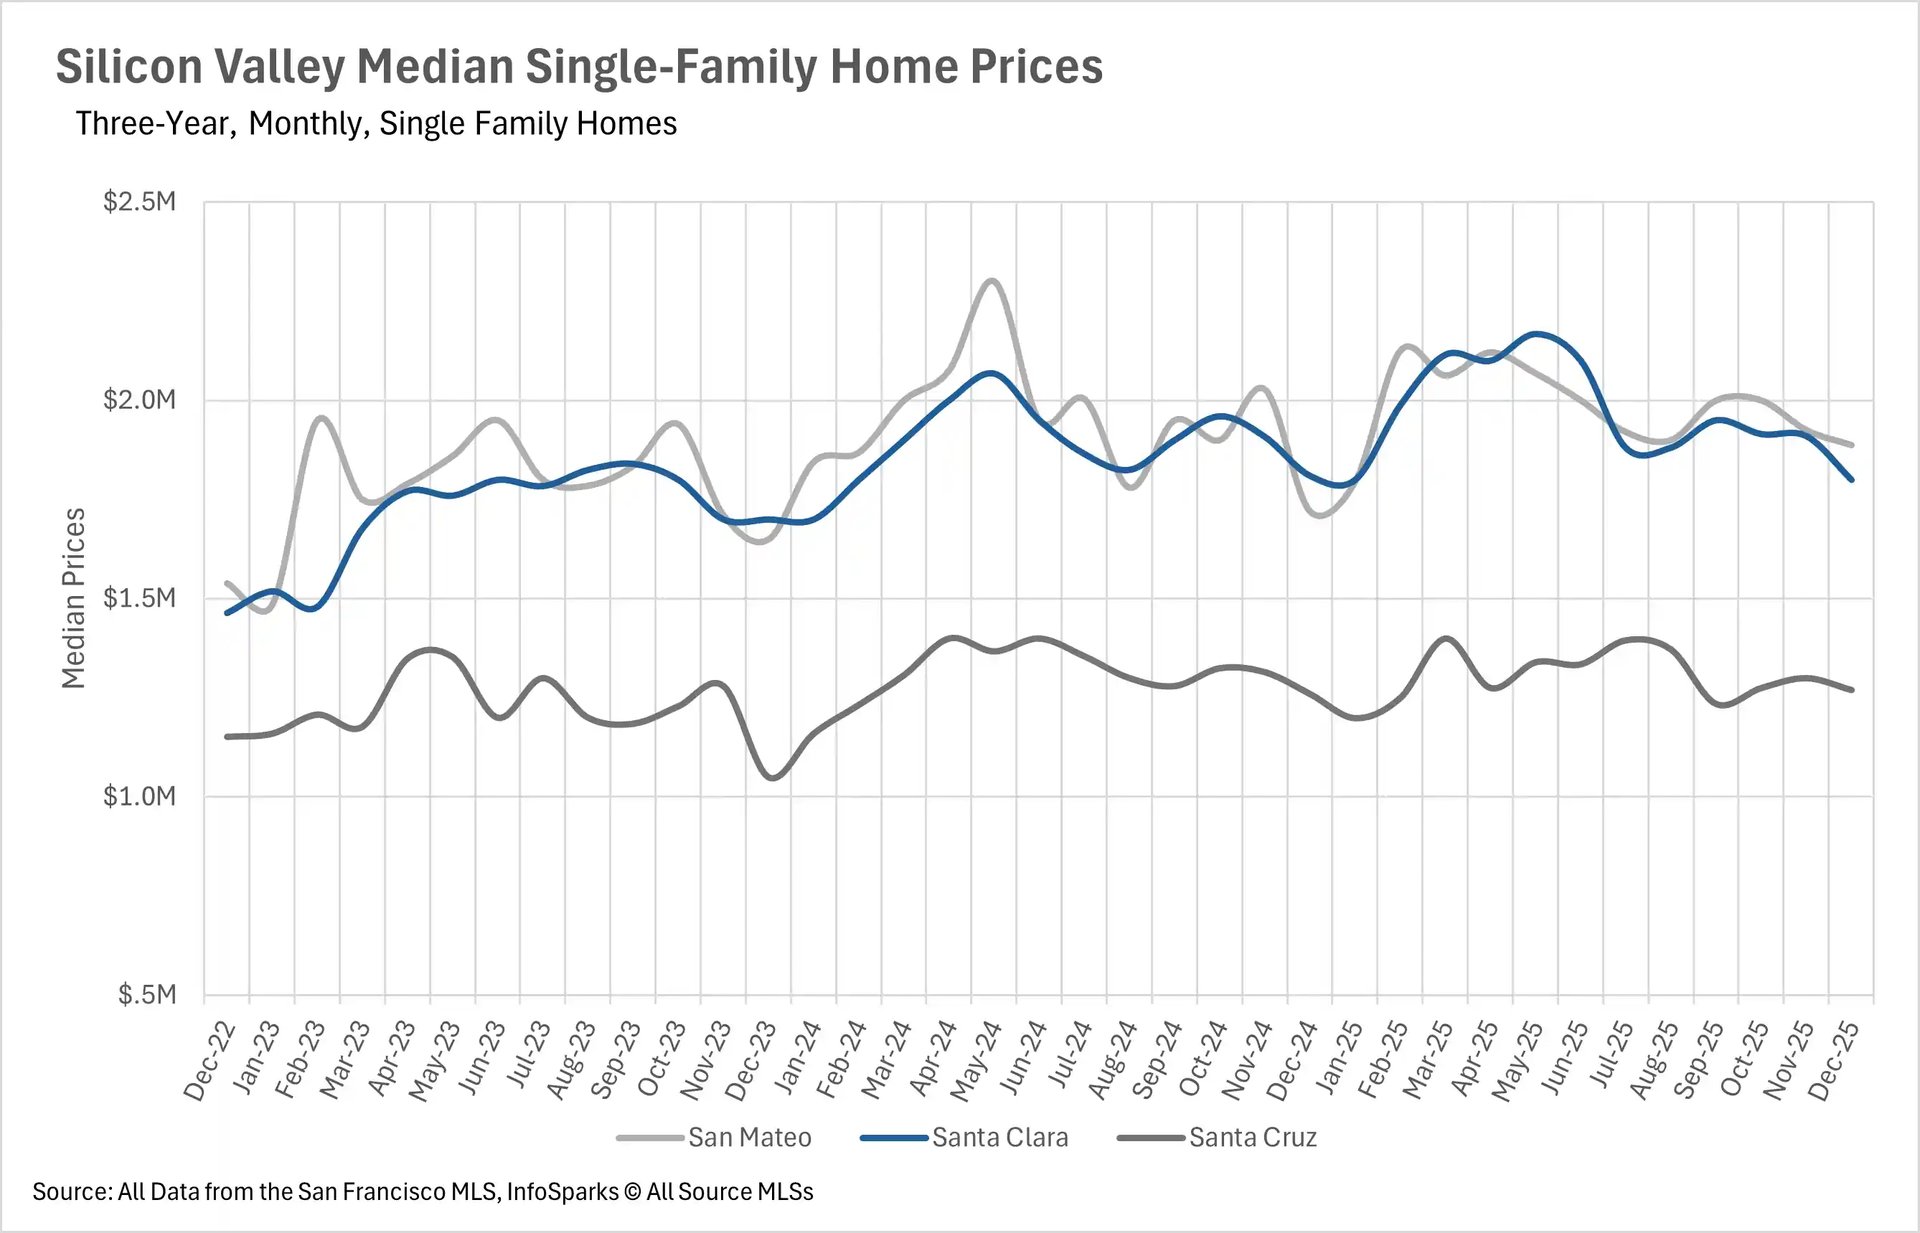
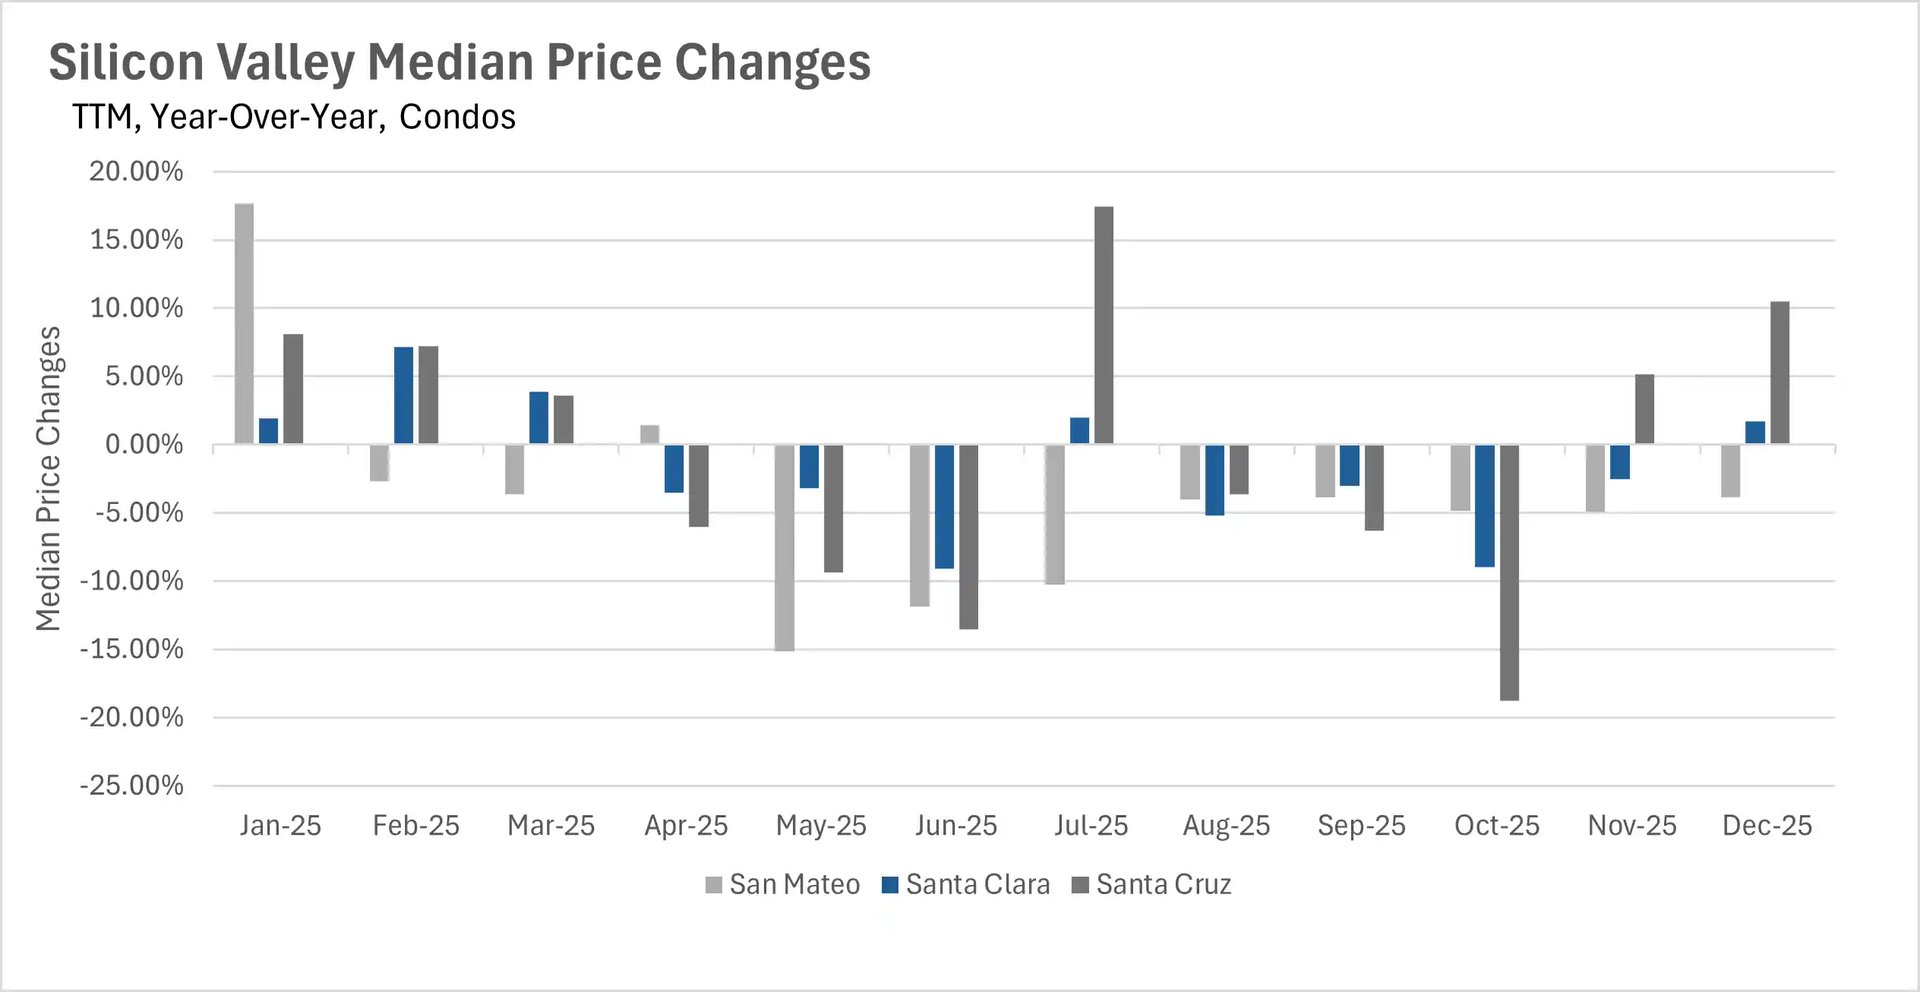
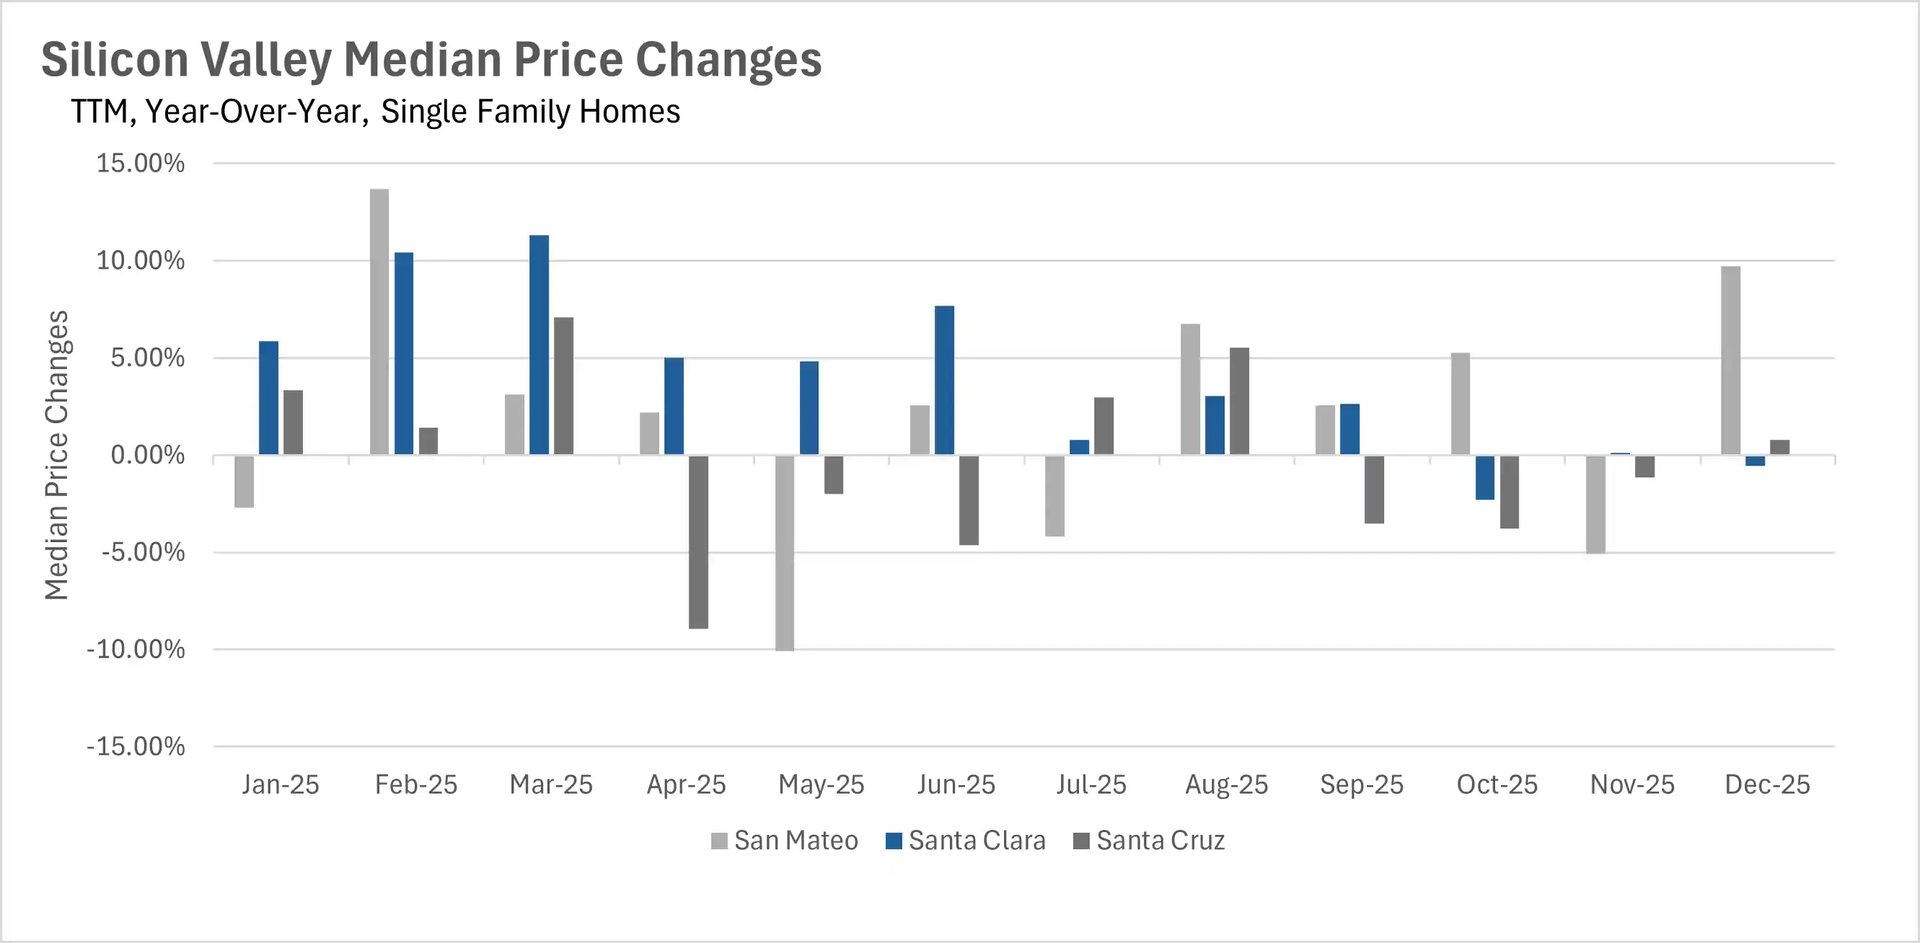
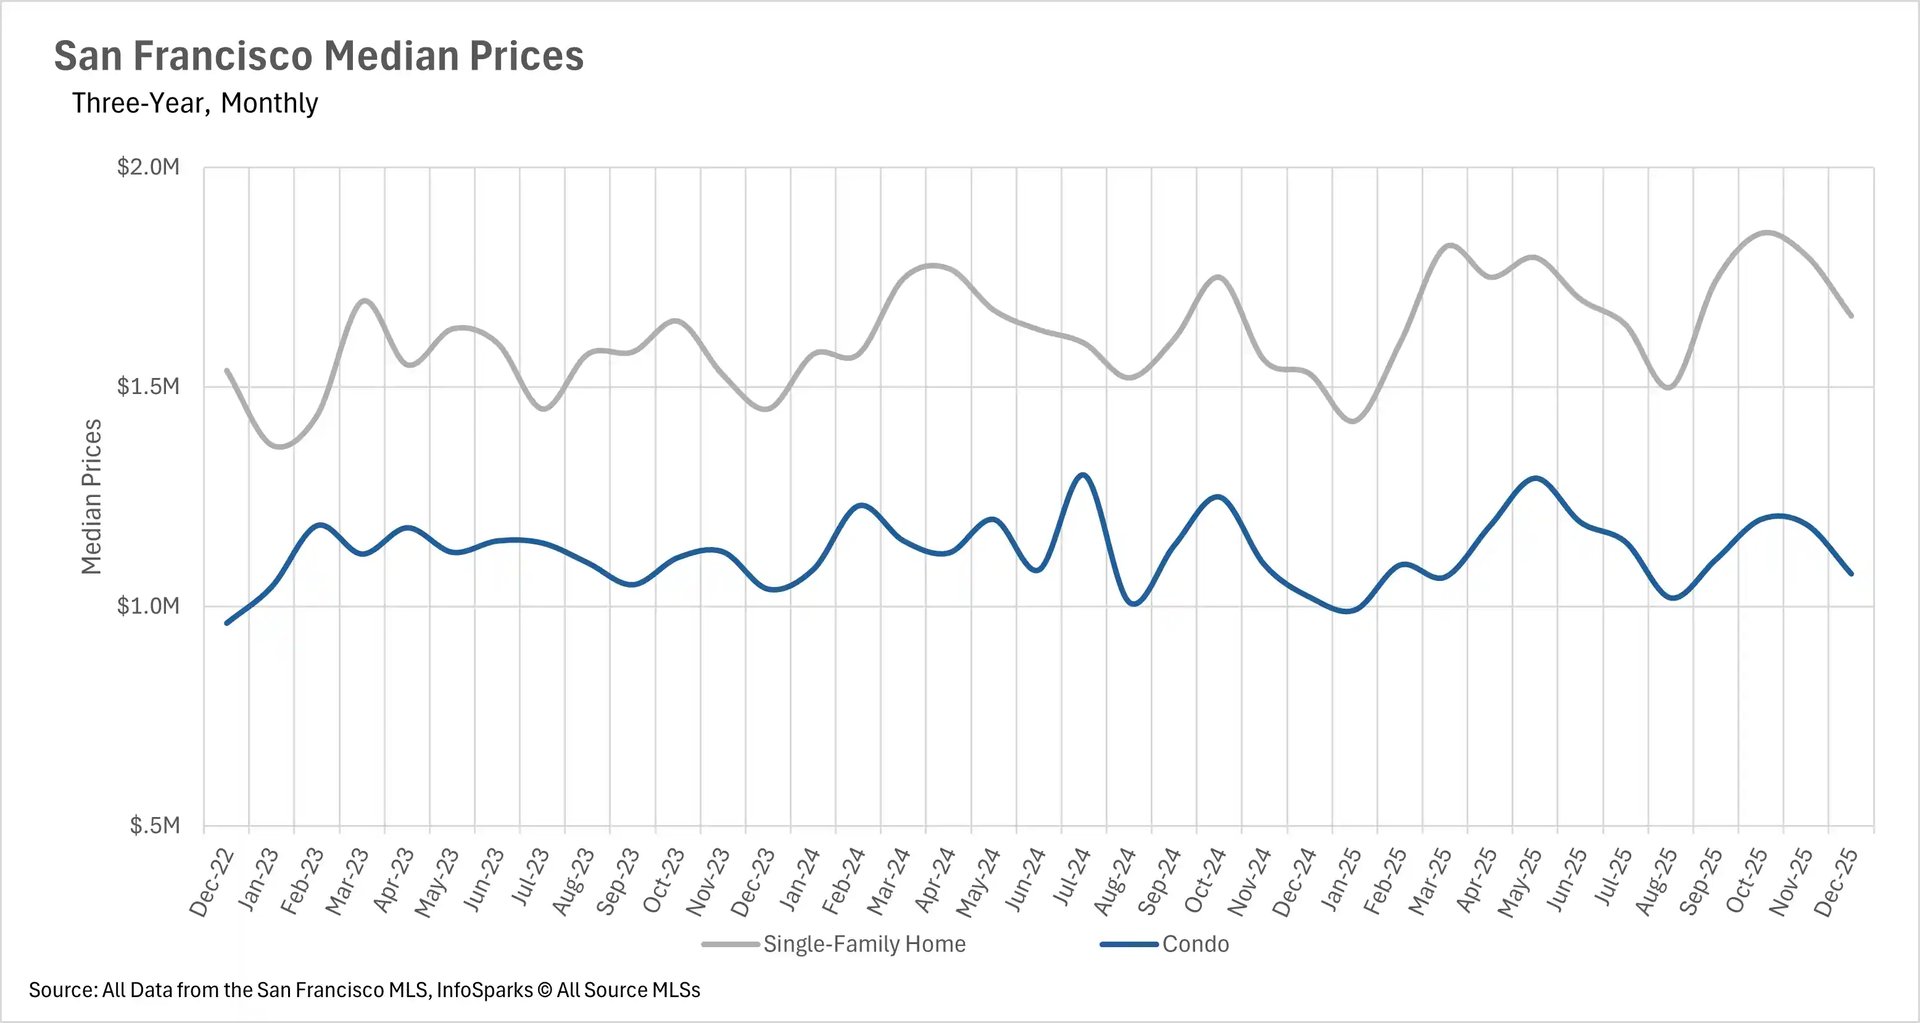
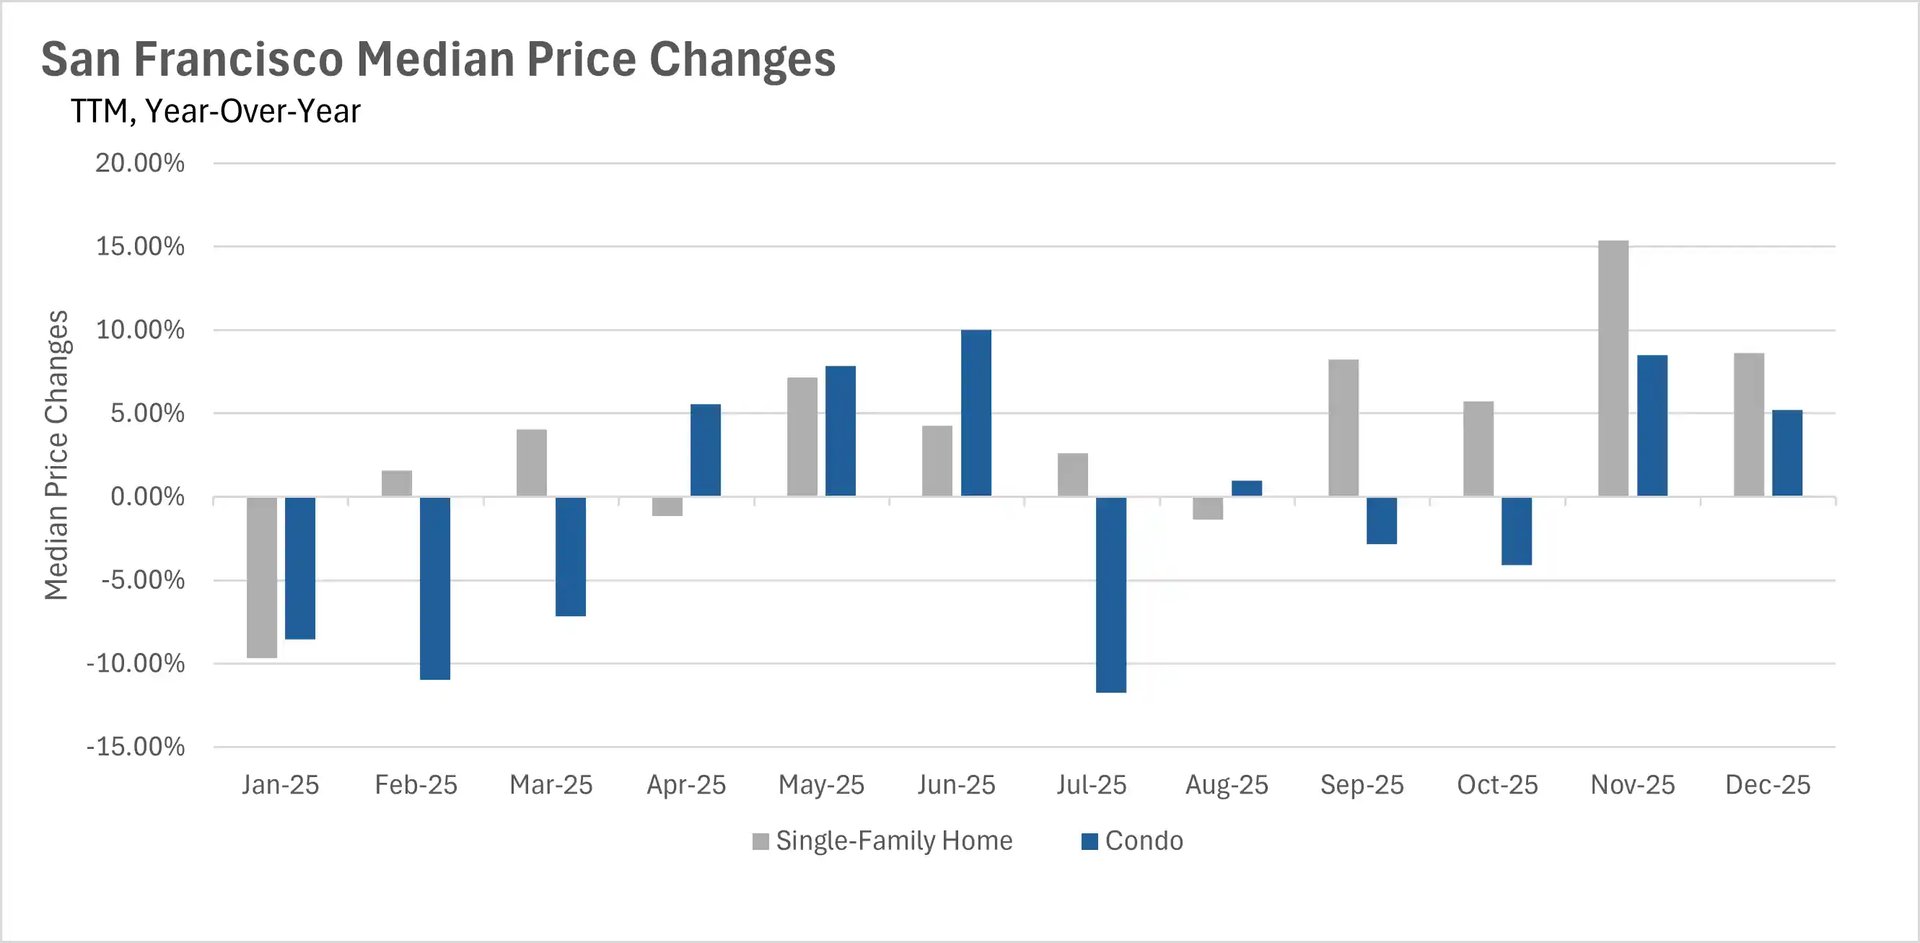
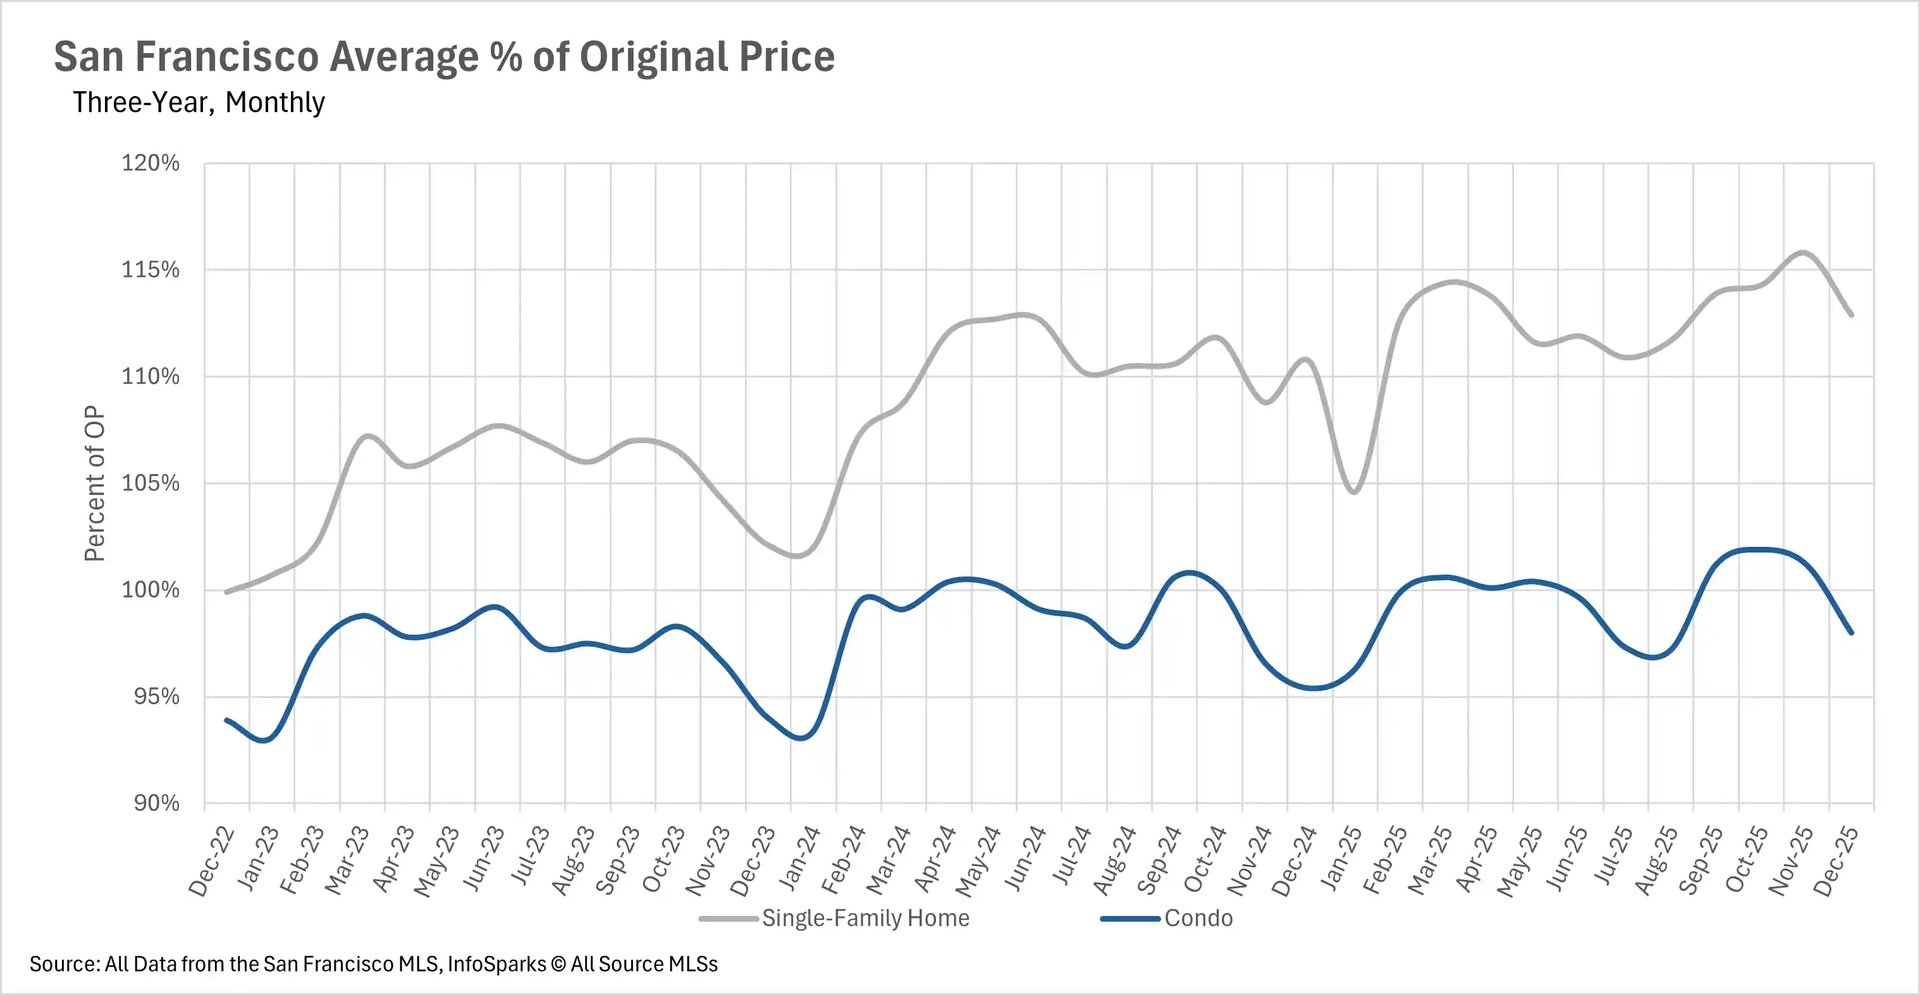
December brought mixed price performance across the Bay Area, with San Francisco leading appreciation while other regions showed varying results. San Francisco ended 2025 on a high note with single-family homes gaining 8.63% year-over-year to reach a median of $1,662,000, while condos rose 5.21% to $1,075,000. Single-family homes continue commanding significant premiums, selling for nearly 13% over asking price. Silicon Valley experienced a December rebound after November's rare across-the-board declines, with San Mateo County leading at 9.74% year-over-year gains to $1,887,500, while Santa Clara County saw a modest 0.55% decline to $1,800,000 and Santa Cruz remained relatively stable with a 0.79% increase to $1,270,000. Silicon Valley condos showed volatility, with San Mateo down 3.84%, Santa Clara up 1.71%, and Santa Cruz surging 10.48%.
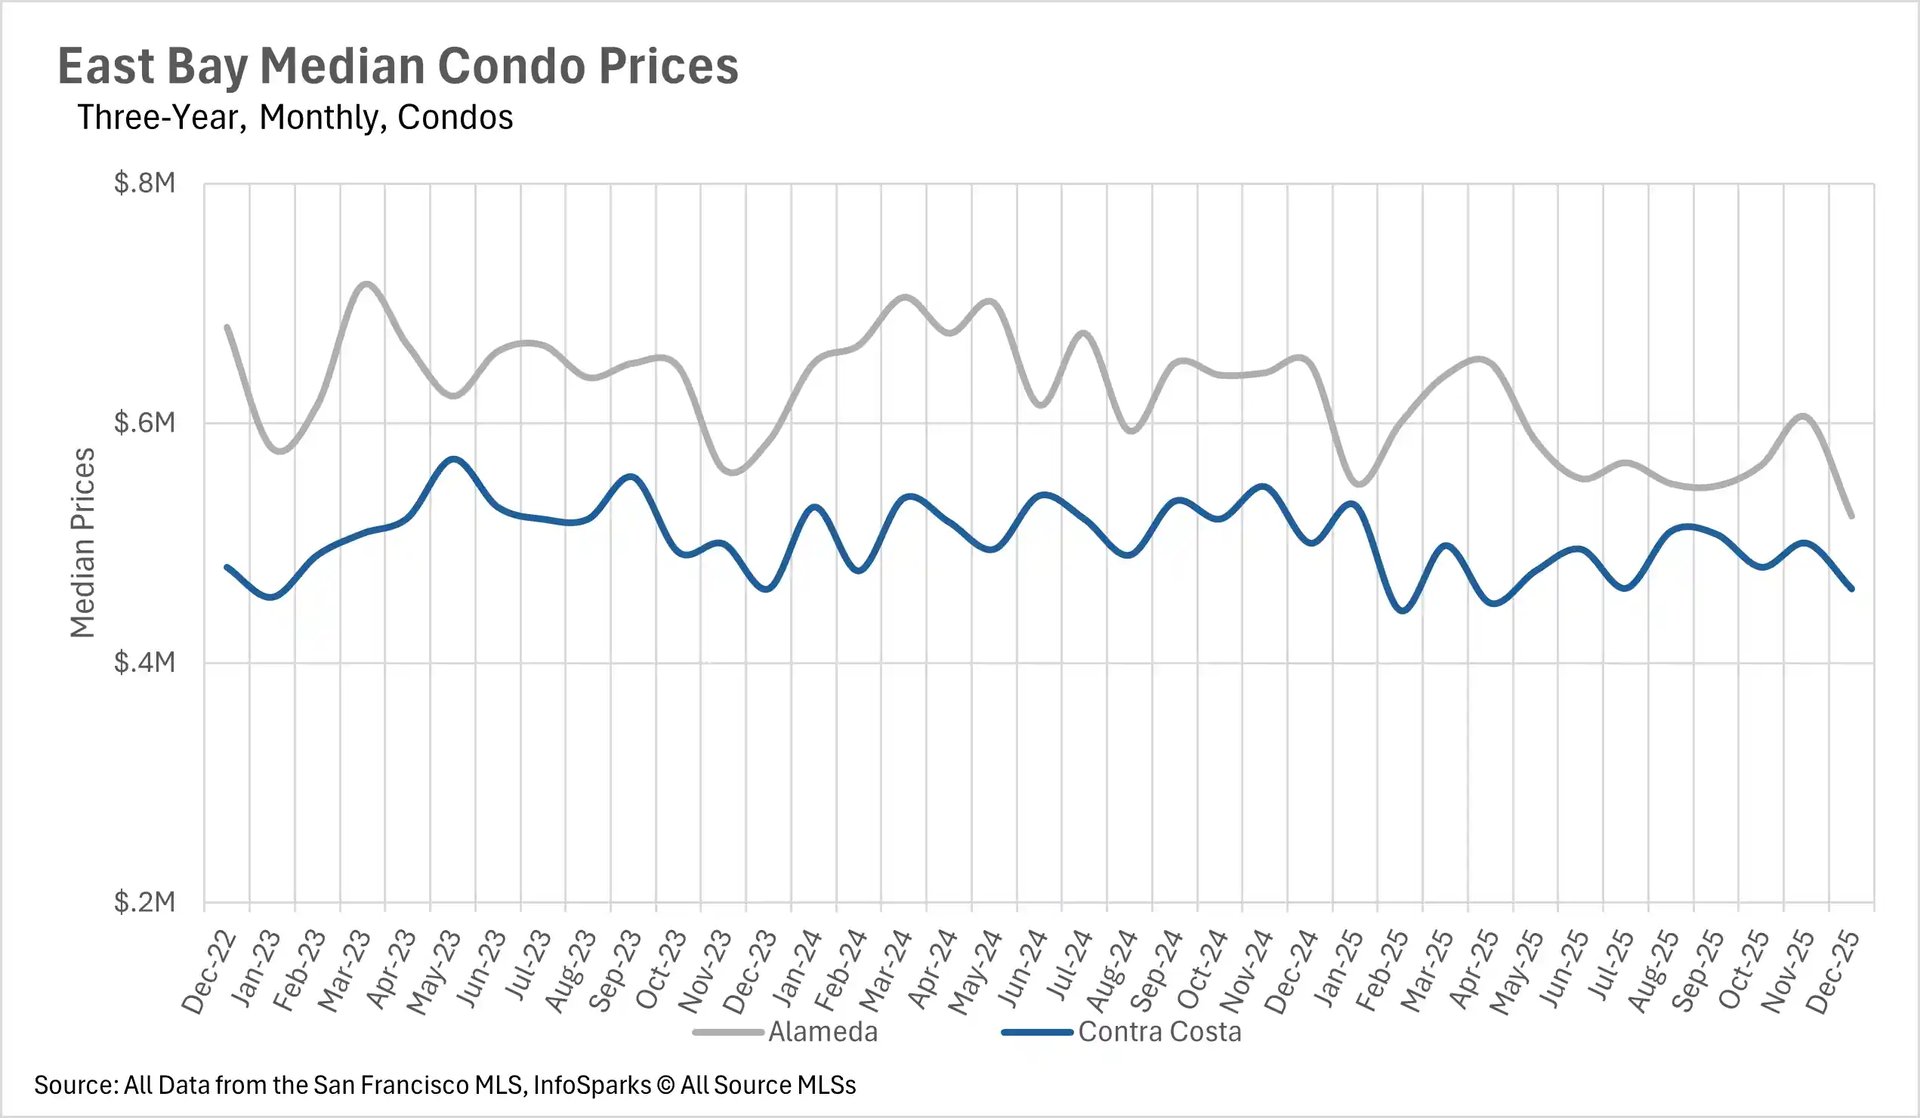
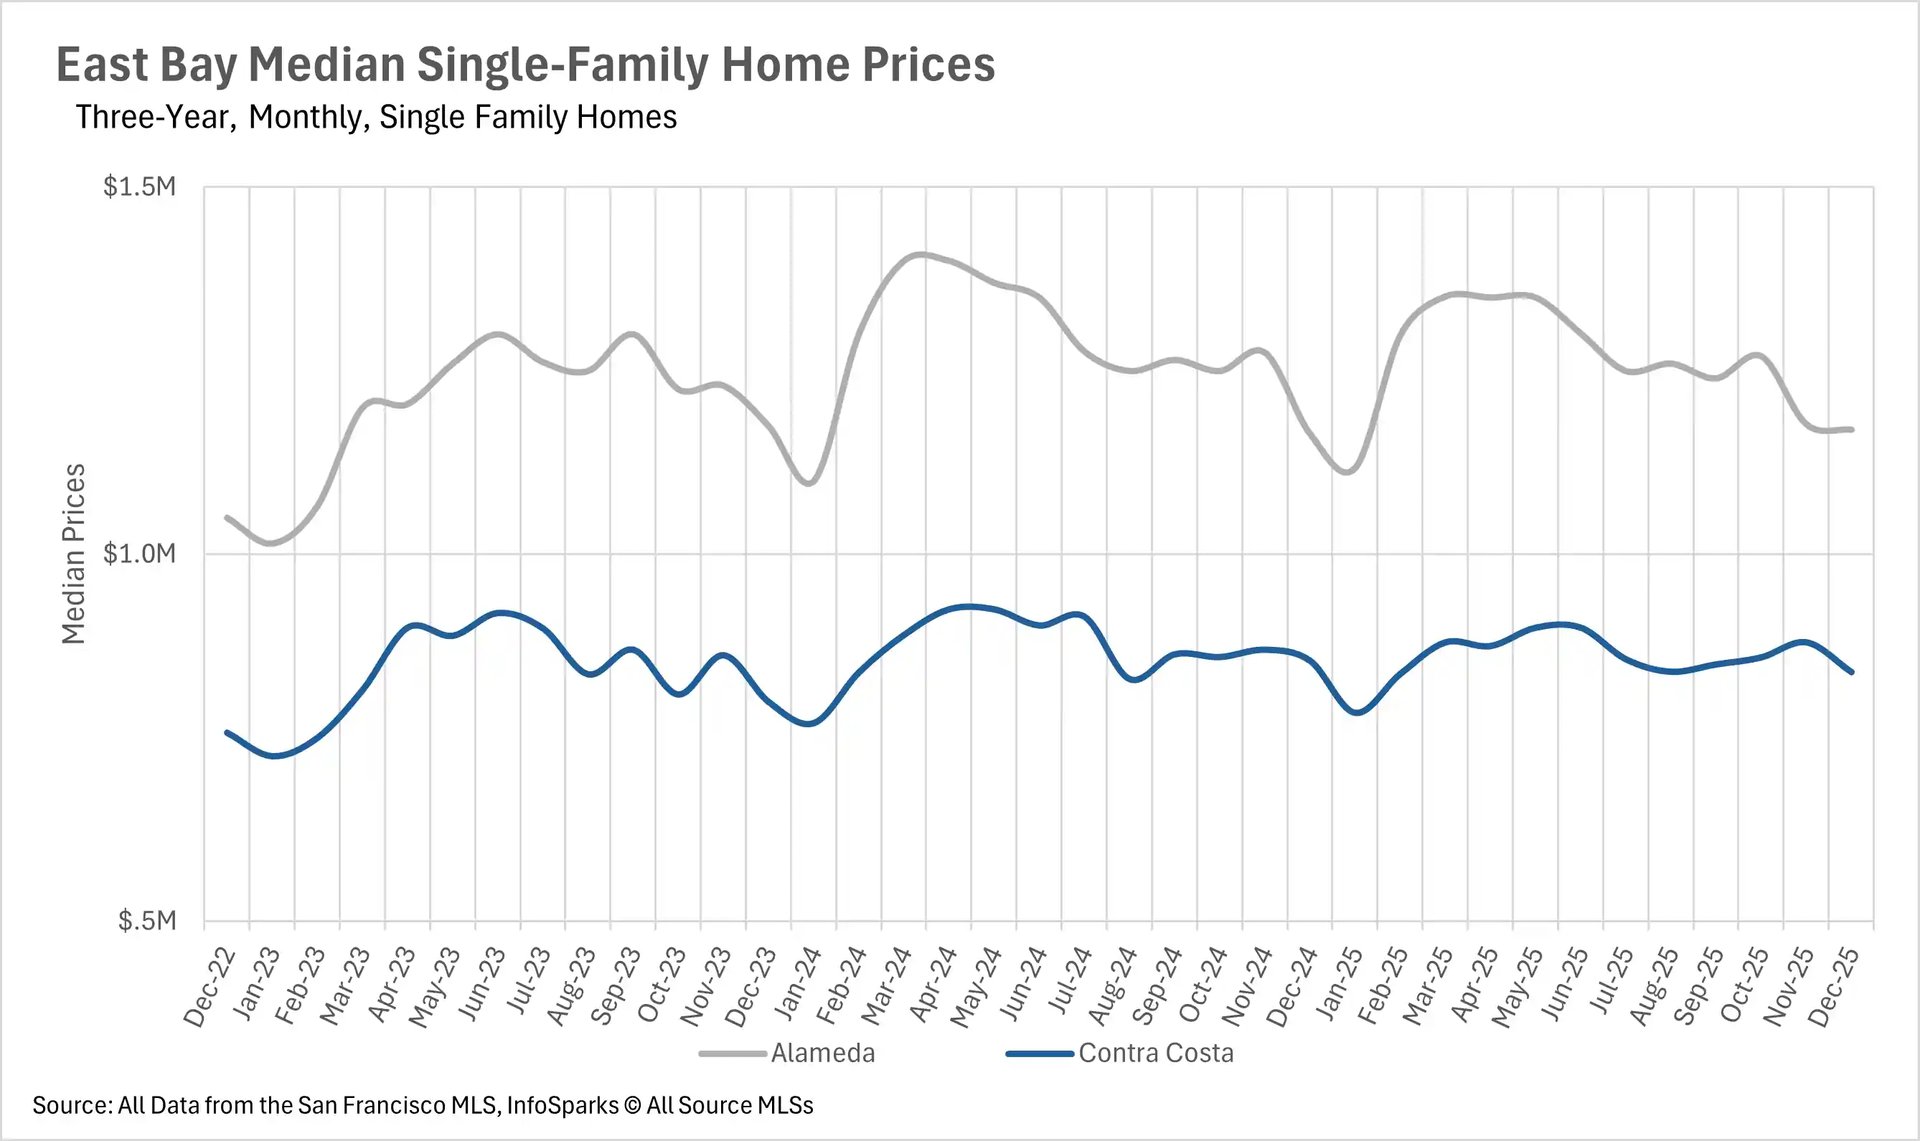
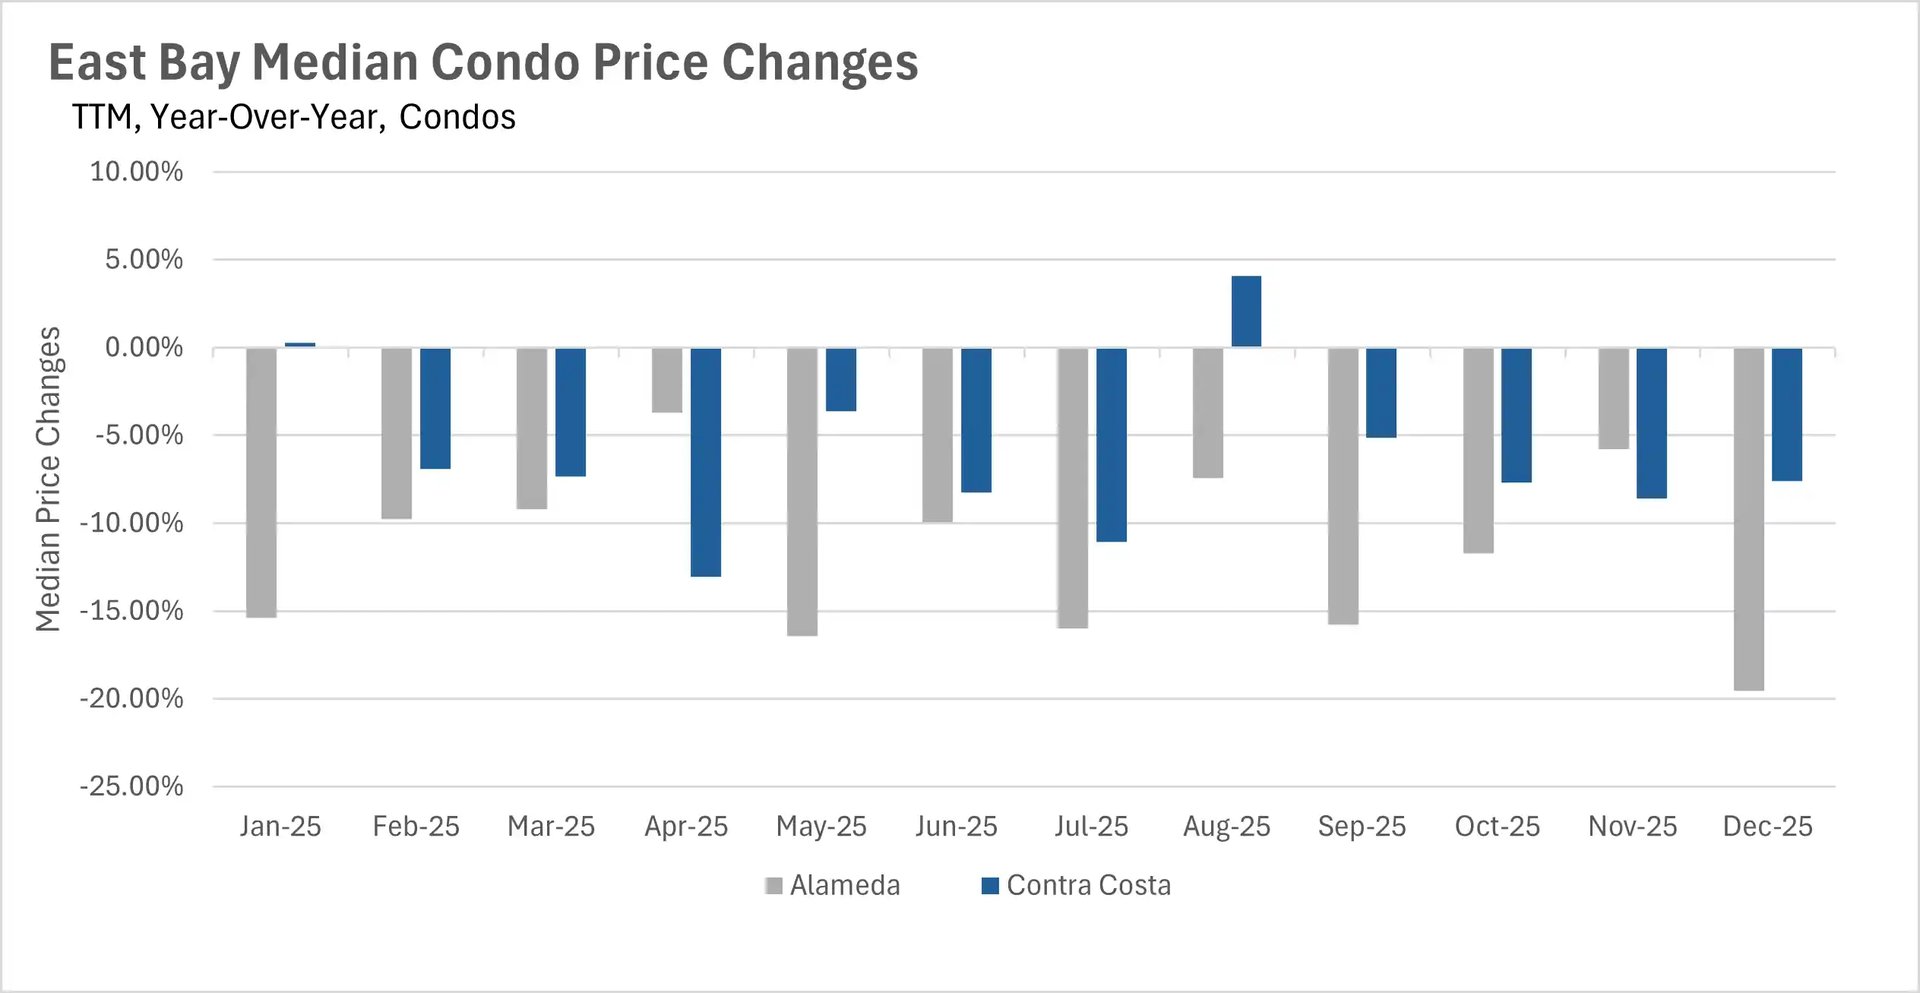
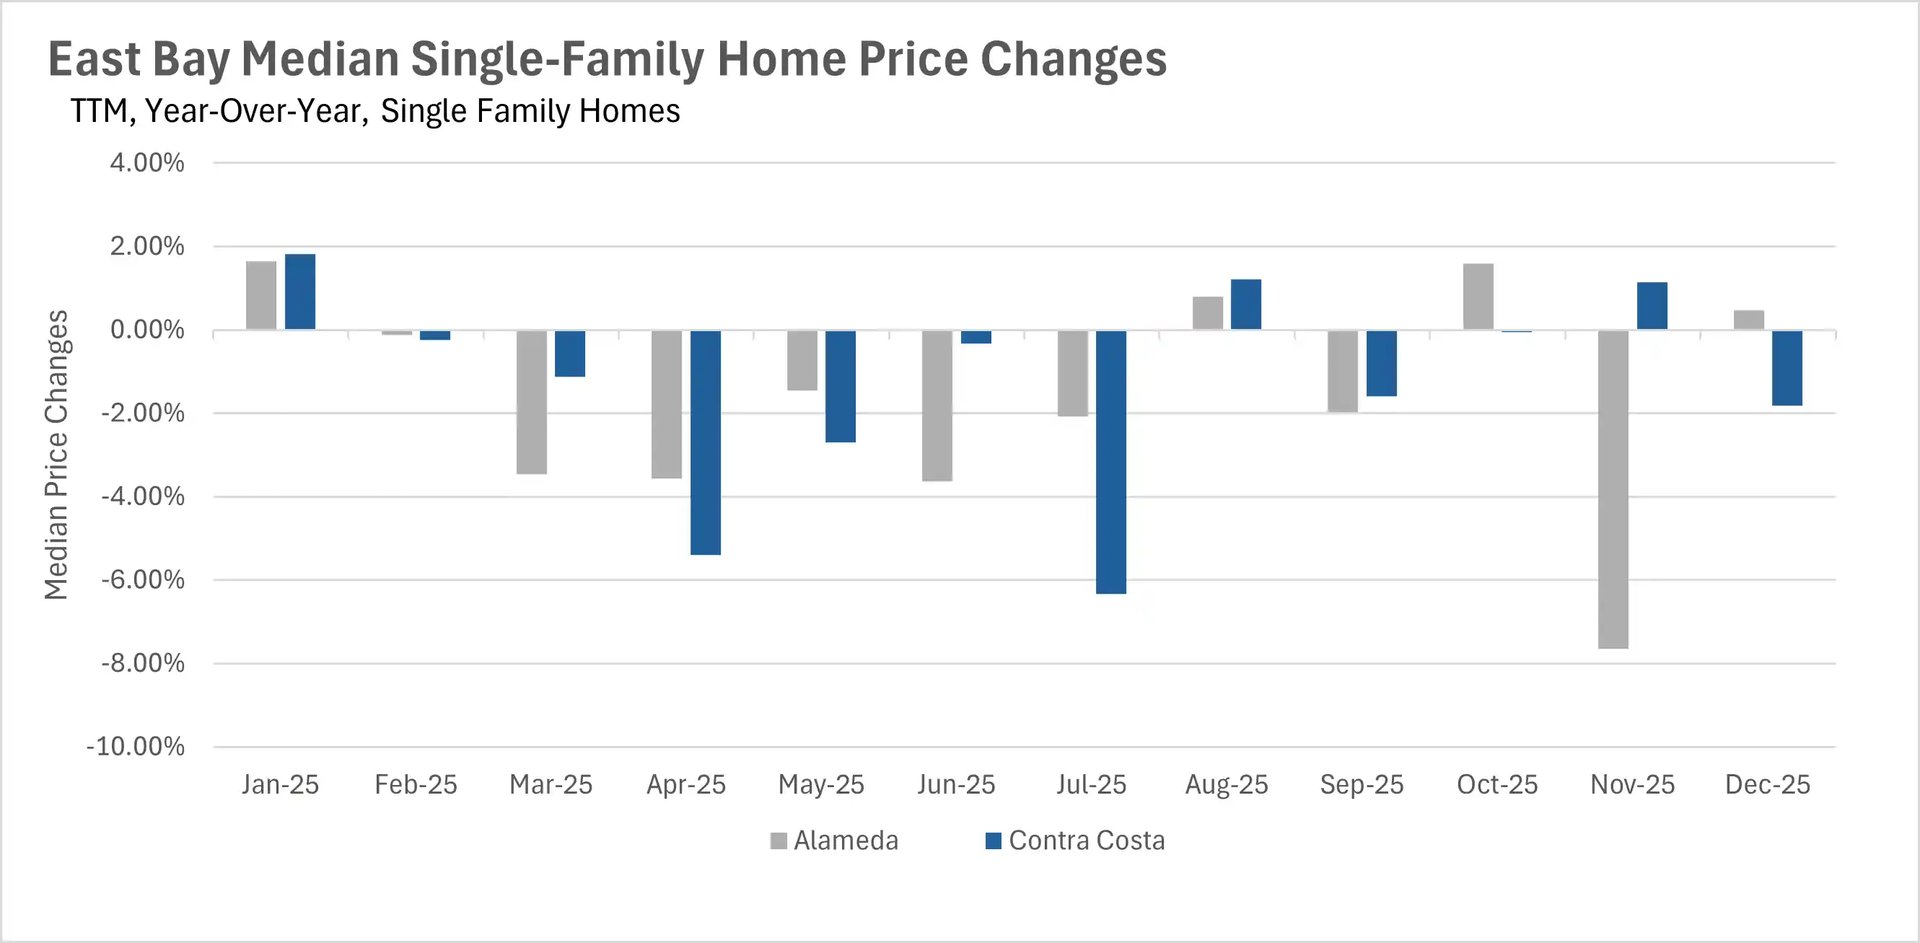
The East Bay demonstrated relative stability in single-family homes, with Alameda County up just 0.47% to $1,170,000 and Contra Costa down 1.81% to $839,500, though condos continued struggling with Alameda plummeting 19.55% to $522,500 and Contra Costa falling 7.60% to $462,000. The North Bay presented a tale of two markets, with Napa County emerging as the clear winner at 7.34% growth to $944,624 and Marin up modestly 0.83% to $1,512,500, while Sonoma and Solano declined by 1.18% and 0.61%, respectively. North Bay condos showed extreme volatility with Marin crashing 33.59% while Sonoma rose 5.86% and Napa gained 13.13%.
Historic inventory contraction transforms Bay Area supply landscape
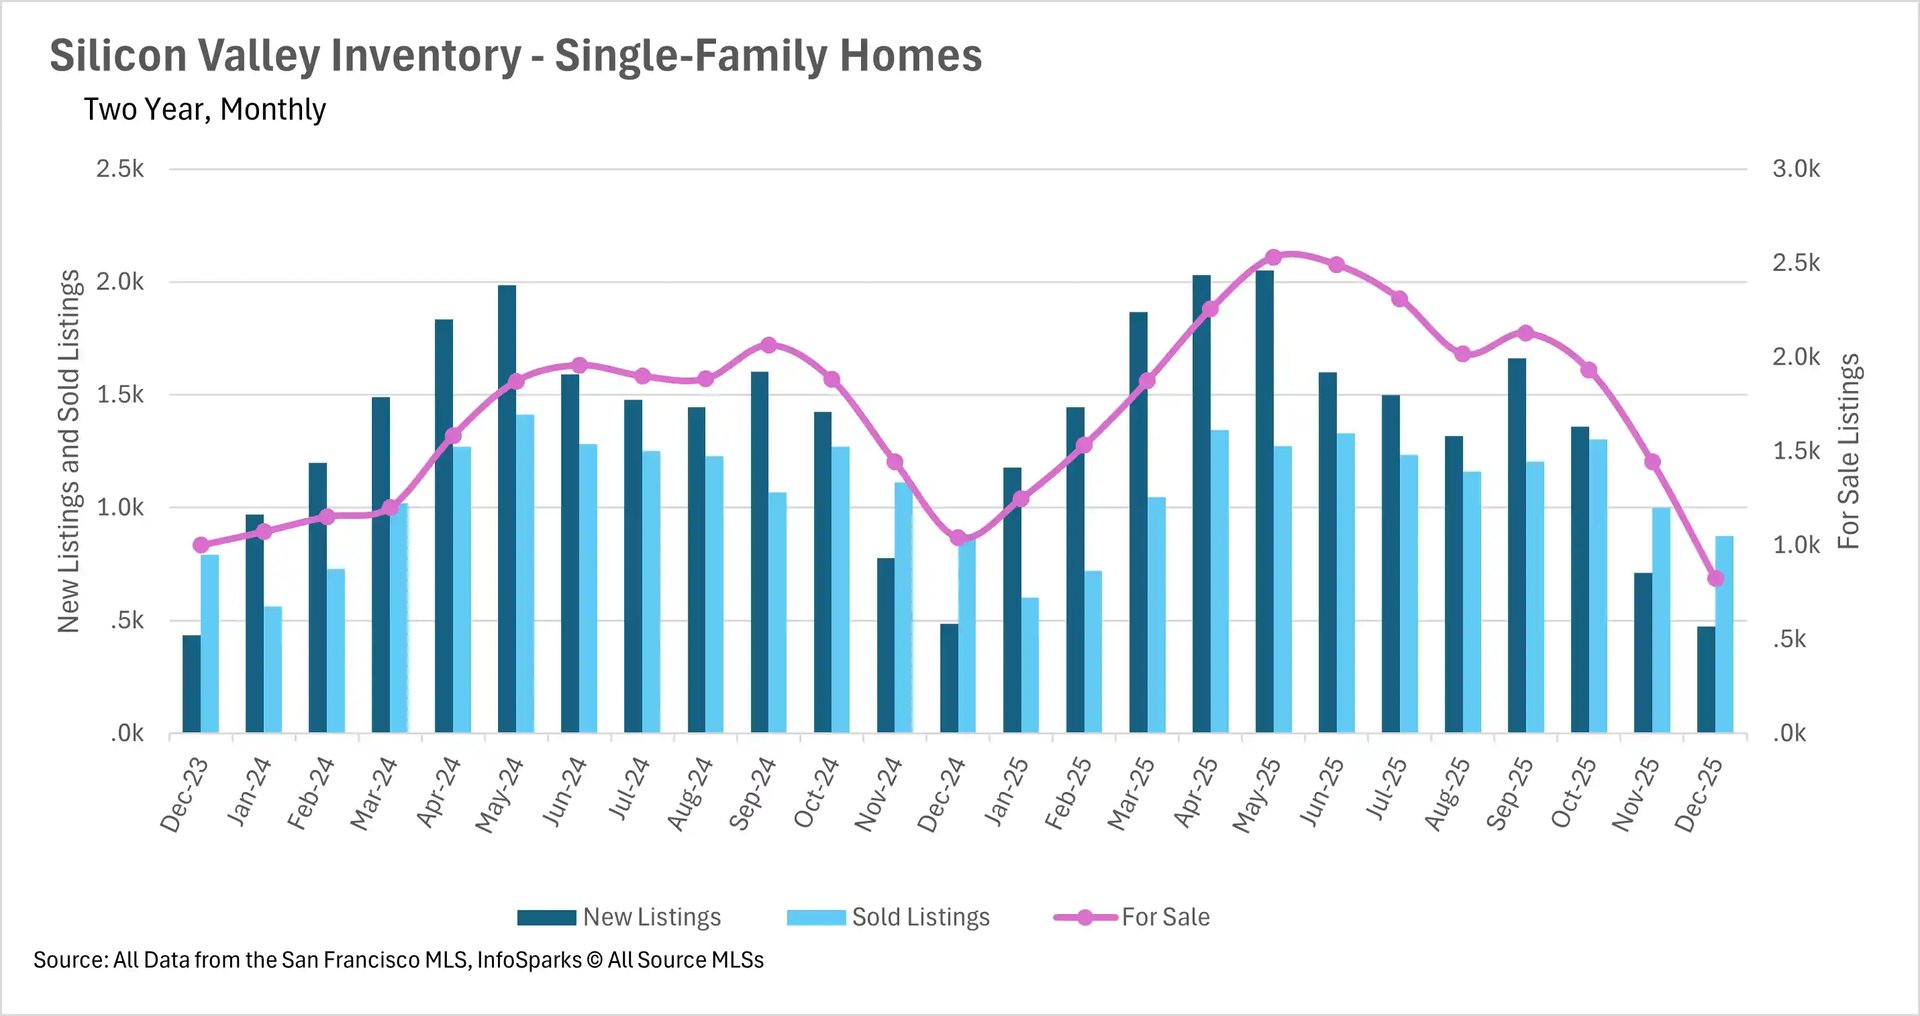
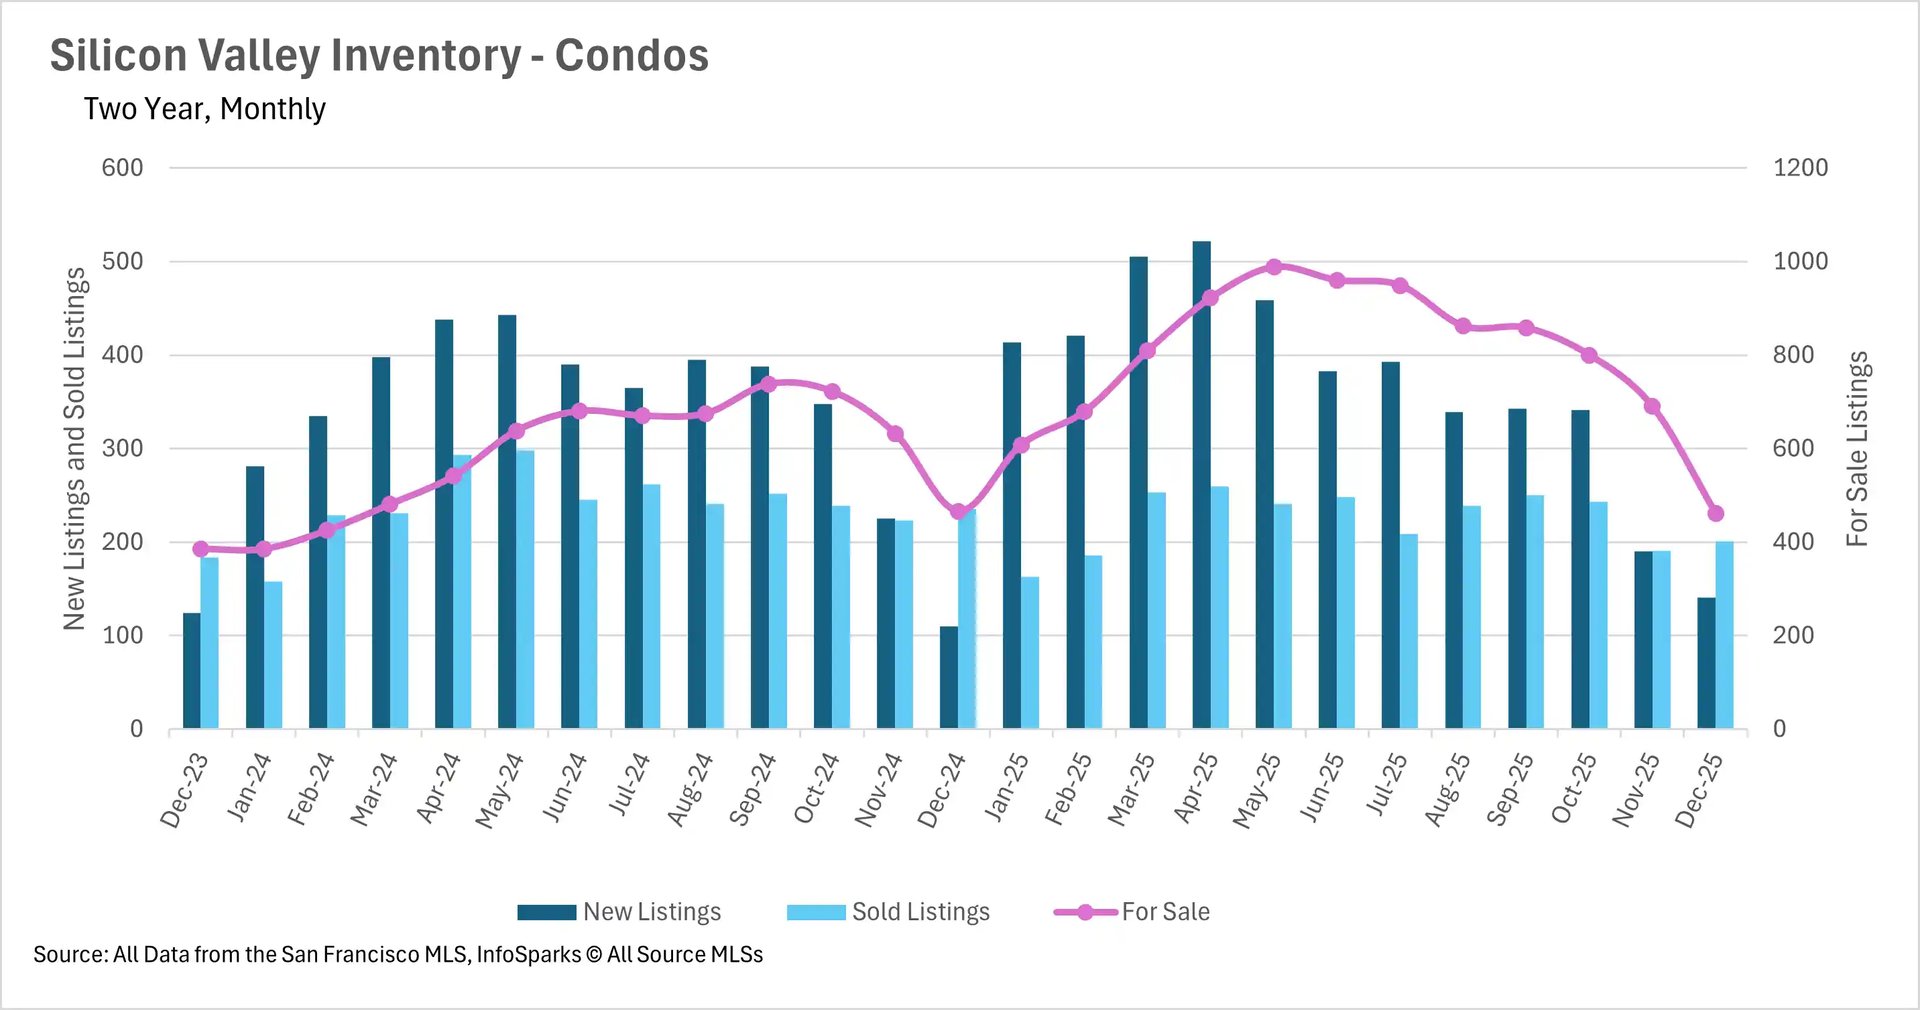
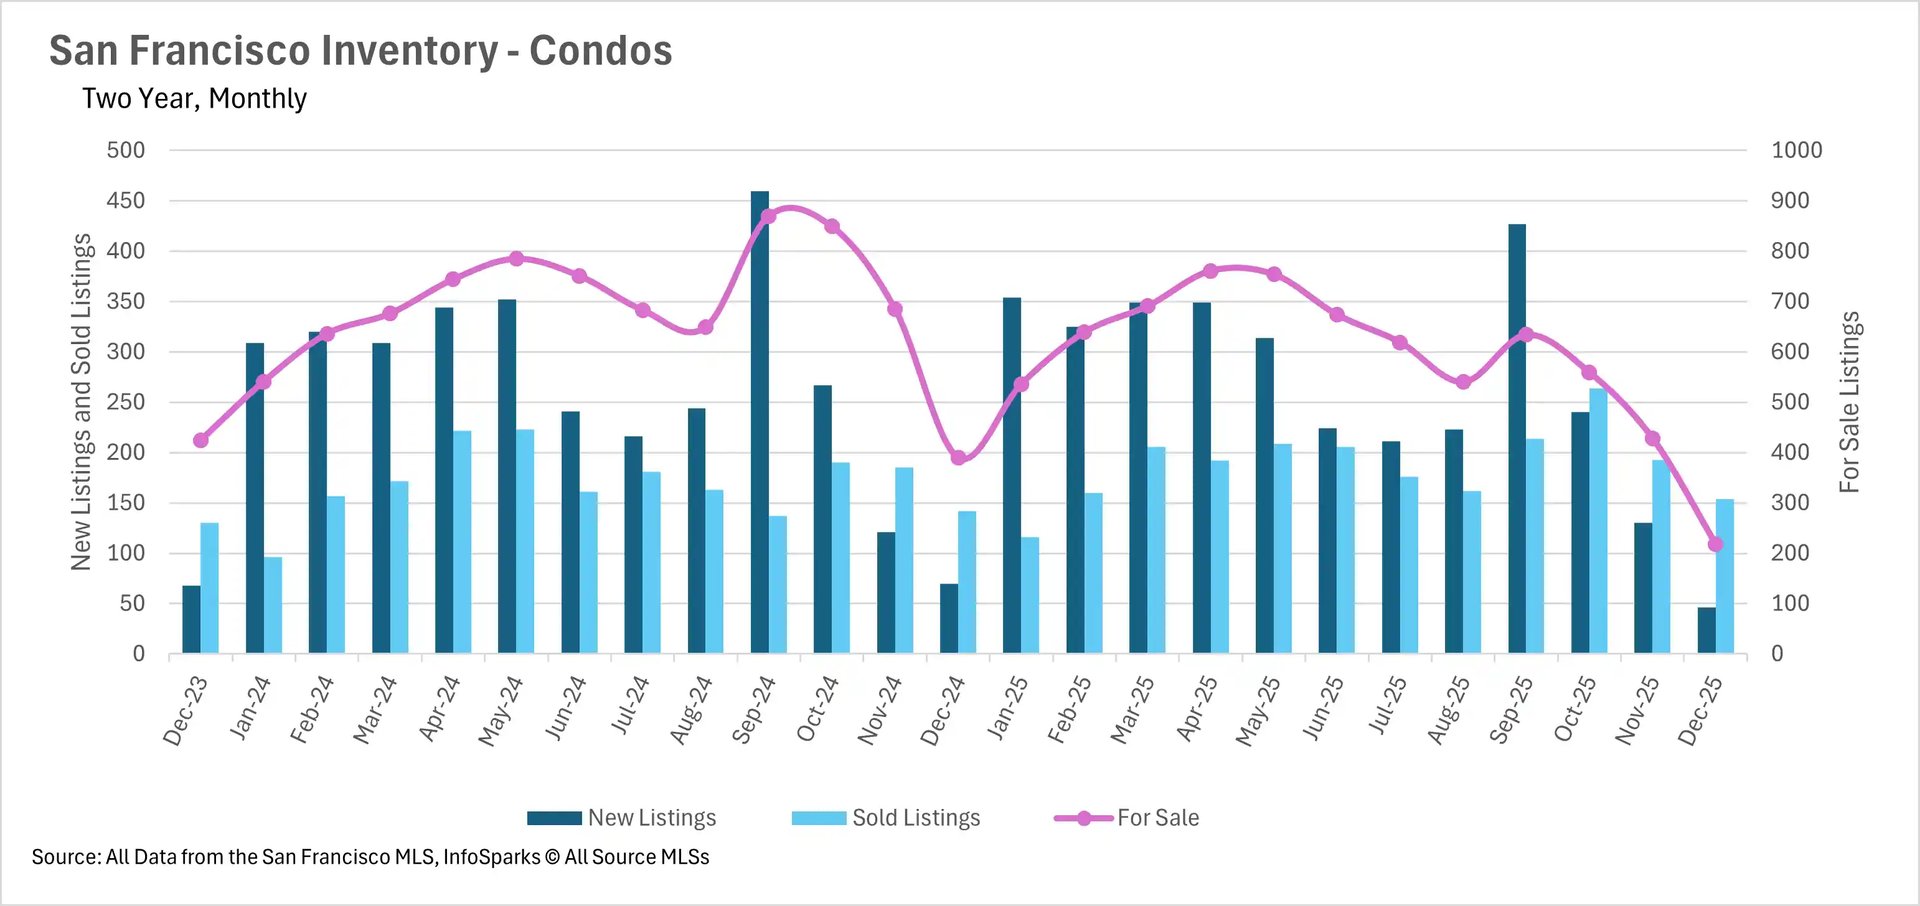
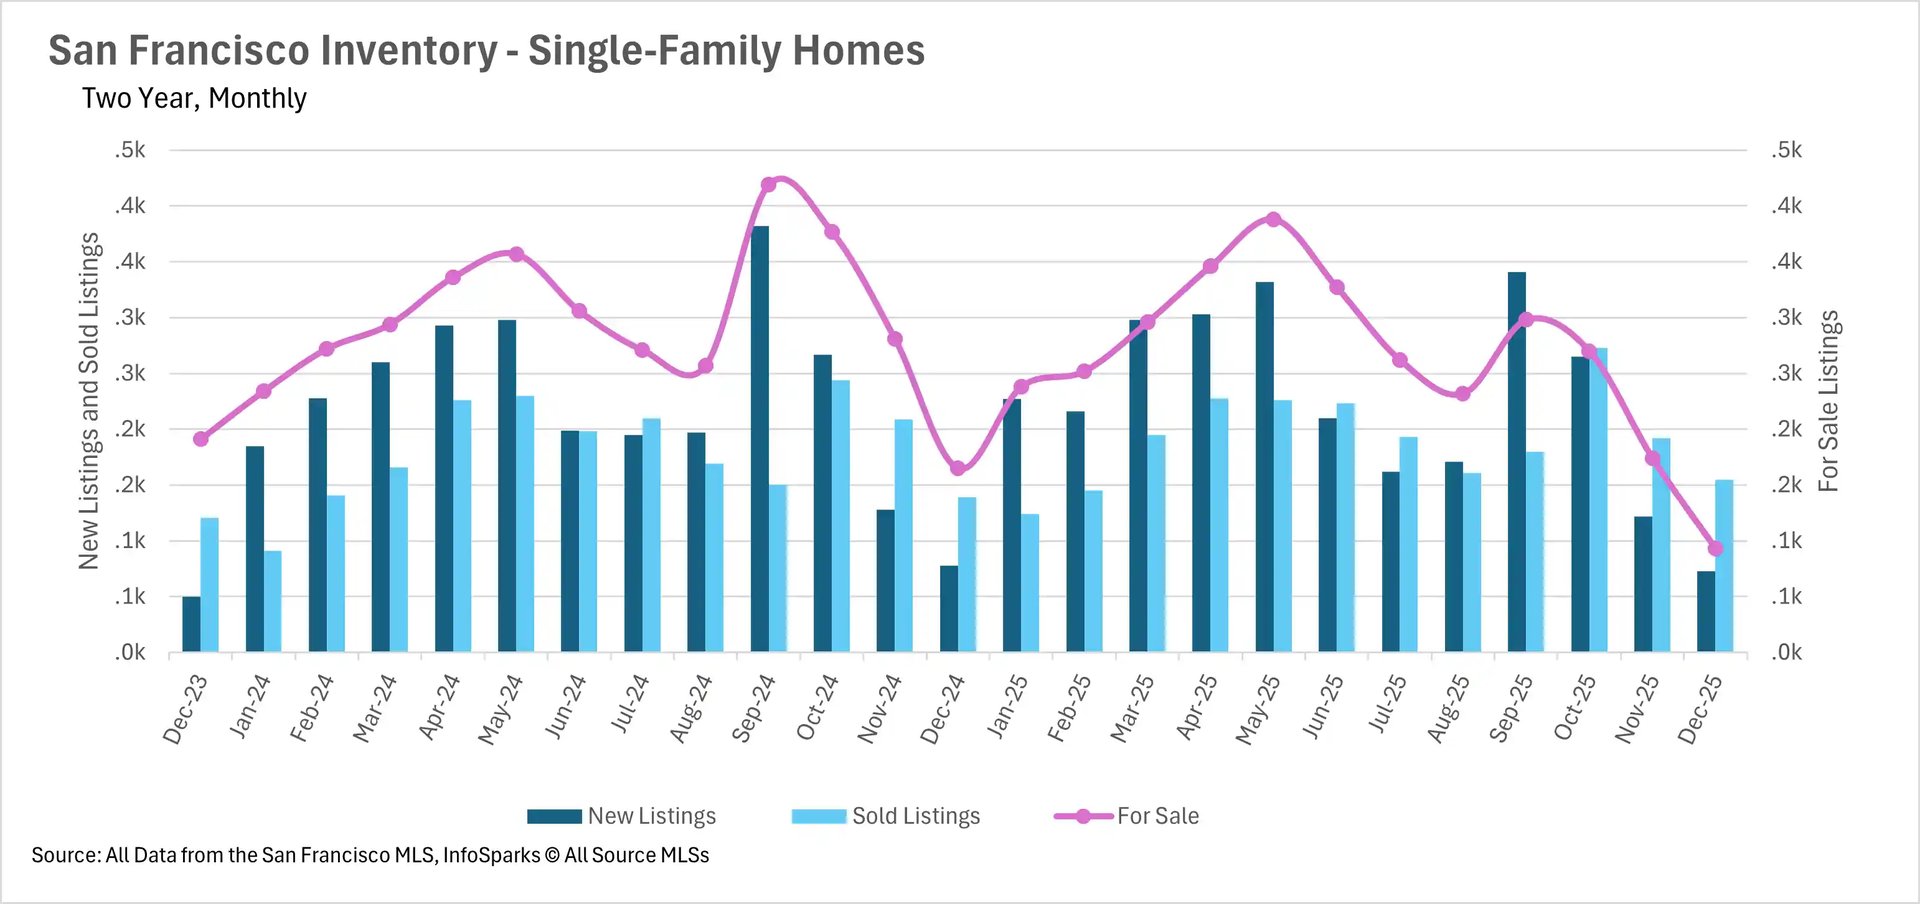
December brought an extraordinary inventory collapse across the entire Bay Area, creating some of the tightest supply conditions seen in years. San Francisco reached unprecedented levels with just 93 single-family homes for sale (down 43.64% year-over-year) and only 218 condos (down 44.10%), leaving a combined total of just 311 homes available in the entire city. Silicon Valley experienced a similarly dramatic contraction, with single-family inventory plunging 43.01% month-over-month and 21.02% year-over-year to just 823 homes, while condo inventory dropped 33.04% month-over-month though remained essentially flat year-over-year.
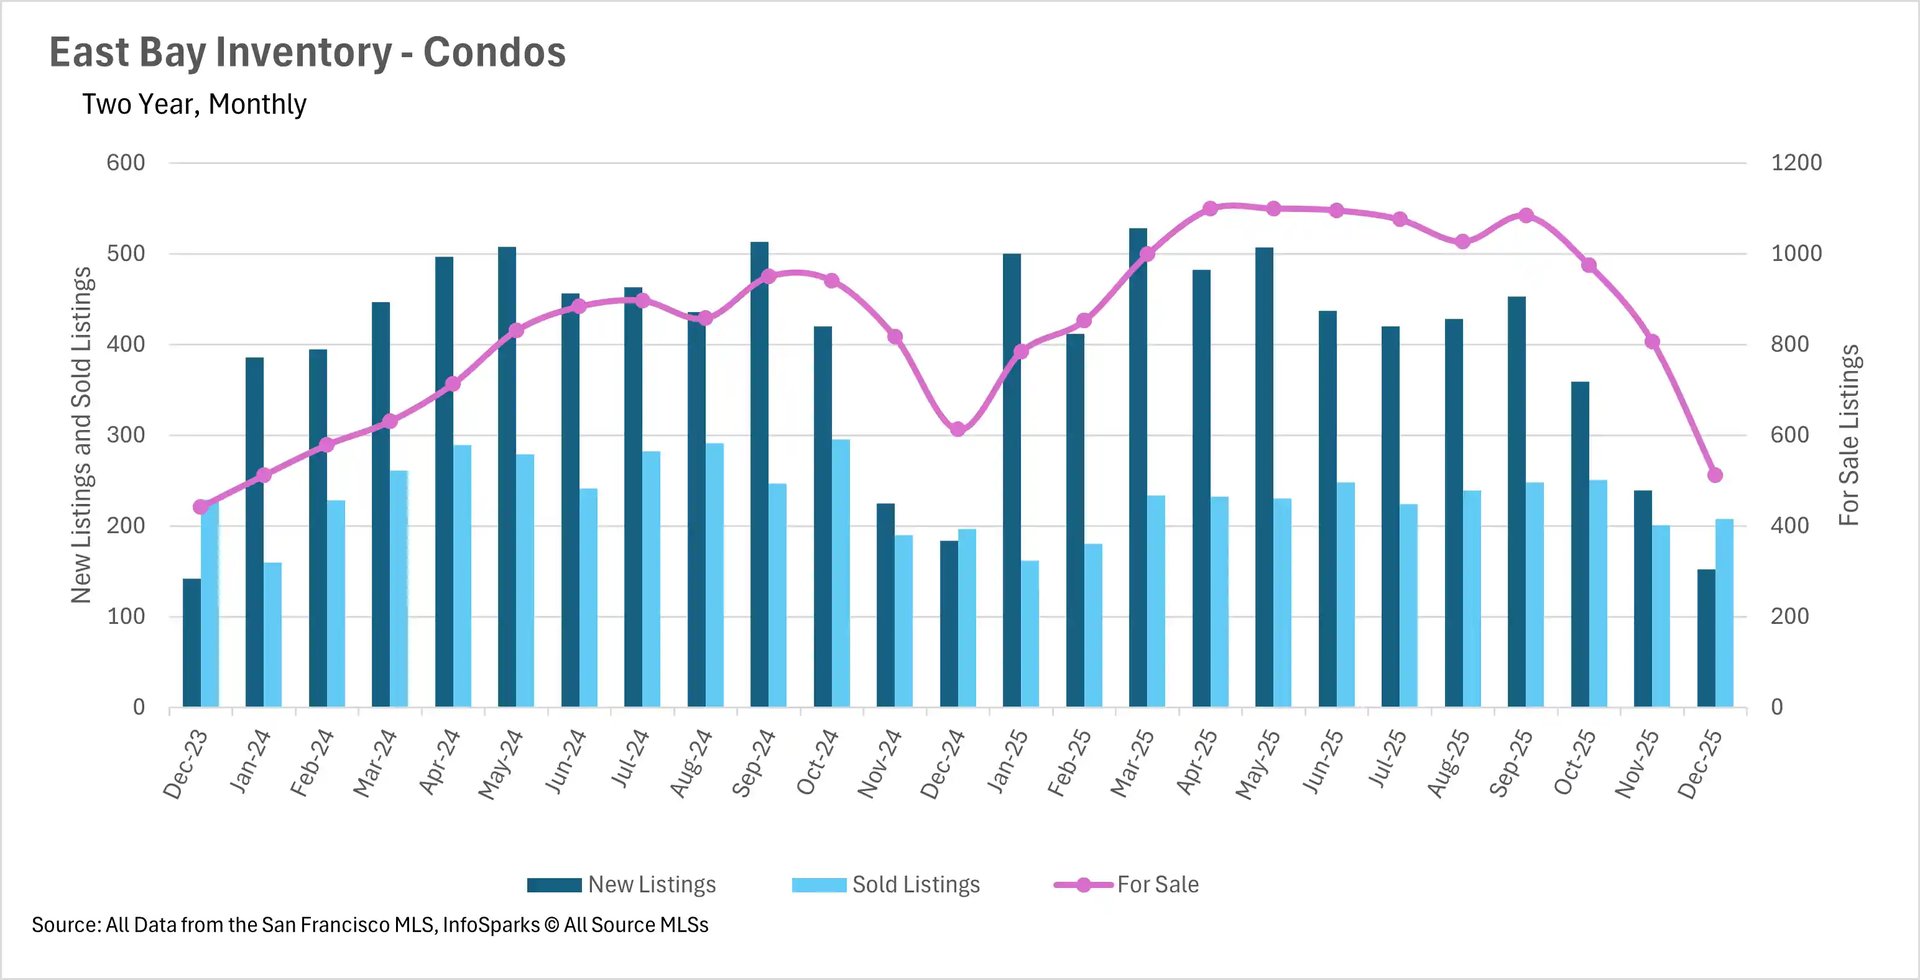
The North Bay saw single-family inventory crater by 43.56% month-over-month and 38.85% year-over-year to just 1,407 homes, while condo inventory fell 36.83% month-over-month and 27.99% year-over-year to merely 211 units. This decline was exacerbated by new listings plummeting 51.19% year-over-year for single-family homes and 54.93% for condos. The East Bay showed relatively modest but still significant declines, with single-family inventory down 18.70% year-over-year to 1,265 homes and condo inventory falling 16.48% to 512 units. Across all regions, the magnitude of inventory decline exceeded typical seasonal patterns, suggesting that buyers who had been waiting on the sidelines throughout 2025 finally began acting, while new listings dried up dramatically as sellers held back during the holidays.
Market velocity shows extreme regional and property type divergence
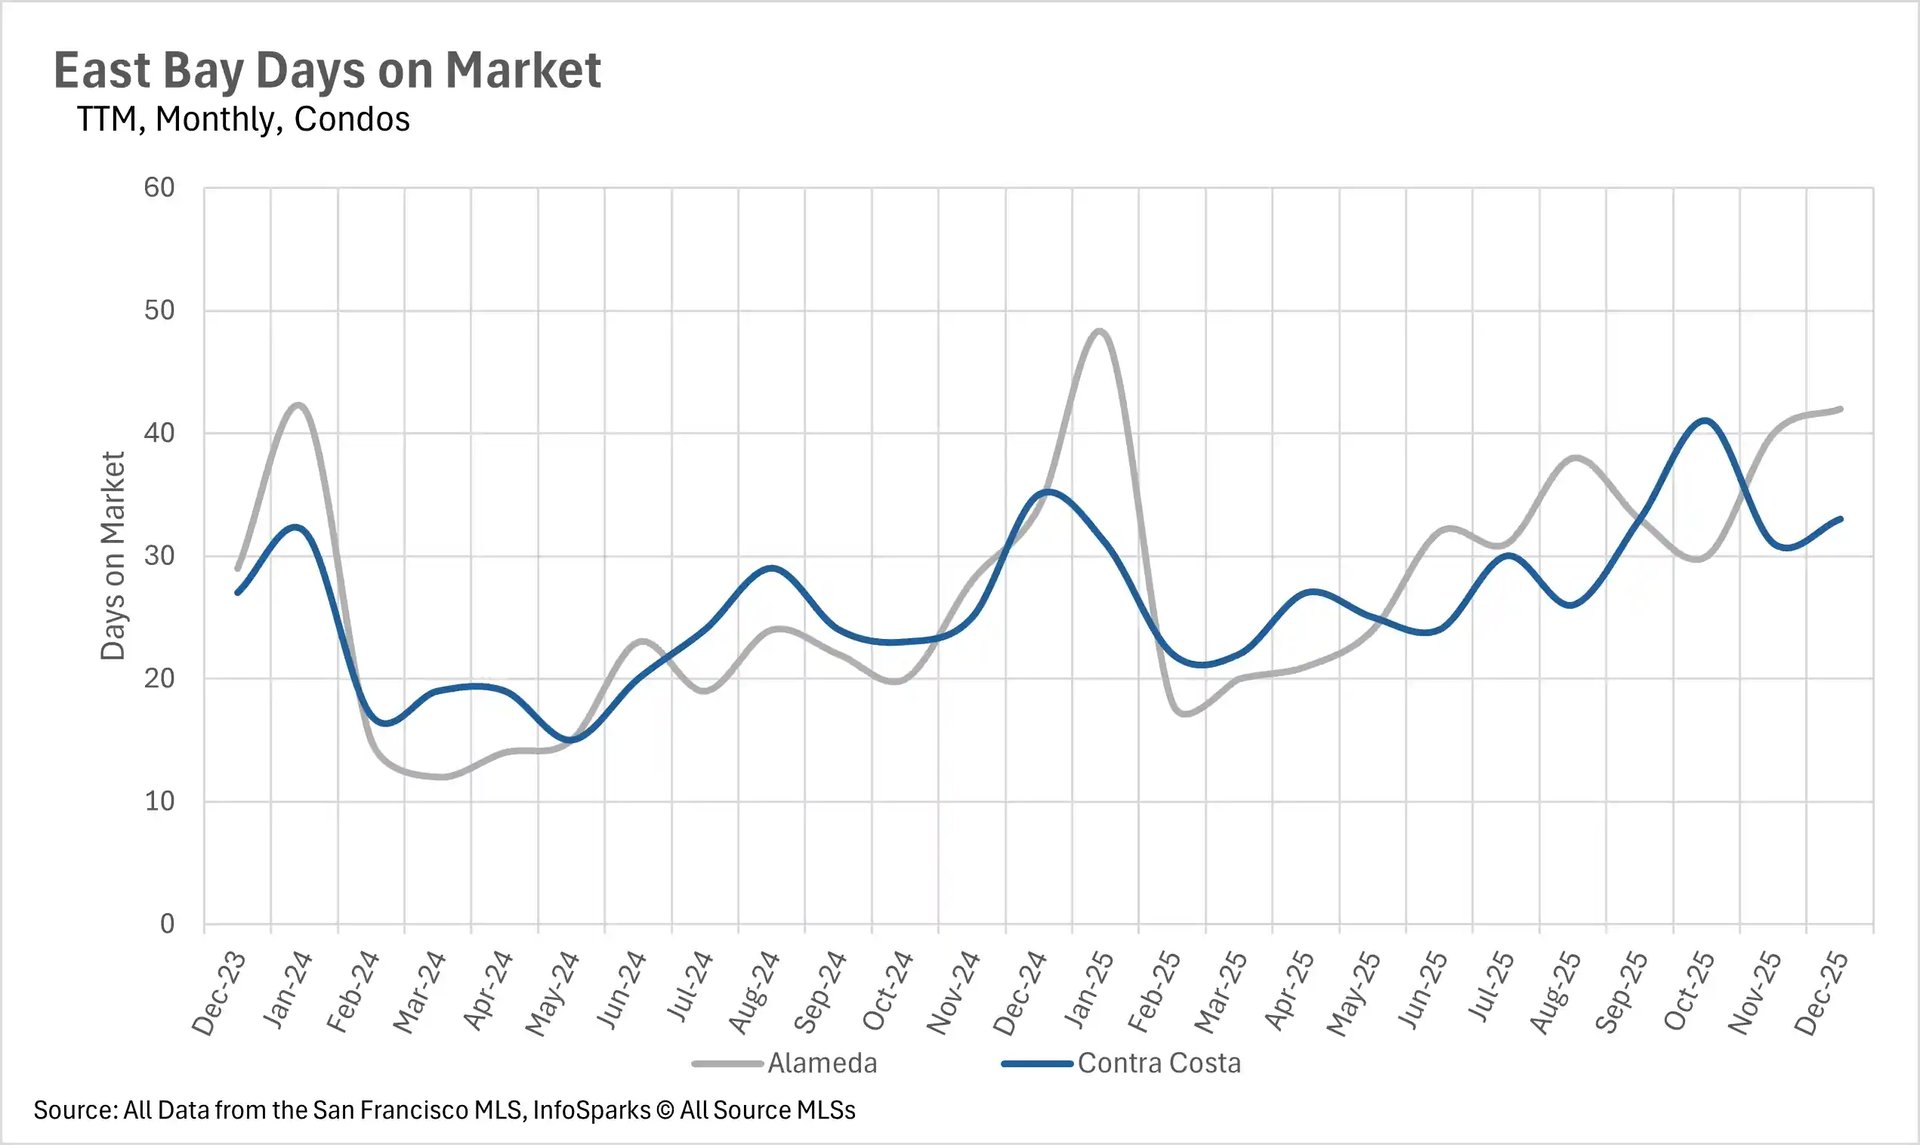
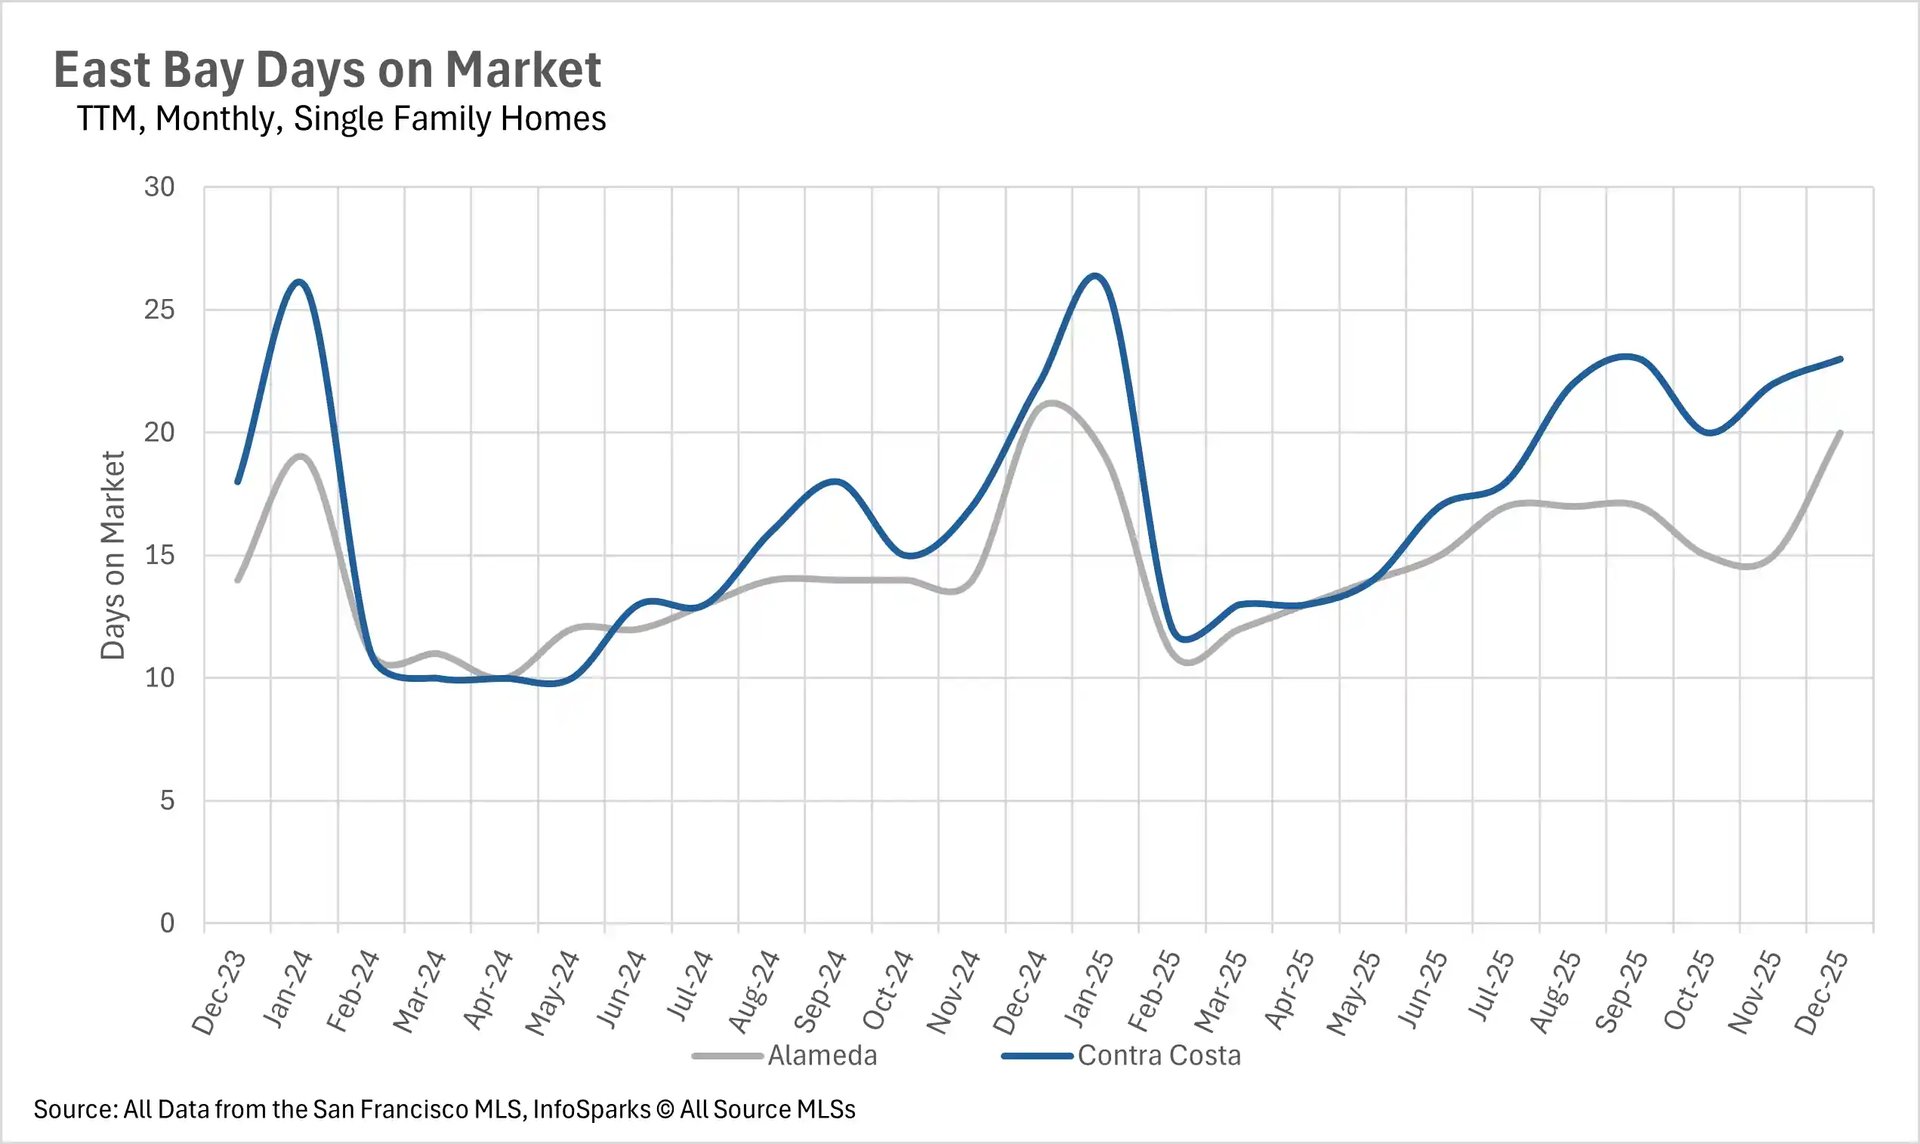
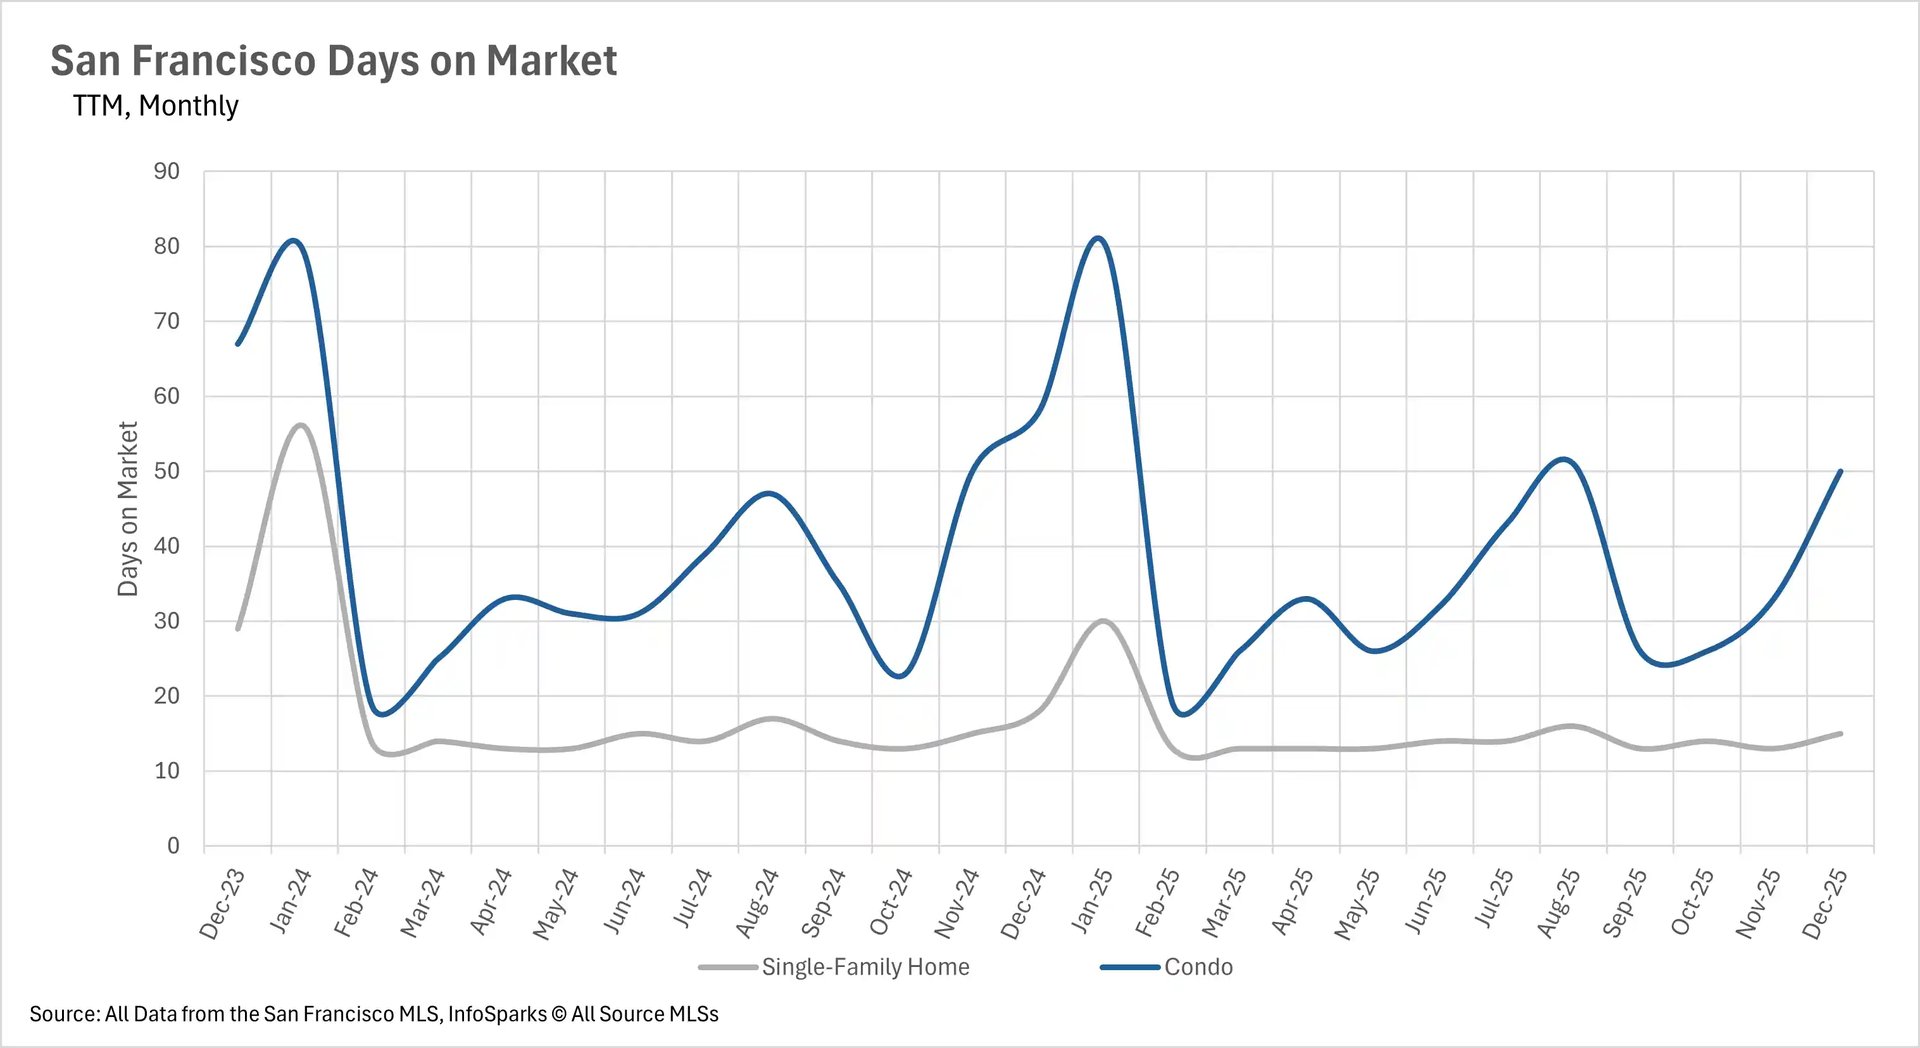
December's days on market metrics revealed striking differences across regions and property types, with some markets accelerating dramatically while others slowed despite tight inventory. San Francisco saw the most dramatic acceleration, with single-family homes selling in just 15 days (down 16.67% year-over-year) and condos moving in 50 days (down 13.79%), creating an intensely competitive environment with very little time for buyer deliberation. The East Bay's single-family market also accelerated, with Alameda County homes selling in 20 days (down 4.76% year-over-year) and Contra Costa at 23 days, while condos slowed significantly with Alameda averaging 42 days (up 23.53%) and Contra Costa at 33 days.
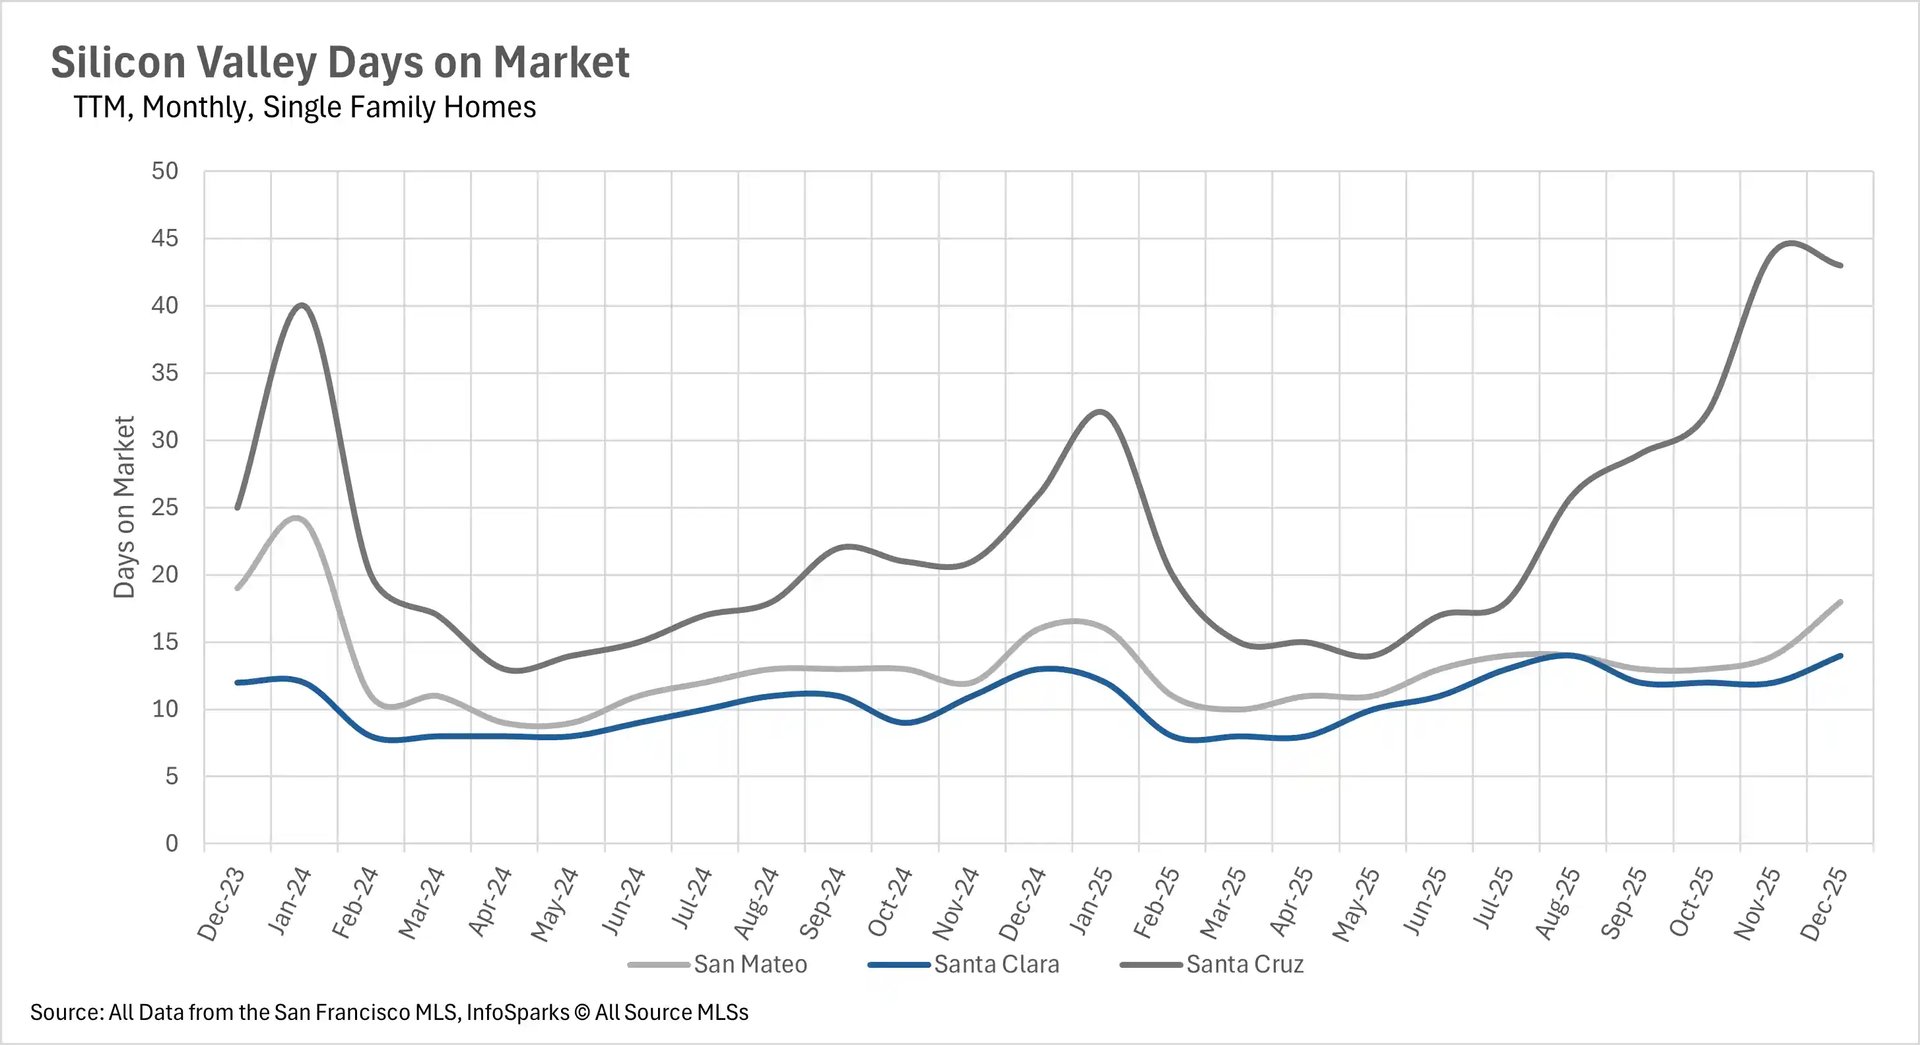
Silicon Valley presented stark contrasts by county - San Mateo and Santa Clara maintained relatively quick movement at 18 and 14 days for single-family homes (though up 12.50% and 7.69% respectively), while Santa Cruz County experienced a dramatic slowdown with homes taking 43 days to sell (up 65.38% year-over-year). Silicon Valley condos showed mixed results with slight increases in San Mateo and Santa Clara, while Santa Cruz condos actually accelerated with a 16.13% decrease. The North Bay demonstrated the most widespread slowdown despite inventory collapse, with single-family homes in Sonoma spending 61 days on market (up 35.56%), Solano at 50 days (up 42.86%), and even Marin increasing slightly by 2.04%. However, Napa County condos bucked the trend with a 22.06% decrease in market time.
Extreme seller's market conditions dominate the entire Bay Area
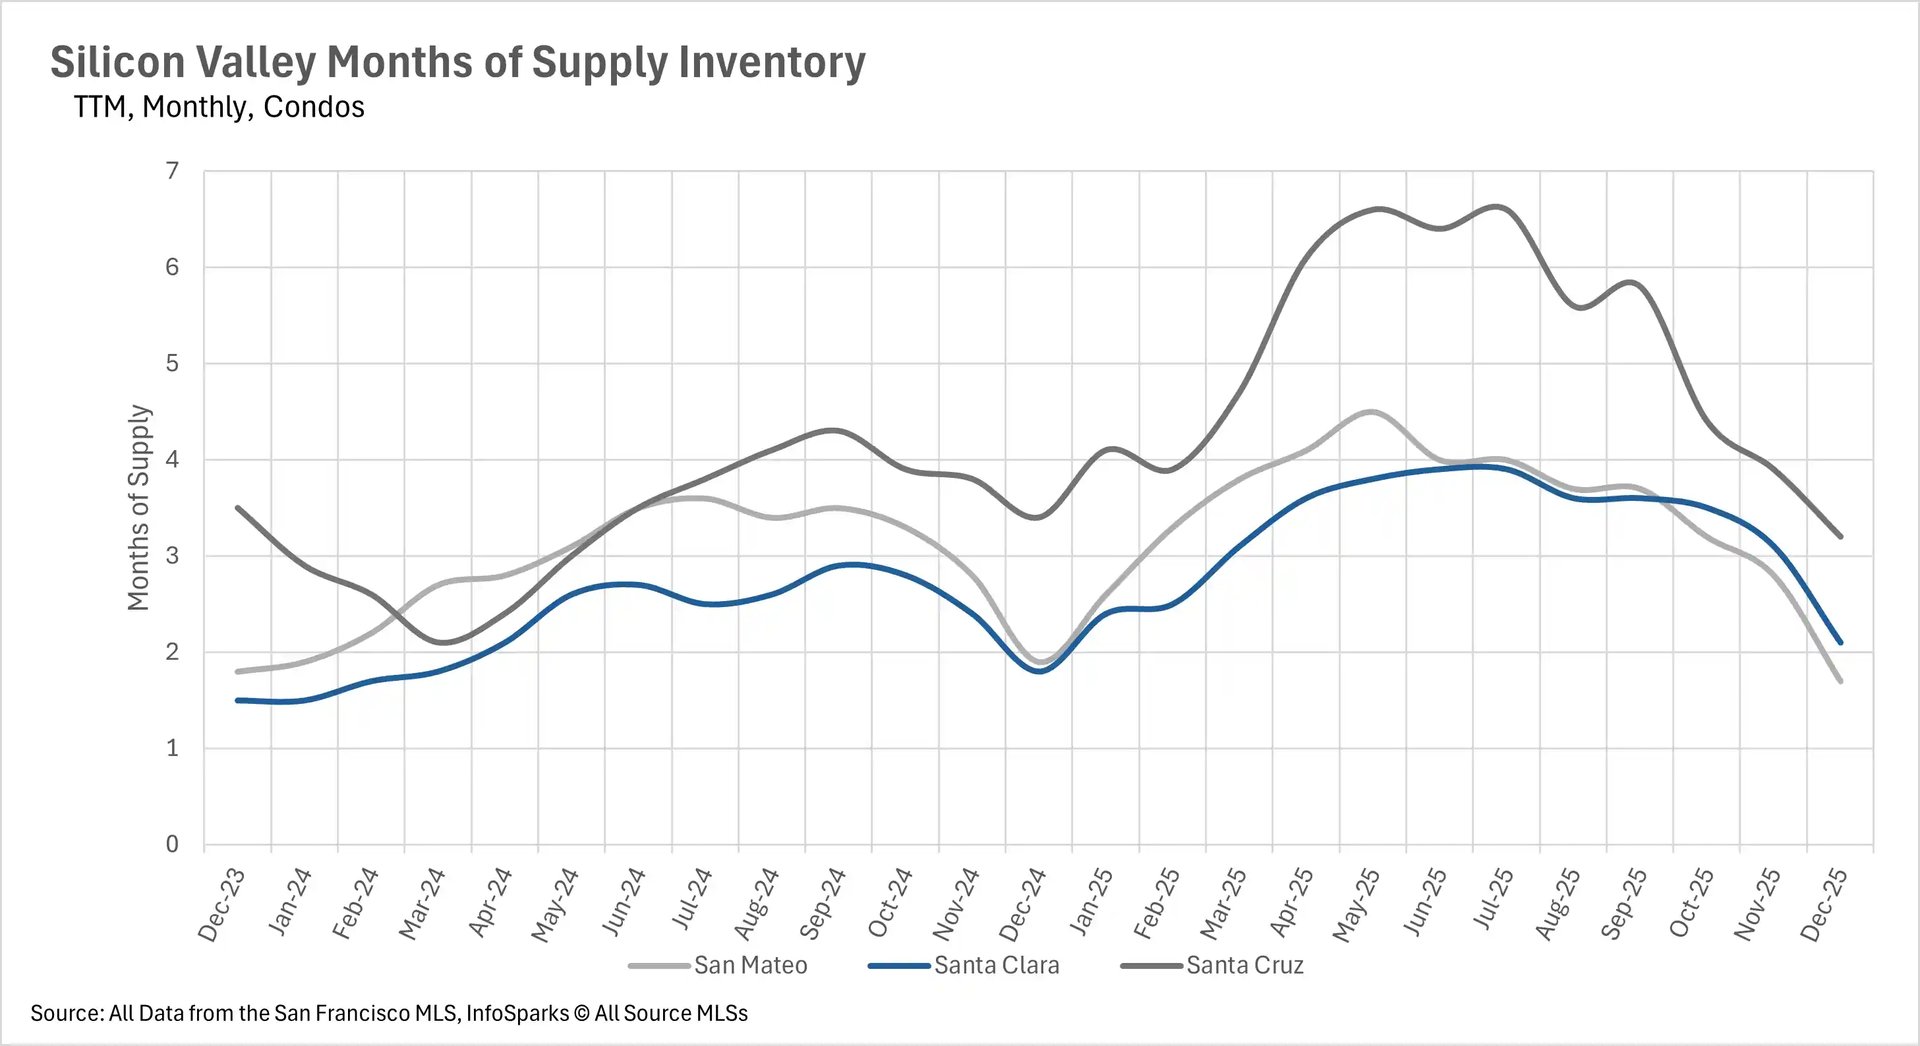
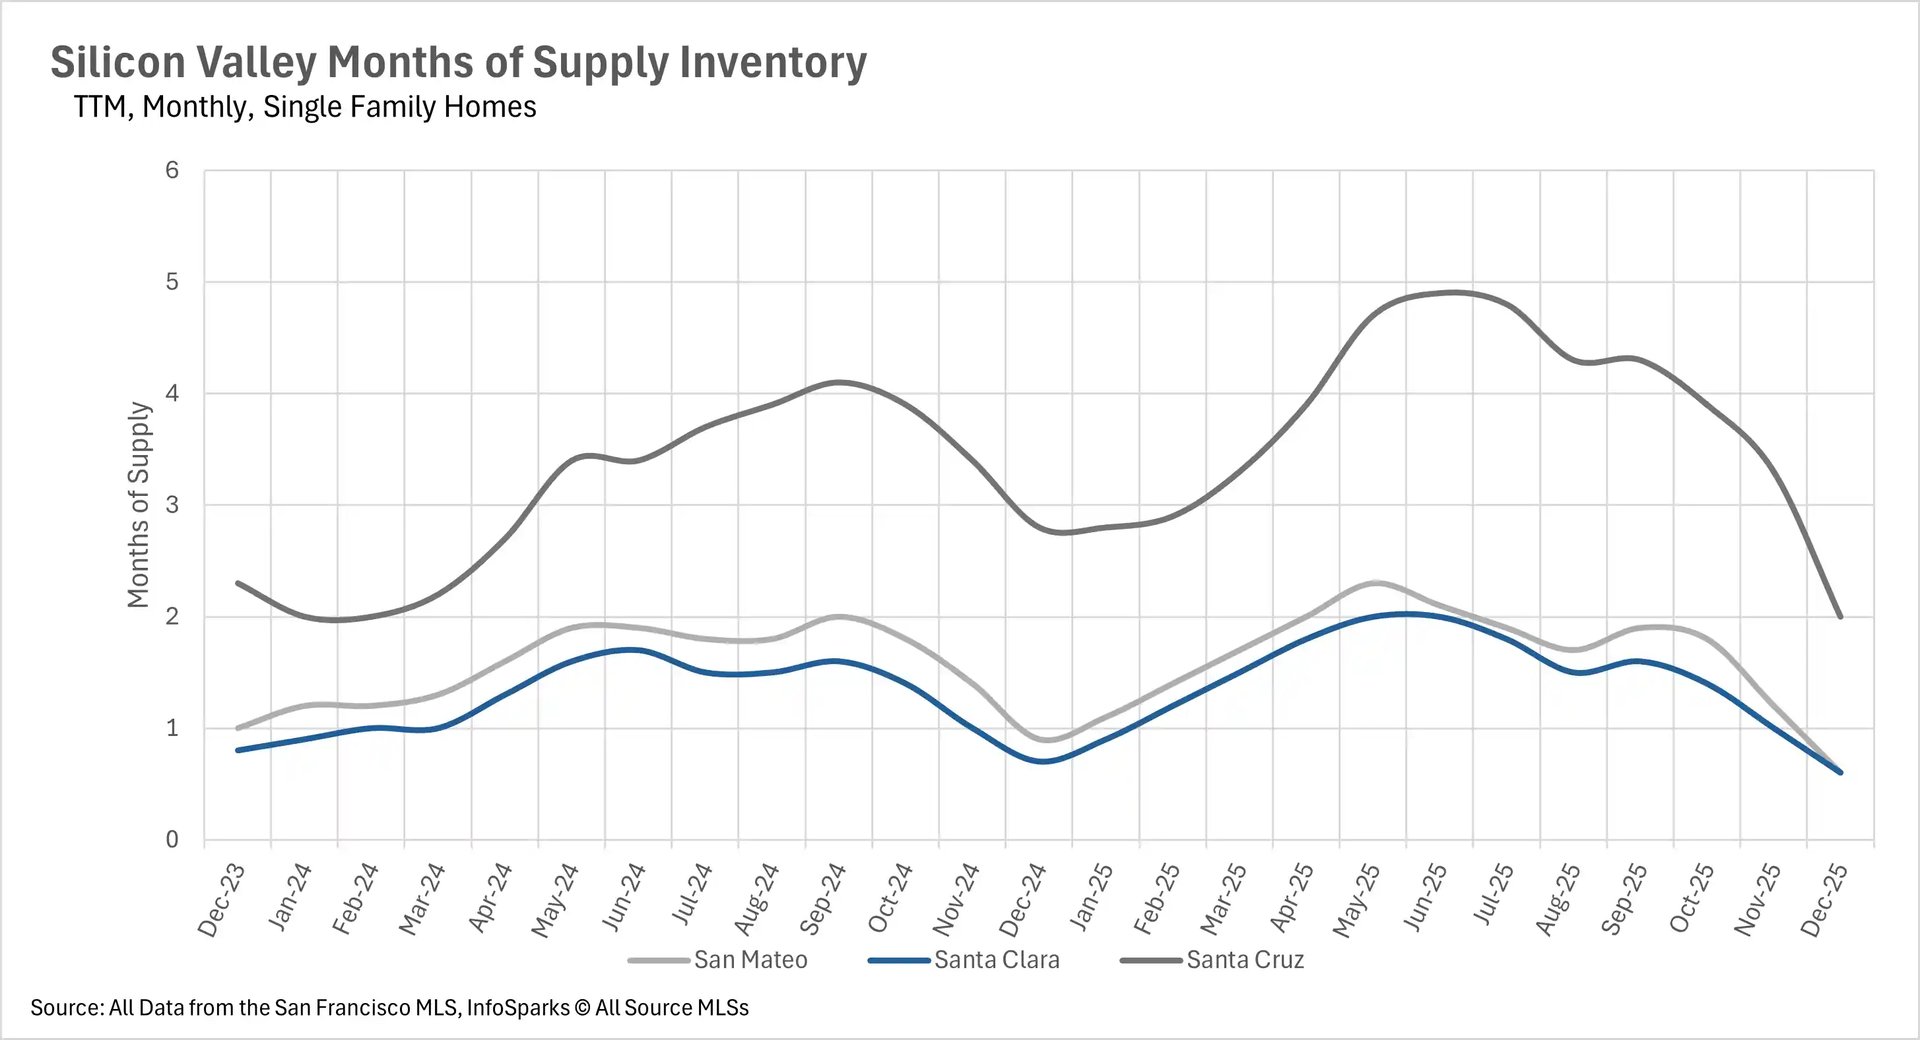
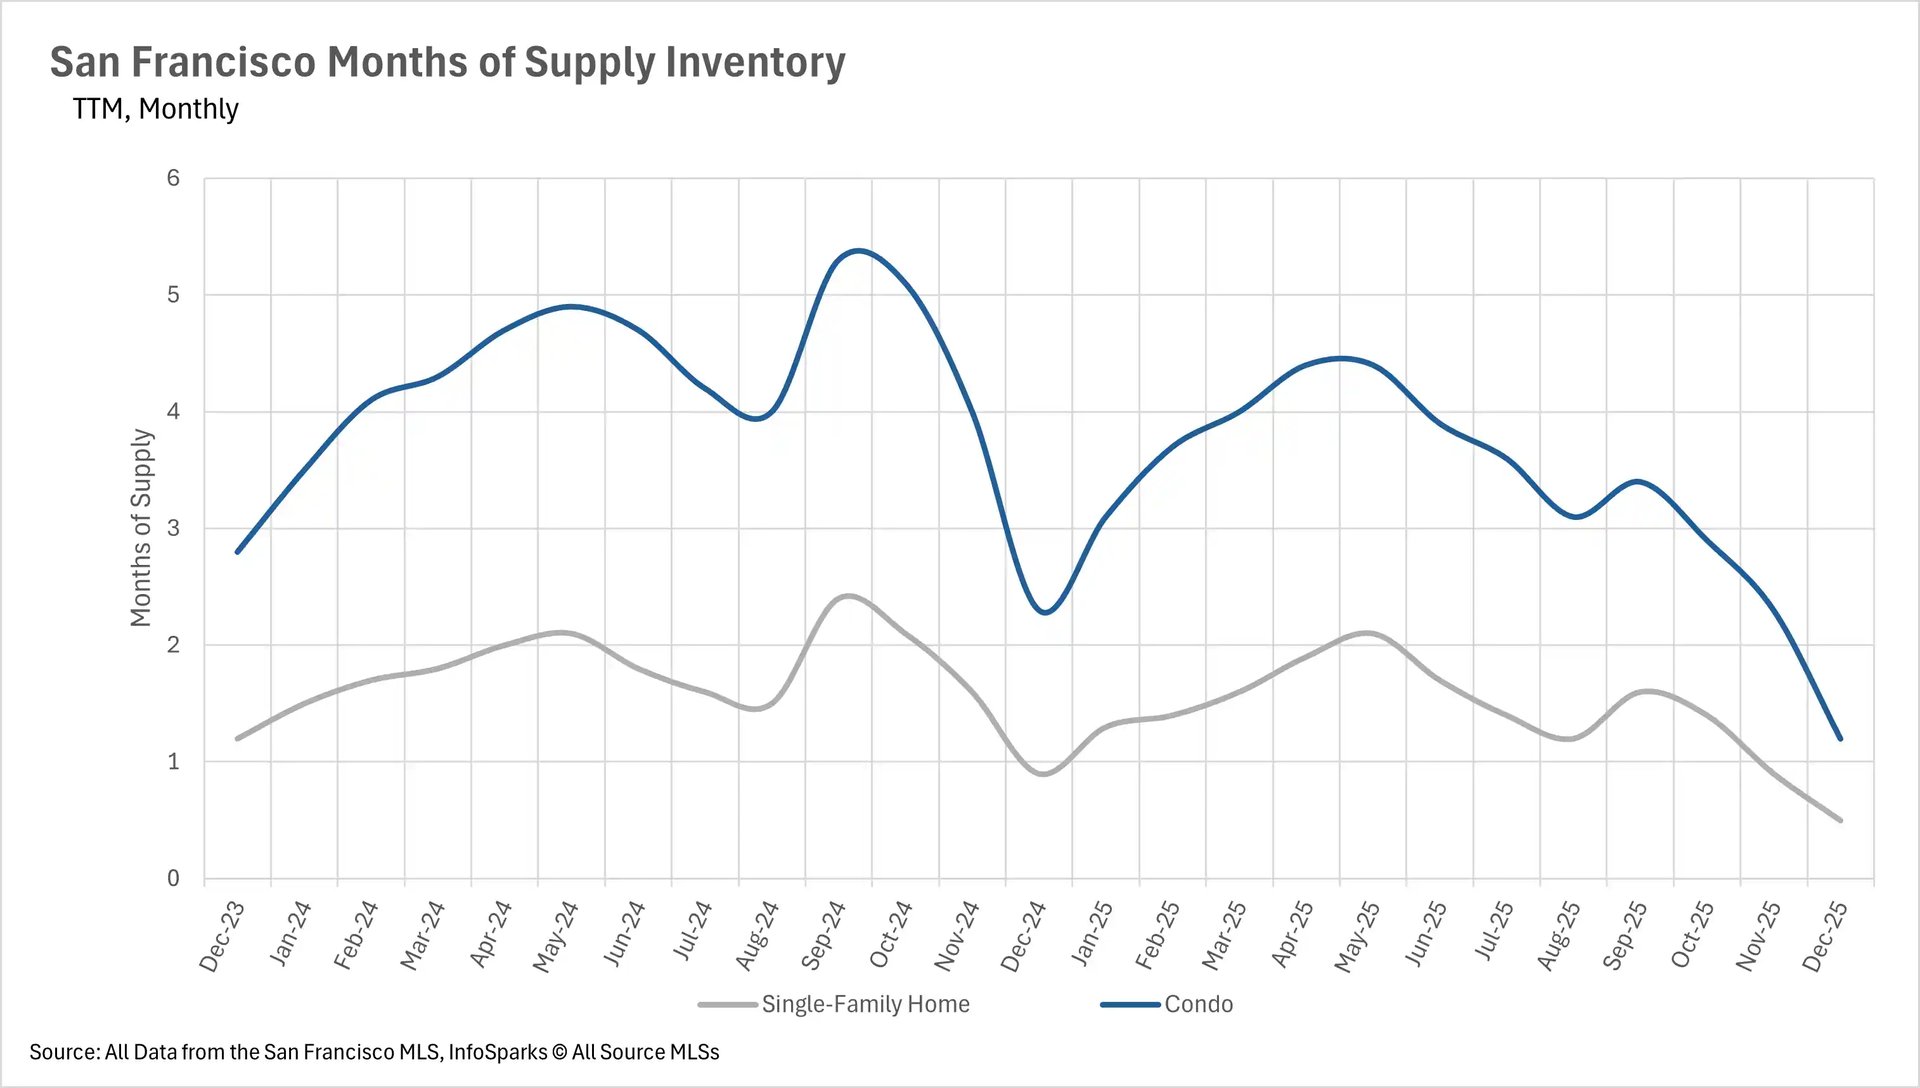
December's inventory collapse pushed the entire Bay Area into extreme seller's market territory, with some regions reaching the tightest supply constraints in years. San Francisco achieved the most extreme conditions in the state with just 0.5 months of single-family home supply and 1.2 months of condo inventory - some of the lowest MSI figures seen in years with no indication of relief. Silicon Valley reached similarly extreme levels, with San Mateo and Santa Clara Counties both at just 0.6 months of single-family home supply (down 33.33% and 14.29% year-over-year respectively), while Santa Cruz dropped to 2.0 months (down 28.57%). Silicon Valley condos moved decisively toward seller's markets with San Mateo at 1.7 months, Santa Clara at 2.1 months, and Santa Cruz at 3.2 months.
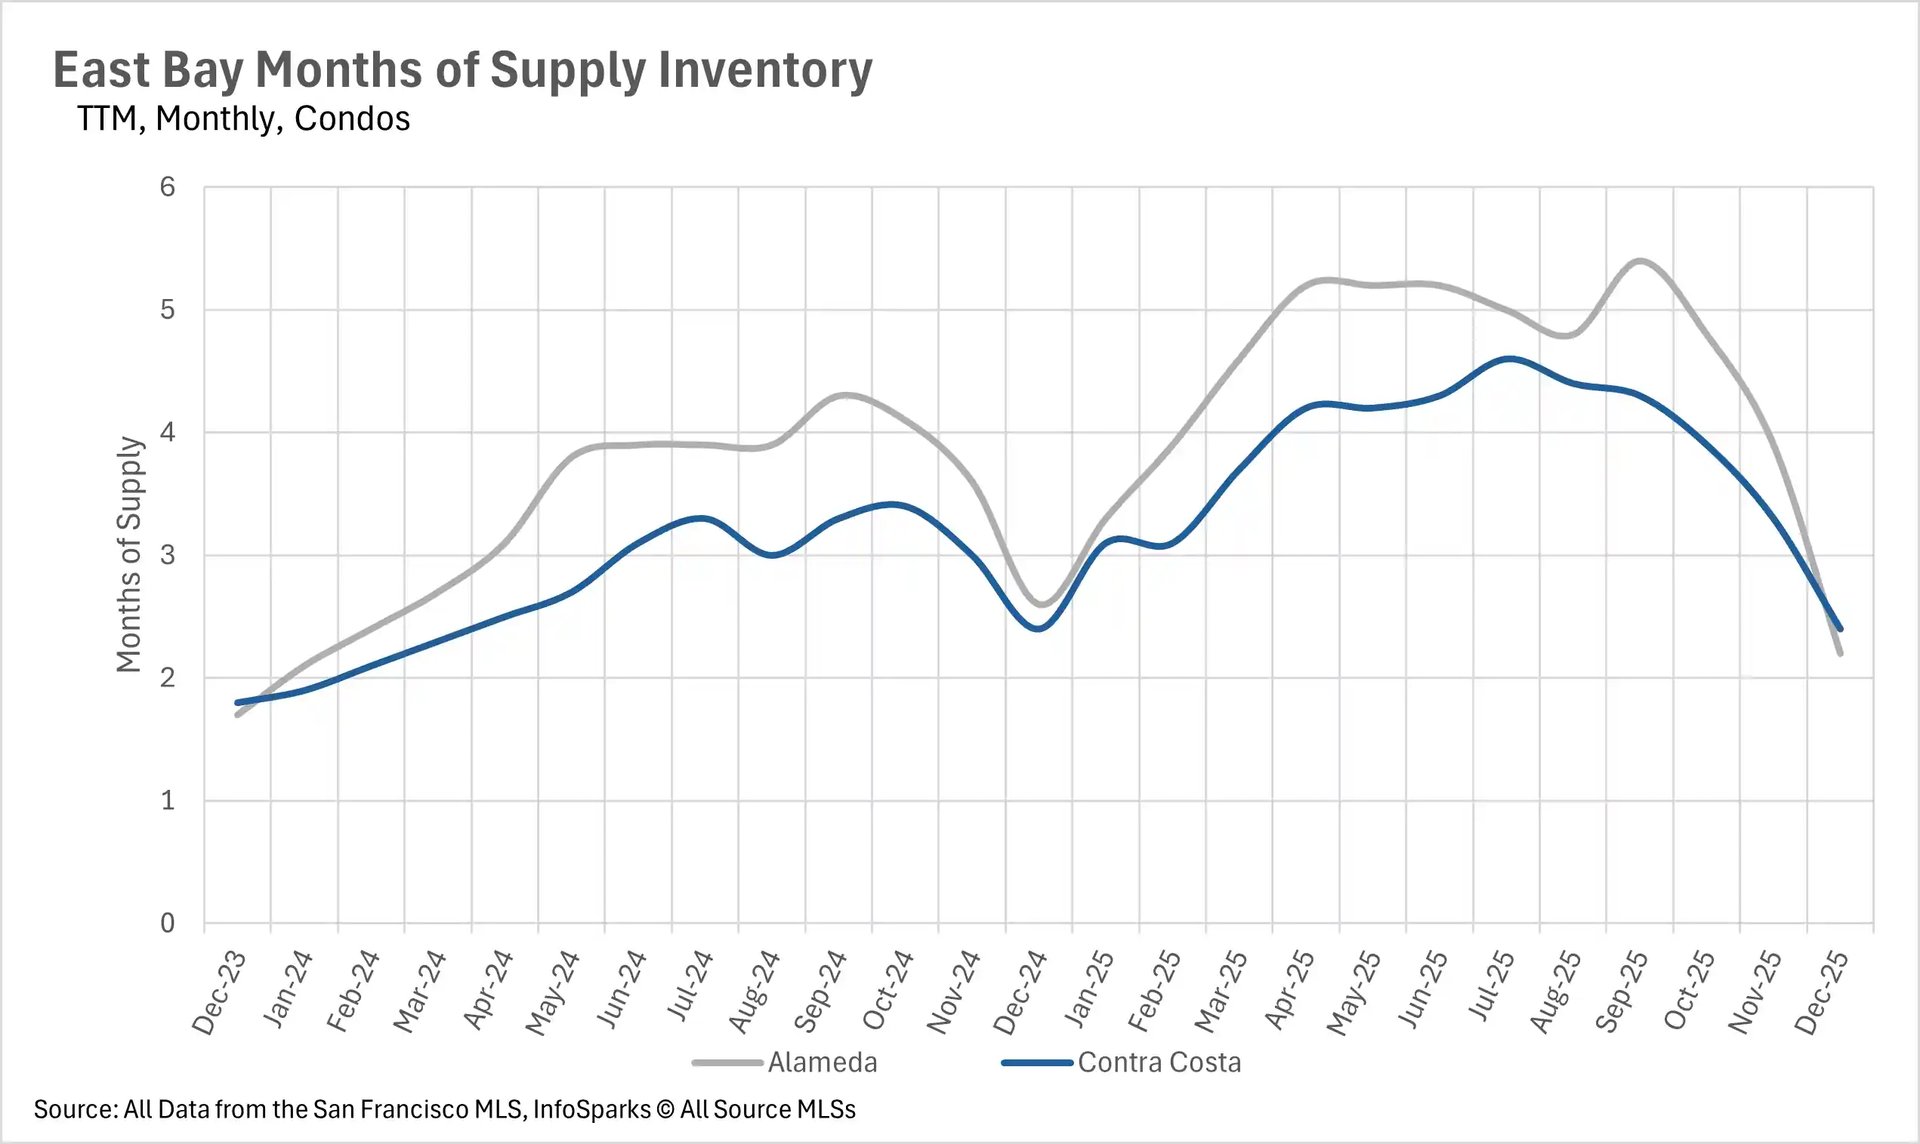
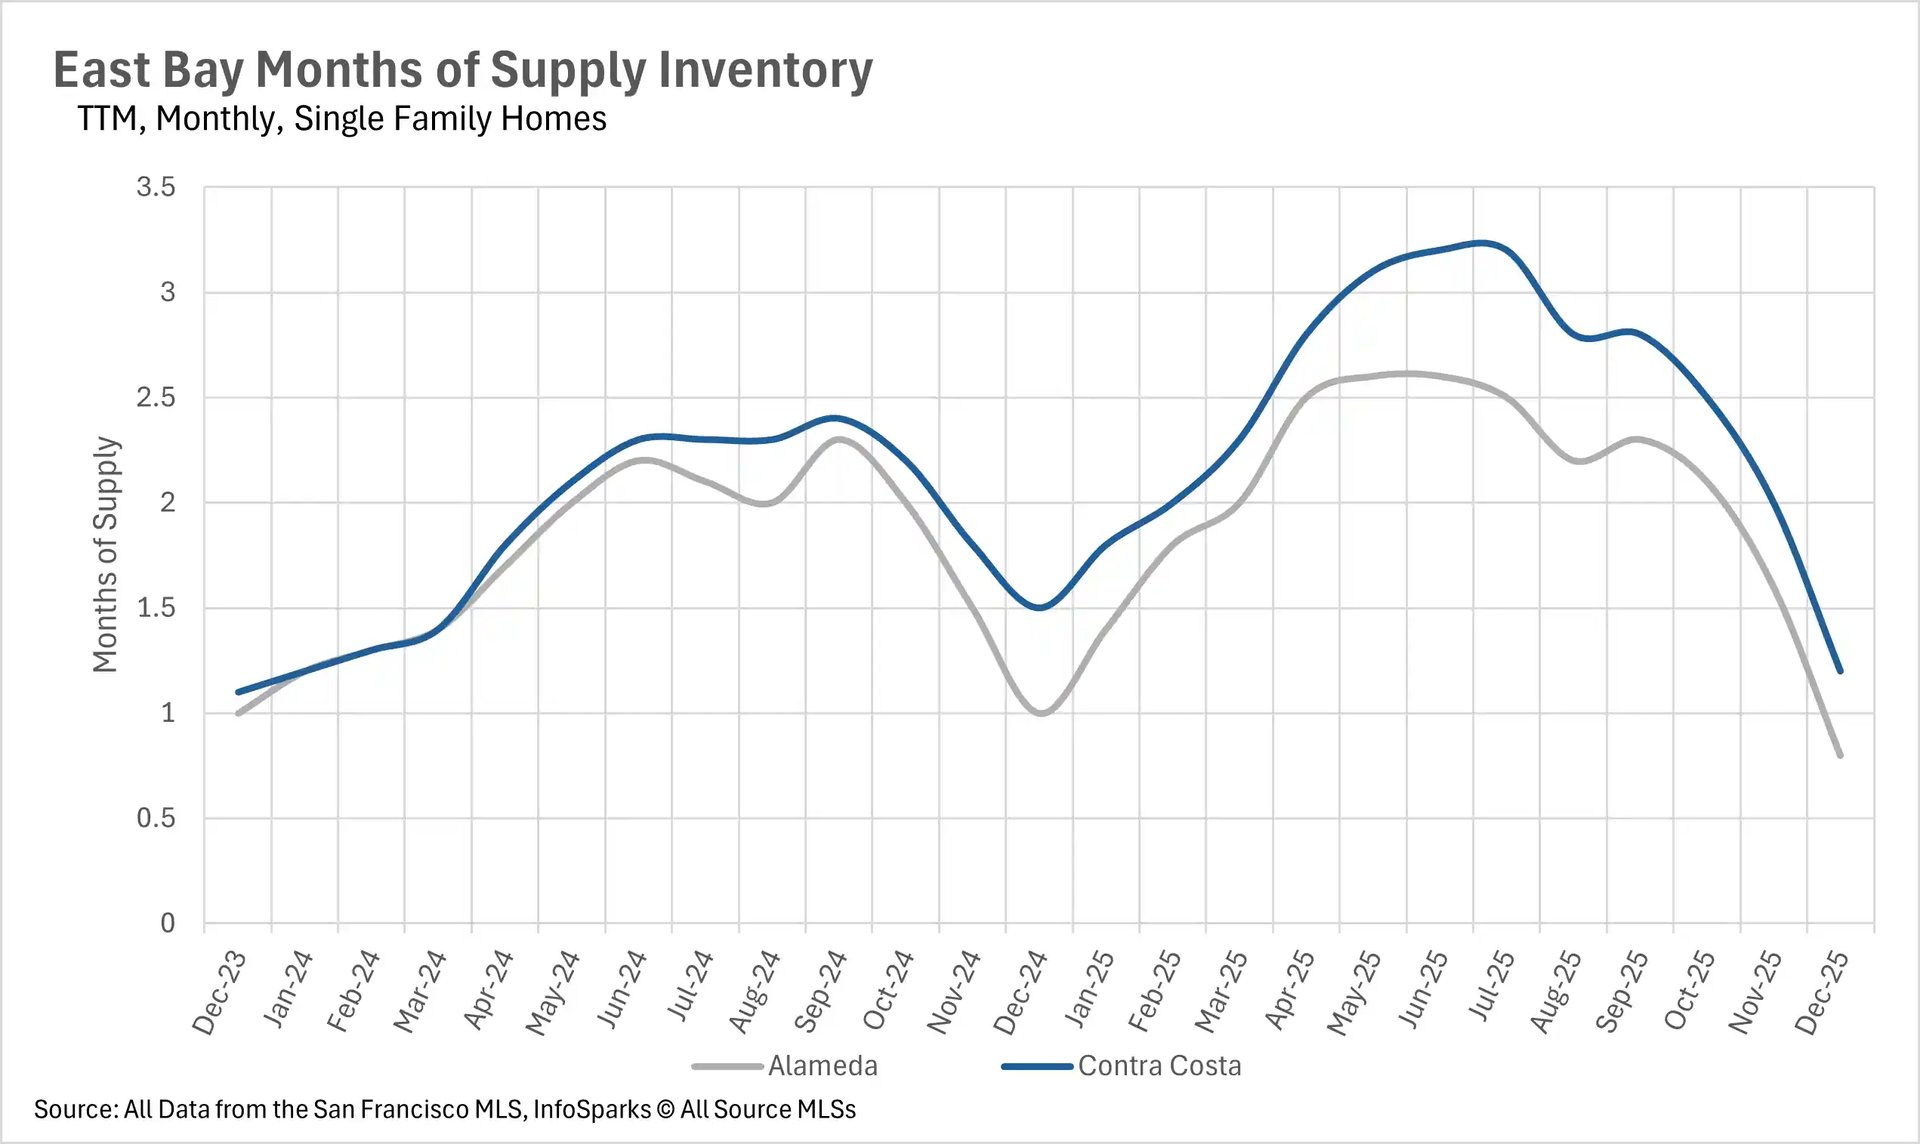
The East Bay ended the year with extraordinarily tight conditions, posting just 0.8 months of single-family inventory in Alameda County and 1.2 months in Contra Costa (both down 20% year-over-year), while even condos entered seller's territory at 2.2 and 2.4 months respectively. The North Bay experienced a dramatic holiday season shift, with Marin County leading at an extreme 0.8 months of single-family supply (down 66.67% year-over-year), Sonoma at 1.5 months, Solano at 1.8 months, and even Napa - which had been a strong buyer's market throughout 2025 - dropping to 4.0 months. North Bay condos also tightened considerably with Marin at 2.0 months, Sonoma at 2.2 months, and Solano and Napa at 3.5 and 3.7 months, respectively. This region-wide transformation into seller's market territory, combined with historically low new listing activity, suggests intense competition will continue into early 2026 until significant new inventory enters the market.