Select a Market Report to Read:
National Market Update Overview
Bay Area
North Bay
East Bay
Silicon Valley
San Francisco
The Local Lowdown
Quick Take:
- Single-family home prices held relatively steady in December, while the condo market continued its year-long slide with double-digit declines in Alameda County.
- Inventories dropped significantly as the year came to a close, with single-family home inventory down nearly 19% year-over-year.
- Single-family homes continue to move quickly, while condos are spending considerably more time on the market.
Note: You can find the charts/graphs for the Local Lowdown at the end of this section.
*National Association of REALTORS® data is released two months behind, so we estimate the most recent month's data when possible and appropriate.
Single-family homes hold steady while condos continue to struggle
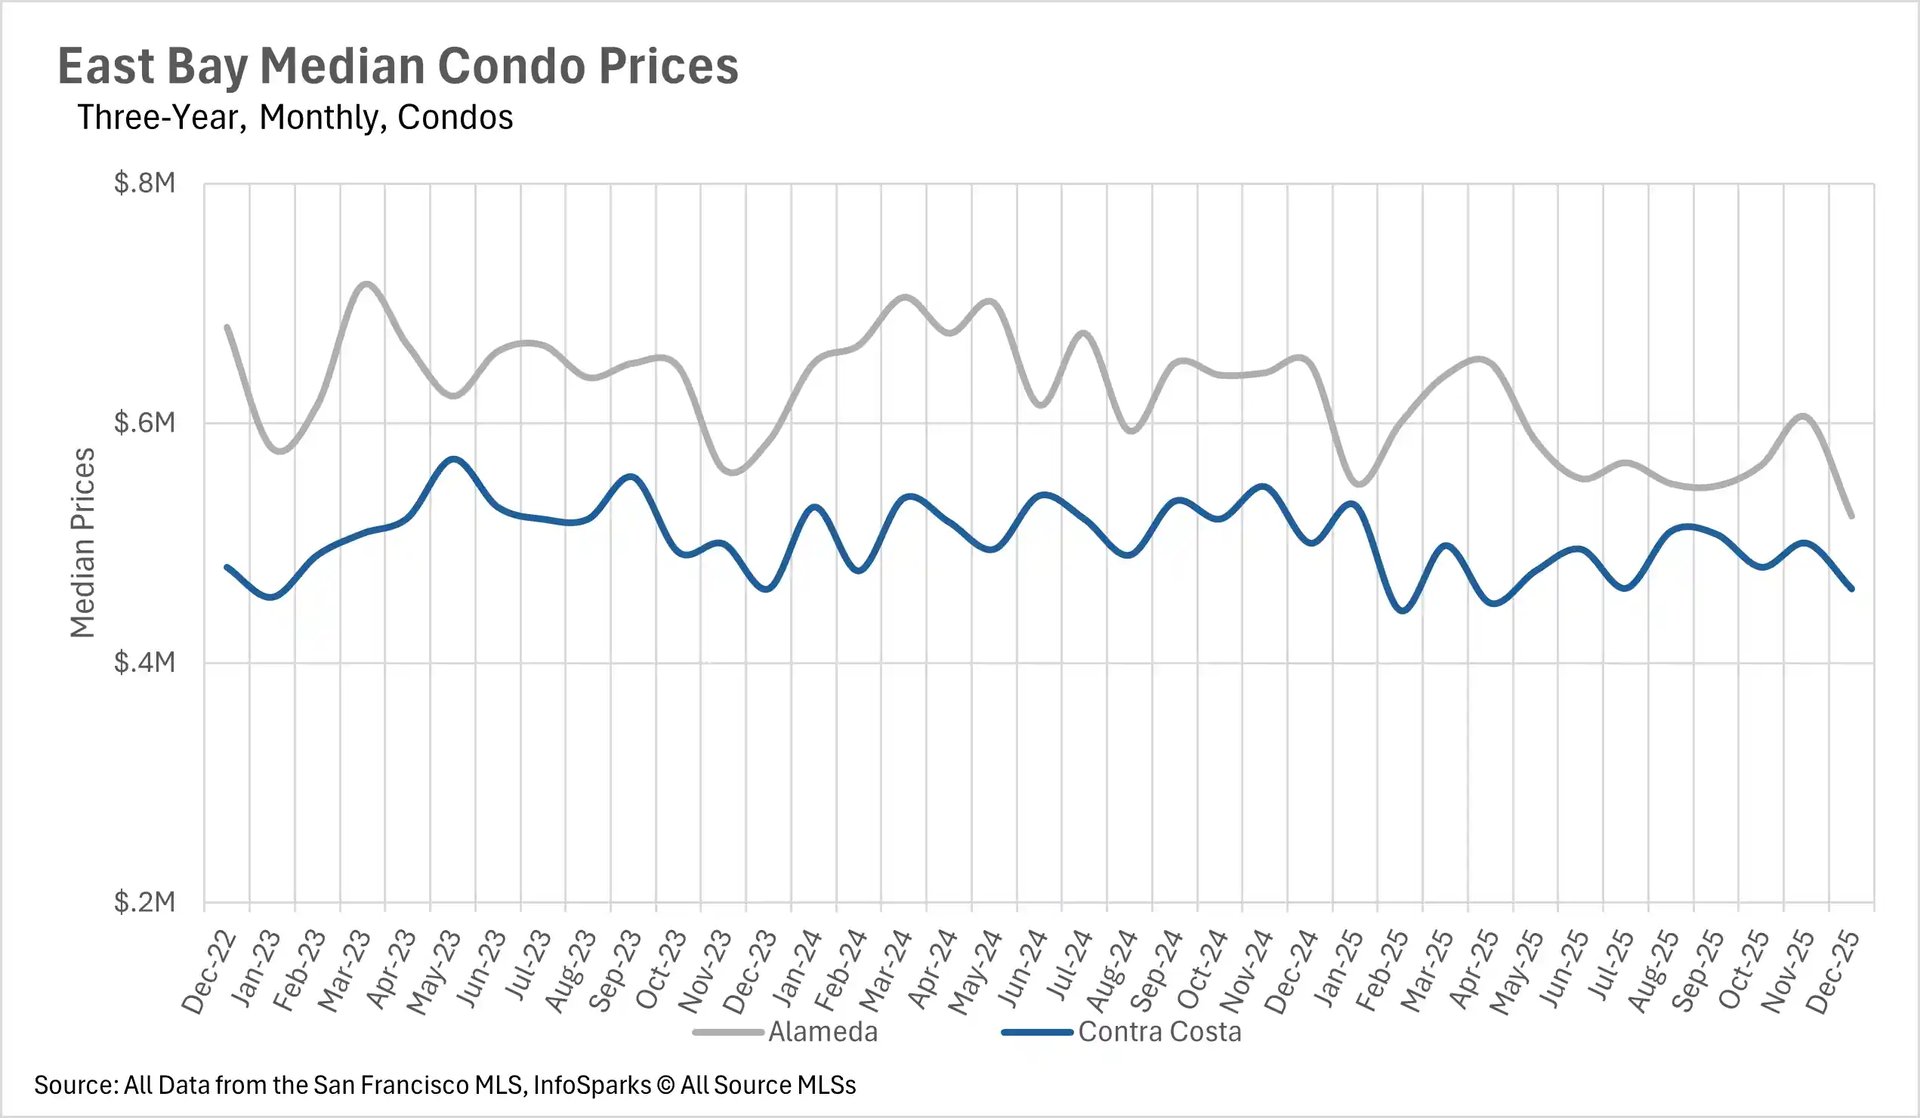
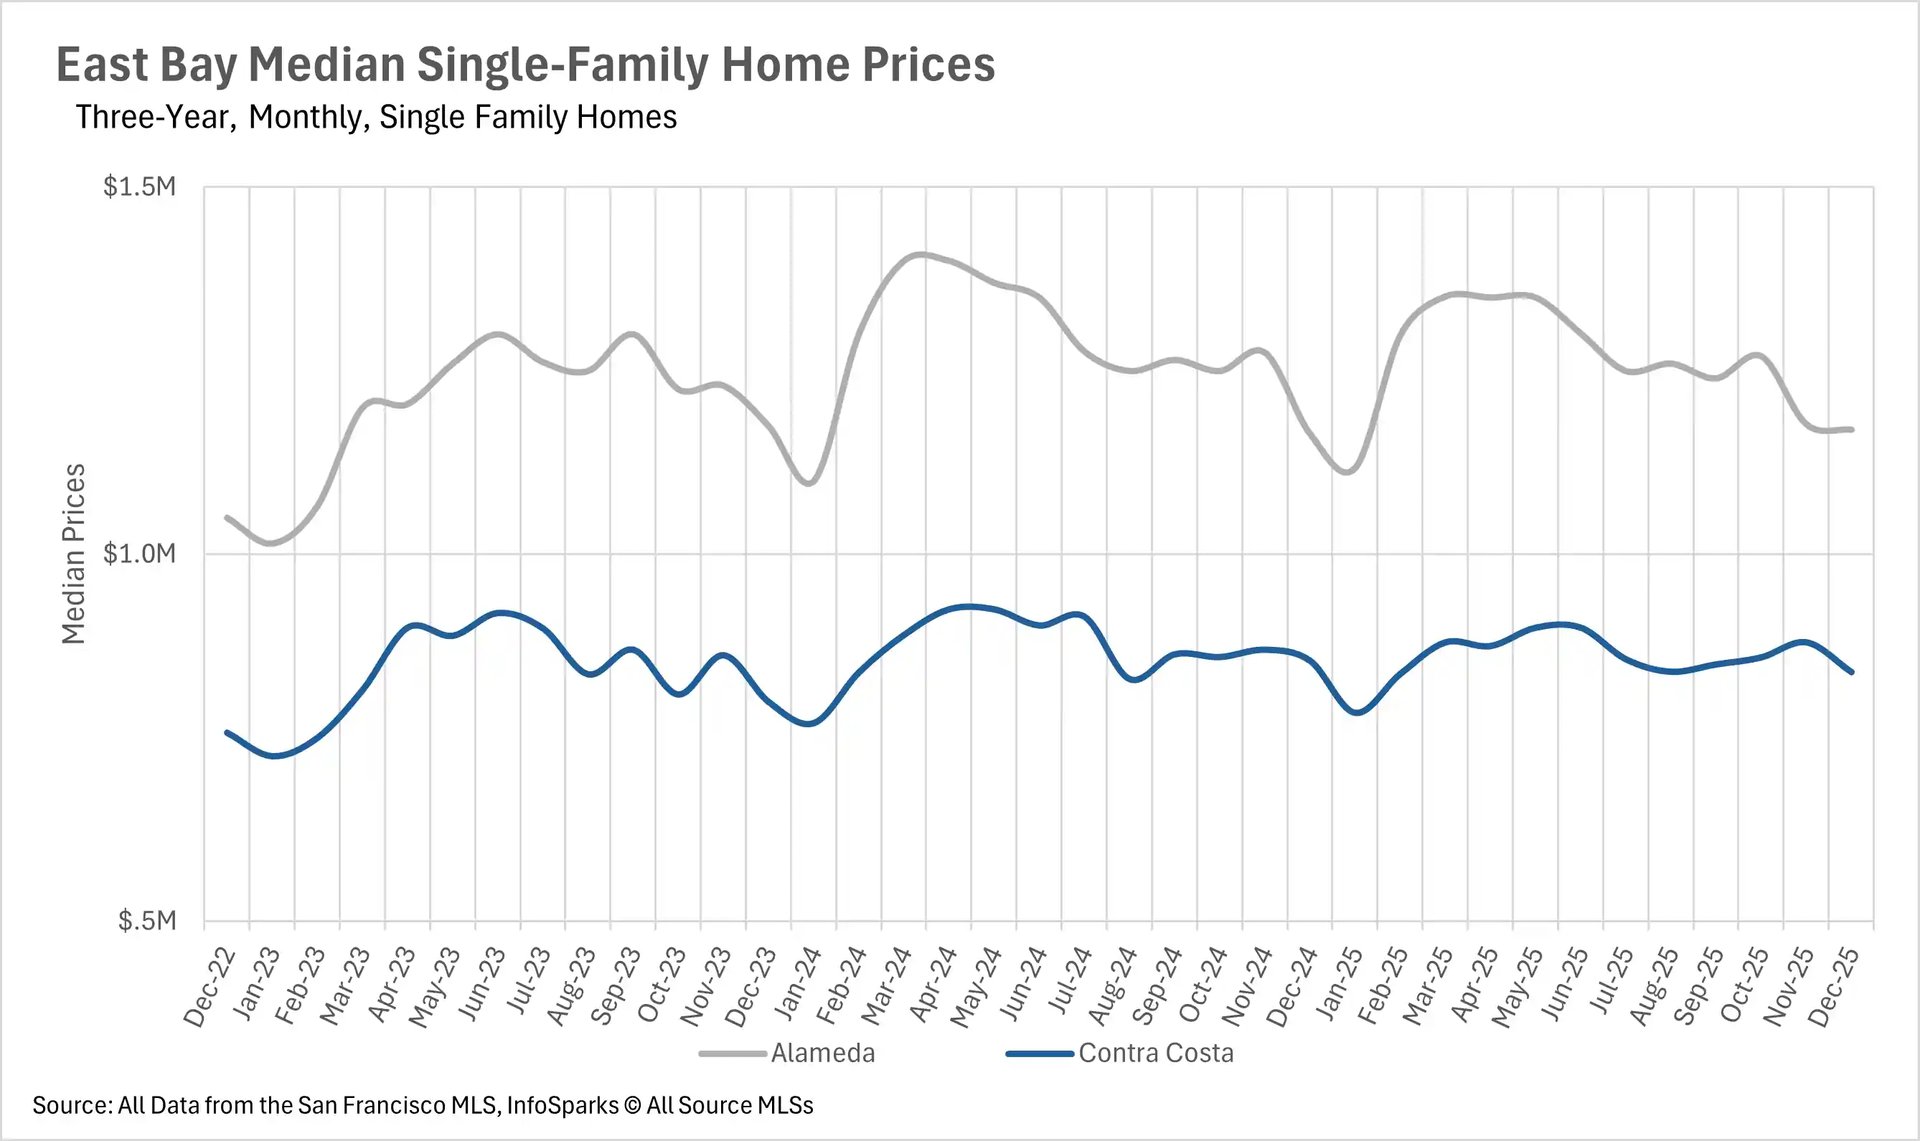
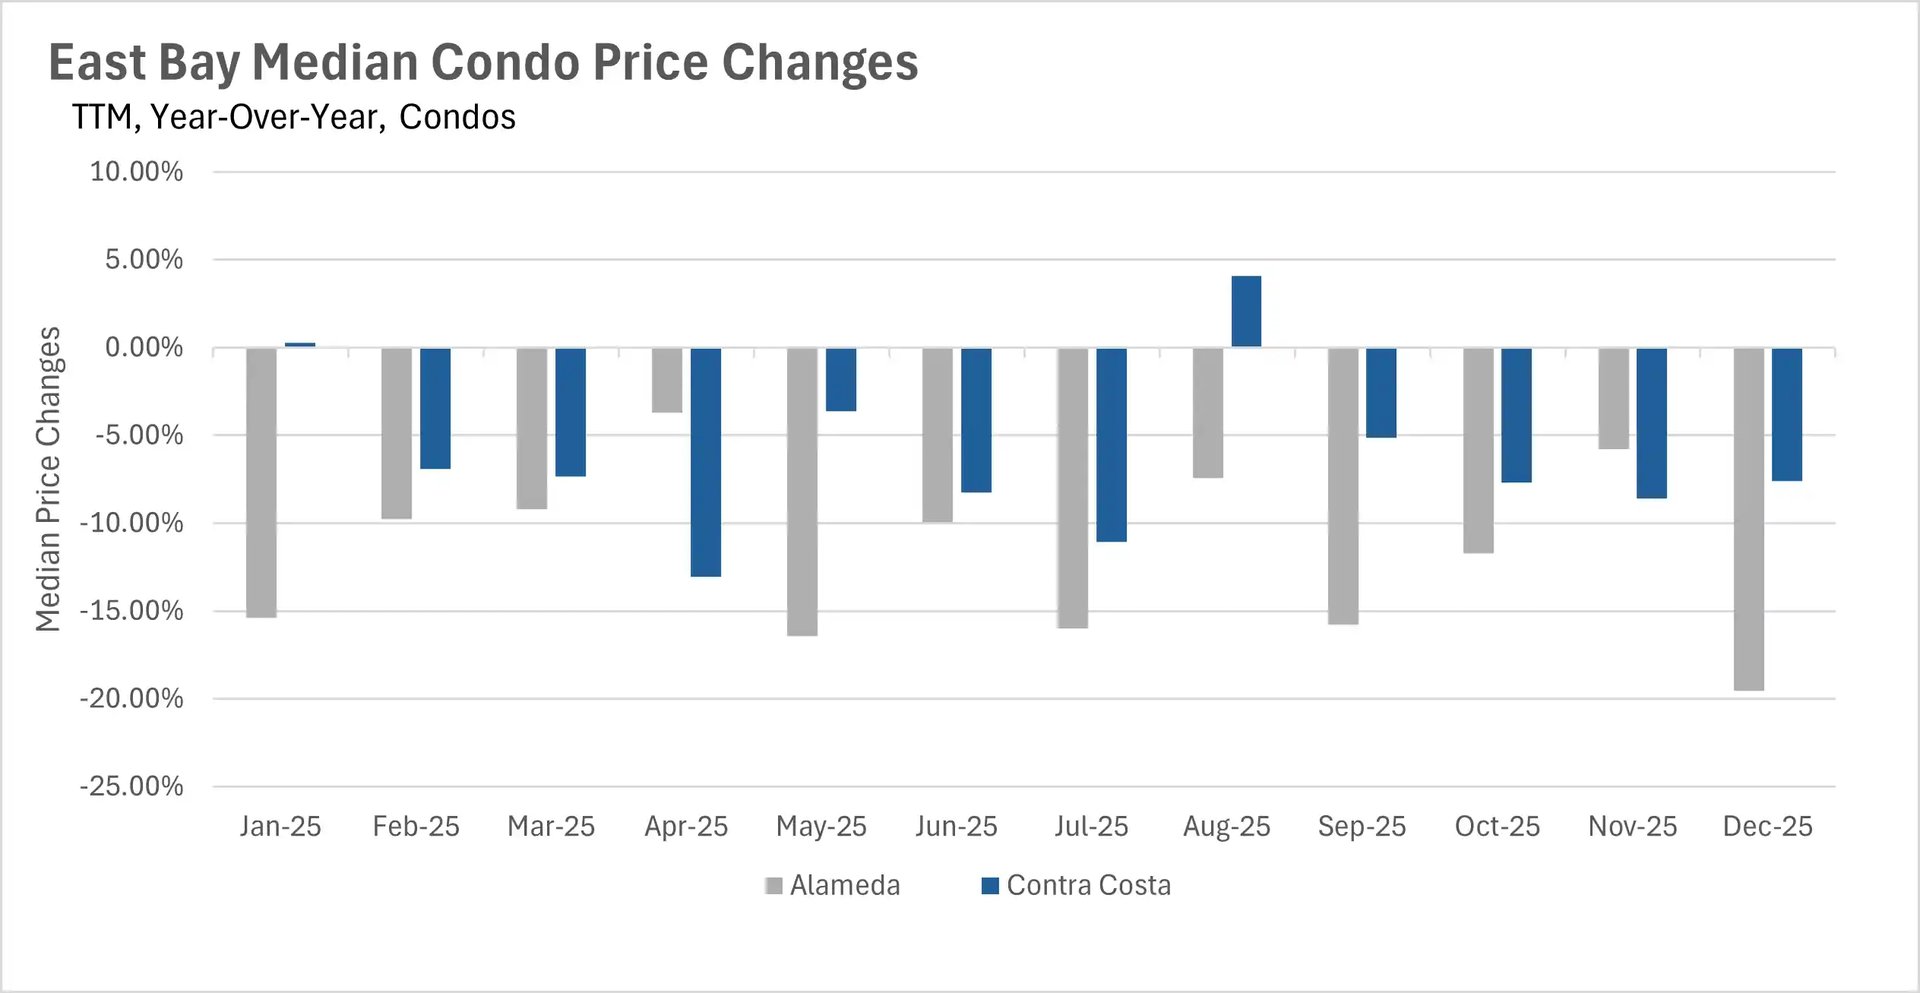
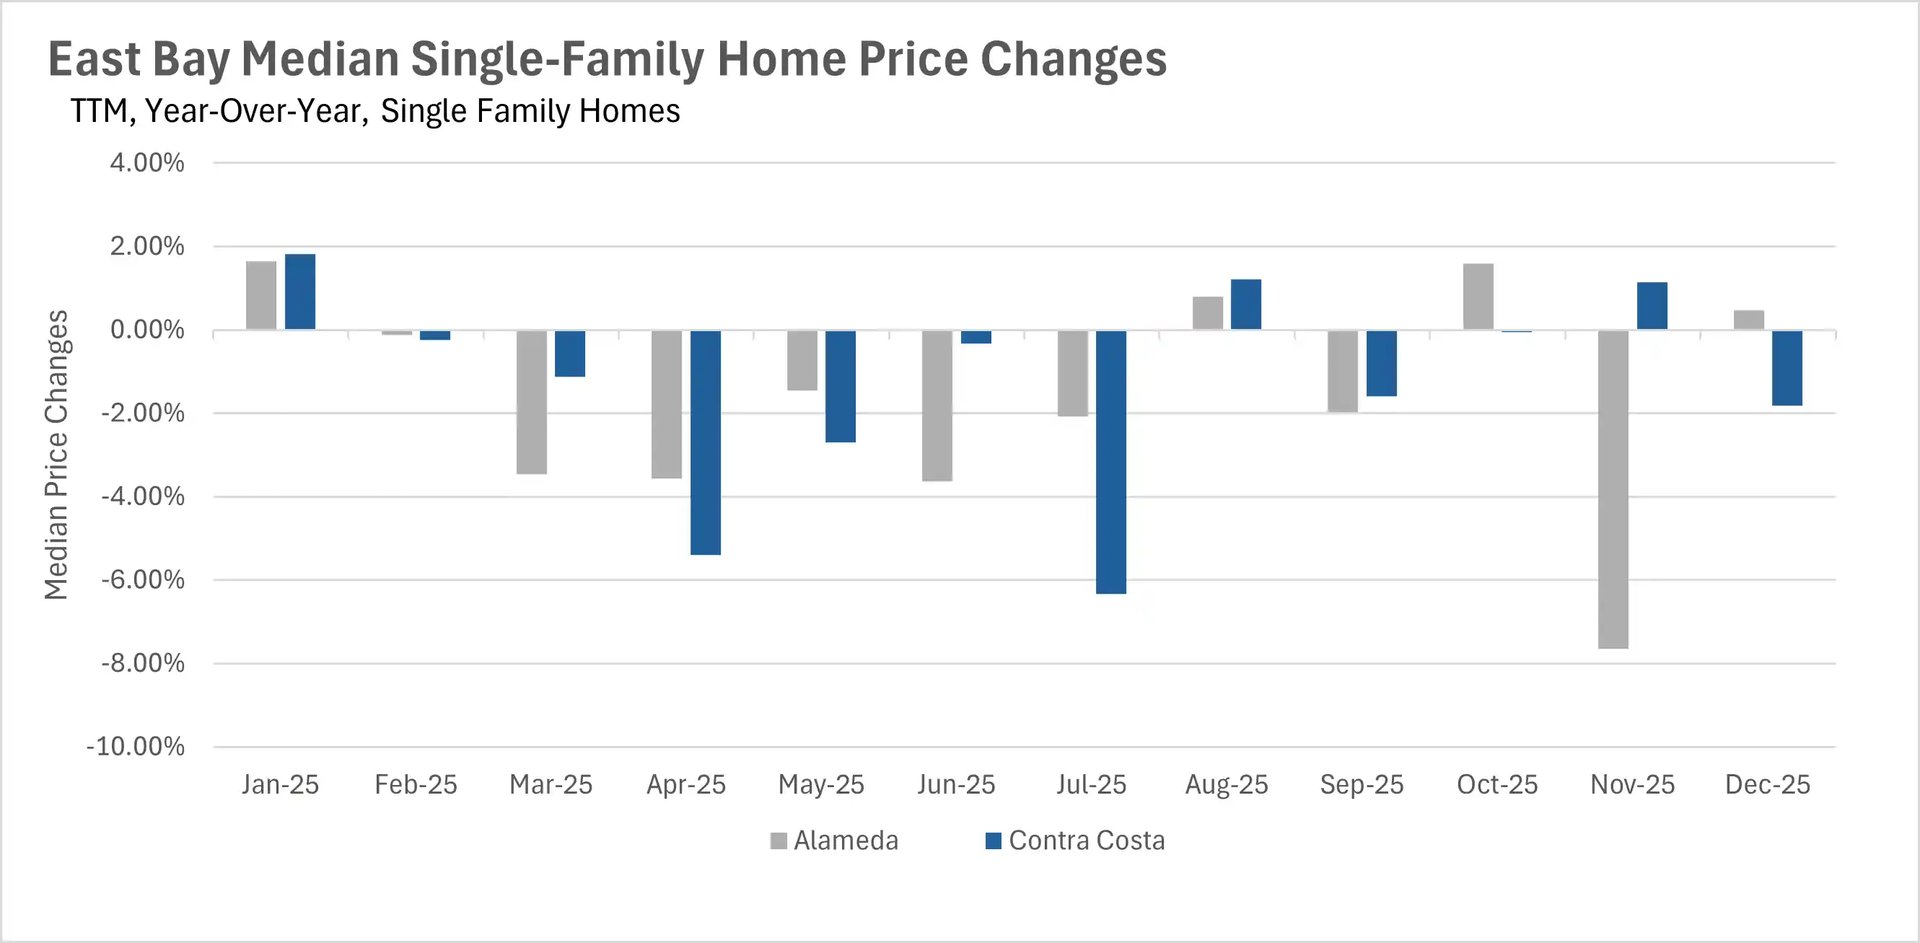
The single-family home market in the East Bay ended the year on a relatively stable note. In December, the median single-family home in Alameda County sold for $1,170,000, representing a modest 0.47% increase on a year-over-year basis. Meanwhile, Contra Costa County saw the median single-family home sell for $839,500, a slight 1.81% decline compared to last year. The condo market, however, tells a very different story. Alameda County condos saw a steep 19.55% year-over-year decline in median sale price, with the median condo selling for just $522,500. Contra Costa County condos fared somewhat better but still declined by 7.60%, with the median condo selling for $462,000. This divergence between single-family homes and condos has been a recurring theme throughout 2025.
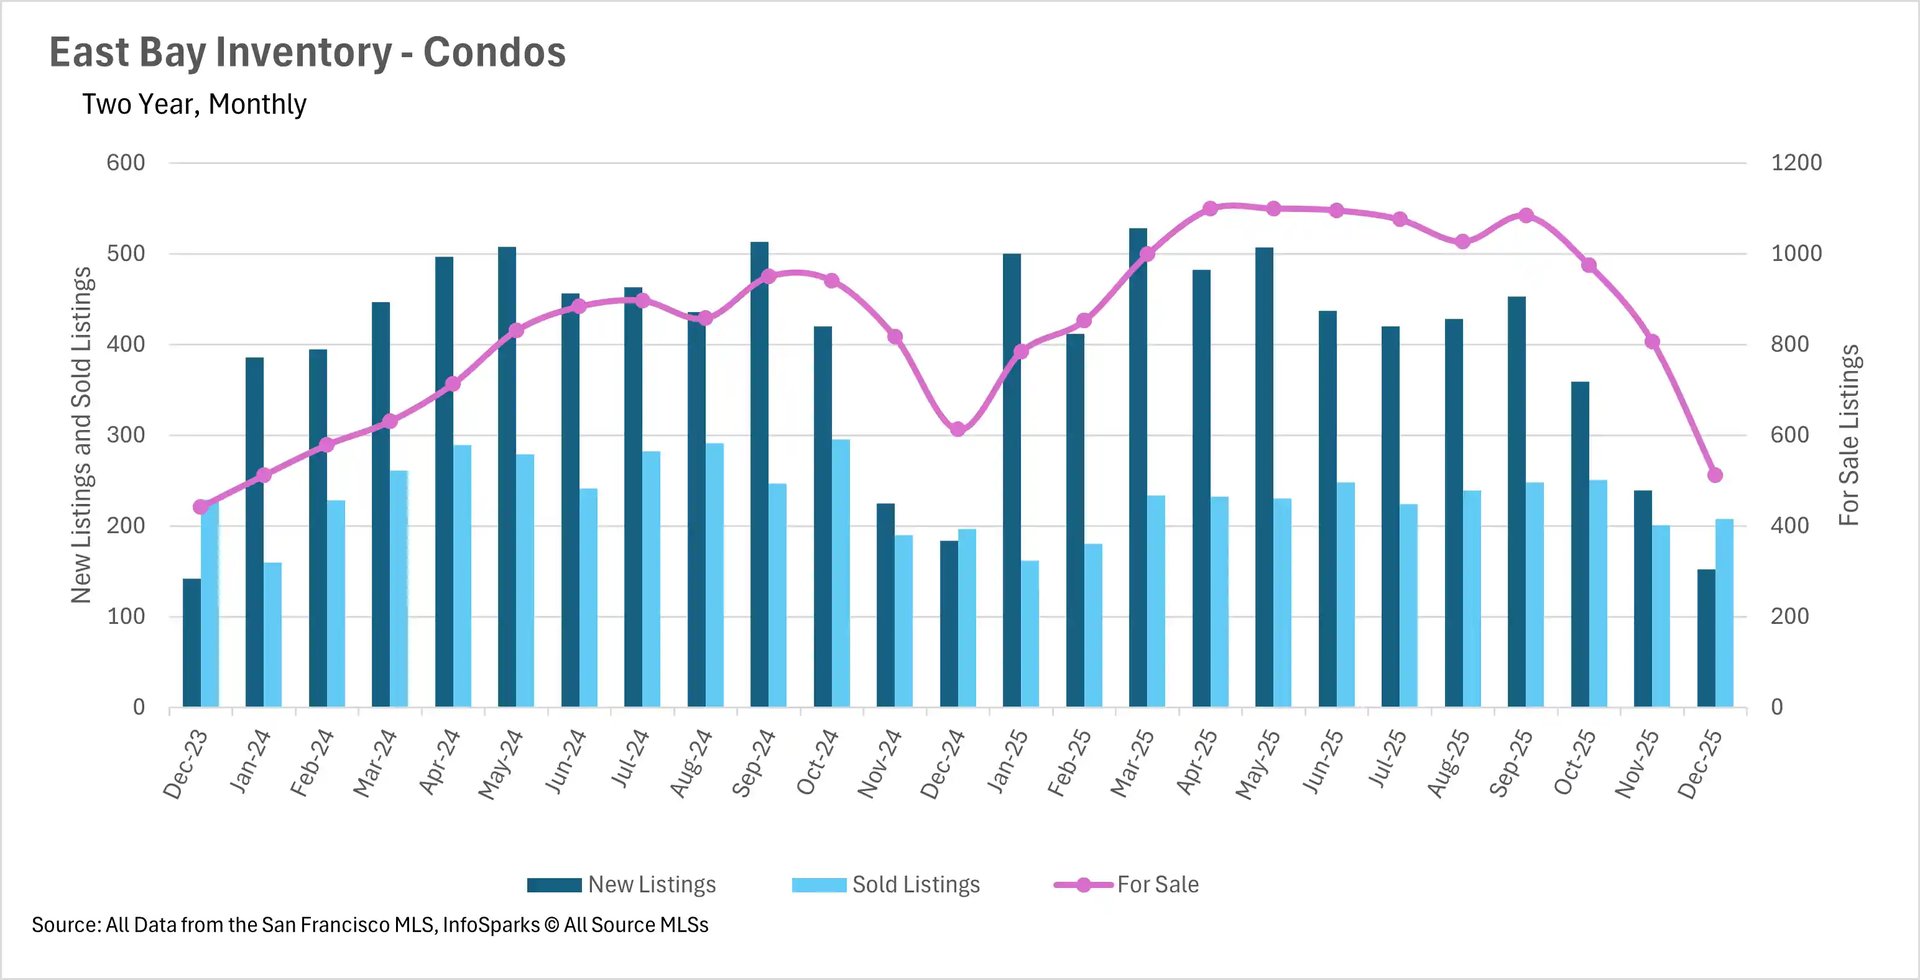
Inventory levels plummeted as the year came to a close
As we moved through the holiday season, inventory levels dropped significantly across the East Bay. Single-family home inventory fell by 18.70% on a year-over-year basis, with just 1,265 homes on the market at the end of December. The condo market saw a similar trend, with inventory declining by 16.48% year-over-year to just 512 units. This steep decline in inventory is fairly typical for this time of year, as sellers often wait until after the holidays to list their homes. However, the magnitude of the decline is notable, especially considering the elevated inventory levels we saw throughout much of 2025.
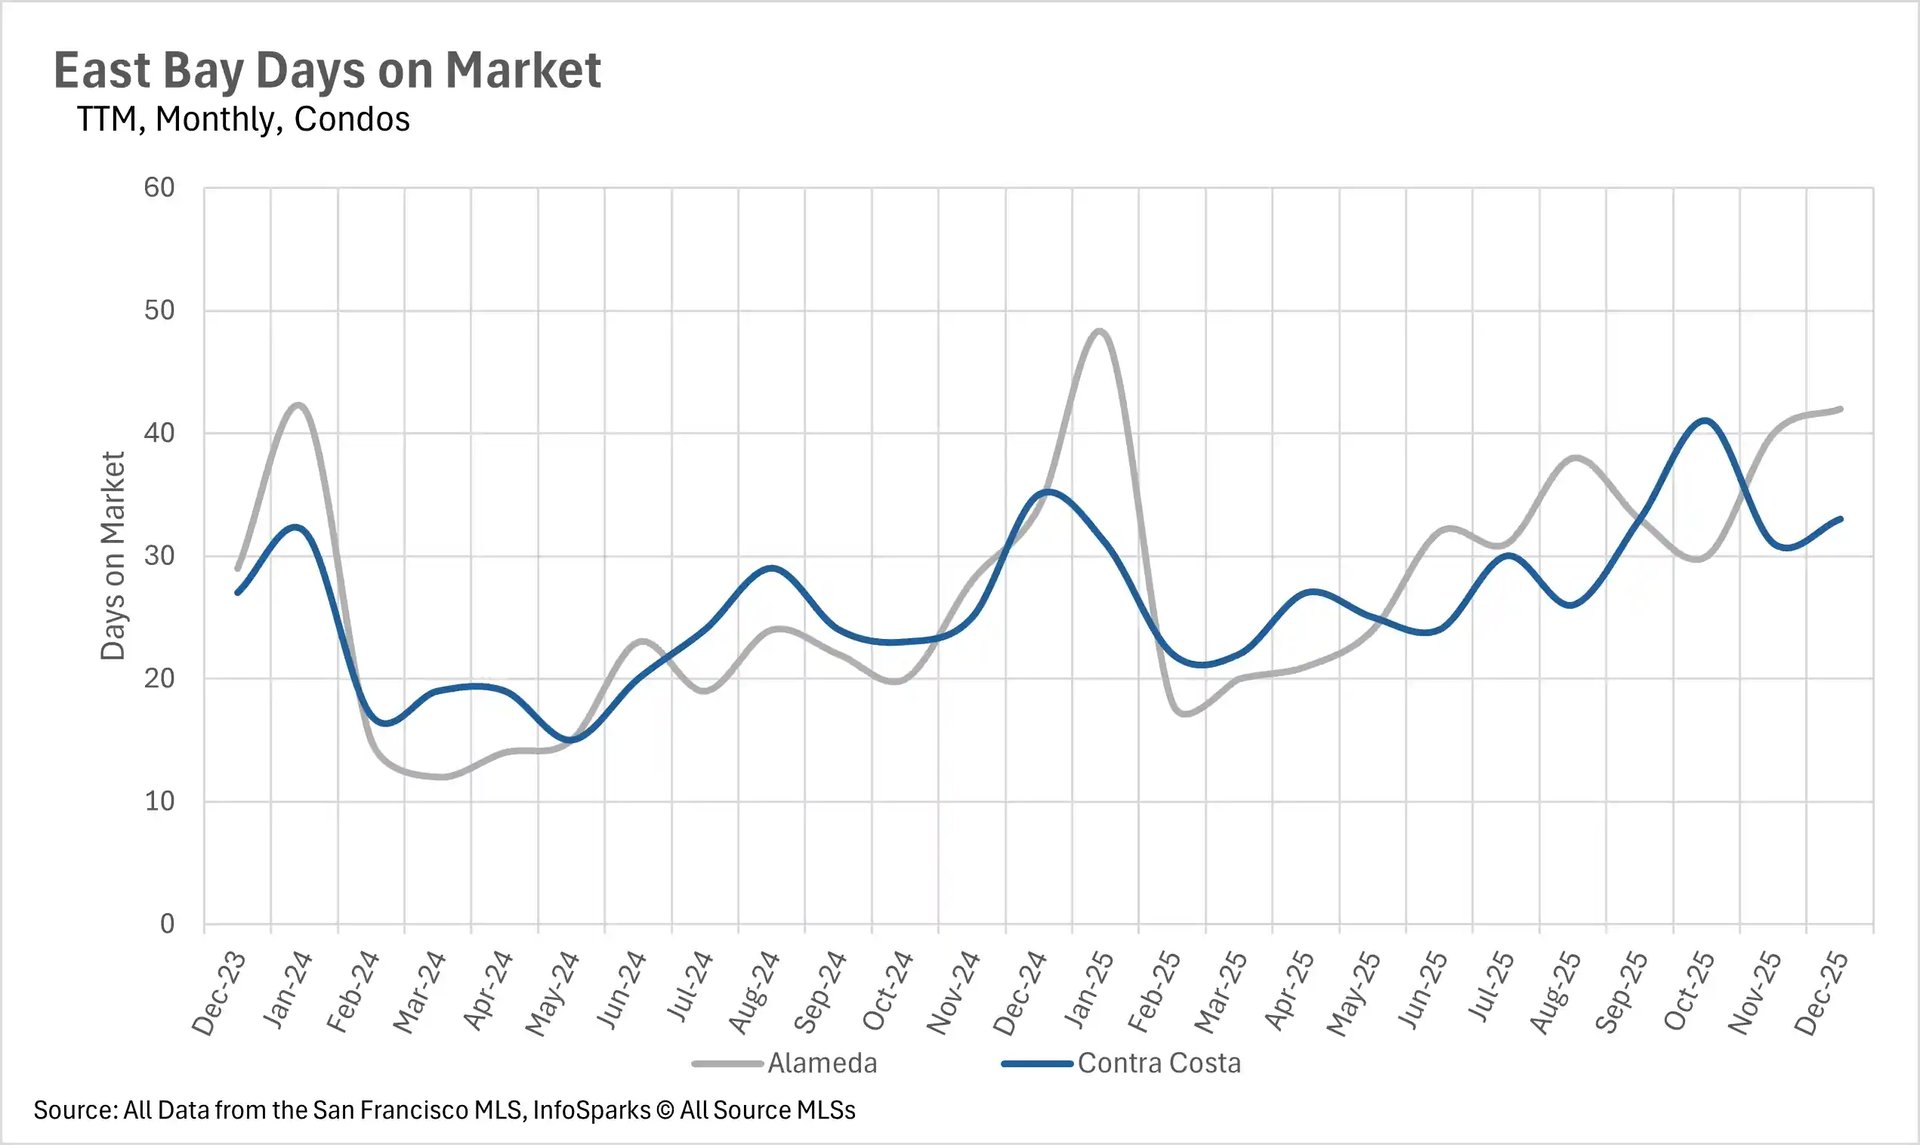
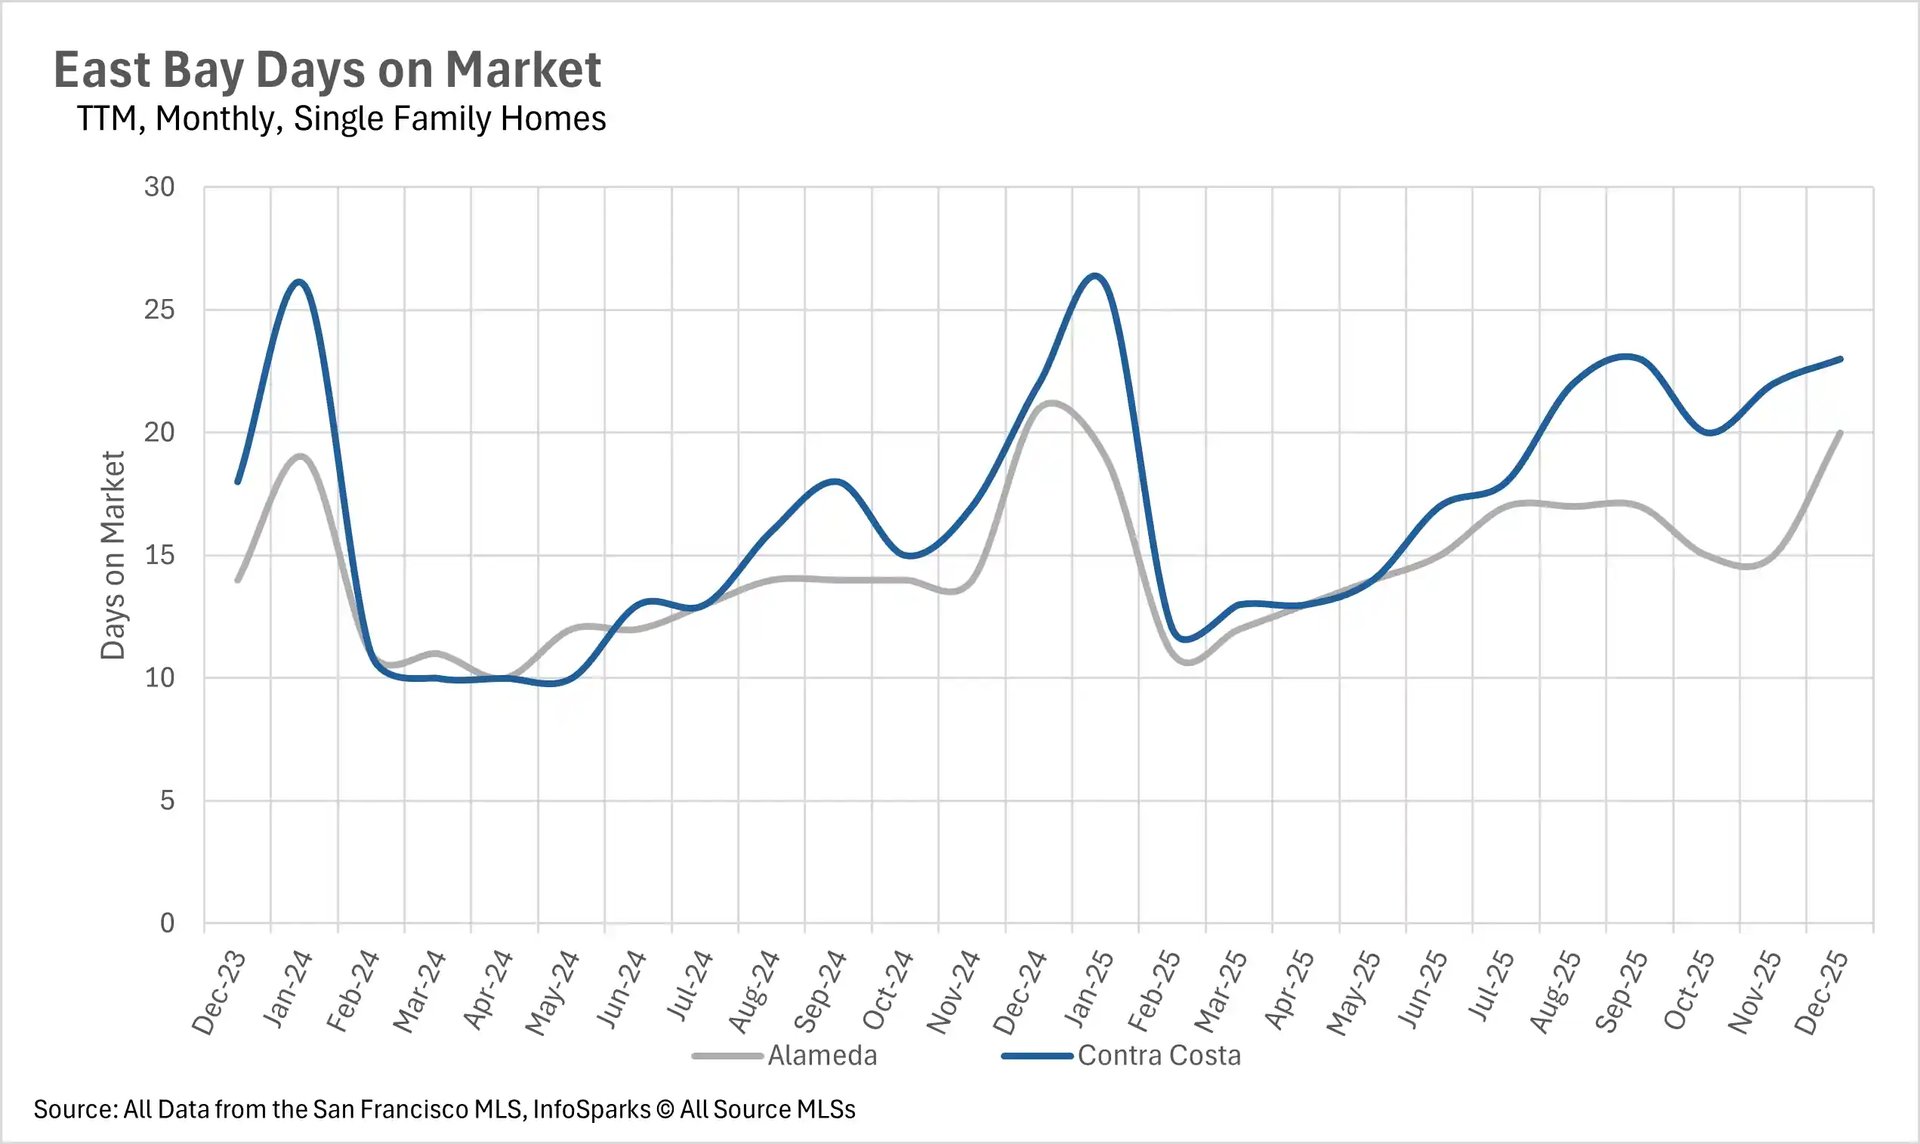
Single-family homes fly off the shelves while condos linger
The single-family home market continues to move at a brisk pace, with the average listing in Alameda County selling in just 20 days and the average listing in Contra Costa County selling in 23 days. In fact, Alameda County single-family homes are actually selling slightly faster than they were last year, with a 4.76% decrease in days on market. The condo market, on the other hand, is moving much more slowly. The average condo in Alameda County is spending 42 days on the market, representing a 23.53% increase compared to last year. Contra Costa County condos are faring a bit better at 33 days, but the overall trend is clear: buyers are snapping up single-family homes quickly while taking their time with condos.
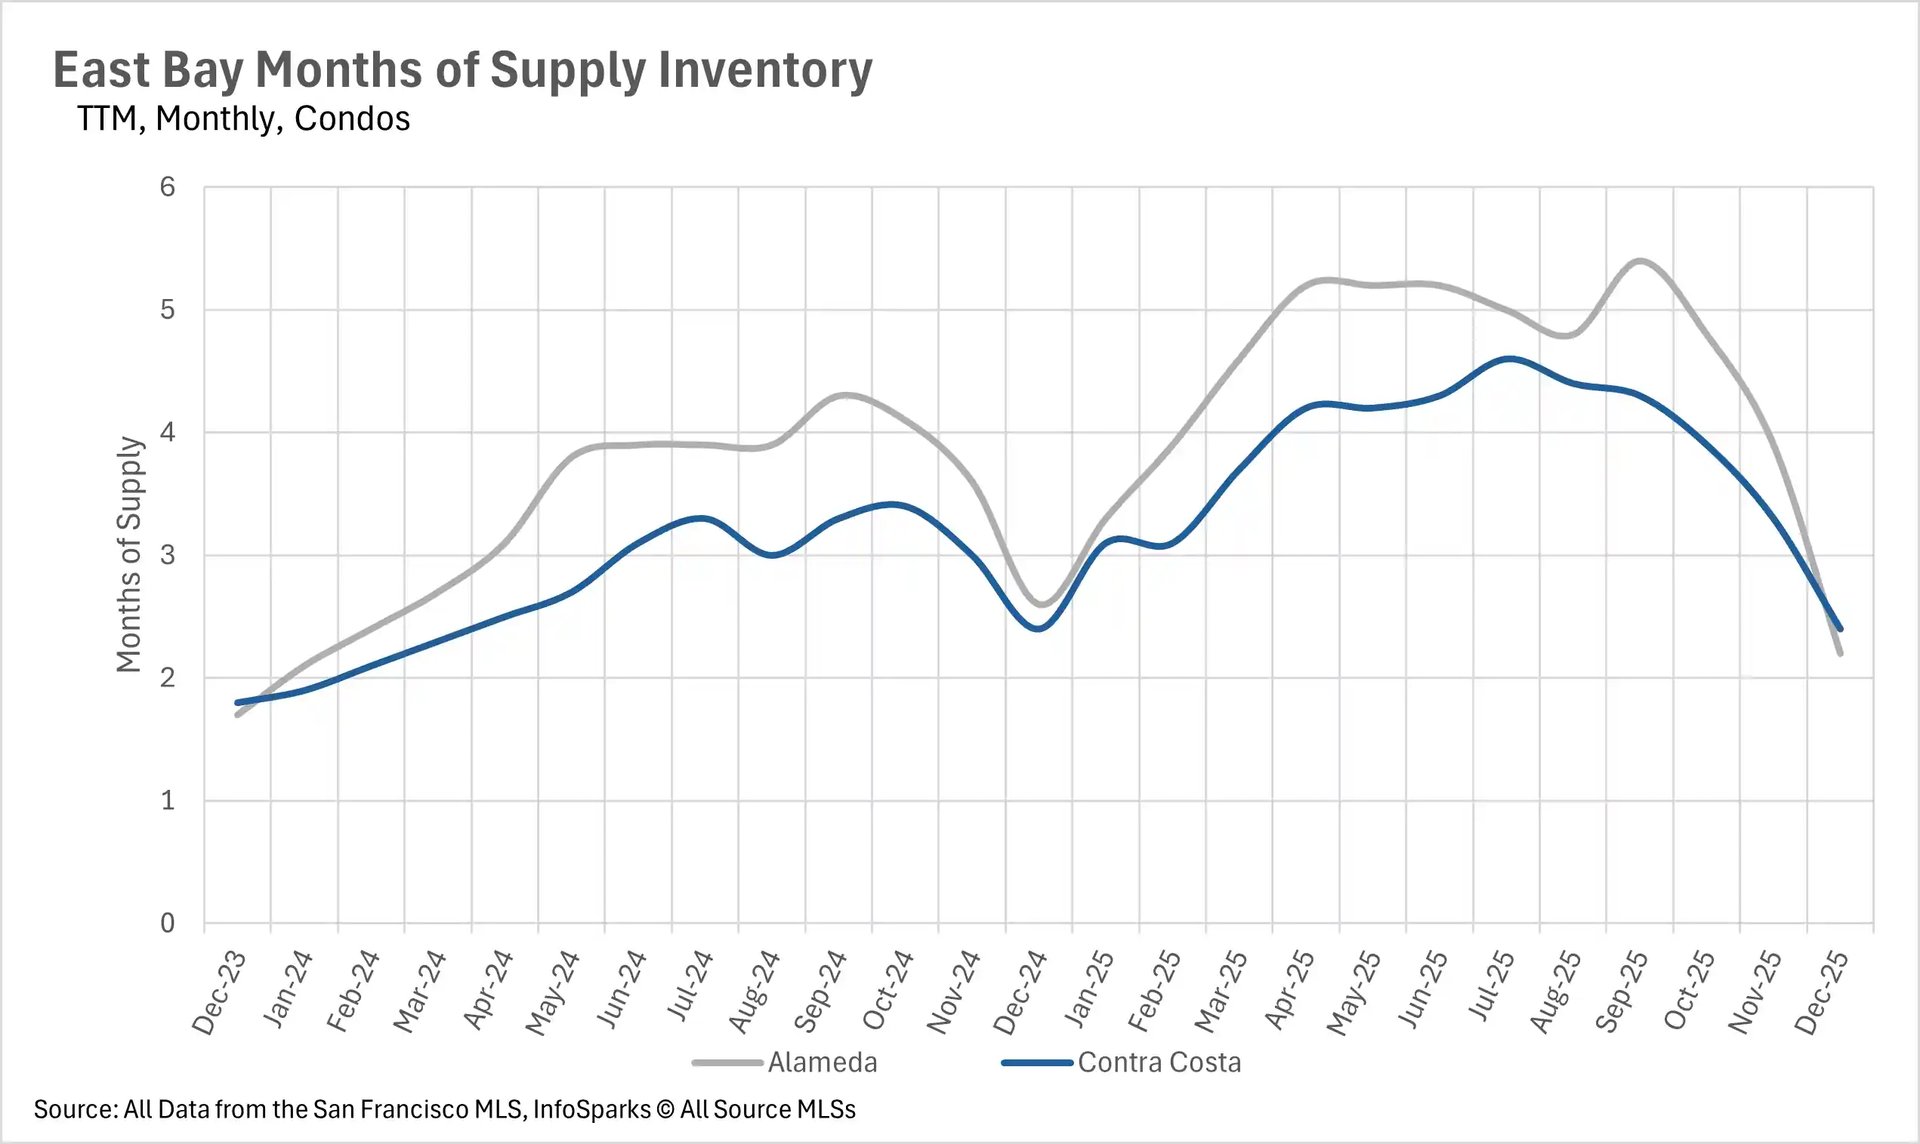
The East Bay ends the year firmly in seller's market territory
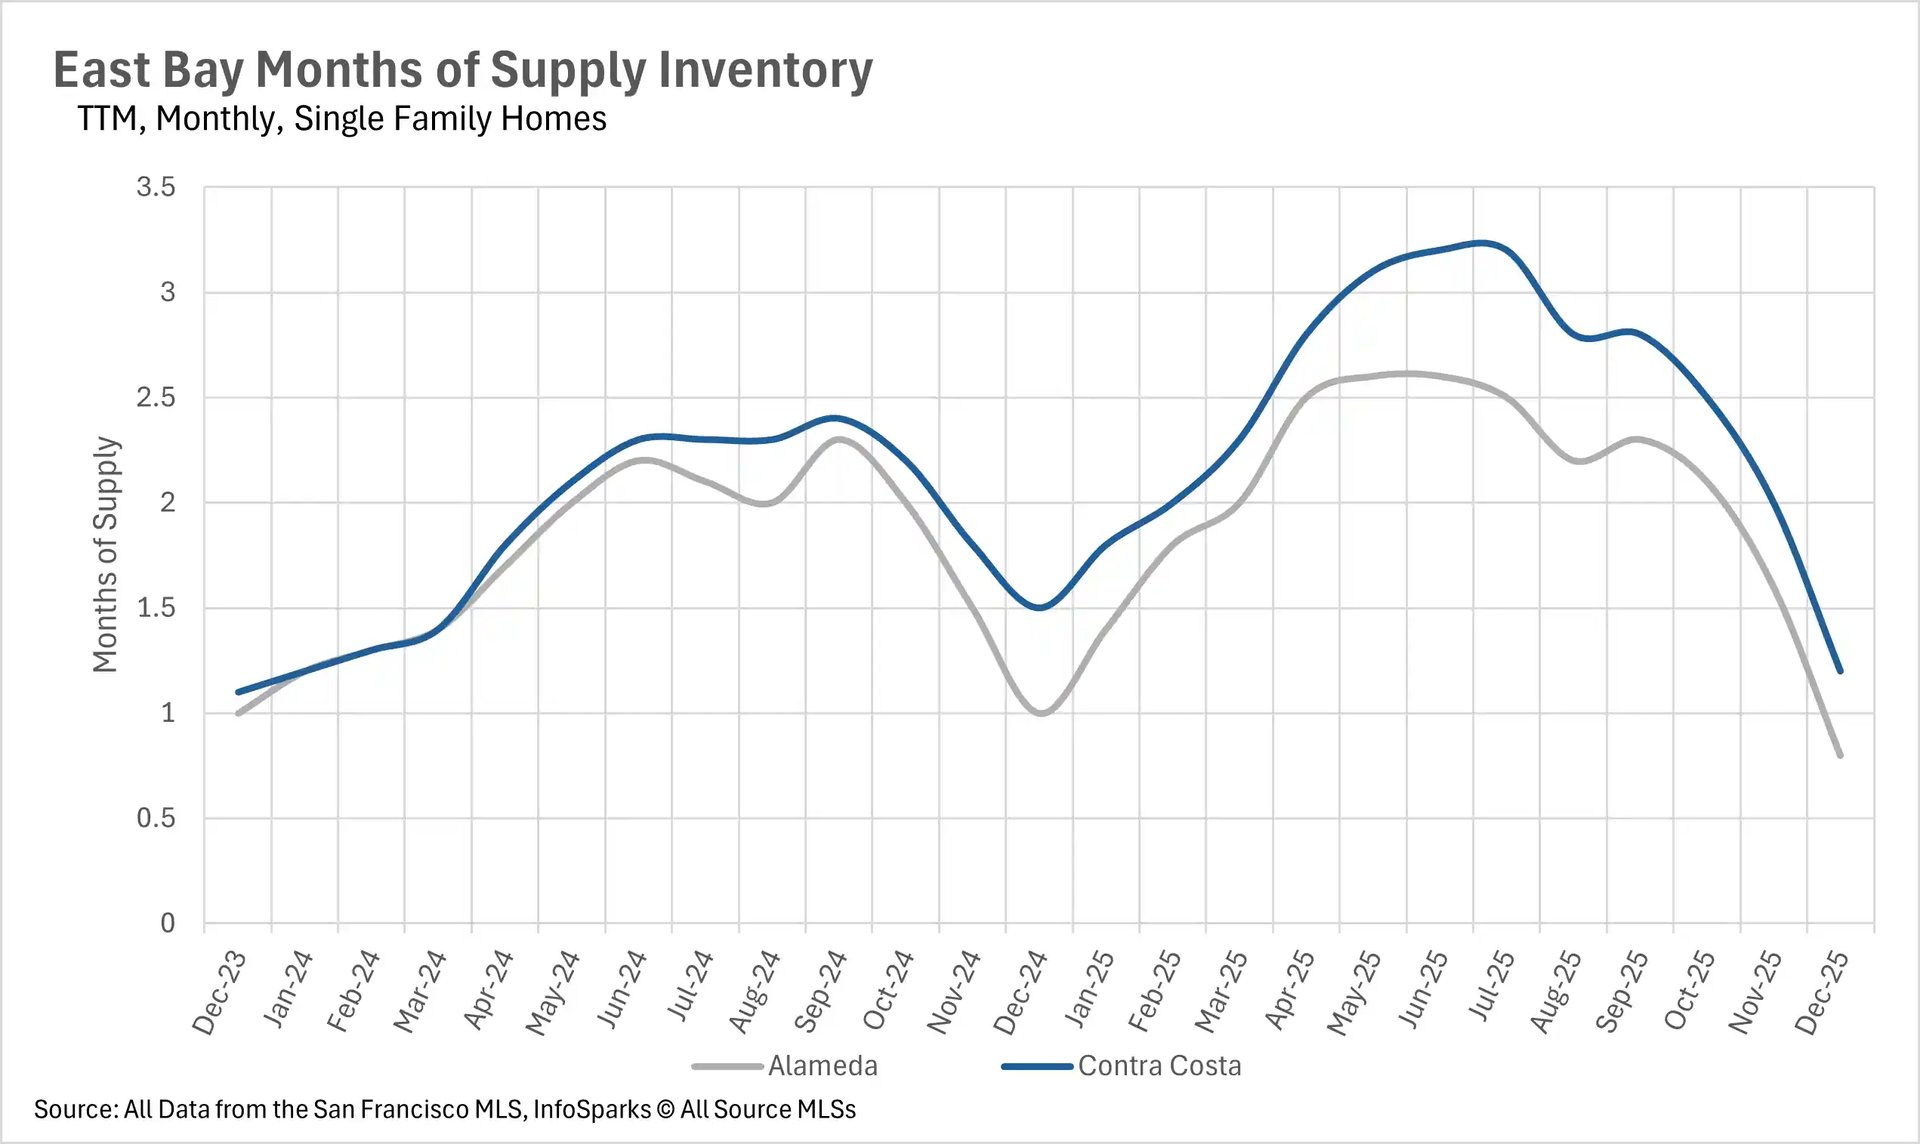
When determining whether a market is a buyers’ market or a sellers’ market, we look to the Months of Supply Inventory (MSI) metric. The state of California has historically averaged around three months of MSI, so any area with at or around three months of MSI is considered a balanced market. Any market that has lower than three months of MSI is considered a sellers’ market, whereas markets with more than three months of MSI are considered buyers’ markets.
The East Bay ended December as a strong seller's market across the board. The single-family home market is especially tight, with just 0.8 months of inventory in Alameda County and 1.2 months in Contra Costa County. This represents a 20% year-over-year decline in both counties and signals that buyers looking for single-family homes will face stiff competition heading into the new year. Even the condo market, which has struggled throughout 2025, has tightened considerably. Alameda County ended the month with 2.2 months of condo inventory, while Contra Costa County had 2.4 months. Both figures represent significant declines from earlier in the year and put the condo market firmly into seller's market territory as well.