Select a Market Report to Read:
Welcome to the latest San Francisco Real Estate Market Report from Kinoko Real Estate! As your trusted local Real Estate experts in San Francisco, we're committed to providing you with the most accurate and insightful data to guide your home buying or selling journey in this dynamic city.
The Local Lowdown
Quick Take:
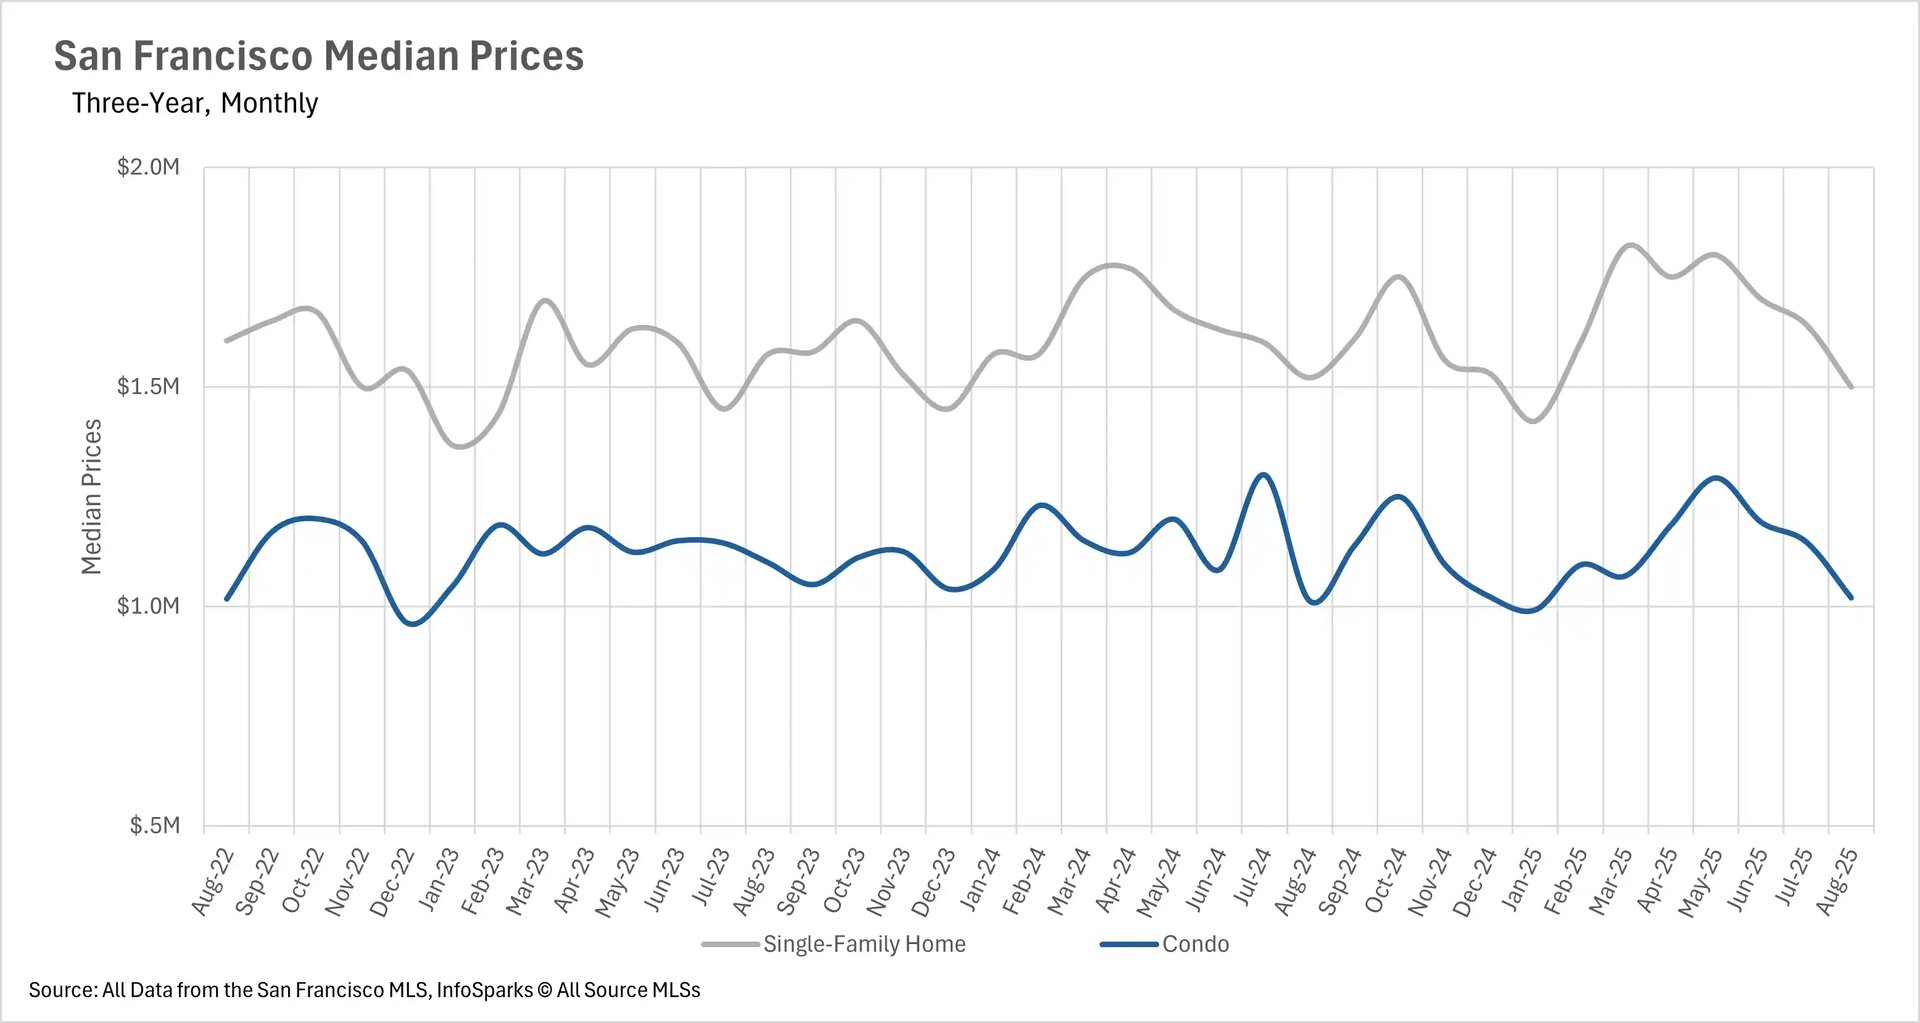
- Median sale prices remained roughly flat on a year-over-year basis in San Francisco
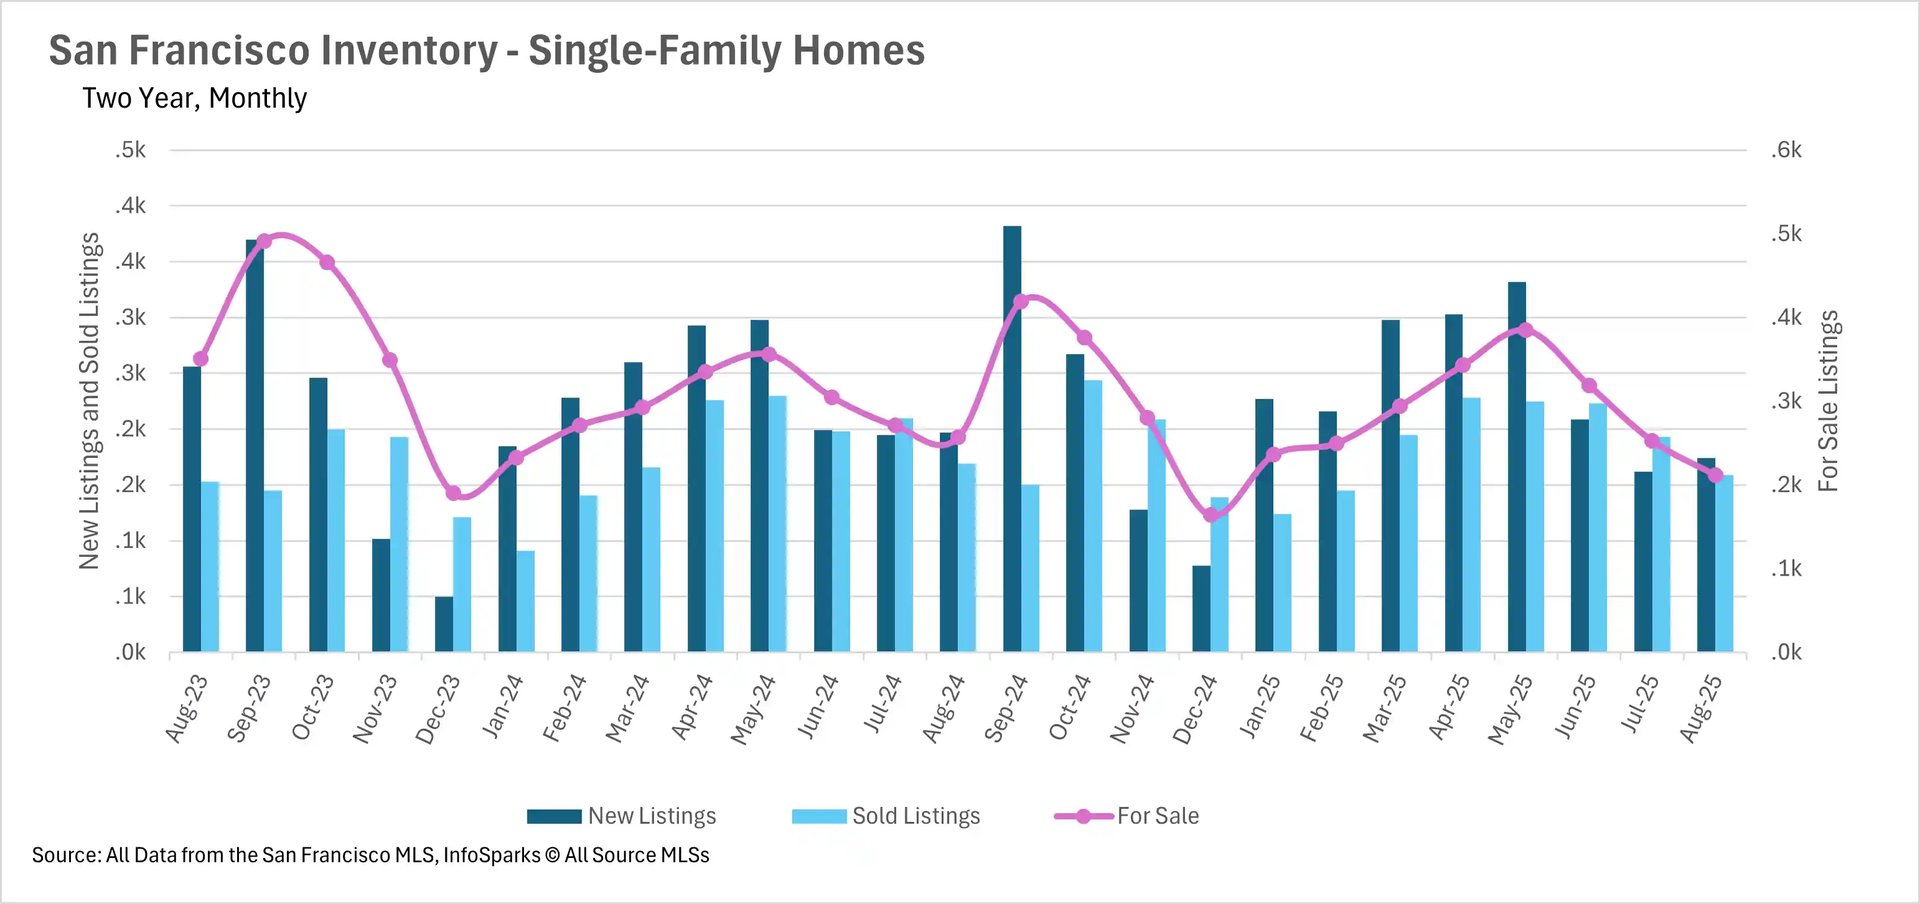
- Inventory levels continue to creep lower in both the single-family home and condo markets
- Condos are actually spending more time on the market on a year-over-year basis
Note: You can find the charts/graphs for the Local Lowdown at the end of this section.
*National Association of REALTORS® data is released two months behind, so we estimate the most recent month's data when possible and appropriate.
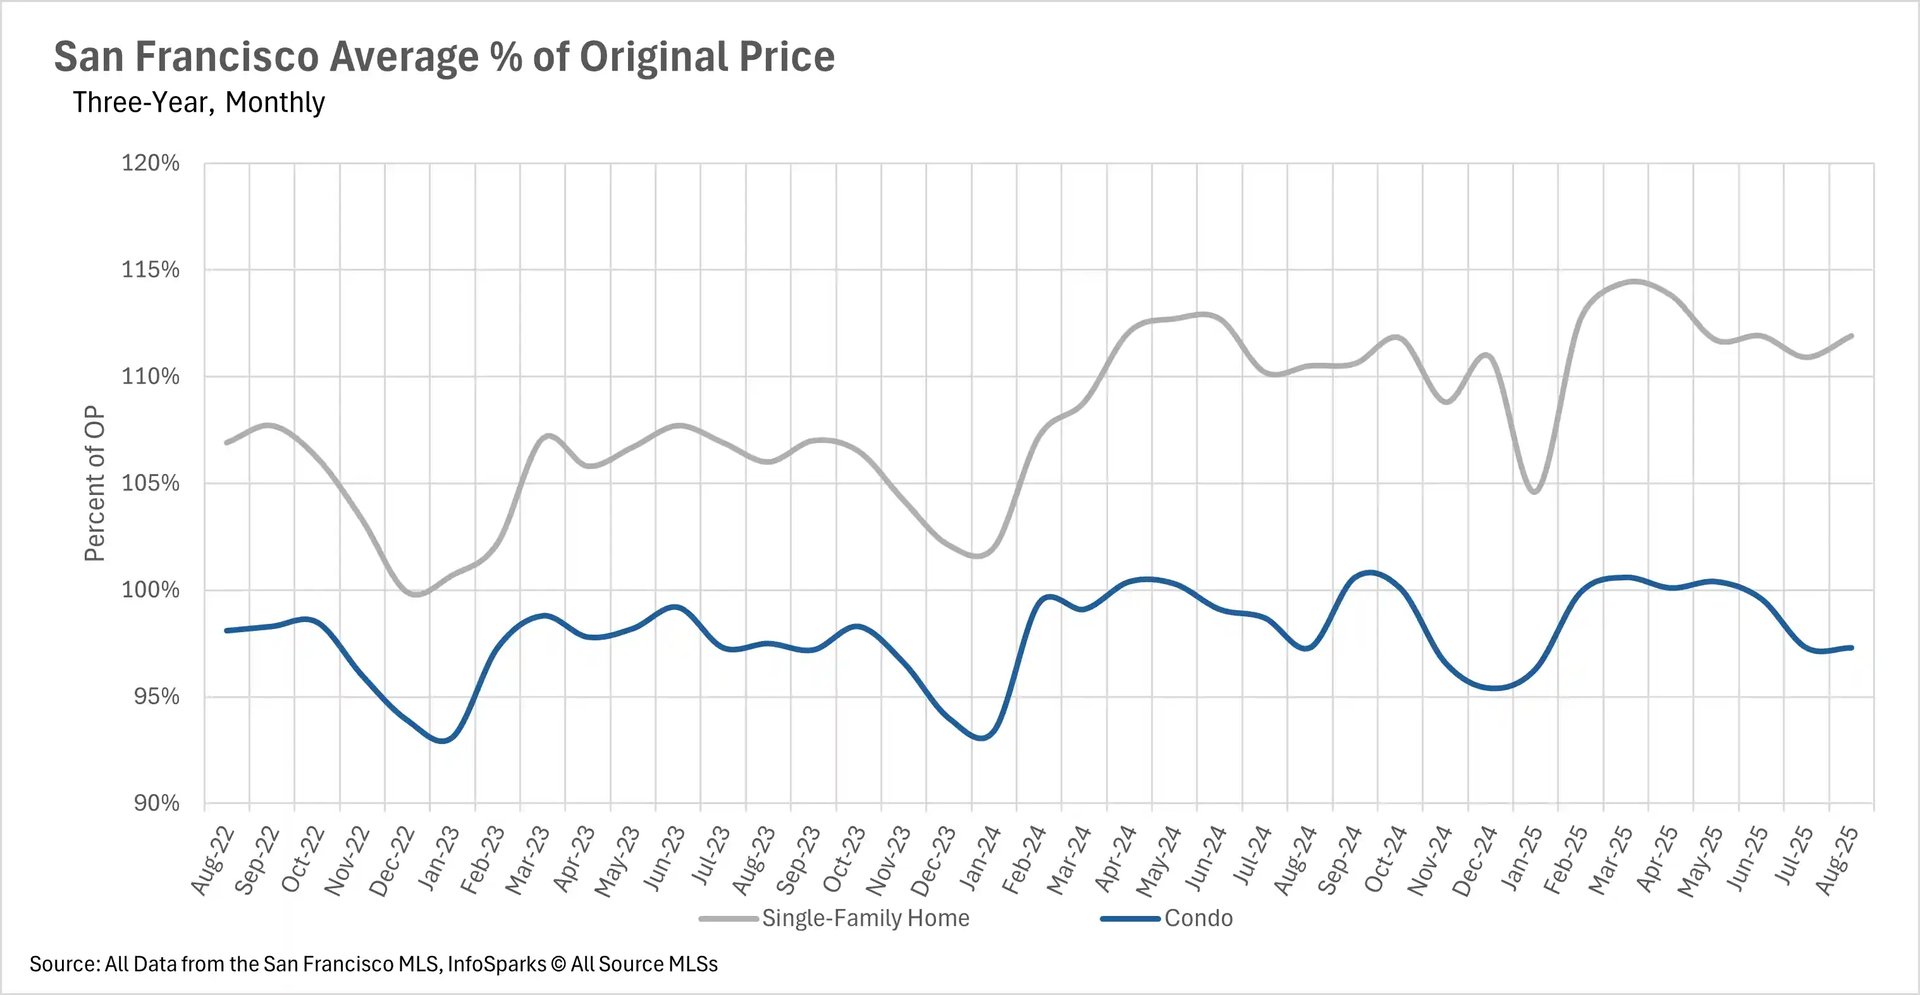
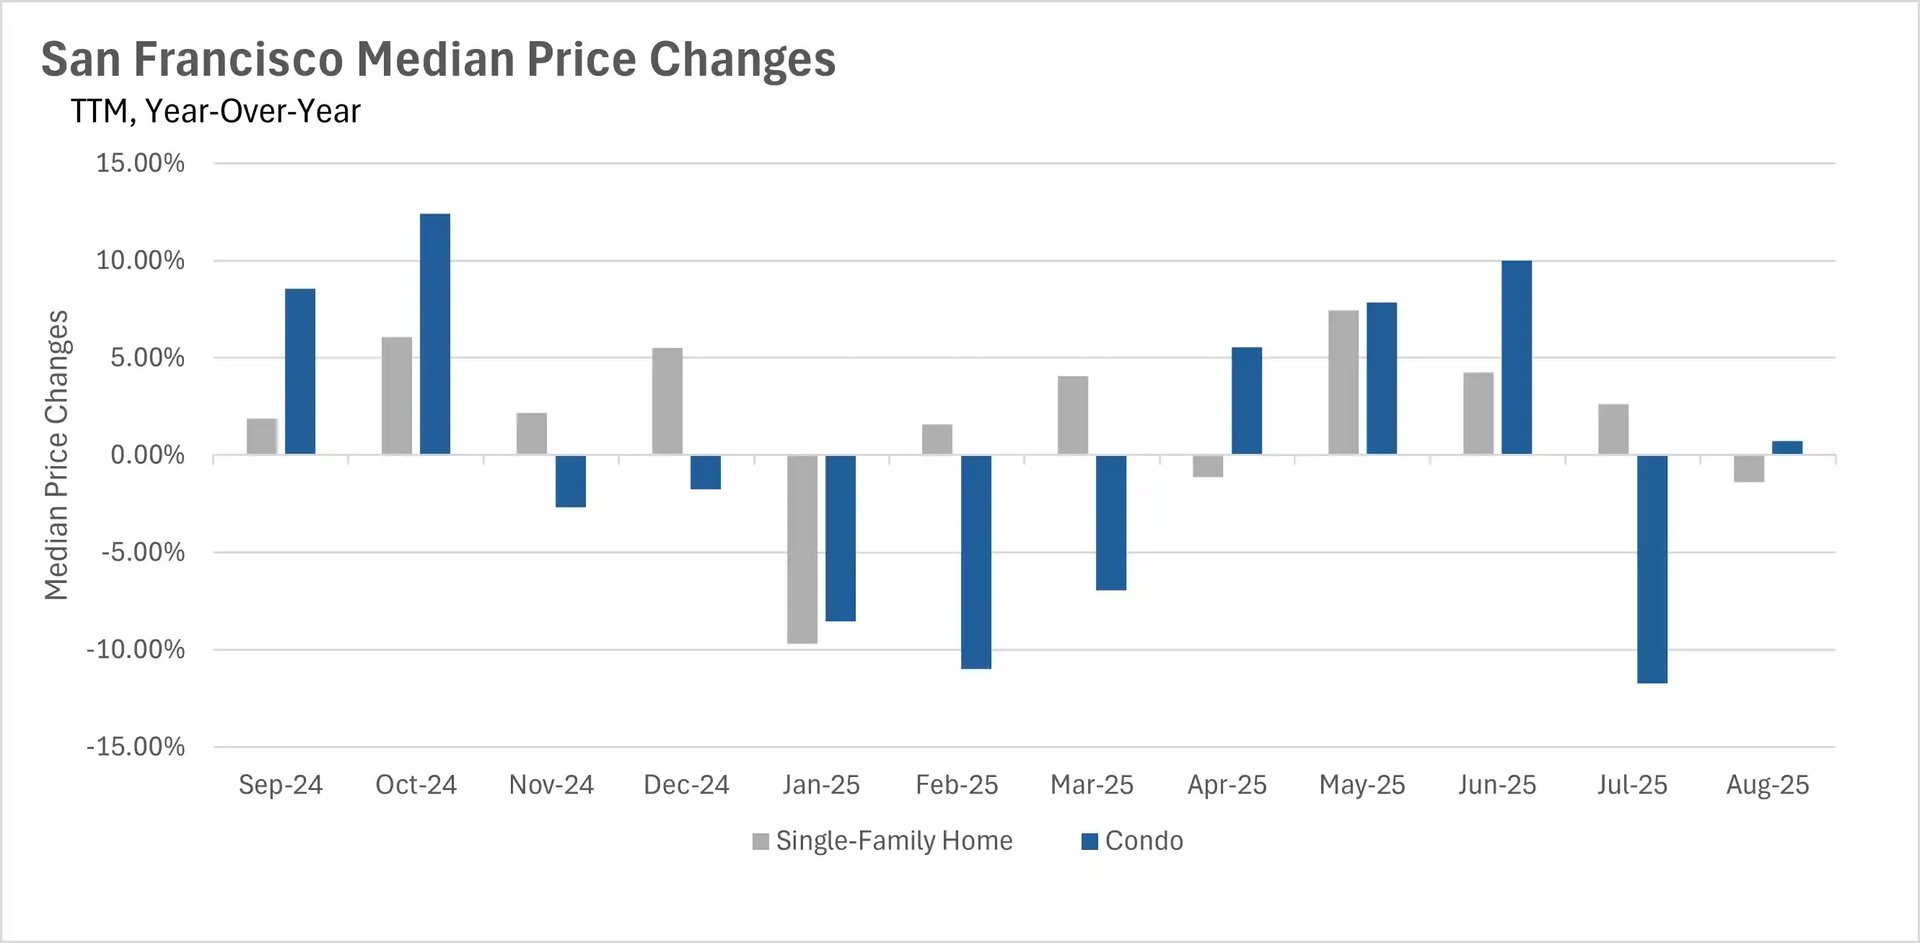
Median Sale Prices Stagnate in San Francisco
The San Francisco market has traditionally been a fairly volatile market. However, in August, the volatility was muted. The median sale price for a single-family home decreased by 1.38% on a year-over-year basis, while the median sale price for a condo increased by 0.74%. This is a relatively strange phenomenon, as year-over-year swings of 2-3%+ have become quite normal in San Francisco recently. It is worth noting, though, that the average single-family home is still selling for 111.9% of the original listing price, while the average condo sells for 97.3% of its original listing price.
If you're considering selling your home in this competitive market, learn more about our proven selling process that help maximize your sale price.
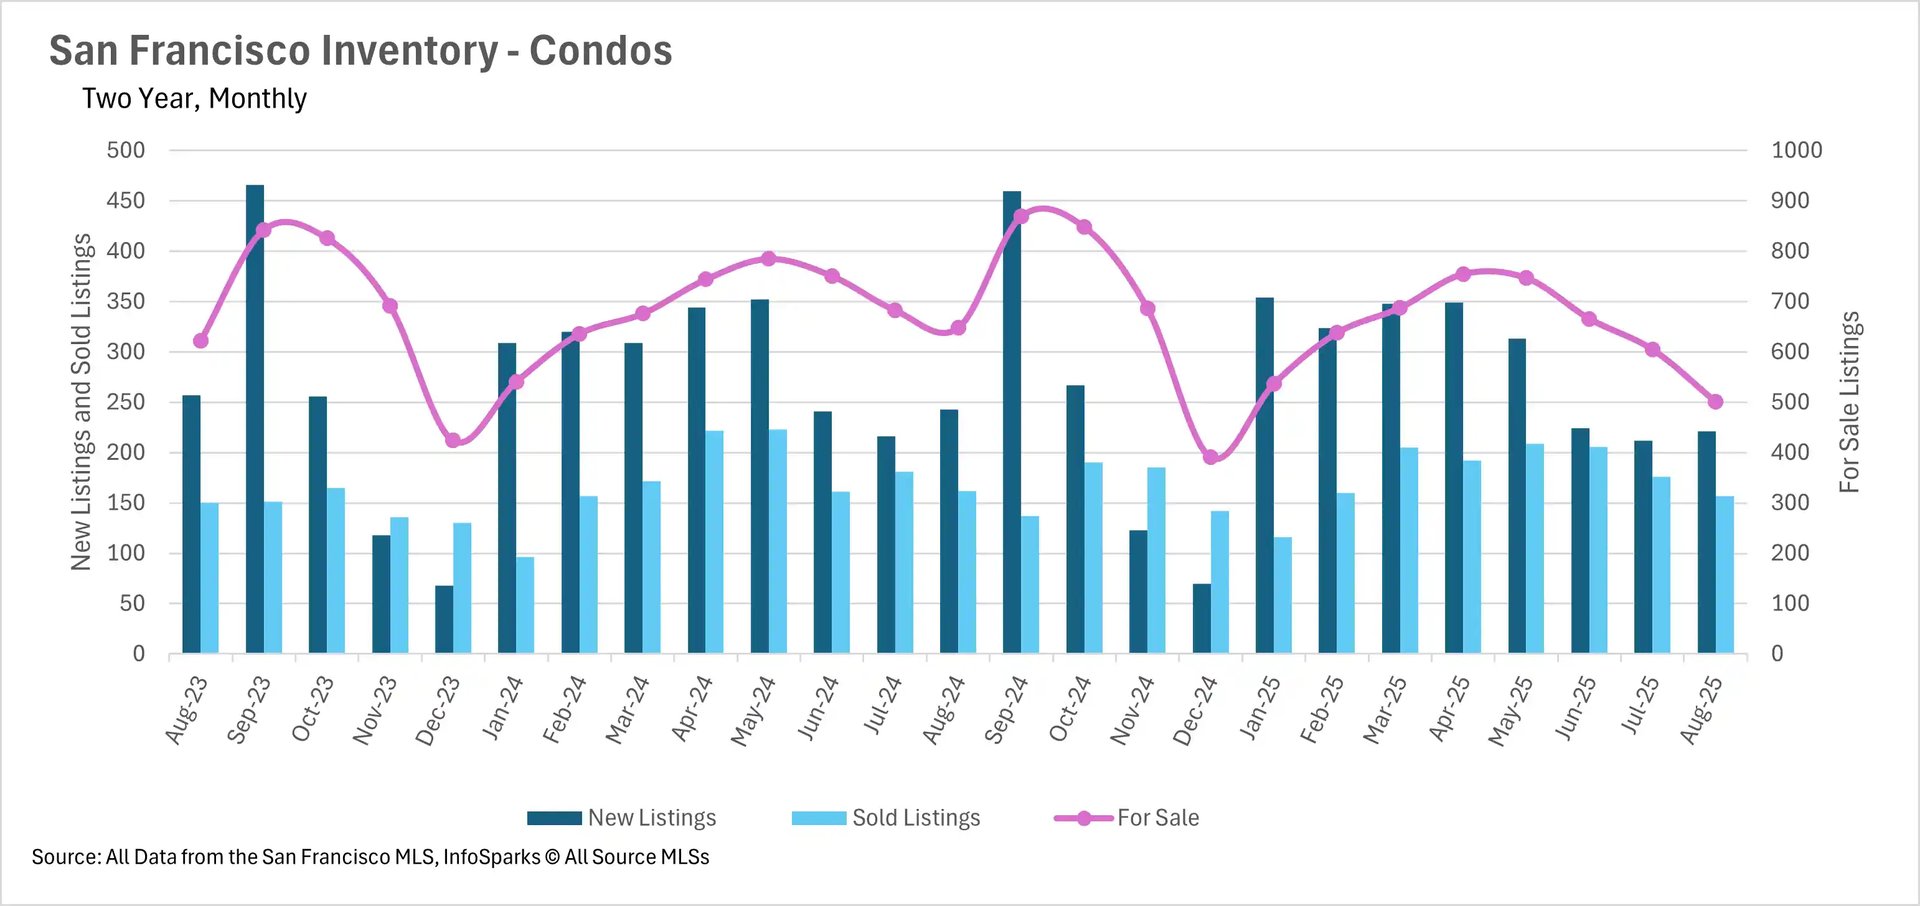
The Downtrend Continues for Inventories in San Francisco
The inventory problem is nothing new in San Francisco. While many other counties saw ballooning inventories throughout the spring and early summer, inventories in San Francisco continued their decline. This trend continued in August, with the single-family home market recording 17.51% fewer active listings on a year-over-year basis, and the condo market recording 22.69% fewer active listings. This trend continues to be concerning, but unfortunately, there's no end in sight!
Understanding these market dynamics is just the first step. Whether you're a buyer looking to enter this competitive market or a seller wanting to capitalize on current conditions, having the right strategy and representation makes all the difference.
Don't just take our word for it - read what our clients have to say about their experiences in our testimonials.
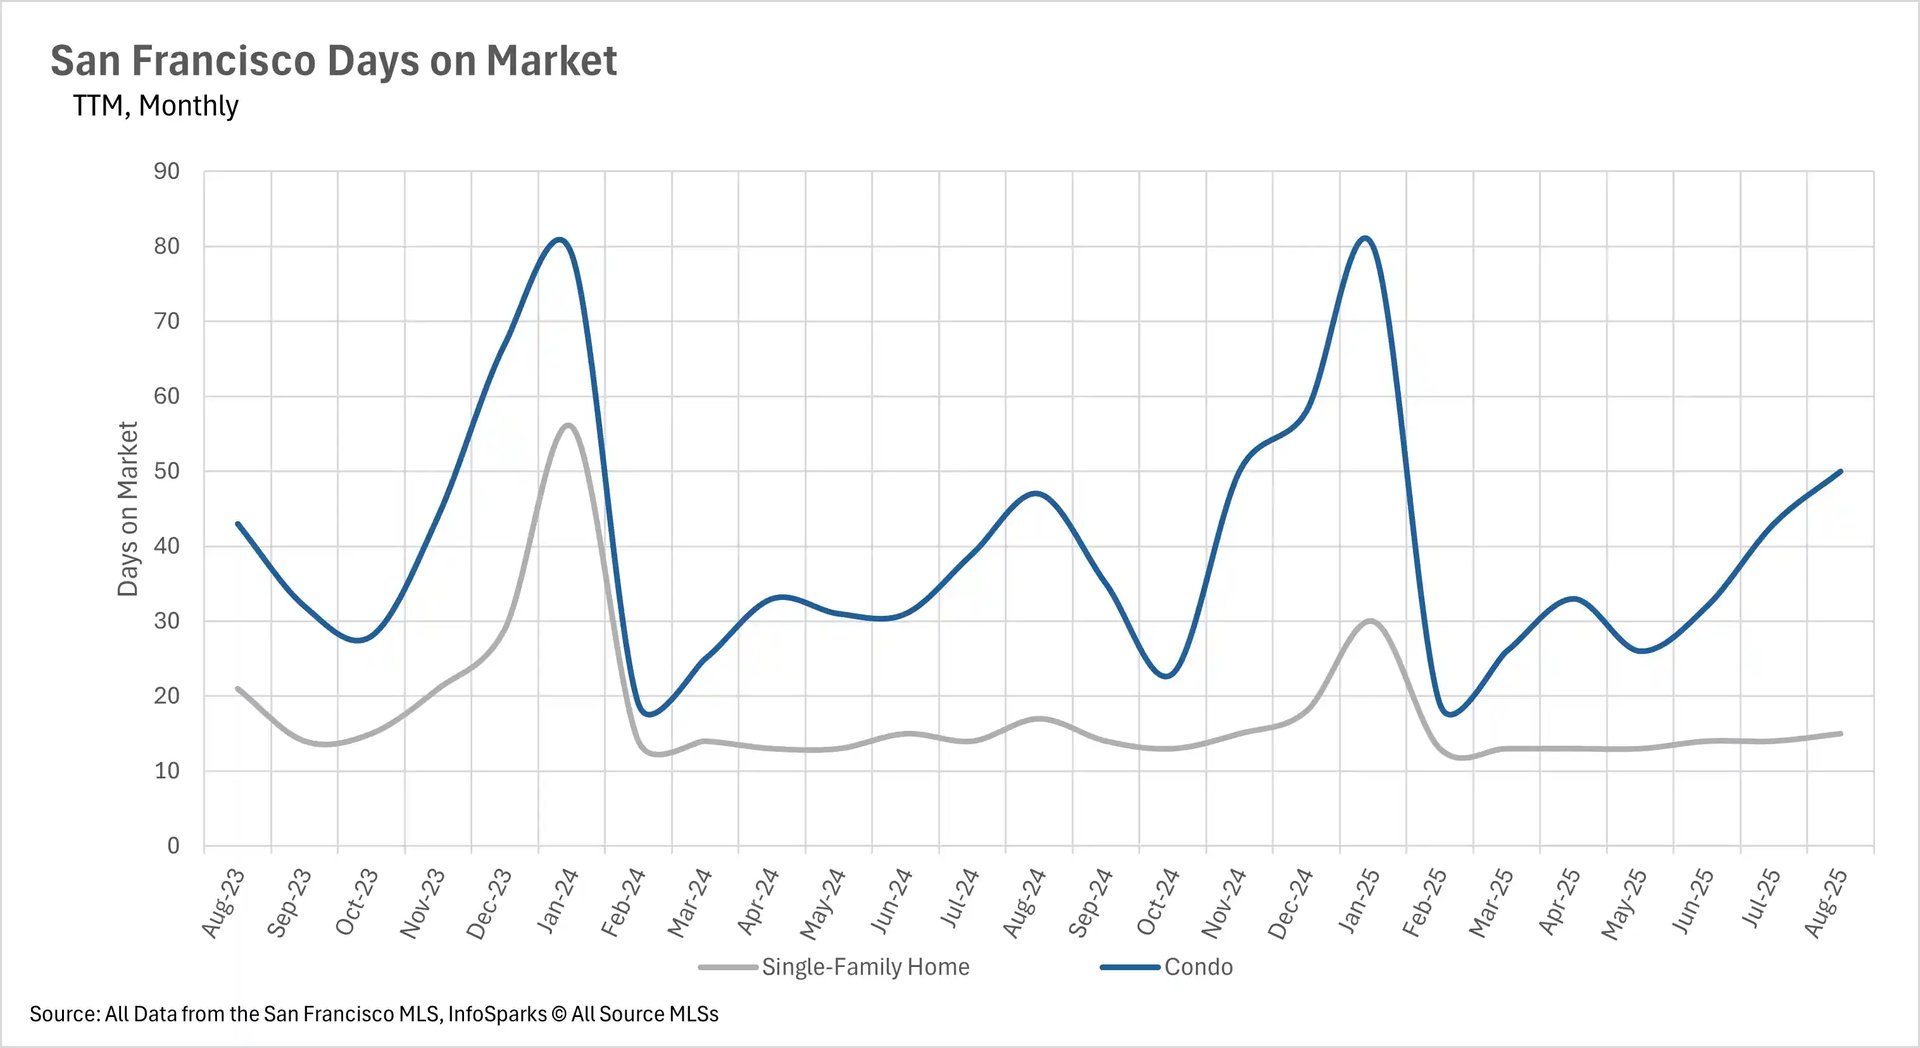
Despite Incredibly Low Inventories, Condos Still Take Some Time to Sell
While you might assume that lower inventories mean that listings are spending less time on the market, you'd only be partially right when we look at San Francisco. The average single-family home is being scooped up incredibly quickly, spending just 15 days on the market. However, when we turn to the condo market, the average condo is spending 50 days on the market, representing a 6.38% increase year-over-year.
Whether you're buying or selling in today's market, timing and strategy are crucial. Check out our case studies to see how we've successfully navigated similar market conditions for our clients.
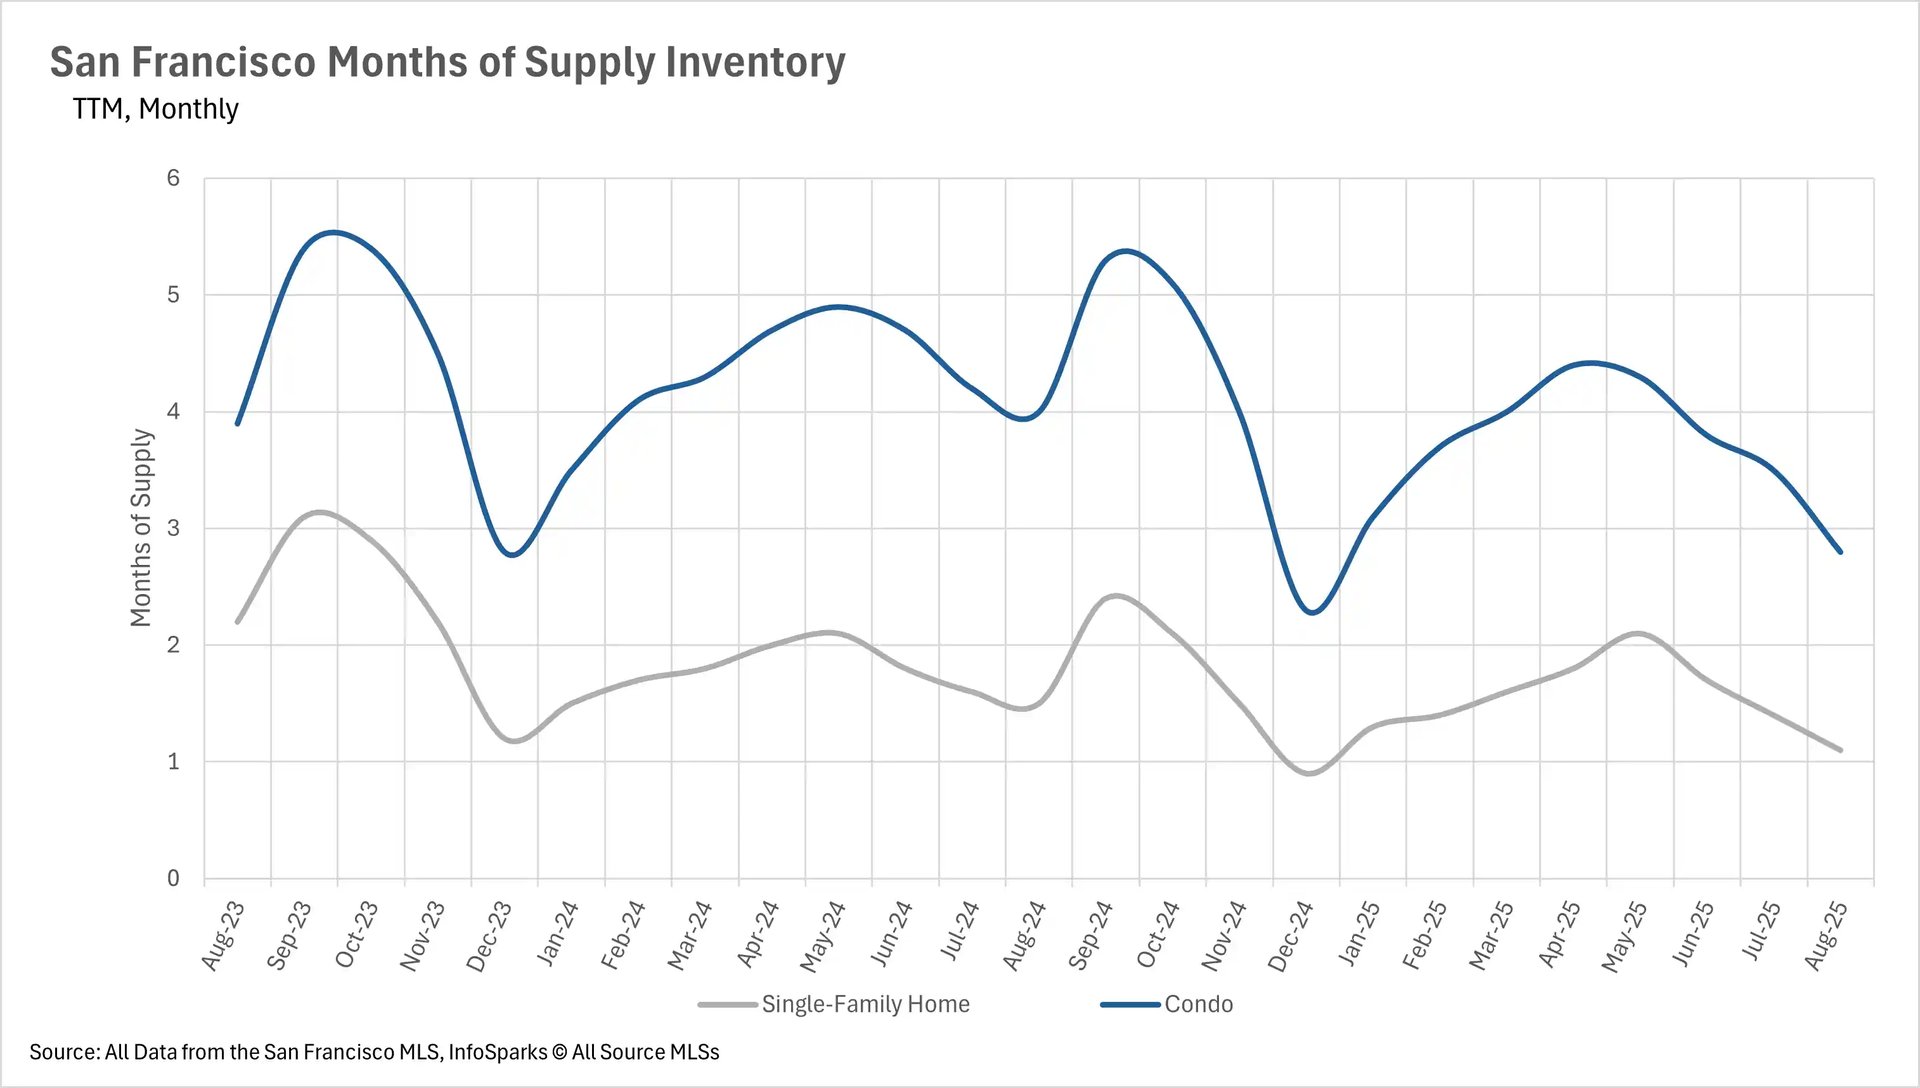
Both the Single-Family Home and Condo Markets Are Sellers' Markets
When determining whether a market is a buyers' market or a sellers' market, we look to the Months of Supply Inventory (MSI) metric. The state of California has historically averaged around three months of MSI, so any area with at or around three months of MSI is considered a balanced market. Any market that has lower than three months of MSI is considered a seller's market, whereas markets with more than three months of MSI are considered buyers' markets.
This past month, we saw some of the lowest levels of inventory ever in terms of months' worth of supply in the San Francisco area. Both the single-family home and condo markets are fierce seller's markets, with the single-family home market having just 1.1 months' worth of inventory on the market, and the condo market having just 2.8 months of inventory.
Ready to make your next move in San Francisco real estate? Contact our team today for personalized guidance tailored to your specific needs and goals.