Interior photograph of a mid-century modern open-plan living and kitchen space featuring a wood-paneled ceiling with exposed beams, warm walnut cabinetry, and floor-to-ceiling windows with horizontal blinds overlooking greenery. In the foreground, a classic Eames lounge chair and ottoman in dark leather sits beside a small side table.

San Francisco Real Estate - February 2026 Market Report

Select a Market Report to Read:

National Market Update Overview
Bay Area
North Bay
East Bay
Silicon Valley
San Francisco

The Local Lowdown

Quick Take:

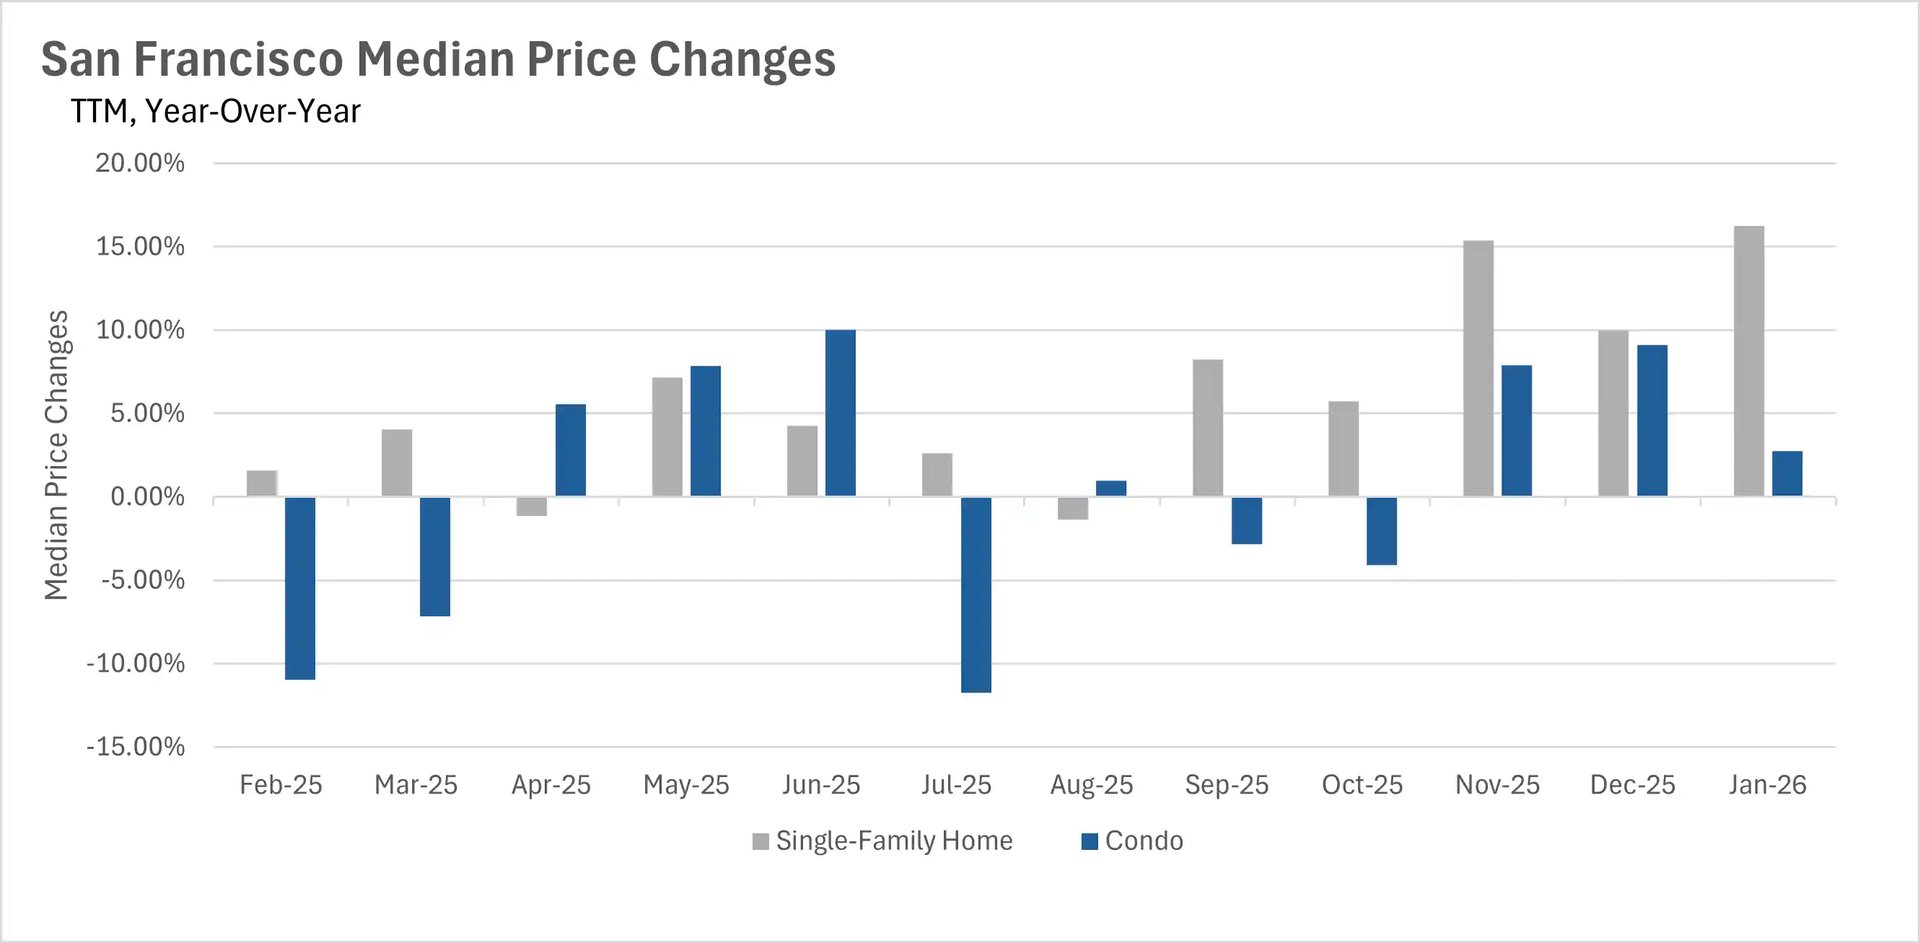
  • Single-family home prices surged by more than 16% year-over-year, marking one of the strongest January performances in recent memory.
  • Inventory levels remain severely constrained, with total listings down nearly 40% compared to last year.
  • The average single-family home is selling in just 13 days, more than half the time it took last January.

Note: You can find the charts/graphs for the Local Lowdown at the end of this section.

*National Association of REALTORS® data is released two months behind, so we estimate the most recent month's data when possible and appropriate.

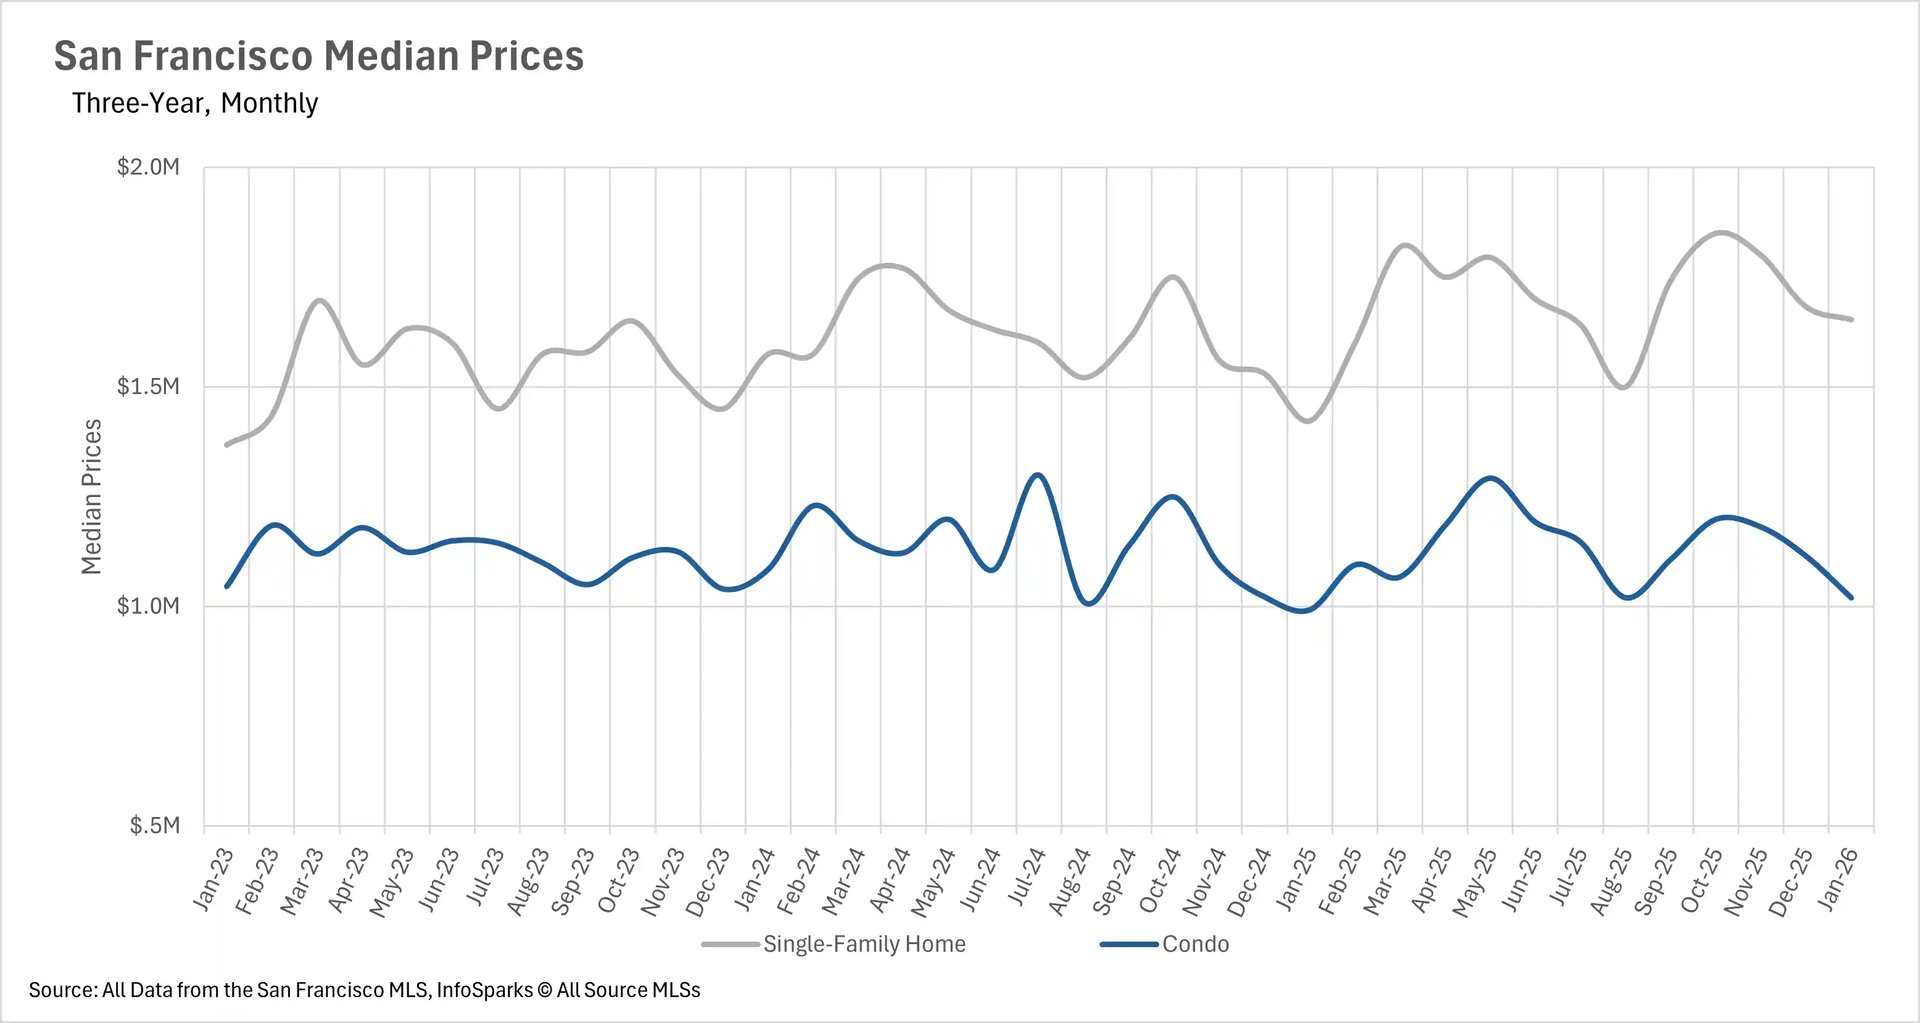
San Francisco kicks off 2026 with explosive price growth

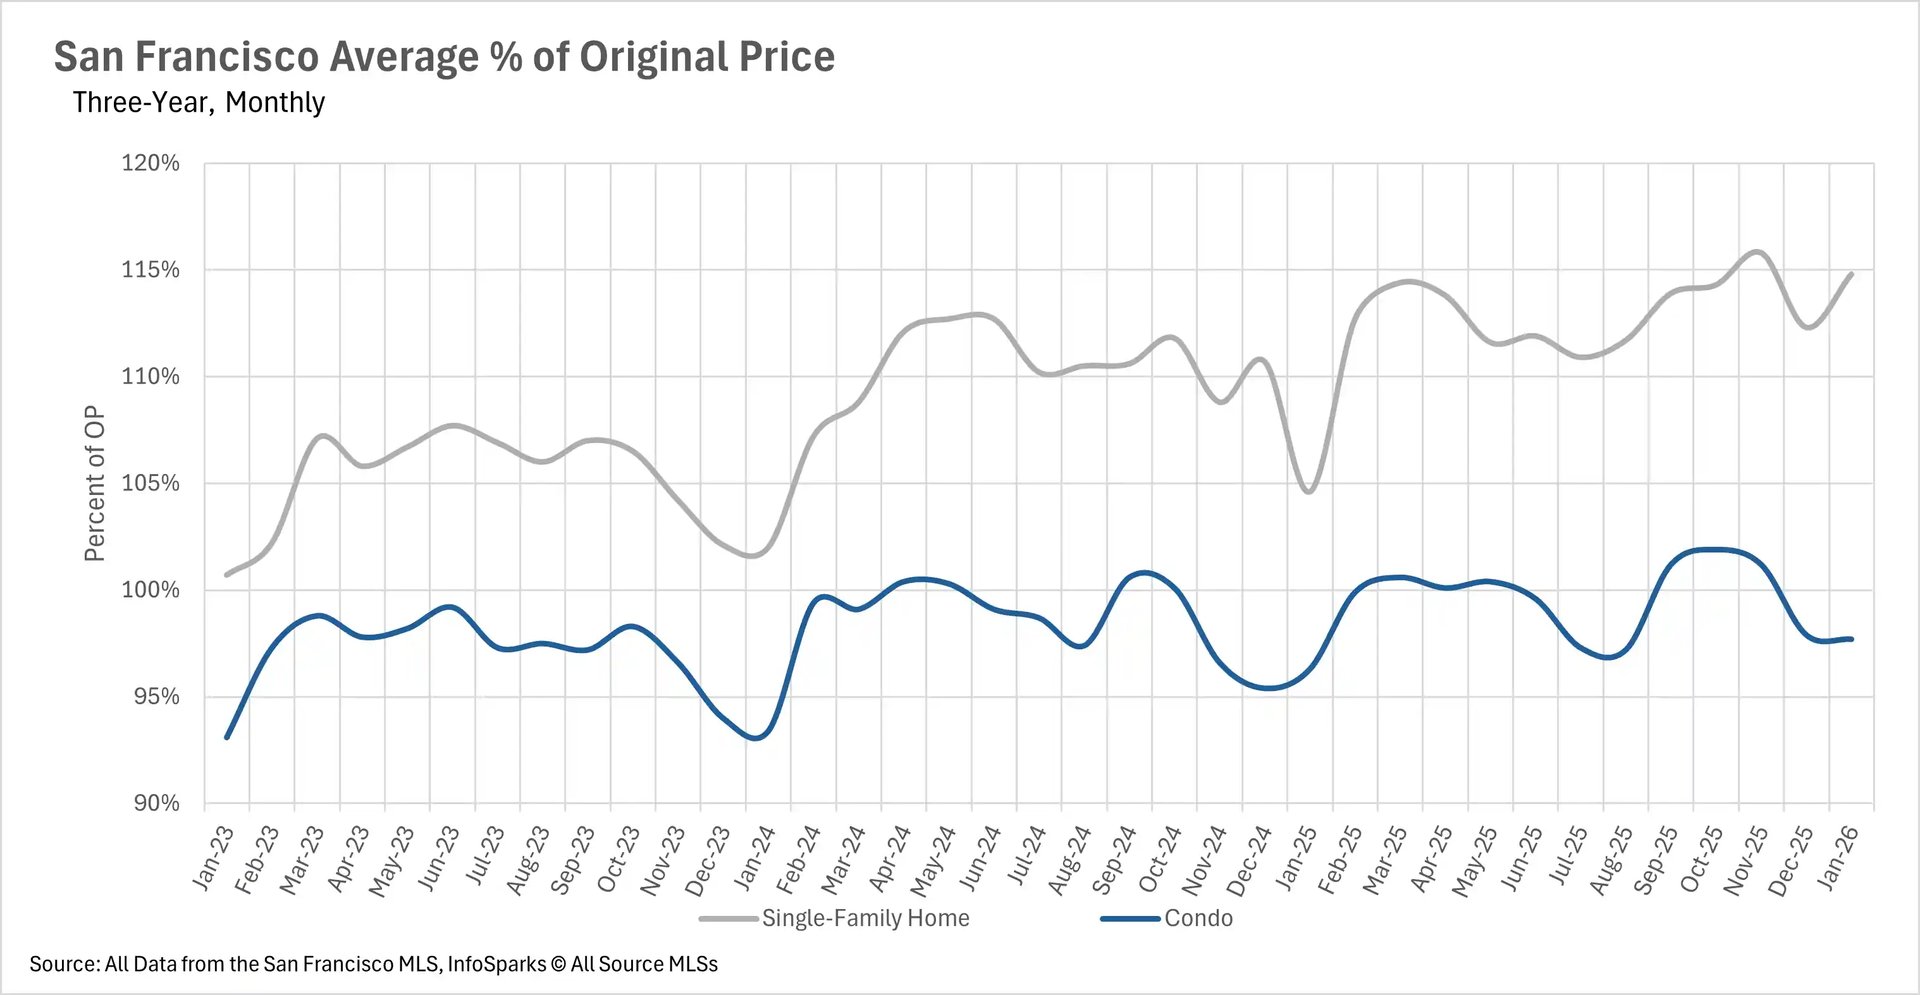
San Francisco's housing market roared into 2026 with remarkable year-over-year price appreciation. Single-family homes saw a stunning 16.23% increase in median sale price, with the median home selling for $1,653,325. Condos also posted gains, with the median sale price rising by 2.77% to $1,020,000. The demand for single-family homes remains exceptionally strong, with the average home selling for nearly 15% over the original asking price. Meanwhile, condos are selling at a slight discount, closing at 97.7% of list price on average.

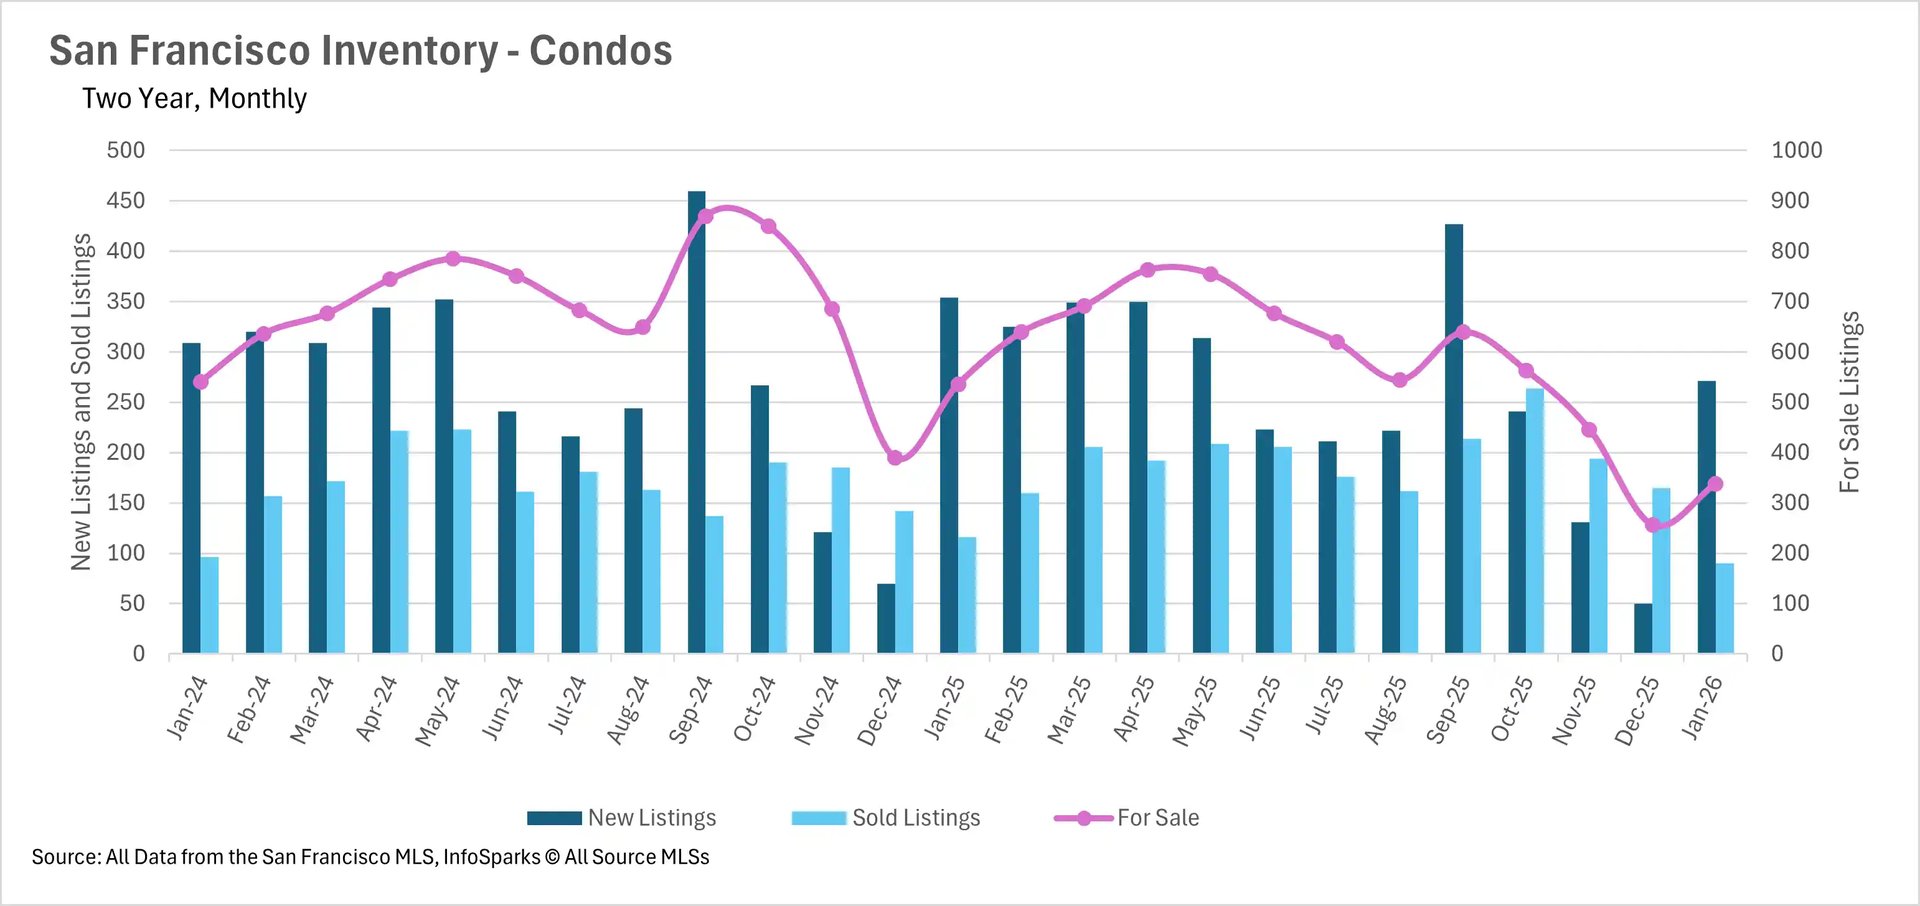
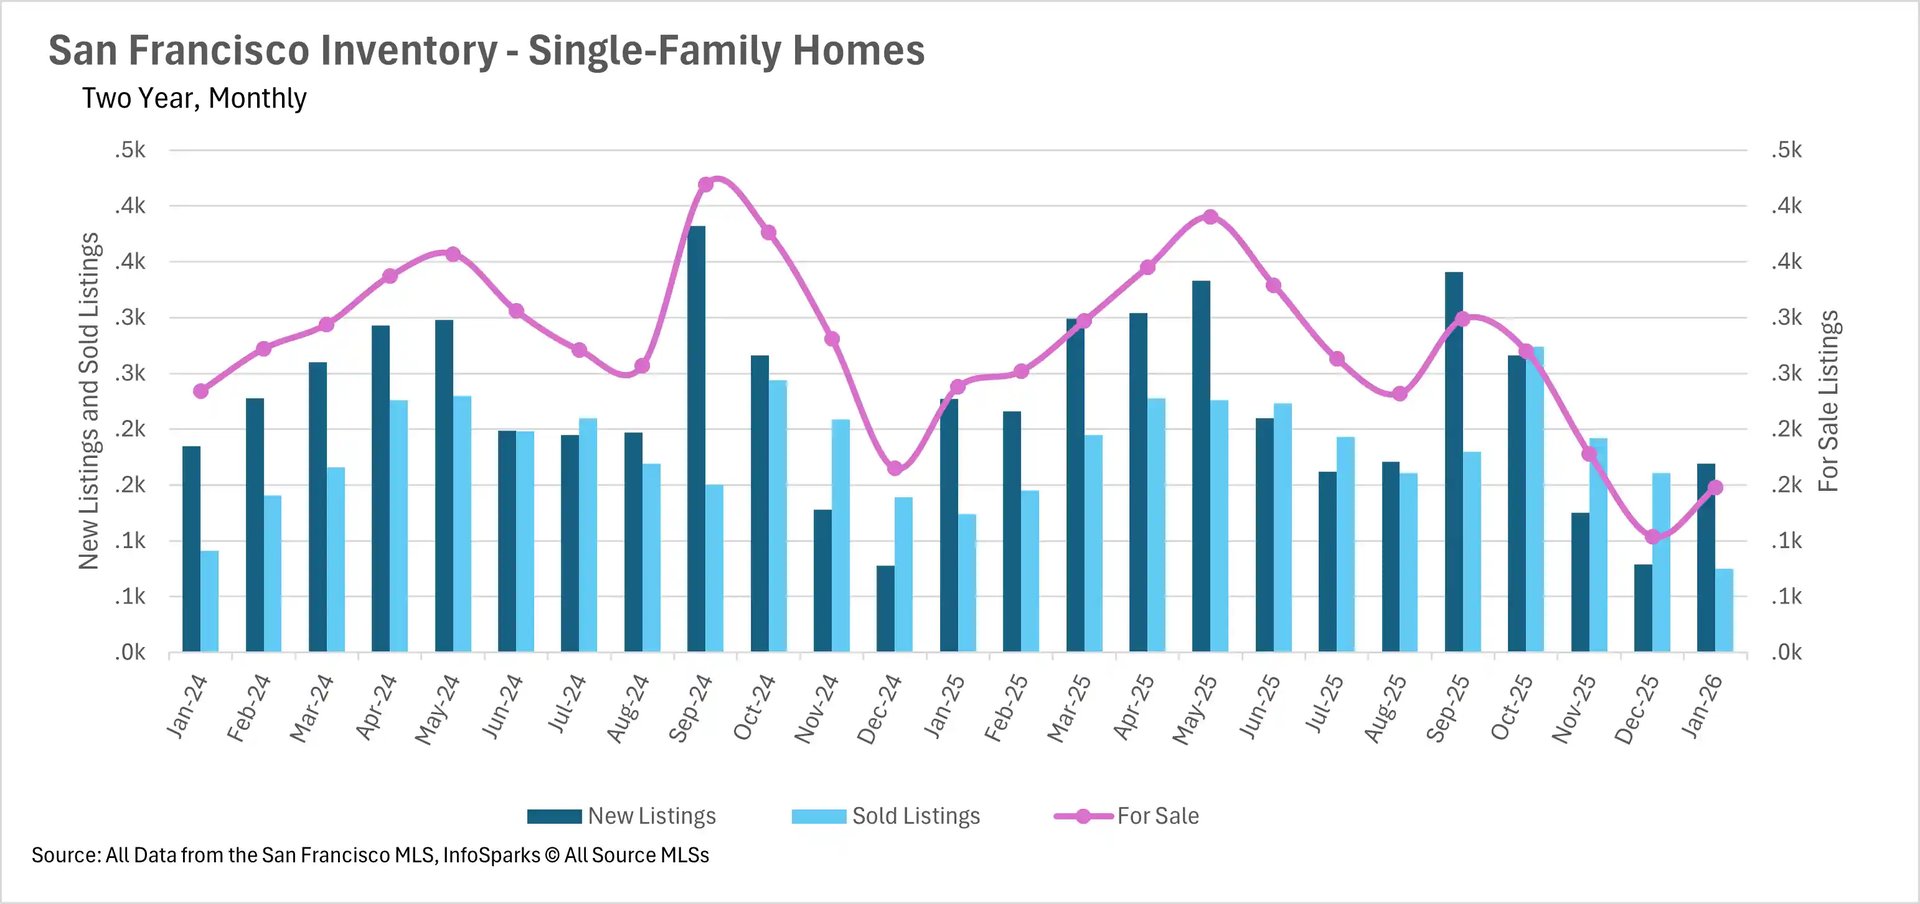
Inventory remains at critically low levels across San Francisco

The inventory shortage that defined the end of 2025 has carried over into the new year. There are currently just 148 single-family homes for sale in San Francisco, representing a 37.82% decline compared to January 2025. The condo market is facing similar constraints, with inventory down 36.94% year-over-year to just 338 units. Combined, there are fewer than 500 homes available for sale in the entire city. While new listings did pick up from December's lows, the market remains starved for inventory, and buyers continue to face an extremely limited selection of properties.

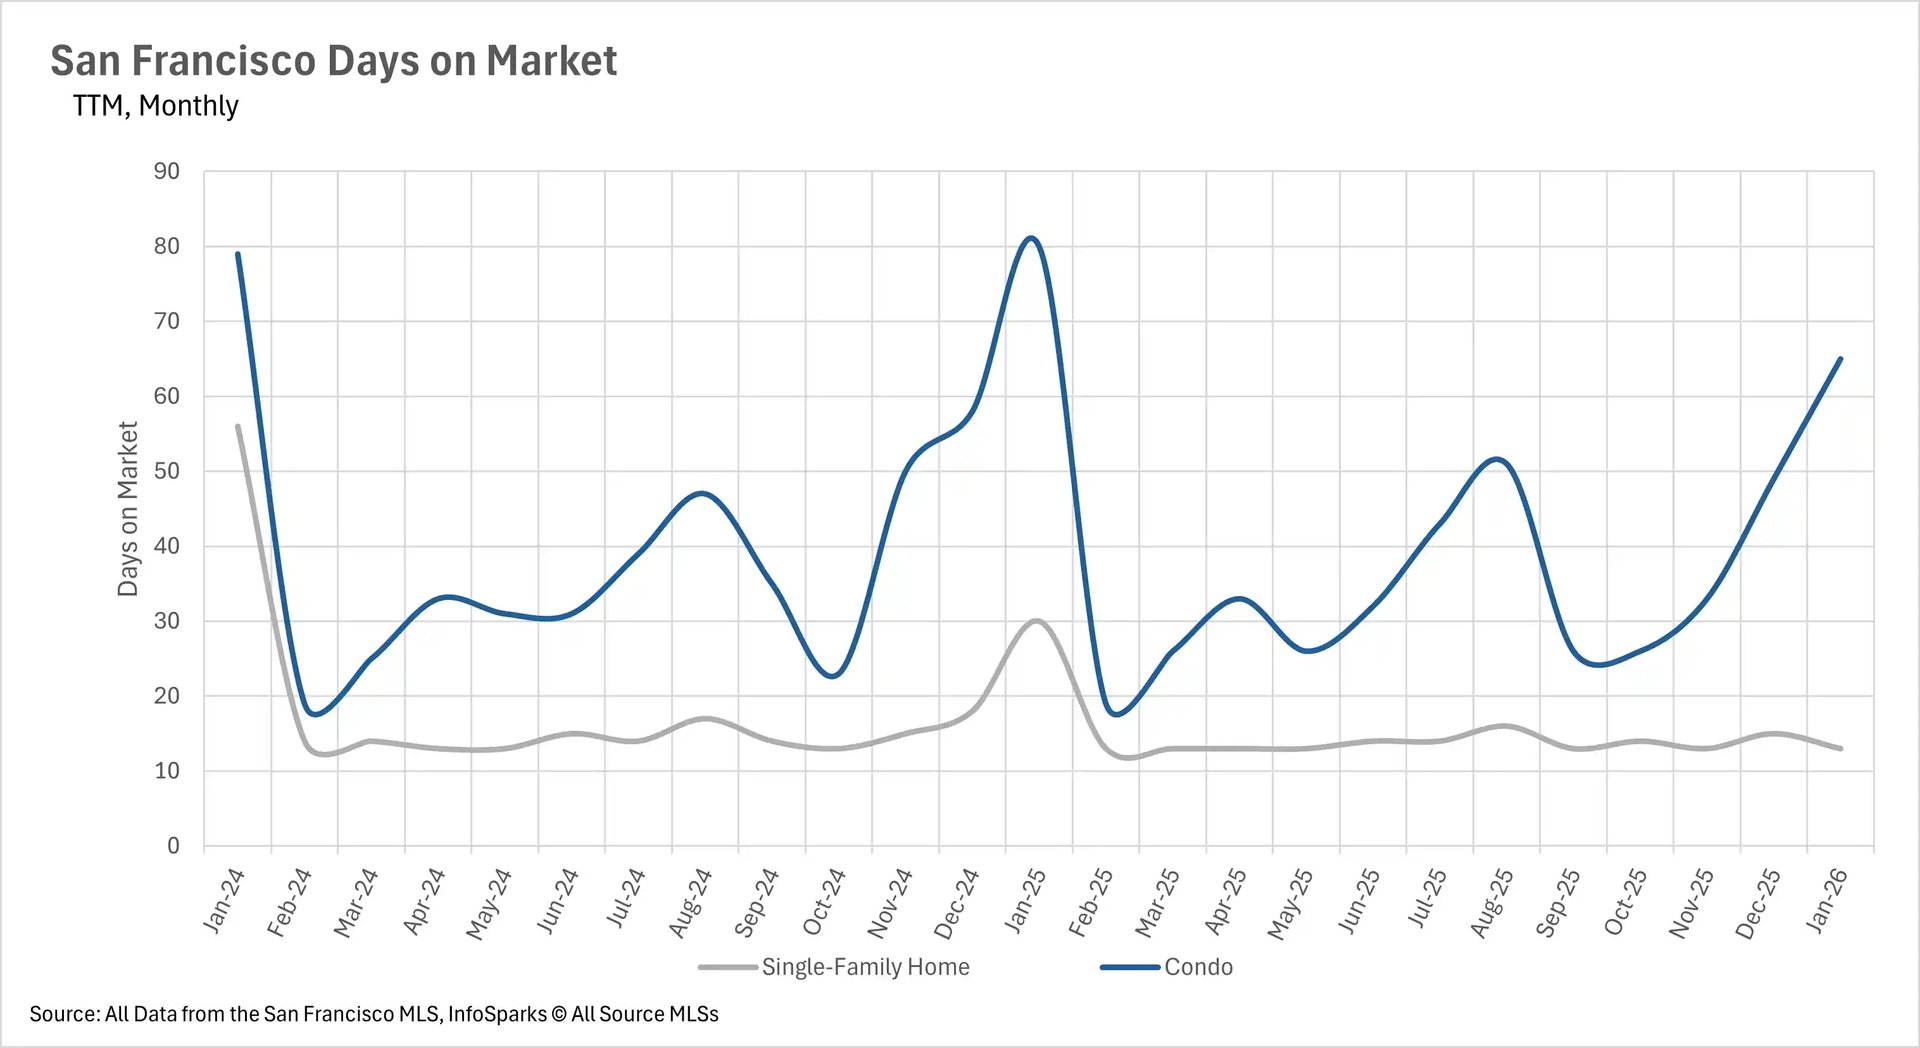
Single-family homes are selling at a blistering pace

The severe inventory shortage has created an incredibly fast-moving market, particularly for single-family homes. The average single-family home is selling in just 13 days, representing a 56.67% decrease compared to last January when homes sat on the market for 30 days. Condos are also moving more quickly, with the average condo selling in 65 days, an 18.75% year-over-year decline. For single-family home buyers, this means there is virtually no time to deliberate before making an offer, and competition for desirable properties remains fierce.

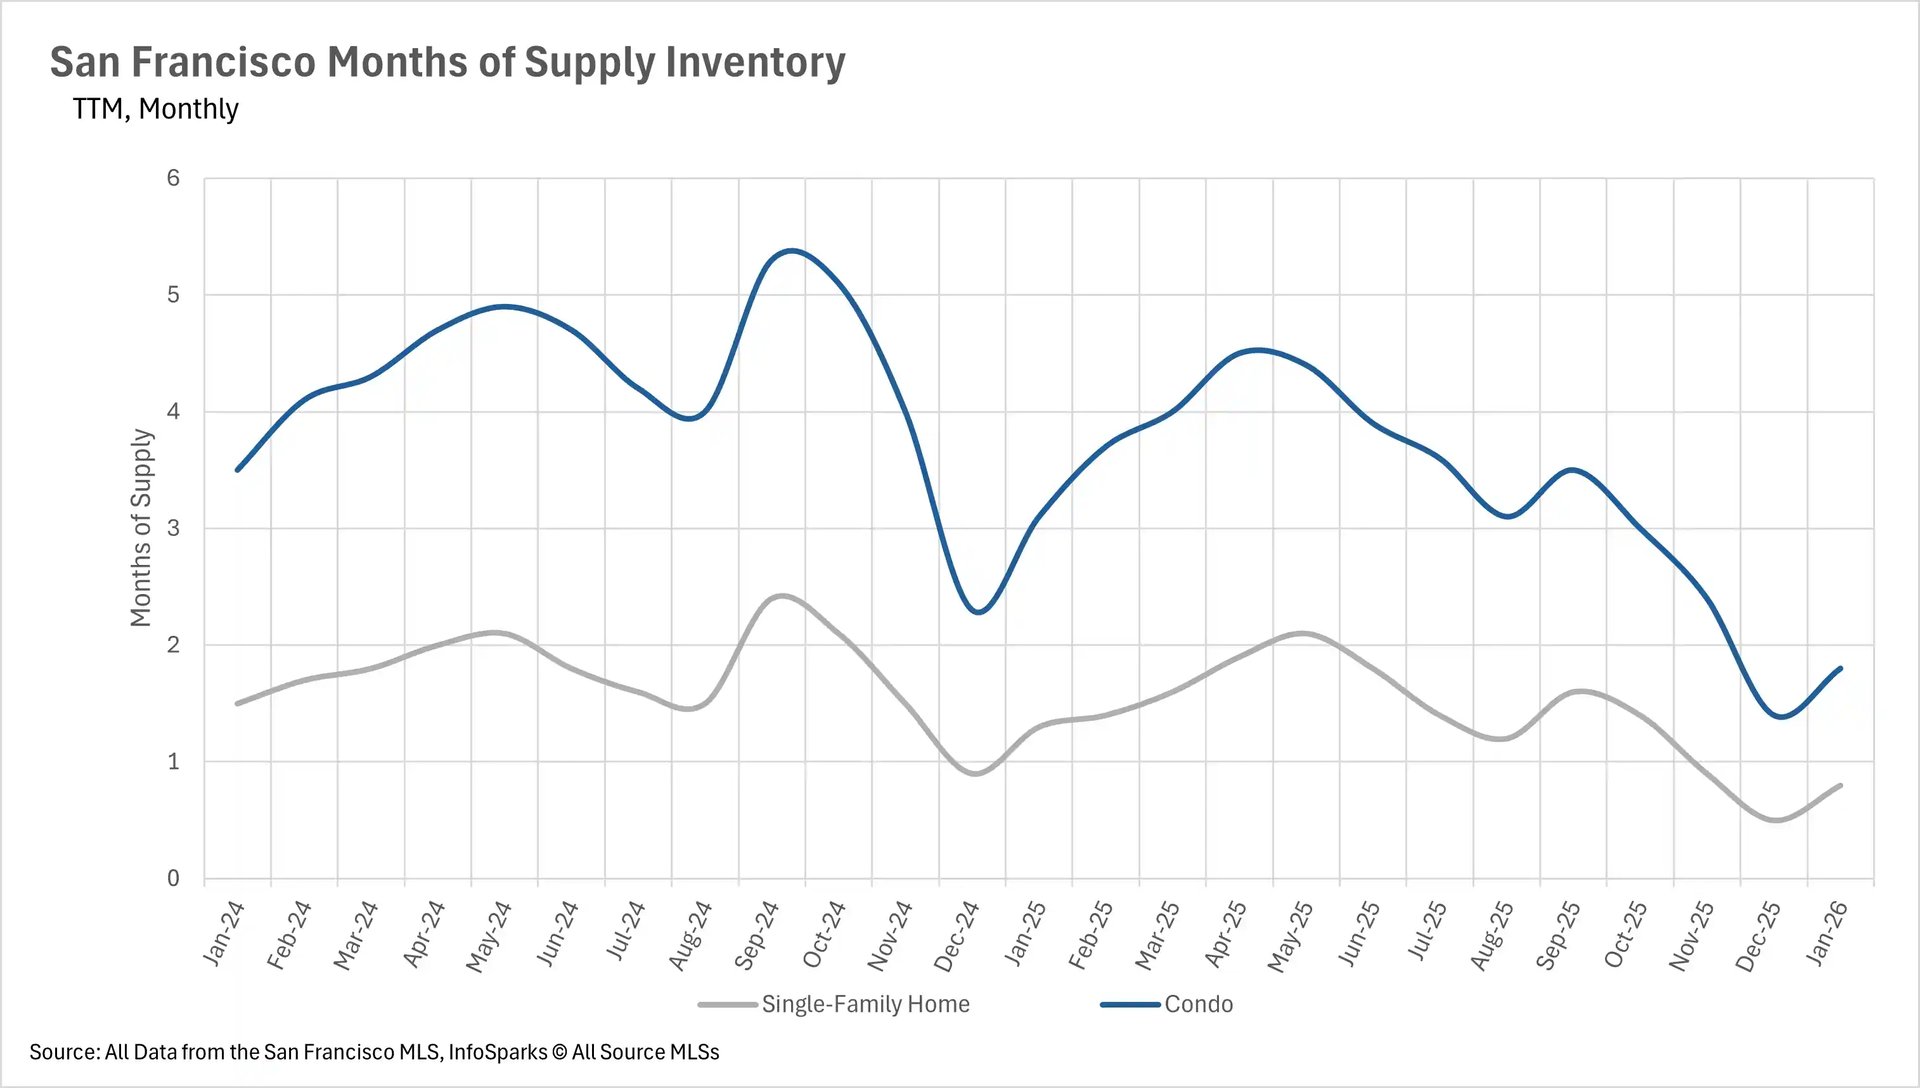
San Francisco remains firmly entrenched in seller's market territory

When determining whether a market is a buyers' market or a sellers' market, we look to the Months of Supply Inventory (MSI) metric. The state of California has historically averaged around three months of MSI, so any area with at or around three months of MSI is considered a balanced market. Any market that has lower than three months of MSI is considered a seller's market, whereas markets with more than three months of MSI are considered buyers' markets.

With just 0.8 months of single-family home inventory and 1.8 months of condo inventory on the market, the entire San Francisco market remains a strong seller's market. Both property types are well below the three-month threshold, giving sellers significant leverage in negotiations. Until substantial new inventory enters the market, buyers will continue to face stiff competition and limited options throughout San Francisco.

Local Lowdown Data

Line chart titled San Francisco Median Prices, Three-Year Monthly showing median sale prices from January 2023 to January 2026 for single-family homes (gray line) and condos (blue line). Single-family home prices fluctuate between approximately $1.4M and $1.85M with seasonal peaks each spring, ending around $1.7M in January 2026. Condo prices remain relatively flat, ranging from roughly $1.0M to $1.3M throughout the period. Source: San Francisco MLS, InfoSparks.

Bar chart titled San Francisco Median Price Changes, TTM Year-Over-Year showing monthly year-over-year percentage changes from February 2025 to January 2026 for single-family homes (gray bars) and condos (blue bars). Single-family home prices show consistent positive gains ranging from roughly -1% to +16%, with the strongest gains in November and January 2026. Condo prices are more volatile, swinging from approximately -11% in February 2025 to +10% in June 2025, and ending at around +2.5% in January 2026. Source: San Francisco MLS, InfoSparks.

Line chart titled San Francisco Average % of Original Price, Three-Year Monthly showing the average sale price as a percentage of original list price from January 2023 to January 2026 for single-family homes (gray) and condos (blue). Single-family homes consistently sell above list price, rising from about 101% in early 2023 to approximately 115% by January 2026. Condos hover near or just below 100%, ranging between roughly 93% and 102% throughout the period. Source: San Francisco MLS, InfoSparks.

Combined bar and line chart titled San Francisco Inventory Condos, Two Year Monthly covering January 2024 through January 2026. Dark blue bars represent new listings, light blue bars show sold listings, and a pink line tracks total for-sale inventory on the right axis. New listings peak around September 2024 at roughly 455 and again in September 2025 near 425. For-sale inventory peaked around 875 to 900 in September through October 2024 and has since declined to approximately 325 by January 2026. Sold listings remain relatively stable between 90 and 220 per month. Source: San Francisco MLS, InfoSparks.

Combined bar and line chart titled San Francisco Inventory Single-Family Homes, Two Year Monthly covering January 2024 through January 2026. Dark blue bars represent new listings, light blue bars show sold listings, and a pink line tracks for-sale inventory on the right axis. New listings peak around September 2024 at approximately 350 and again in May through September 2025. For-sale inventory peaked near 450 in September 2024 and declined sharply to around 200 by January 2026. Sold listings range between roughly 75 and 265 per month. Source: San Francisco MLS, InfoSparks.

Line chart titled San Francisco Months of Supply Inventory, TTM Monthly from January 2024 to January 2026 for single-family homes (gray) and condos (blue). Condo supply peaked around 5.3 months in September through October 2024, dropped to about 2.3 months in January 2025, rose again to 4.5 months by April through May 2025, and declined sharply to approximately 1.8 months by January 2026. Single-family home supply remained much lower throughout, ranging from about 0.6 to 2.4 months, ending near 0.8 months in January 2026, firmly in seller's market territory. Source: San Francisco MLS, InfoSparks.

Line chart titled San Francisco Days on Market, TTM Monthly from January 2024 to January 2026 for single-family homes (gray) and condos (blue). Condos take significantly longer to sell, starting near 79 days in January 2024, dropping to around 18 days in February 2024, then rising to a peak of approximately 81 days in January 2025 before declining and rising again to roughly 65 days by January 2026. Single-family homes sell much faster, consistently averaging between 12 and 30 days throughout the entire period, ending around 13 days in January 2026. Source: San Francisco MLS, InfoSparks.

Let’s Talk

You’ve got questions and we can’t wait to answer them.

Follow Us on Instagram