Select a Market Report to Read:
Bay Area
East Bay
Silicon Valley
San Francisco
Welcome to the latest San Francisco Real Estate Market Report from Kinoko Real Estate! As your trusted local Real Estate experts in San Francisco, we're committed to providing you with the most accurate and insightful data to guide your home-buying or selling journey in this dynamic city.
The Local Lowdown
Quick Take:
- Median sale prices surged in Marin and Napa Counties, with single-family homes up 19.86% and 18.75% year-over-year, respectively, while Sonoma and Solano Counties saw slight declines.
- Inventory levels have collapsed across the North Bay, with single-family home inventory down 45.19% and condo inventory down 36.60% on a year-over-year basis.
- Listings are spending considerably more time on the market, with single-family homes in Sonoma County sitting 44.44% longer than they did last January.
Note: You can find the charts/graphs for the Local Lowdown at the end of this section.
*National Association of REALTORS® data is released two months behind, so we estimate the most recent month's data when possible and appropriate.
Marin and Napa lead a strong start to 2026
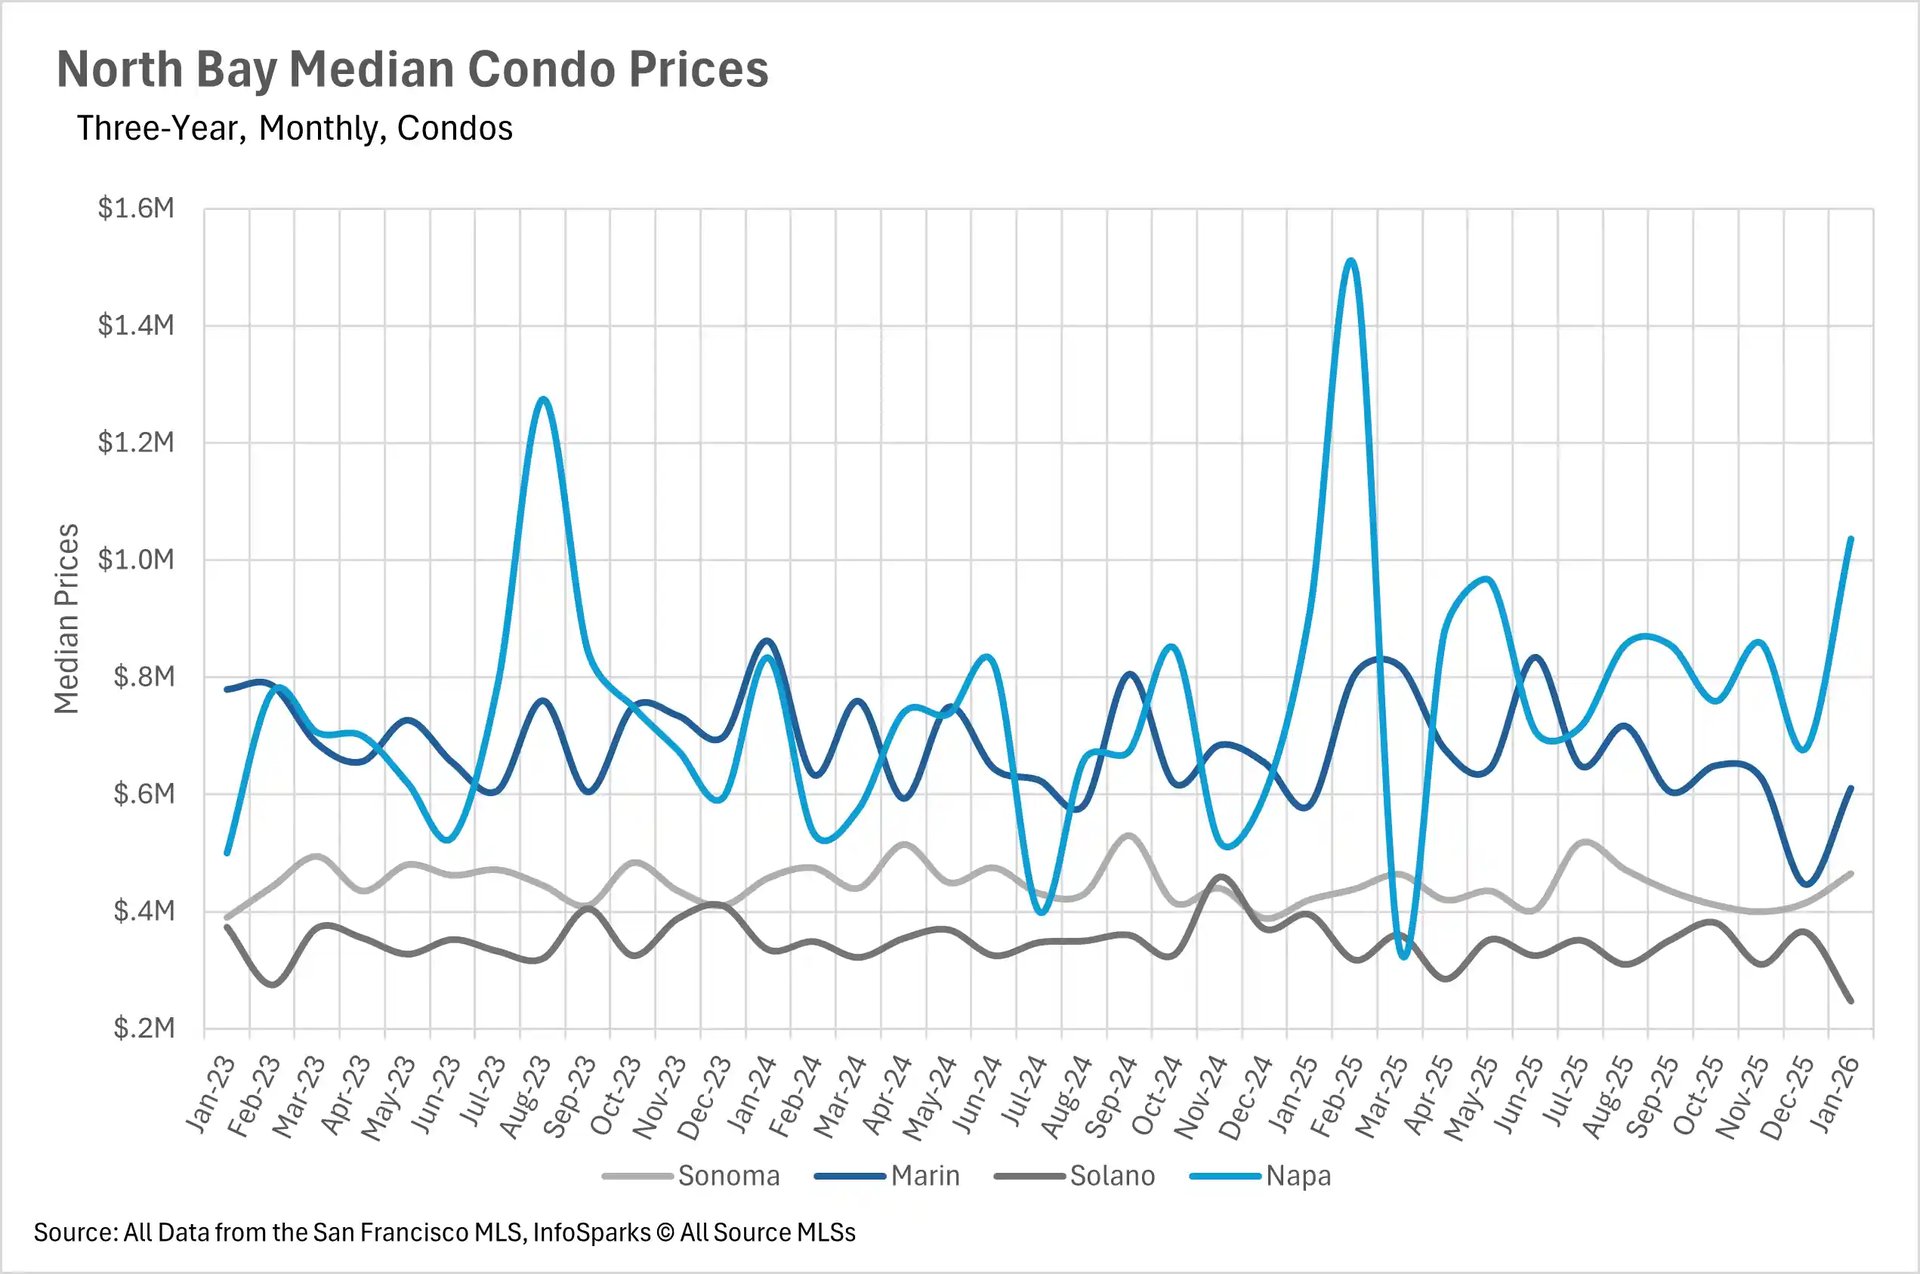
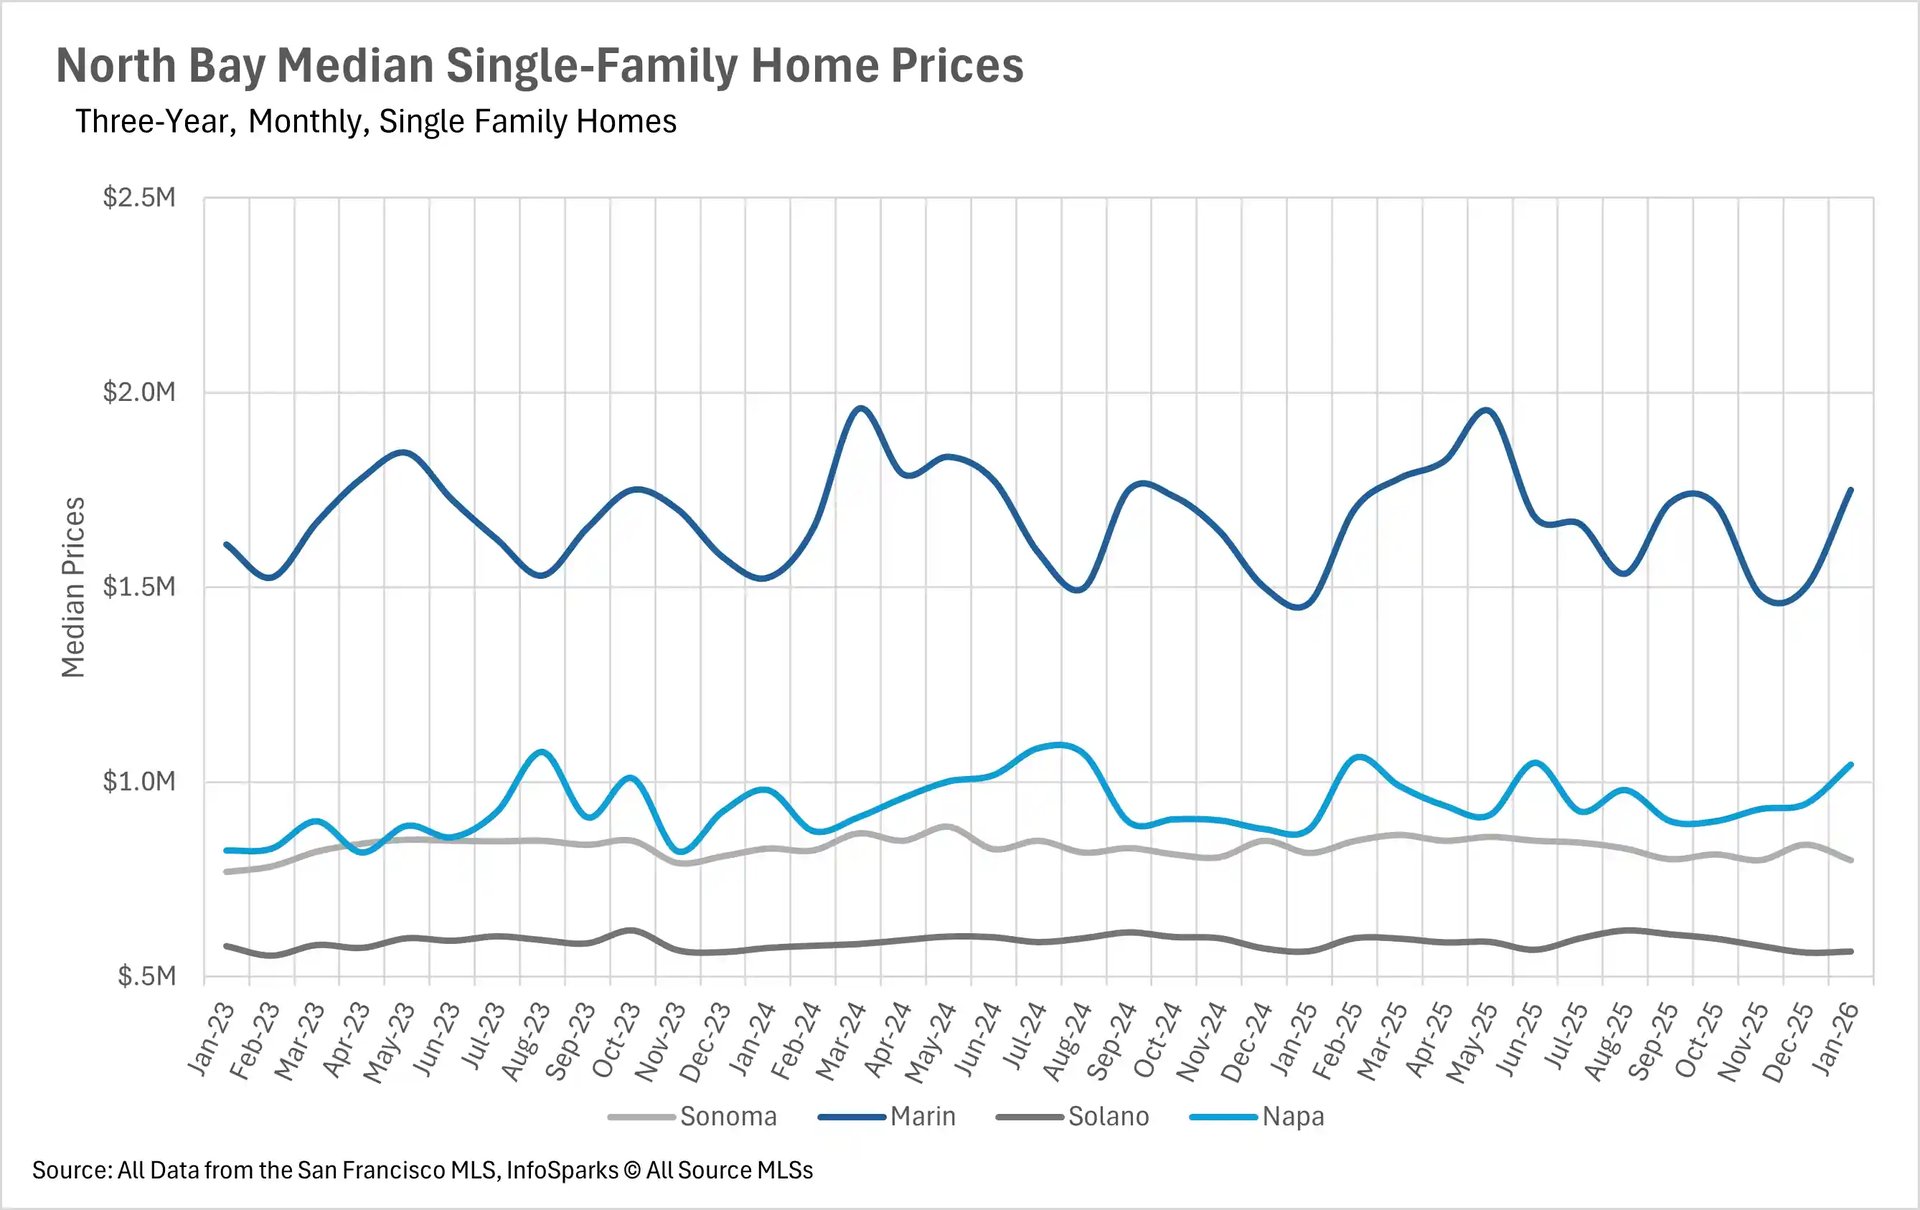
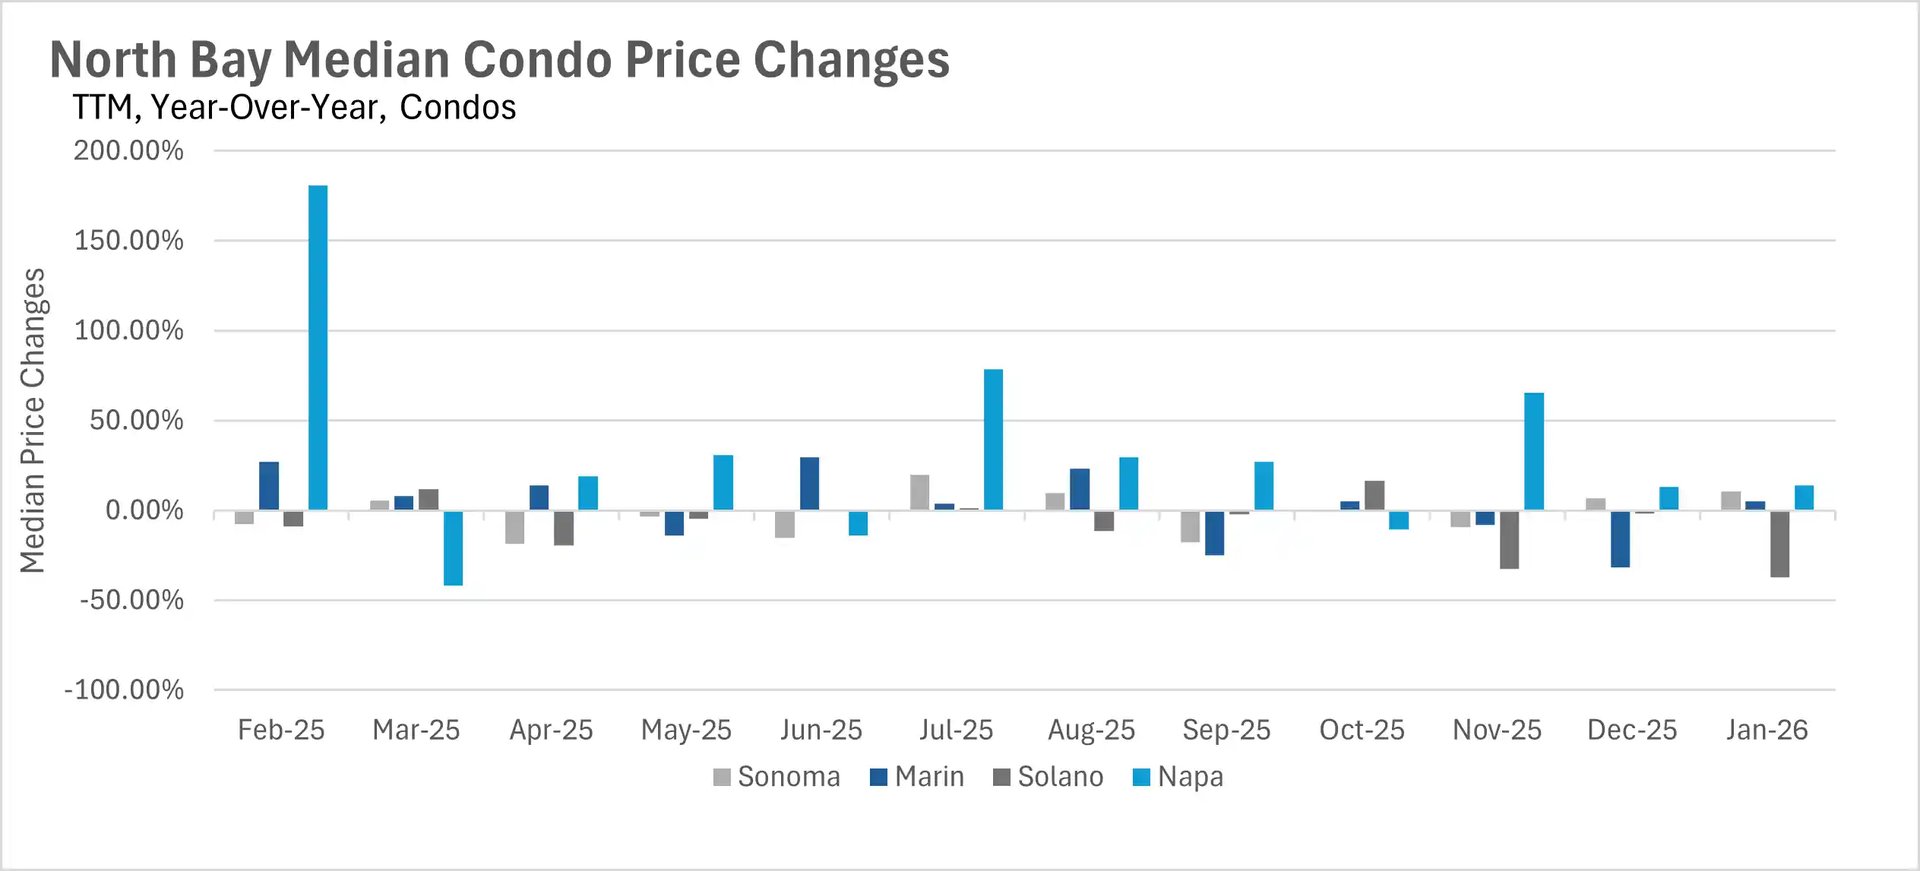
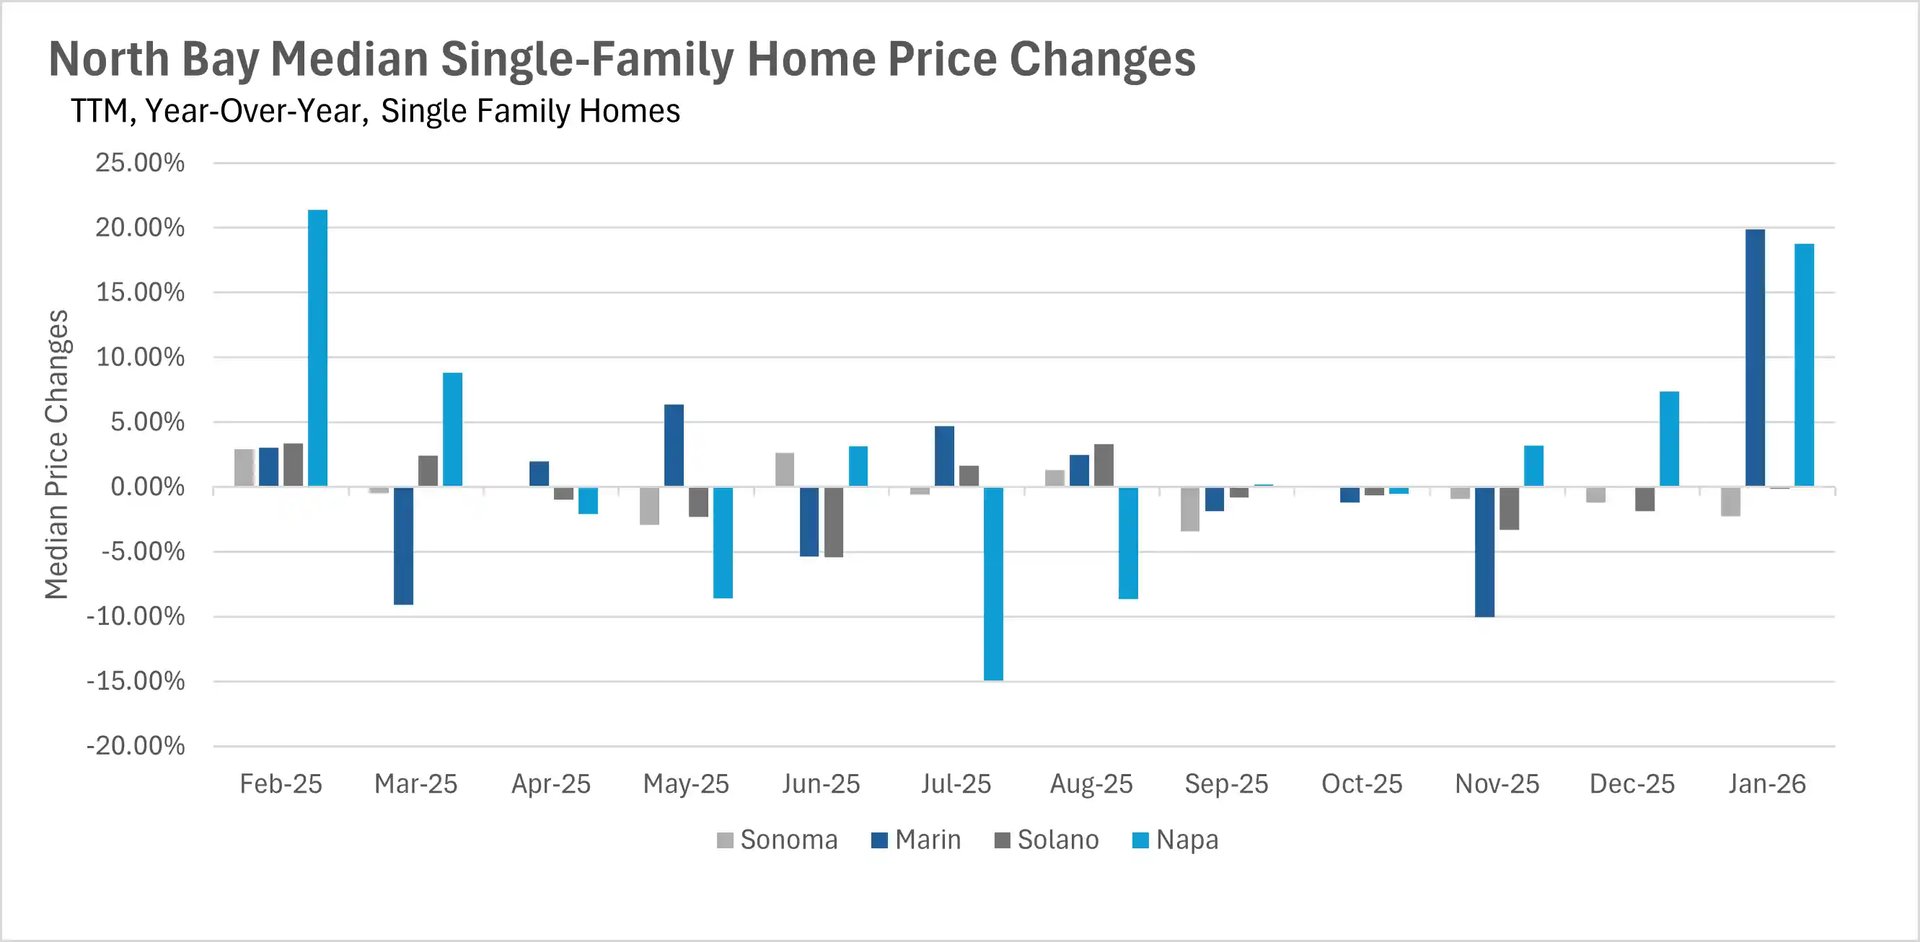
January brought some impressive gains to the North Bay's single-family home market, particularly in Marin and Napa Counties. The median single-family home in Marin County sold for $1,750,000, representing a remarkable 19.86% increase compared to January 2025. Napa County wasn't far behind, with the median single-family home selling for $1,045,000, an 18.75% year-over-year jump. However, not all counties shared in the gains. Sonoma County saw a 2.26% decline in median sale price, while Solano County was essentially flat with a 0.13% decrease. On the condo side, the story was mixed as usual. Sonoma County condos saw a healthy 10.71% year-over-year increase, and Napa County condos jumped 13.90%. Marin County condos also gained 4.98%. However, Solano County condos took a significant hit, declining 37.34% on a year-over-year basis.
Inventory has reached critically low levels
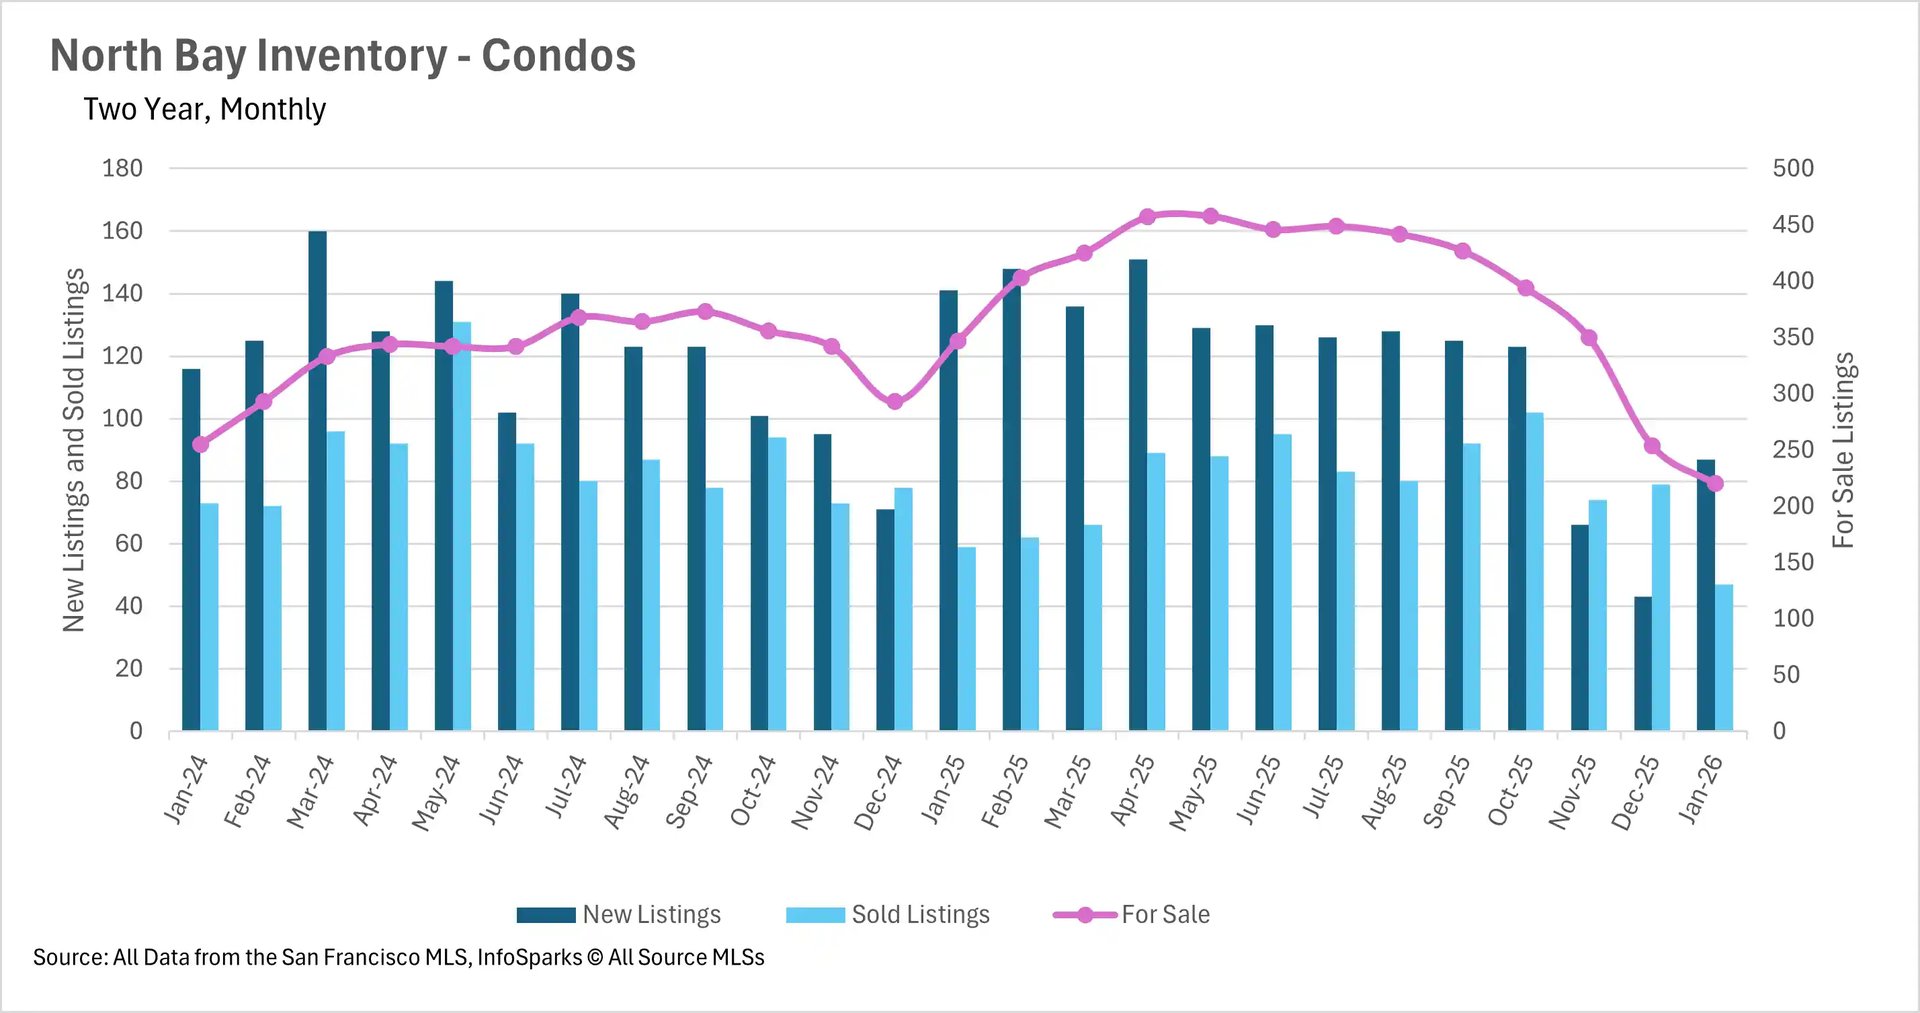
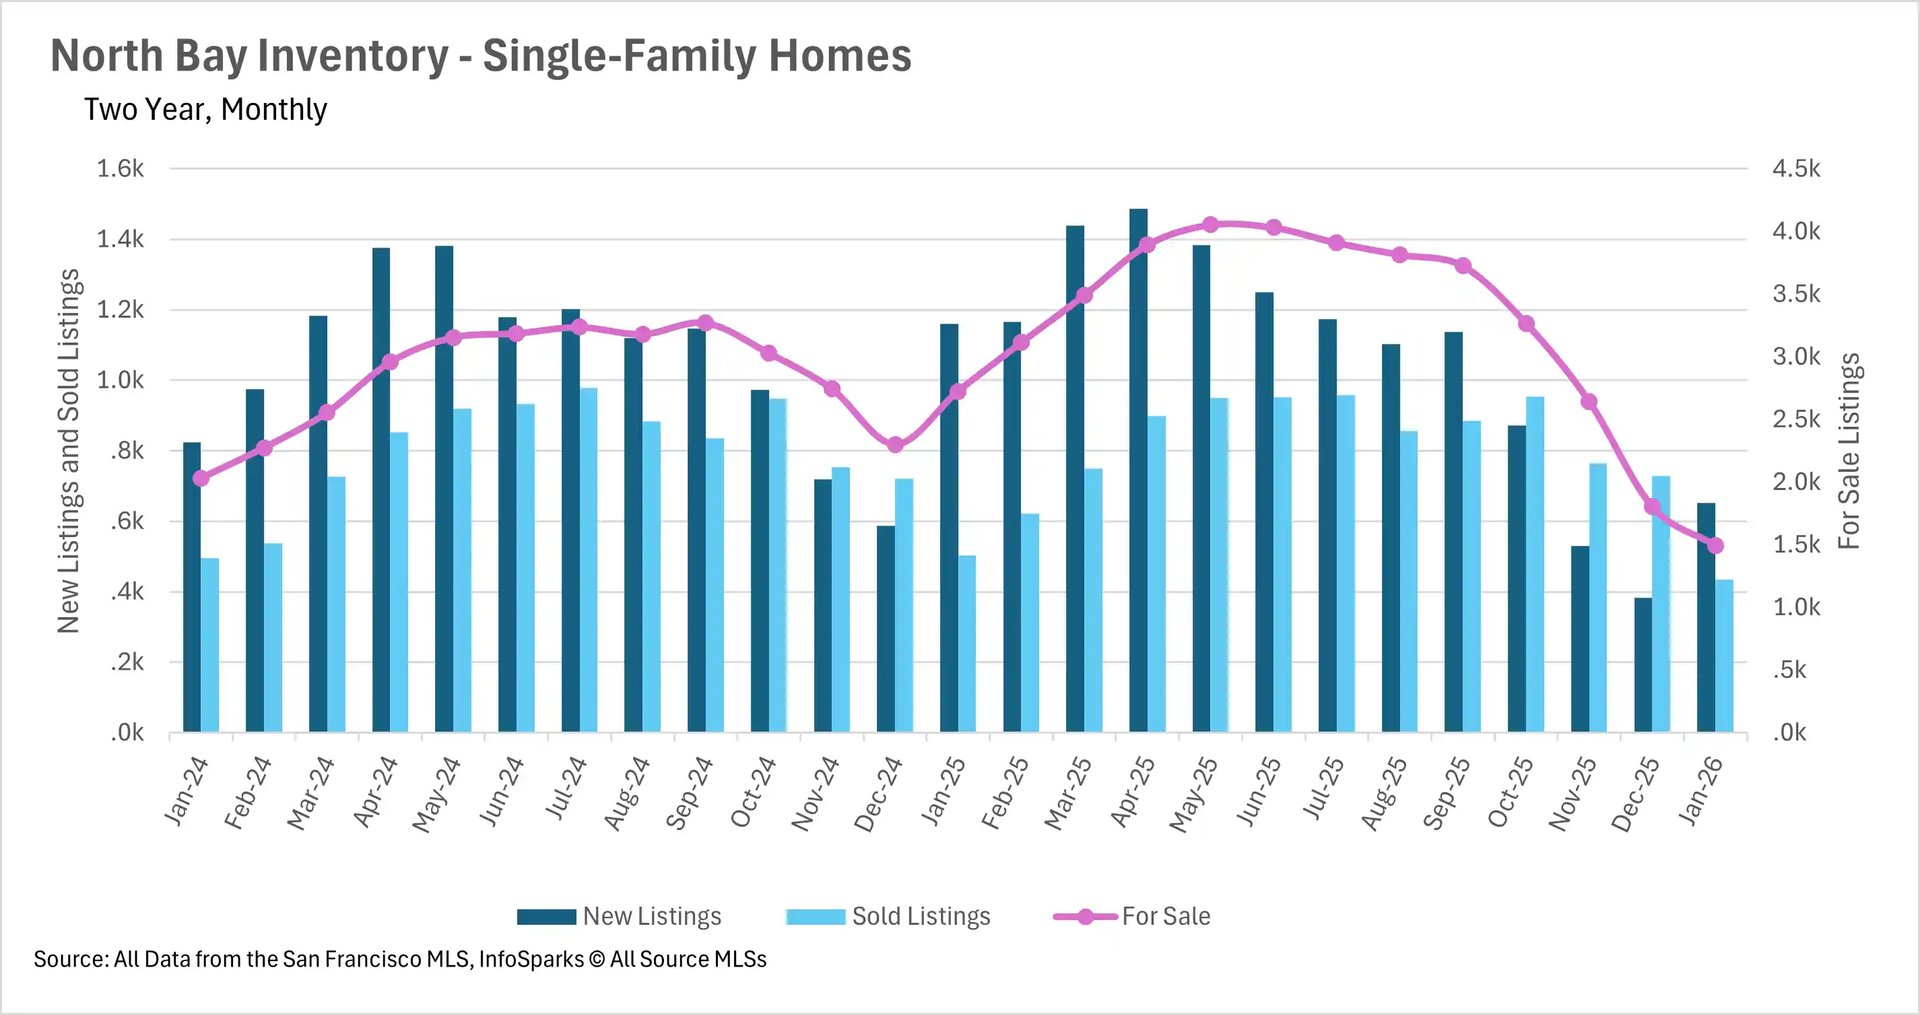
The inventory crunch that began late last year has intensified dramatically. Single-family home inventory across the North Bay now sits at just 1,494 units, down a staggering 45.19% compared to January 2025. The condo market has experienced a similar contraction, with inventory down 36.60% year-over-year to just 220 units. The good news is that new listings are starting to pick up after the holiday lull, with single-family new listings up 70.50% month-over-month and condo new listings up 102.33%. However, even with this uptick, new listings remain well below last year's levels, down 43.76% for single-family homes and 38.30% for condos on a year-over-year basis. Until sellers begin entering the market in greater numbers, buyers will continue to face stiff competition for a limited pool of properties.
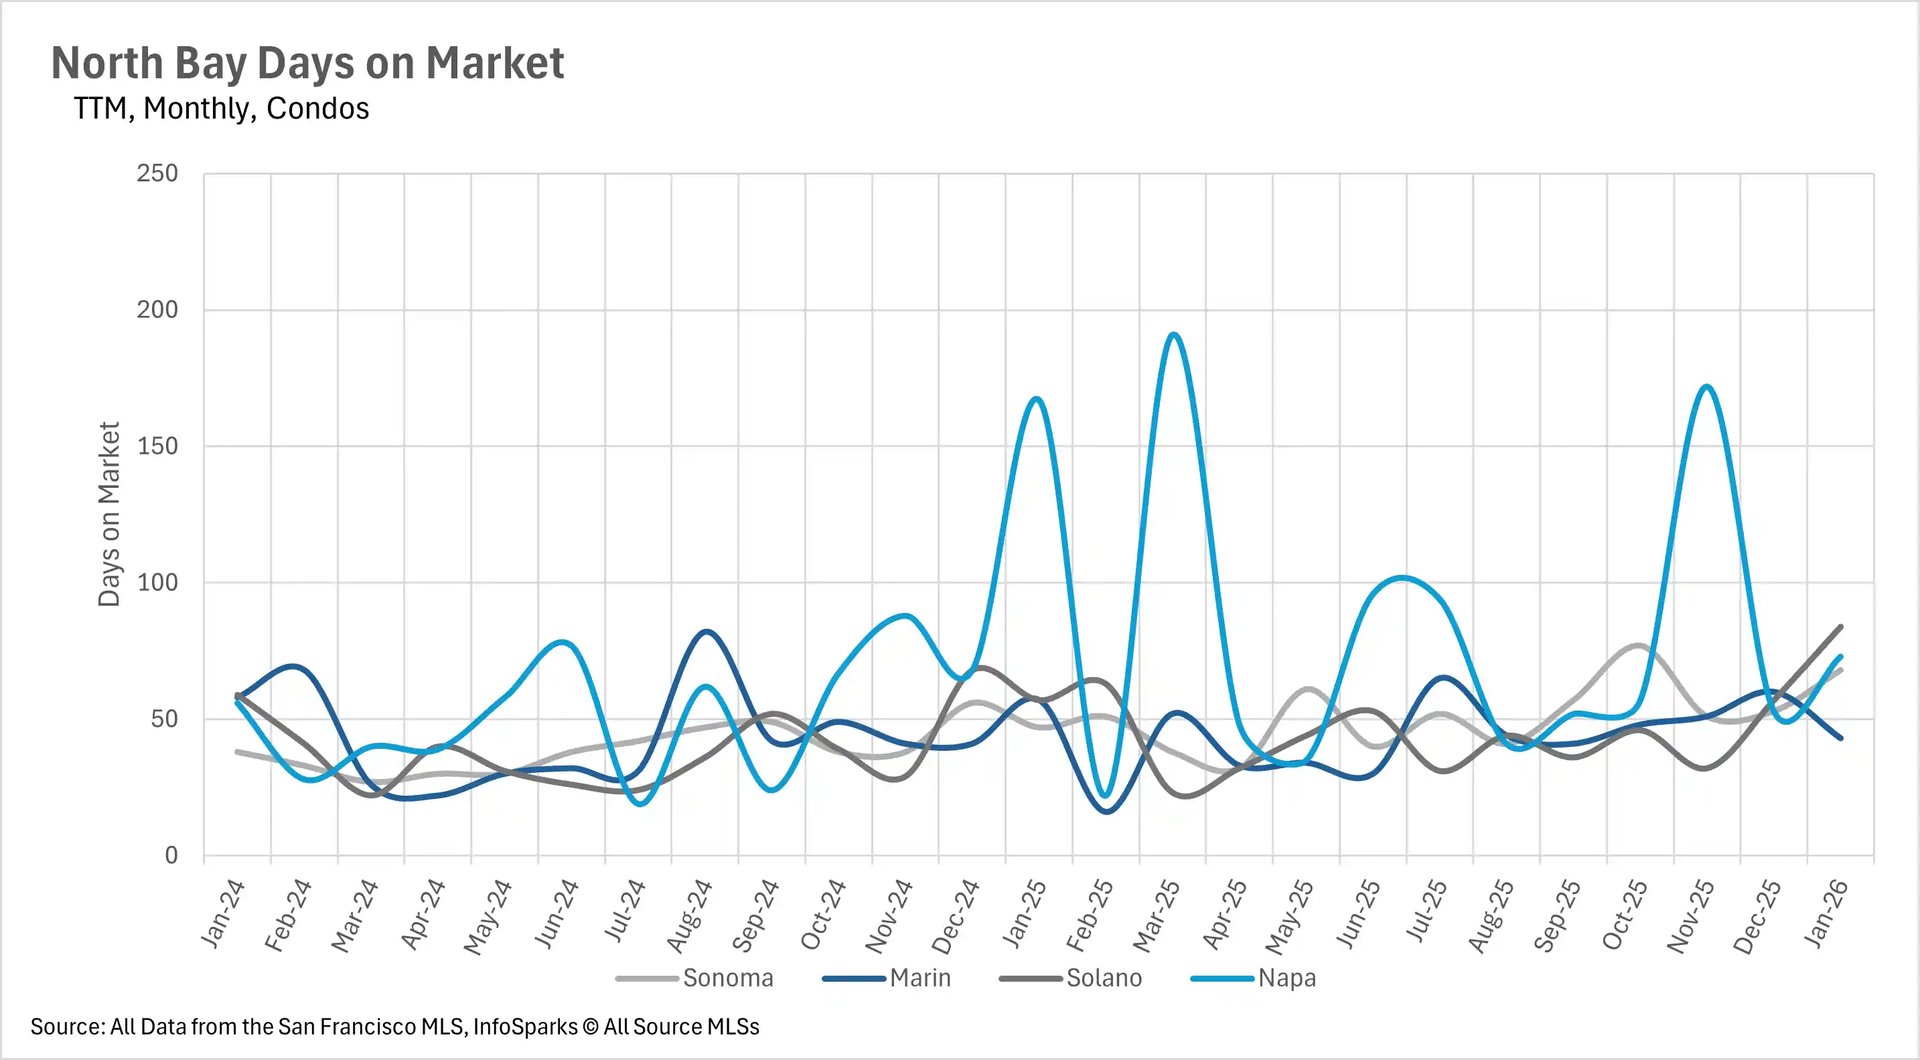
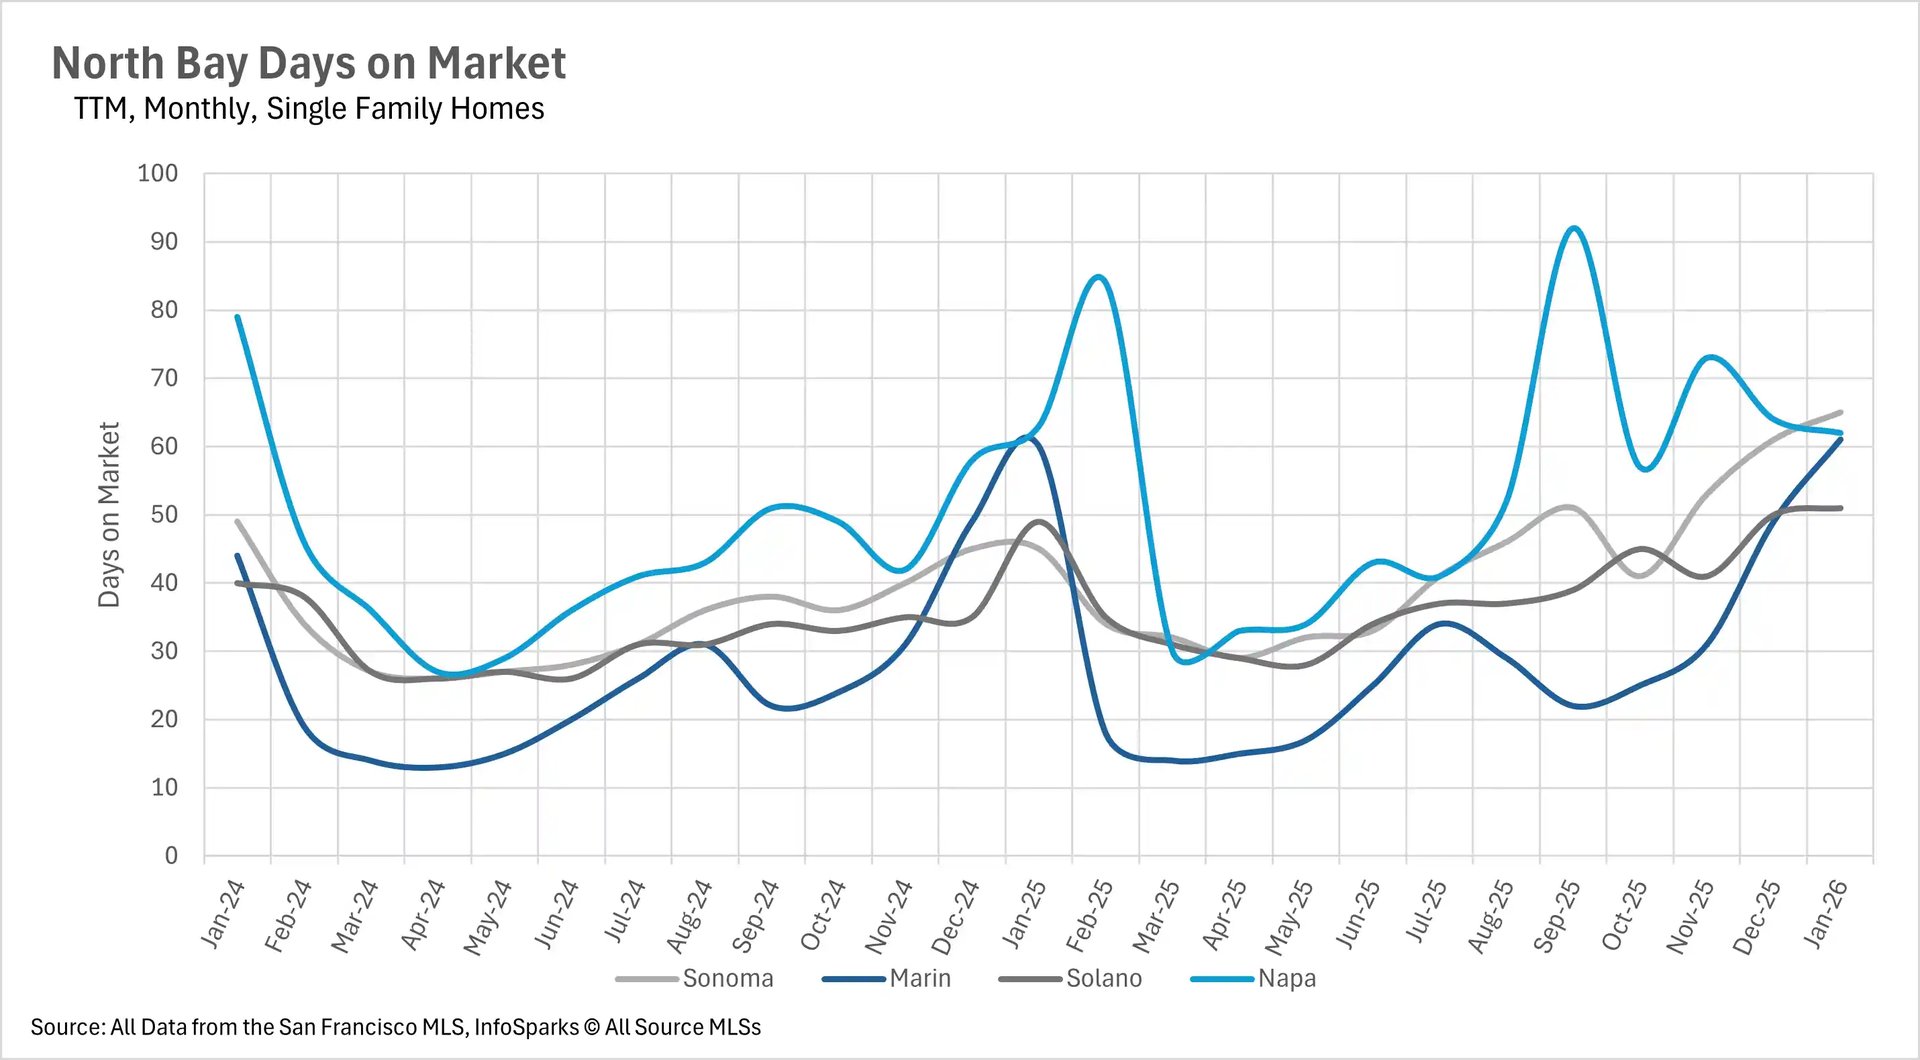
Patience is a virtue for today's buyers
Despite the inventory squeeze, buyers appear to be taking their time when making offers. The average single-family home in Sonoma County sat on the market for 65 days in January, representing a 44.44% increase compared to last year. Marin County single-family homes also spent more time on the market, averaging 61 days, though this was only a 1.67% year-over-year increase. Solano County saw a modest 4.08% increase to 51 days on market. Interestingly, Napa County bucked the trend, with the average single-family home selling slightly faster than last year, down 1.59% to 62 days. On the condo side, Sonoma County condos are spending 44.68% more time on the market, while Solano County condos are taking 47.37% longer to sell. However, Marin and Napa County condos are actually moving faster, with year-over-year decreases of 24.56% and 56.29%, respectively.
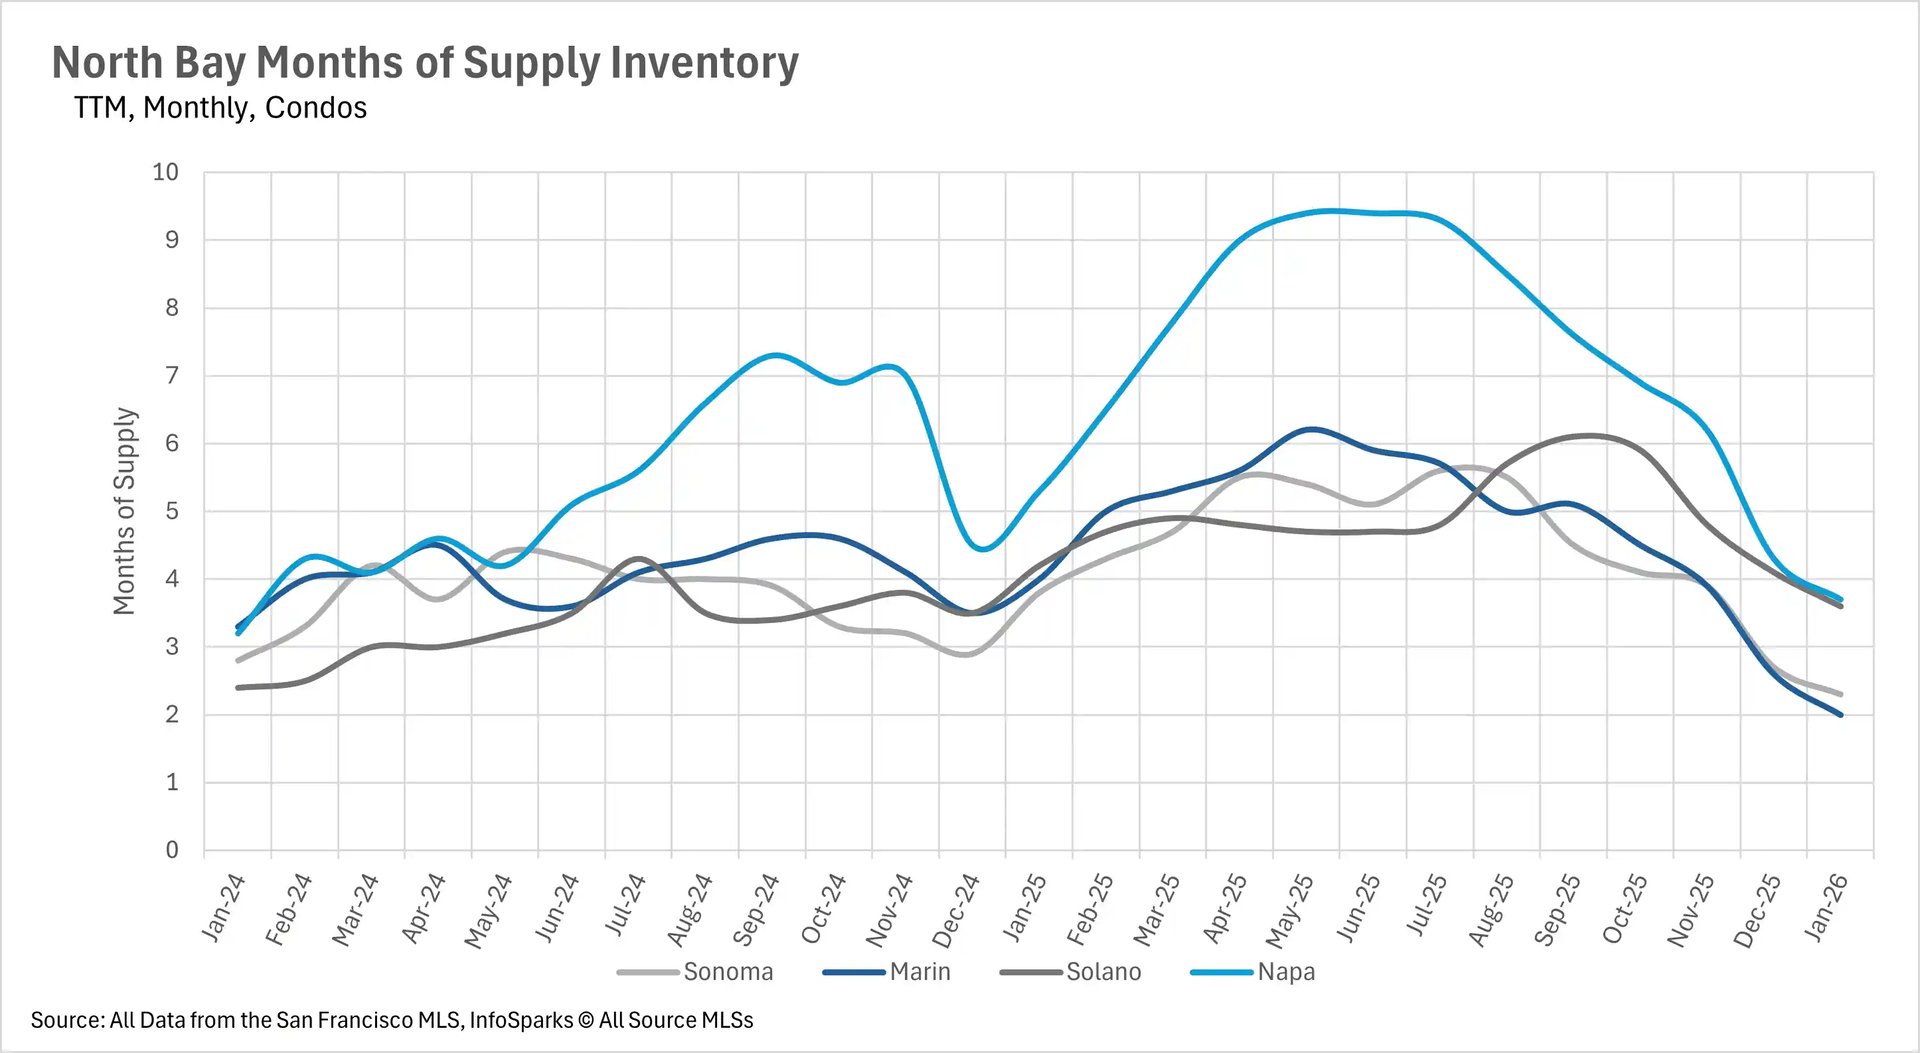
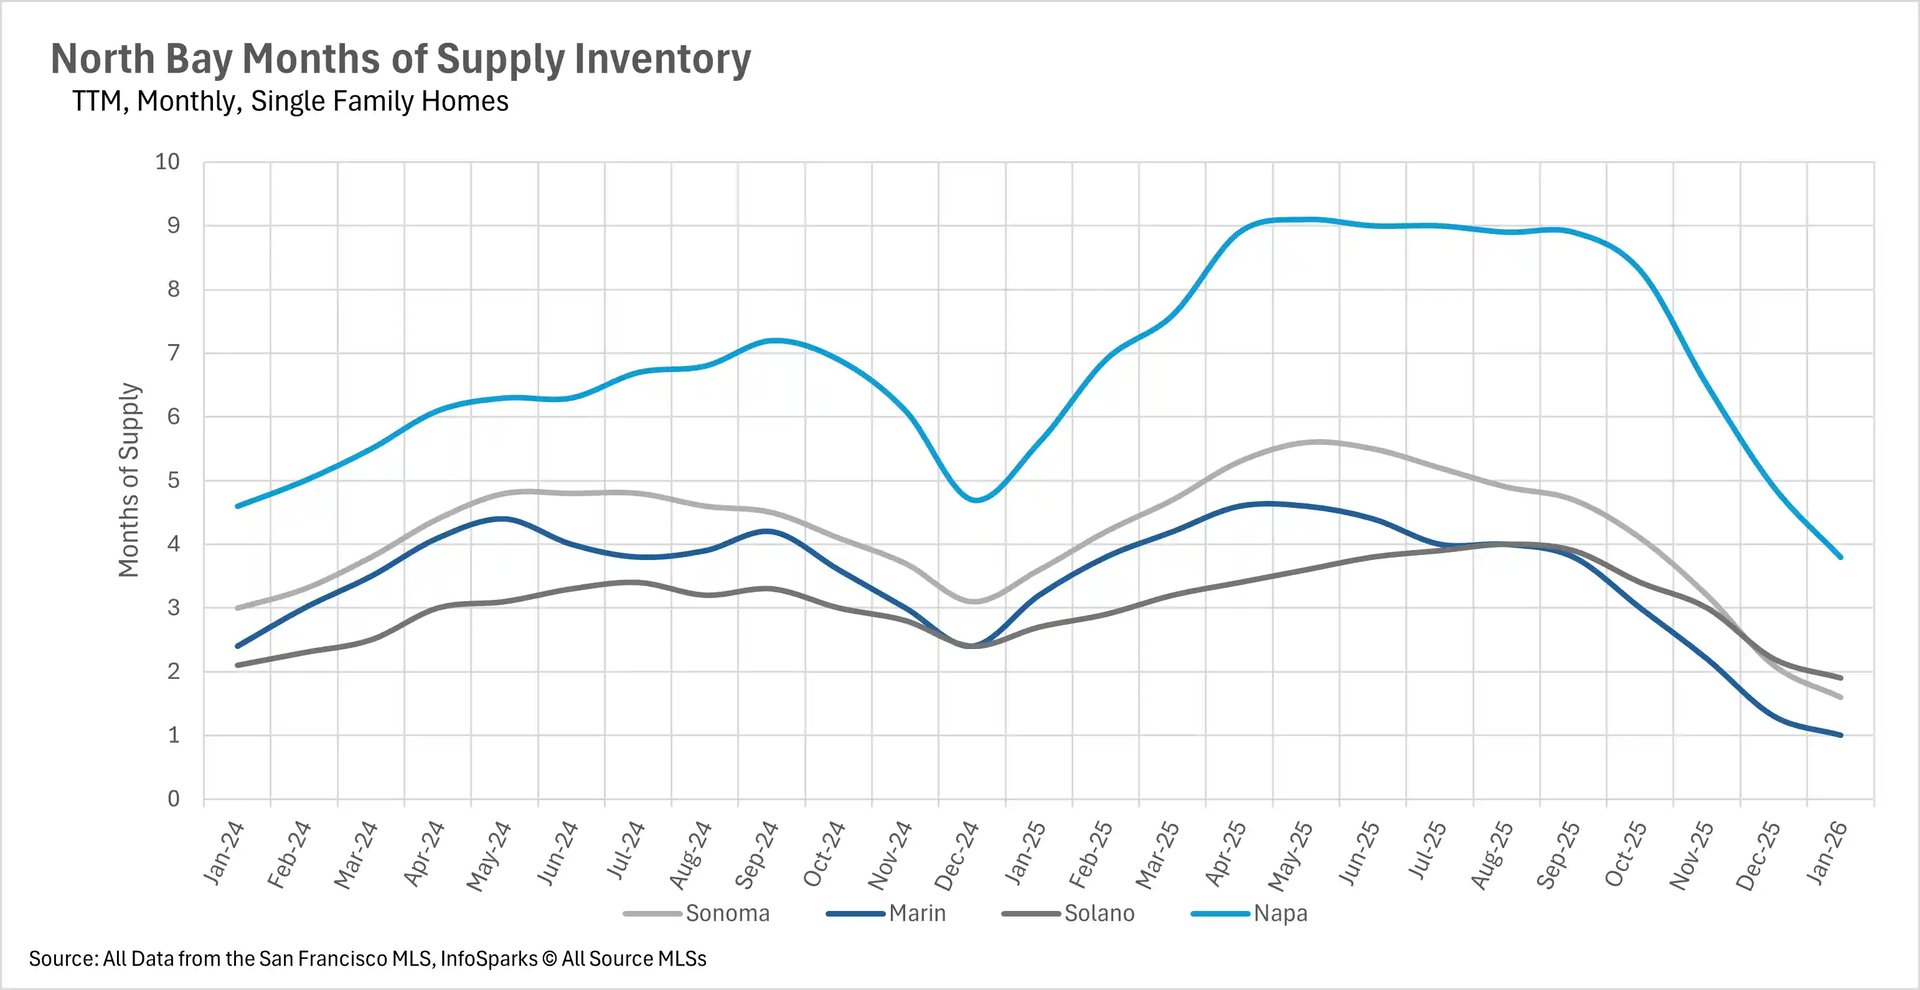
A dramatic shift into seller's market territory
When determining whether a market is a buyers' market or a sellers' market, we look to the Months of Supply Inventory (MSI) metric. The state of California has historically averaged around three months of MSI, so any area with at or around three months of MSI is considered a balanced market. Any market that has lower than three months of MSI is considered a seller's market, whereas markets with more than three months of MSI are considered buyers' markets.
January brought a dramatic shift toward seller's market conditions across nearly every segment of the North Bay. The single-family home market is now firmly in seller's territory across all four counties. Marin County leads the way with just 1 month of supply, down an incredible 68.75% year-over-year. Sonoma County has 1.6 months, Solano County has 1.9 months, and even Napa County, which had been a strong buyer's market throughout 2025, has dropped to just 3.8 months of supply. The condo market has also tightened considerably, with Marin County at 2 months of supply (down 50% year-over-year), Sonoma County at 2.3 months, Napa County at 3.7 months, and Solano County at 3.6 months. If you've been waiting to list your home, now may be an excellent time to take advantage of these favorable conditions before spring inventory arrives.