Select a Market Report to Read:
North Bay
East Bay
Silicon Valley
San Francisco
Welcome to the latest San Francisco Real Estate Market Report from Kinoko Real Estate! As your trusted local Real Estate experts in San Francisco, we're committed to providing you with the most accurate and insightful data to guide your home-buying or selling journey in this dynamic city.
The Local Lowdown
Quick Take:
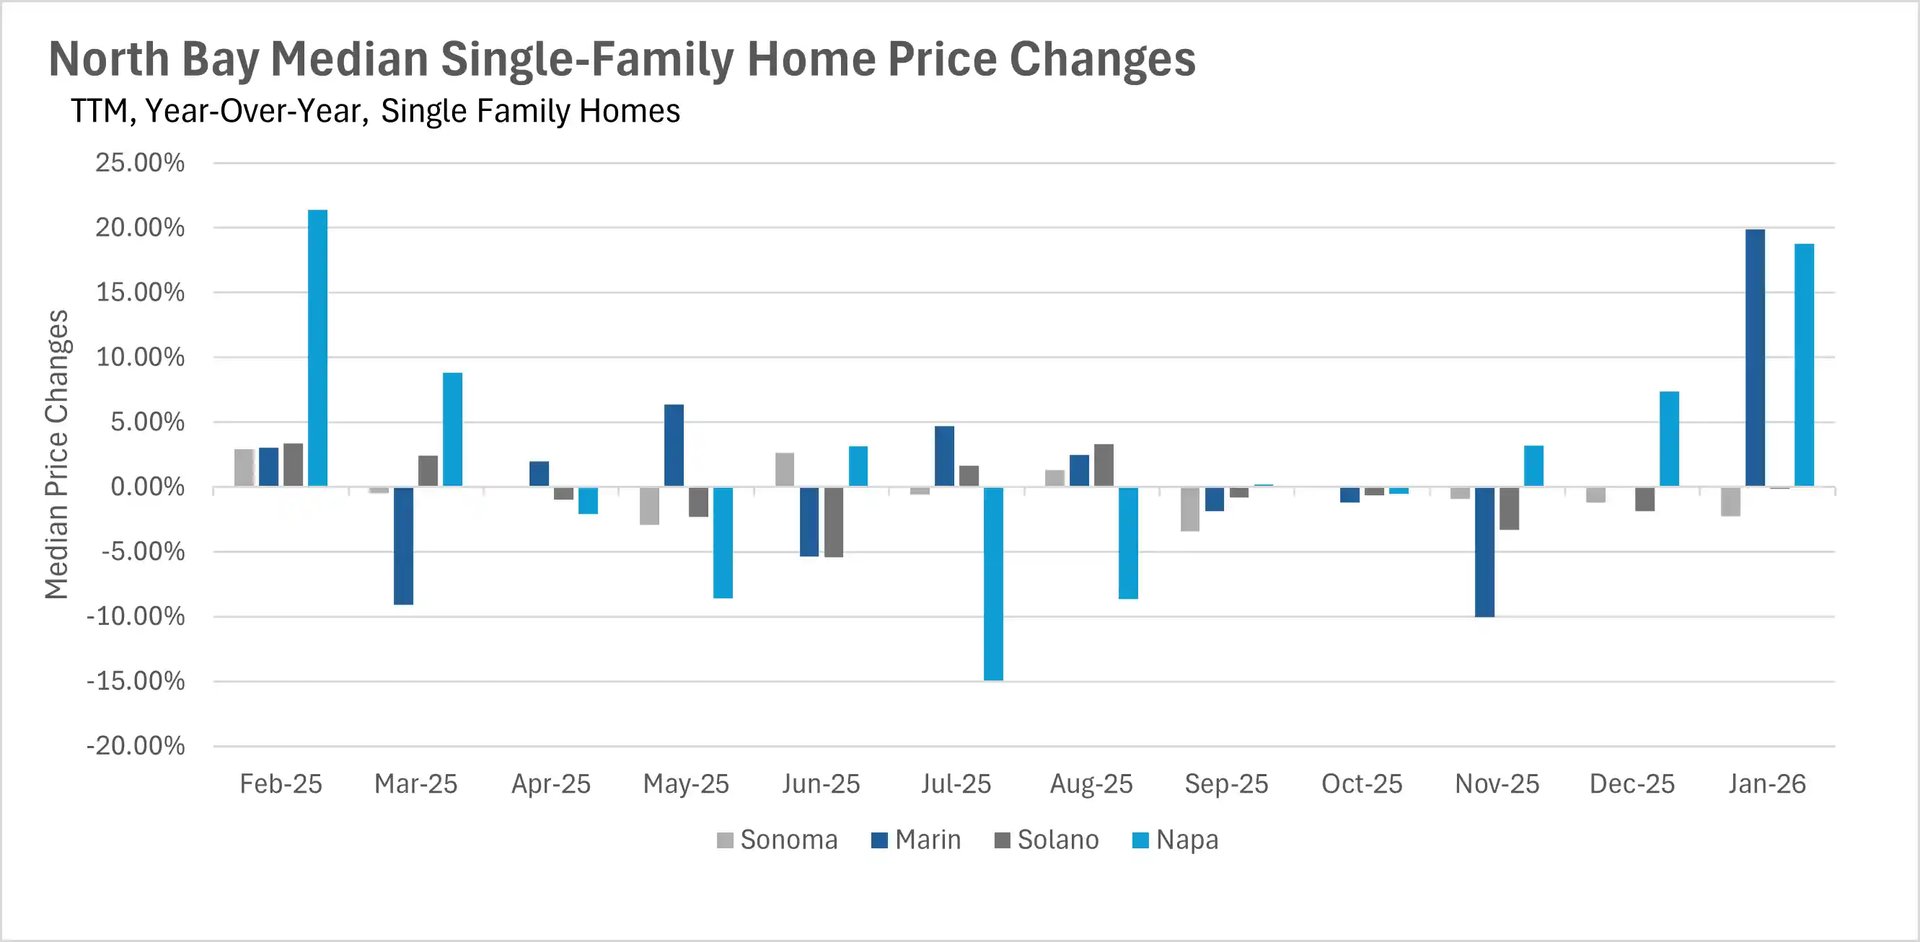
- Single-family home prices are surging in San Francisco and parts of the North Bay, with year-over-year gains exceeding 16% and 19% in San Francisco and Marin County, respectively, while other pockets of the region are seeing modest declines.
- Inventory levels have collapsed across the Bay Area, with single-family home inventory down by double digits in every submarket on a year-over-year basis.
- Condos continue to struggle with pricing and longer days on market, while single-family homes are flying off the shelves in many areas.
- Nearly every single-family home market in the Bay Area is firmly in seller's market territory, with several counties sitting at or below one month of supply.
Note: You can find the charts/graphs for the Local Lowdown at the end of this section.
*National Association of REALTORS® data is released two months behind, so we estimate the most recent month's data when possible and appropriate.
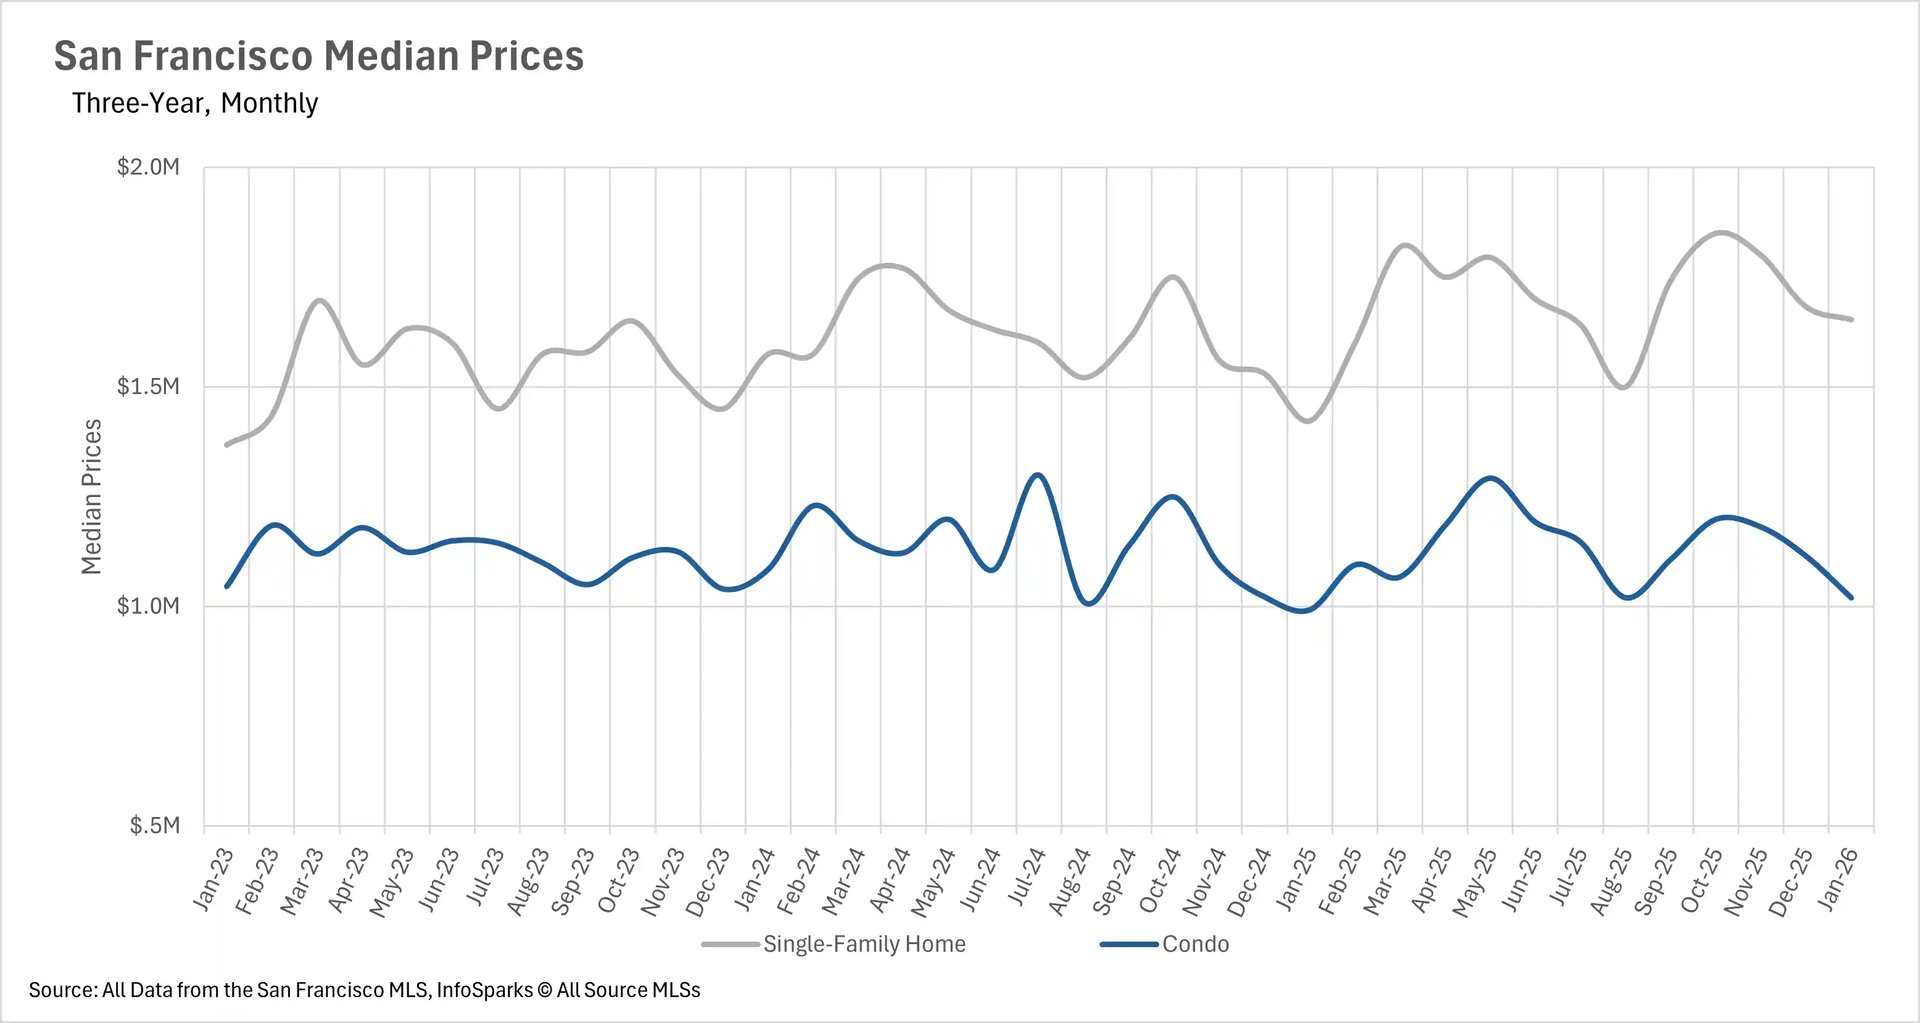
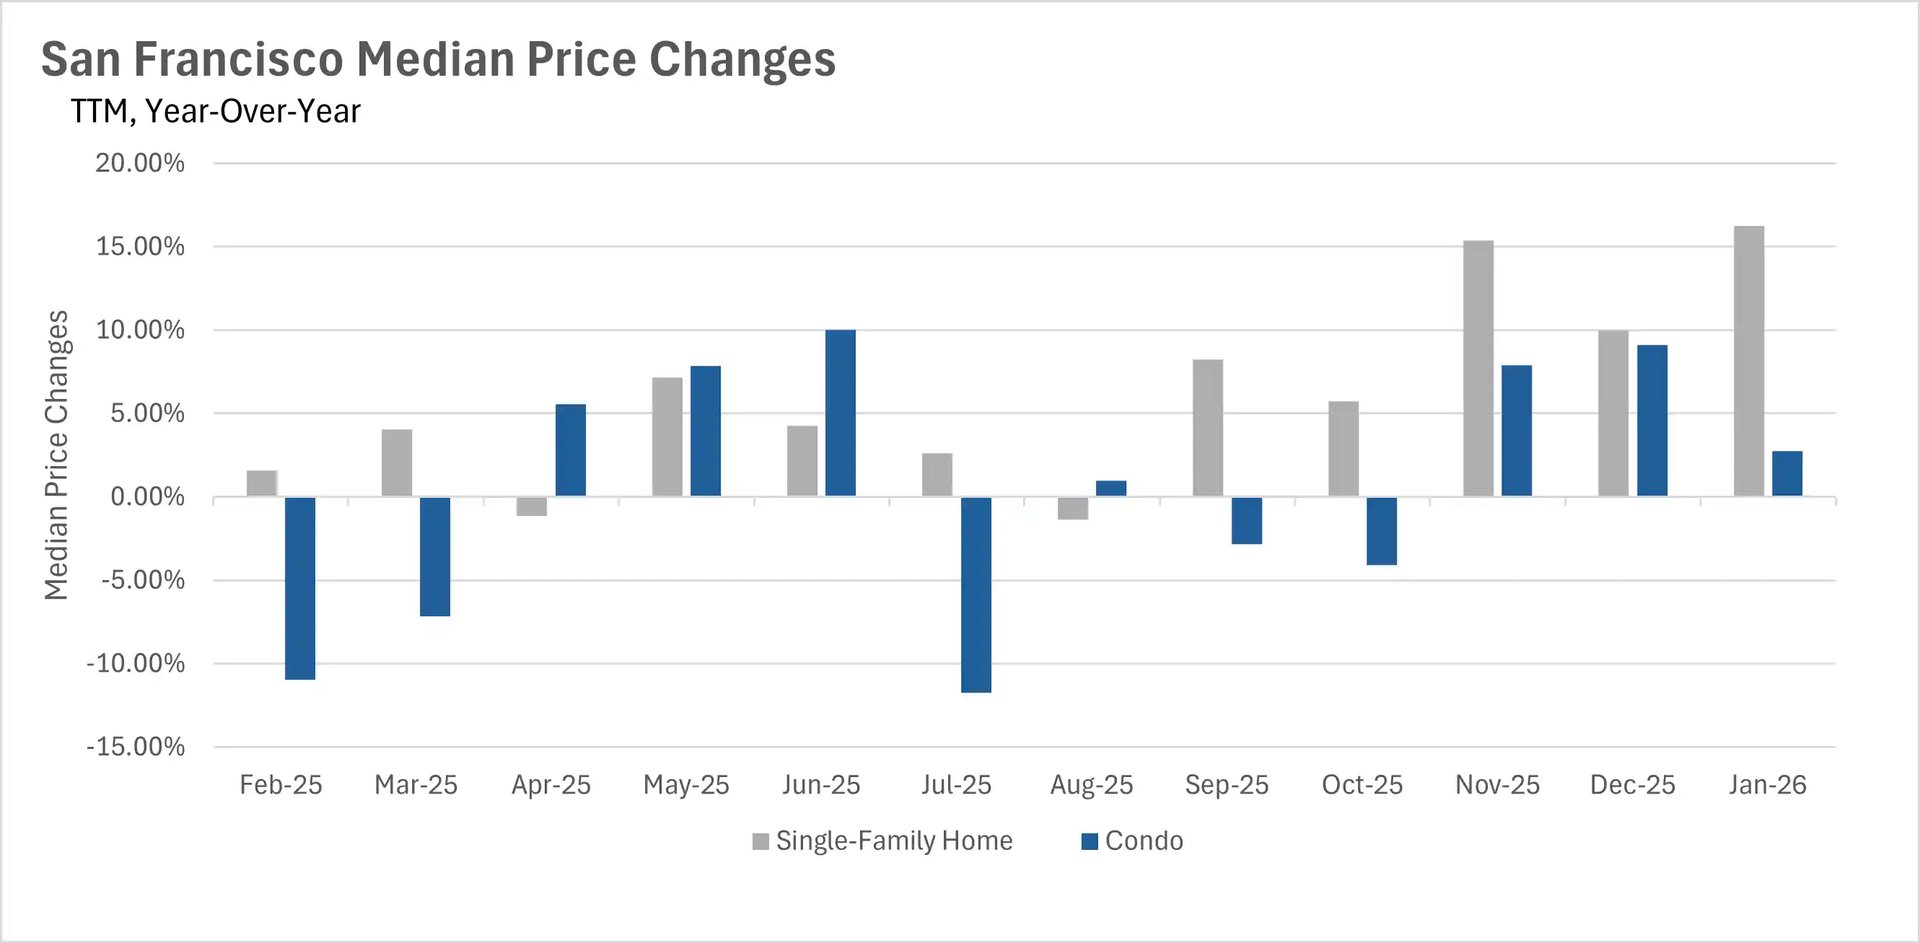
San Francisco and Marin County are leading an incredible surge in home prices
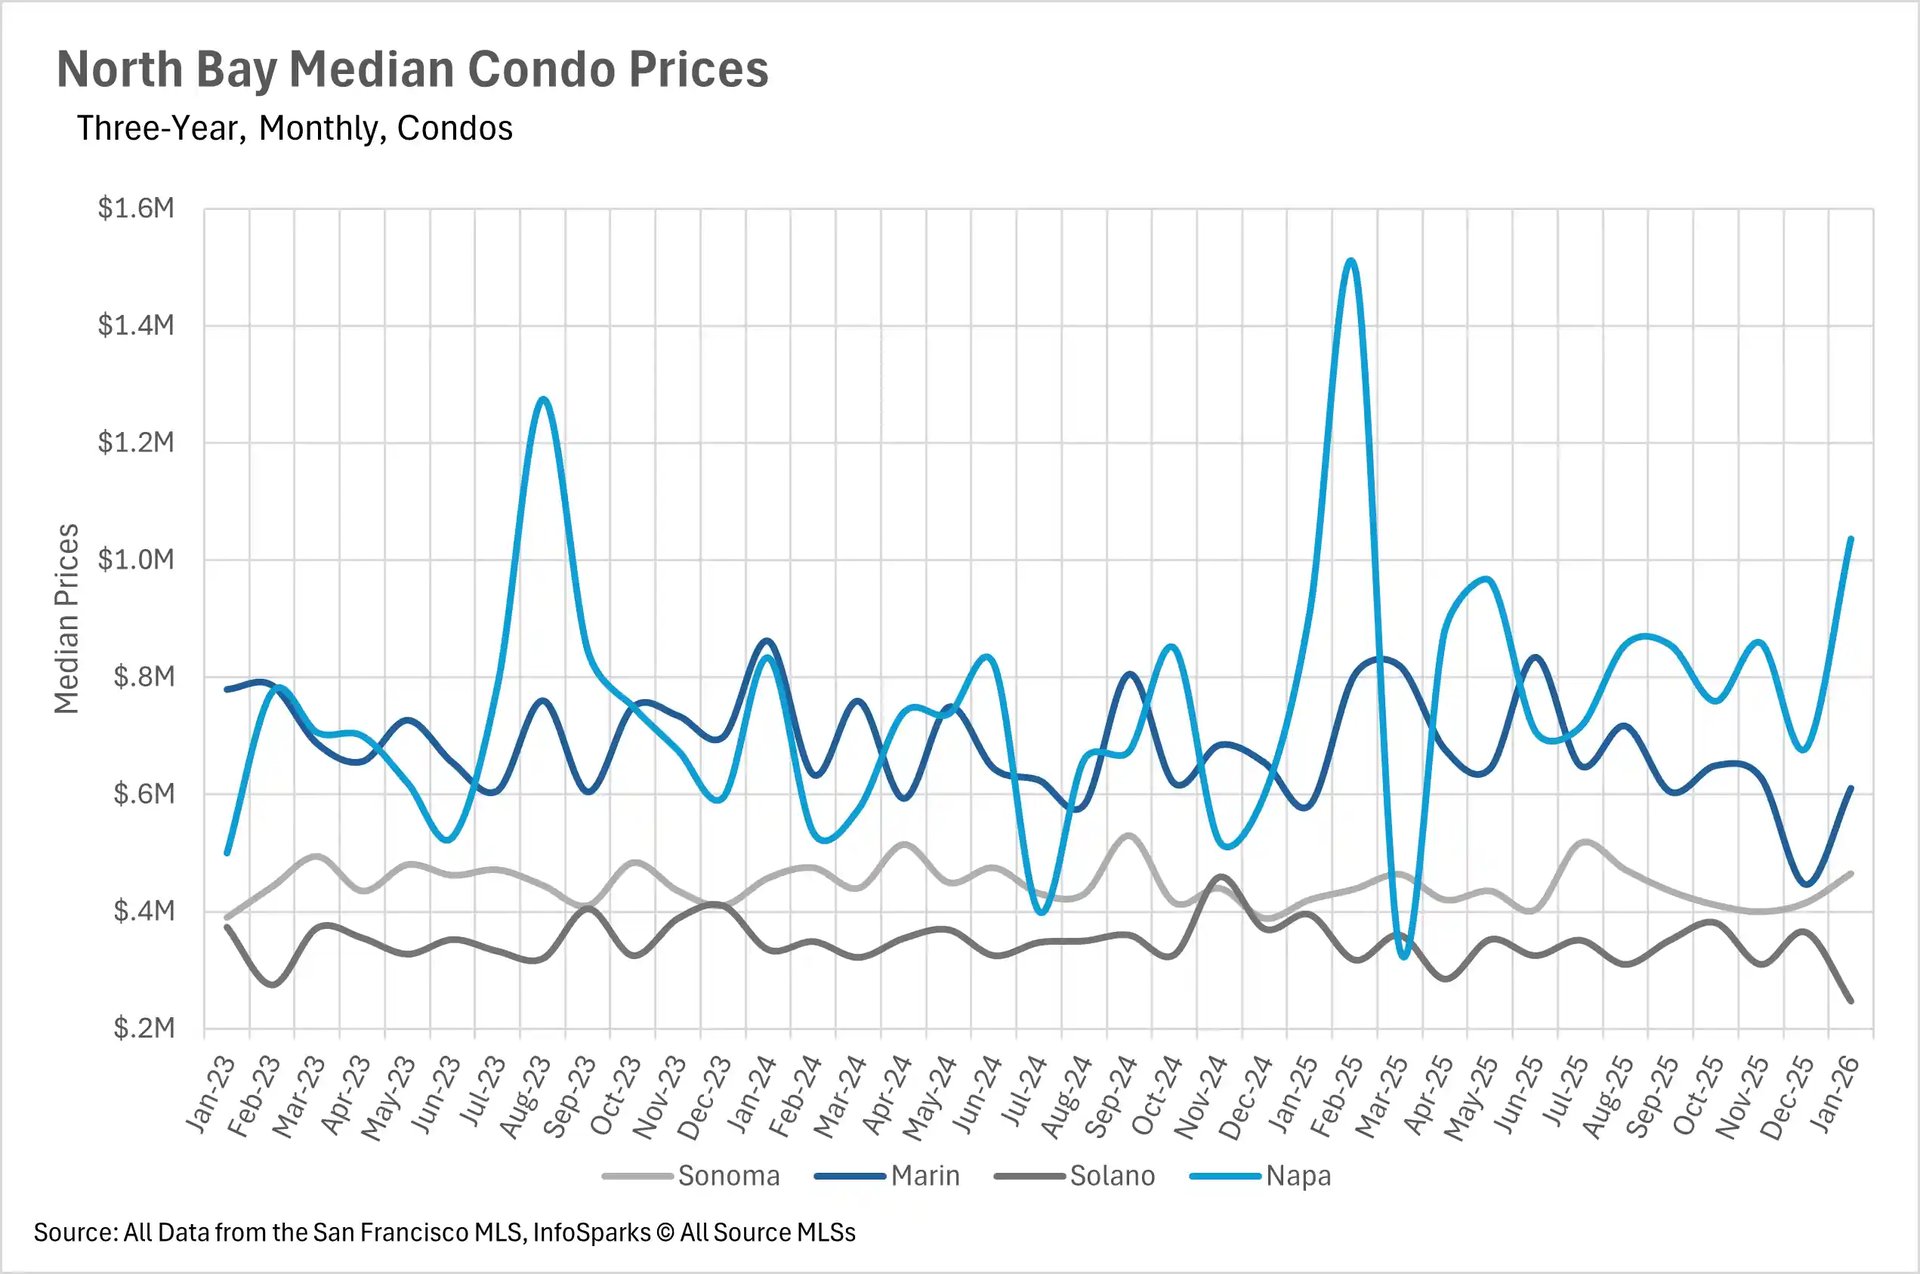
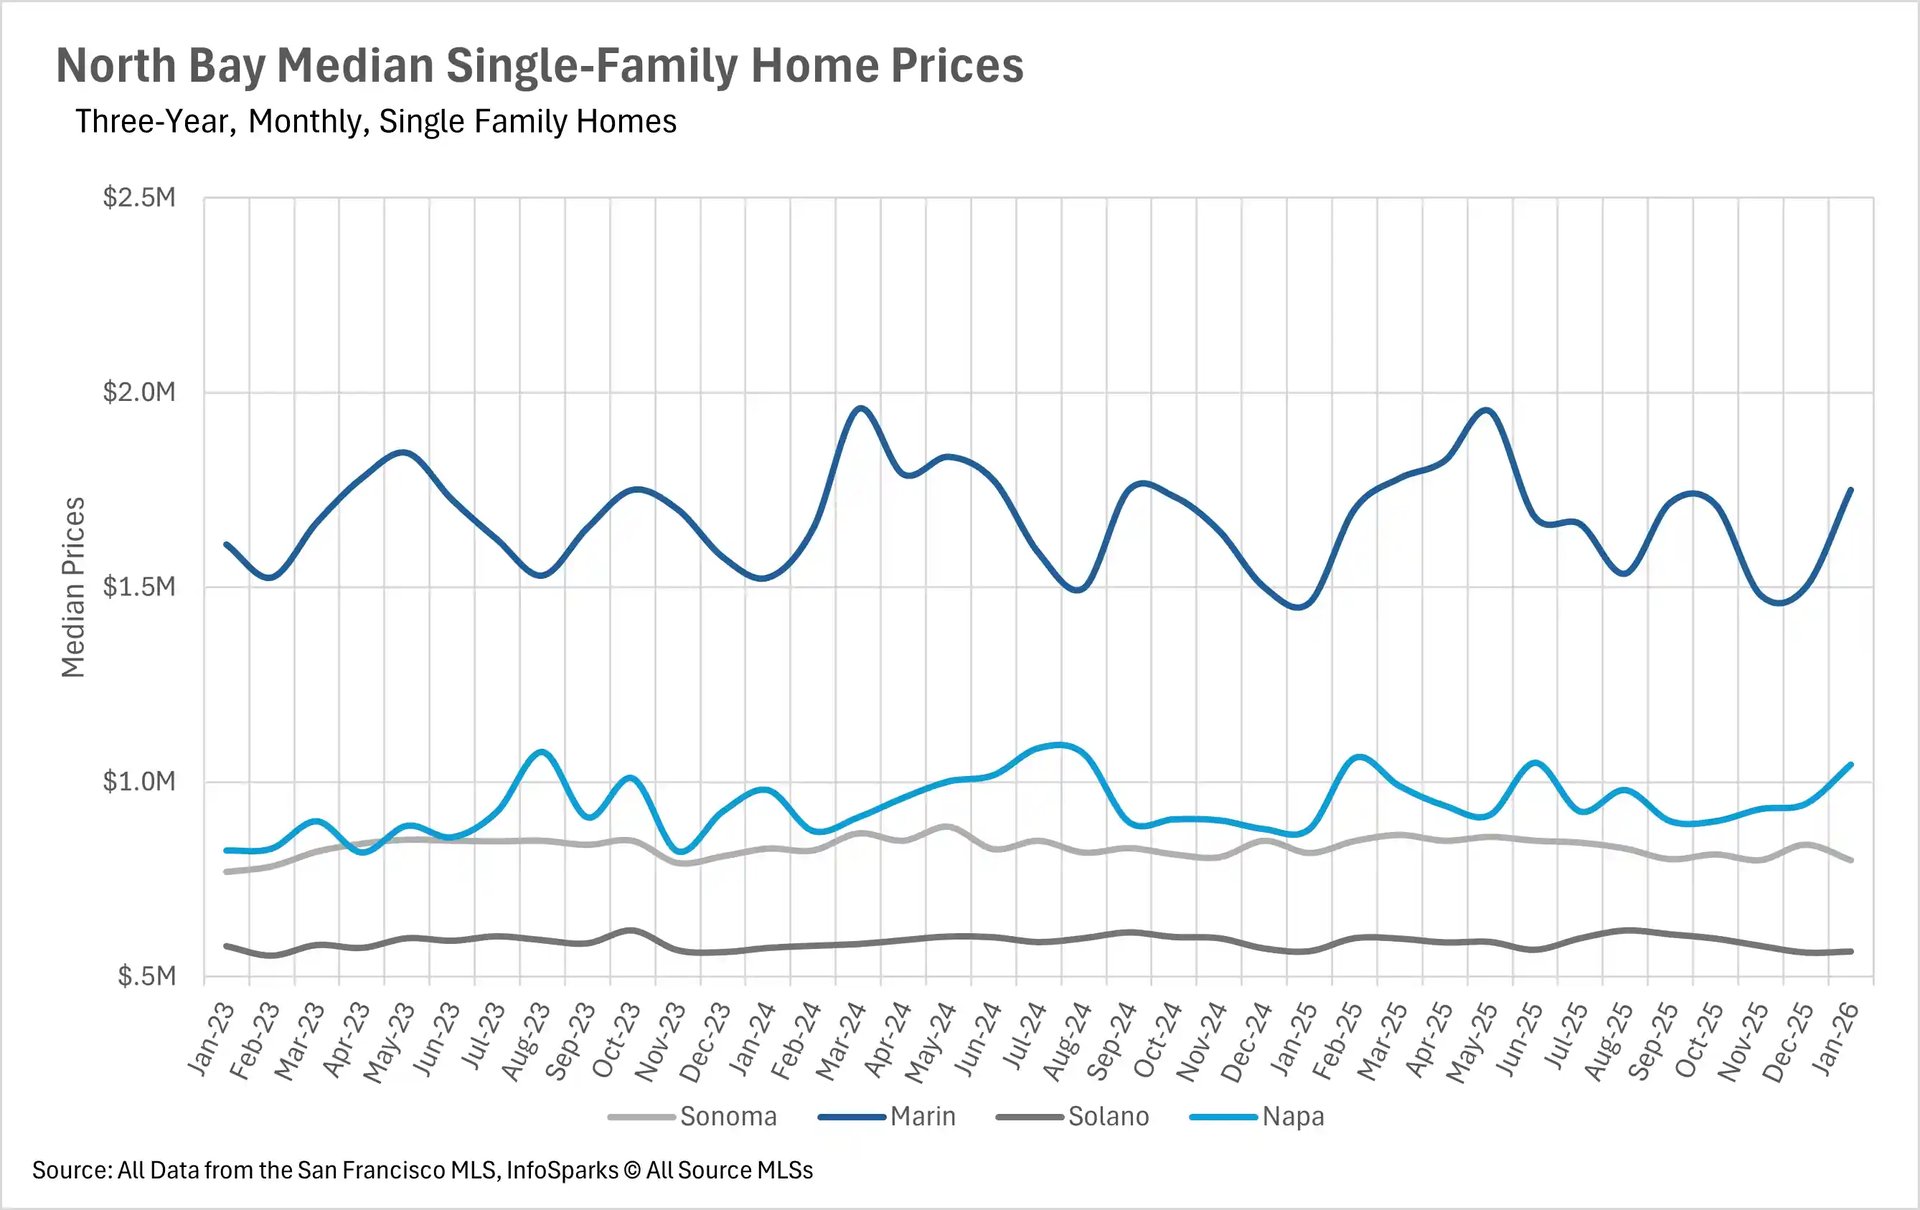
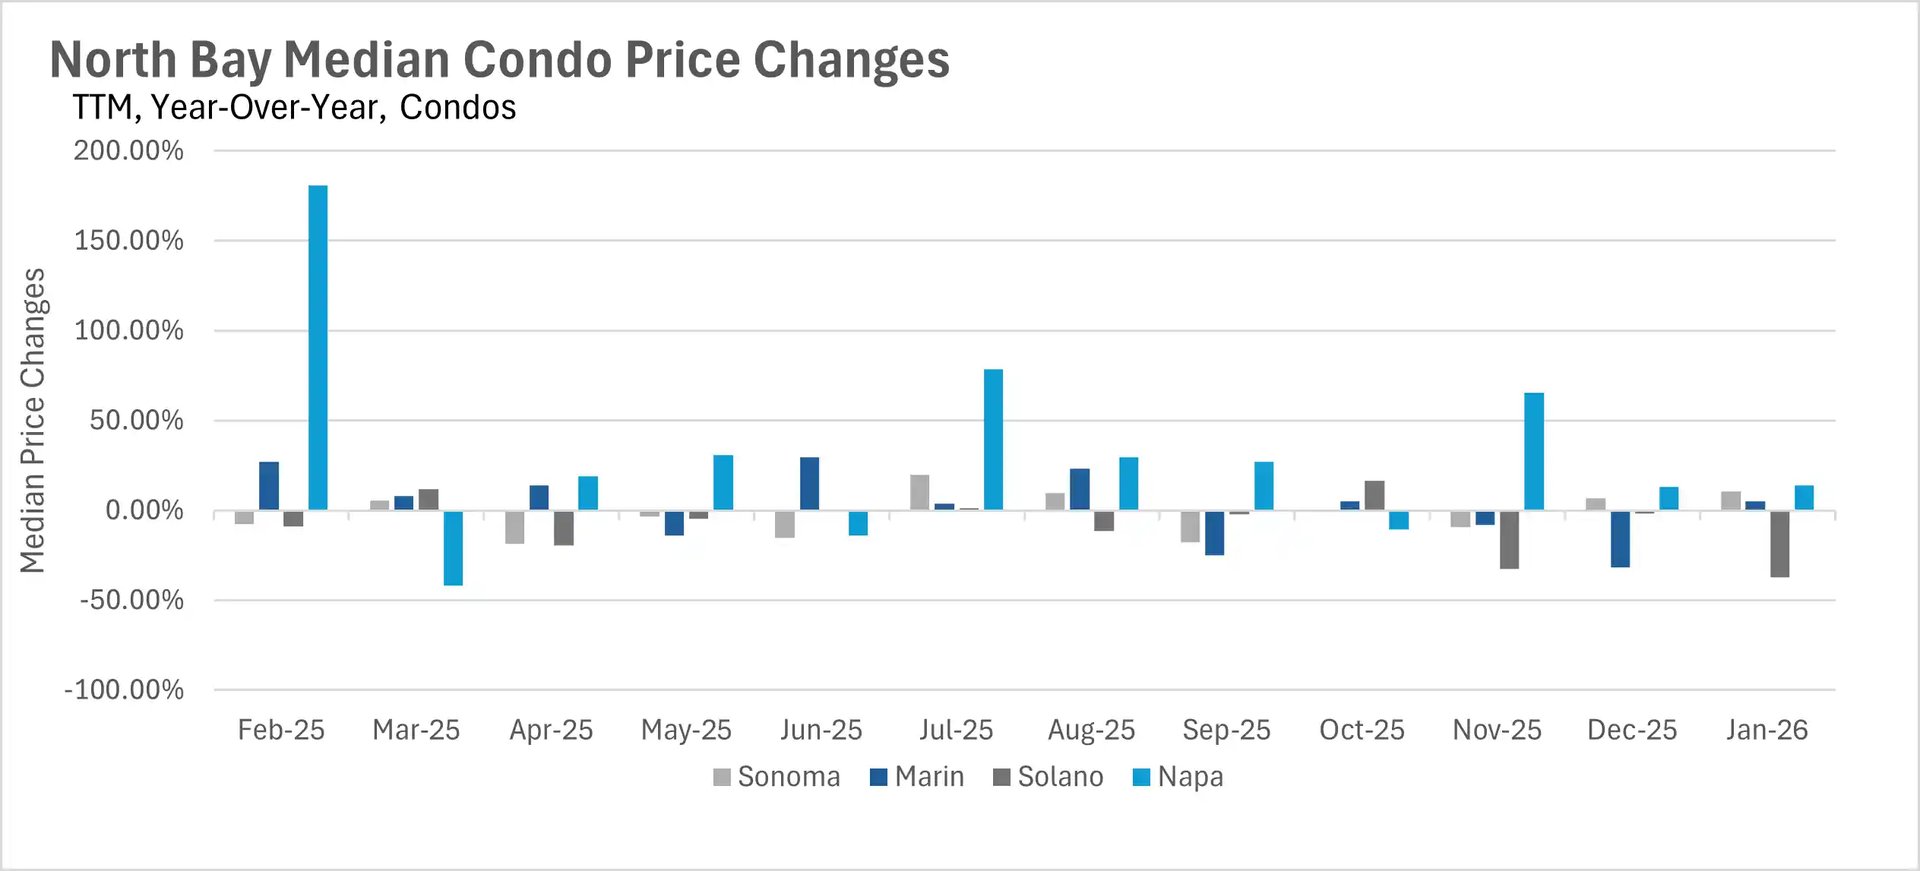
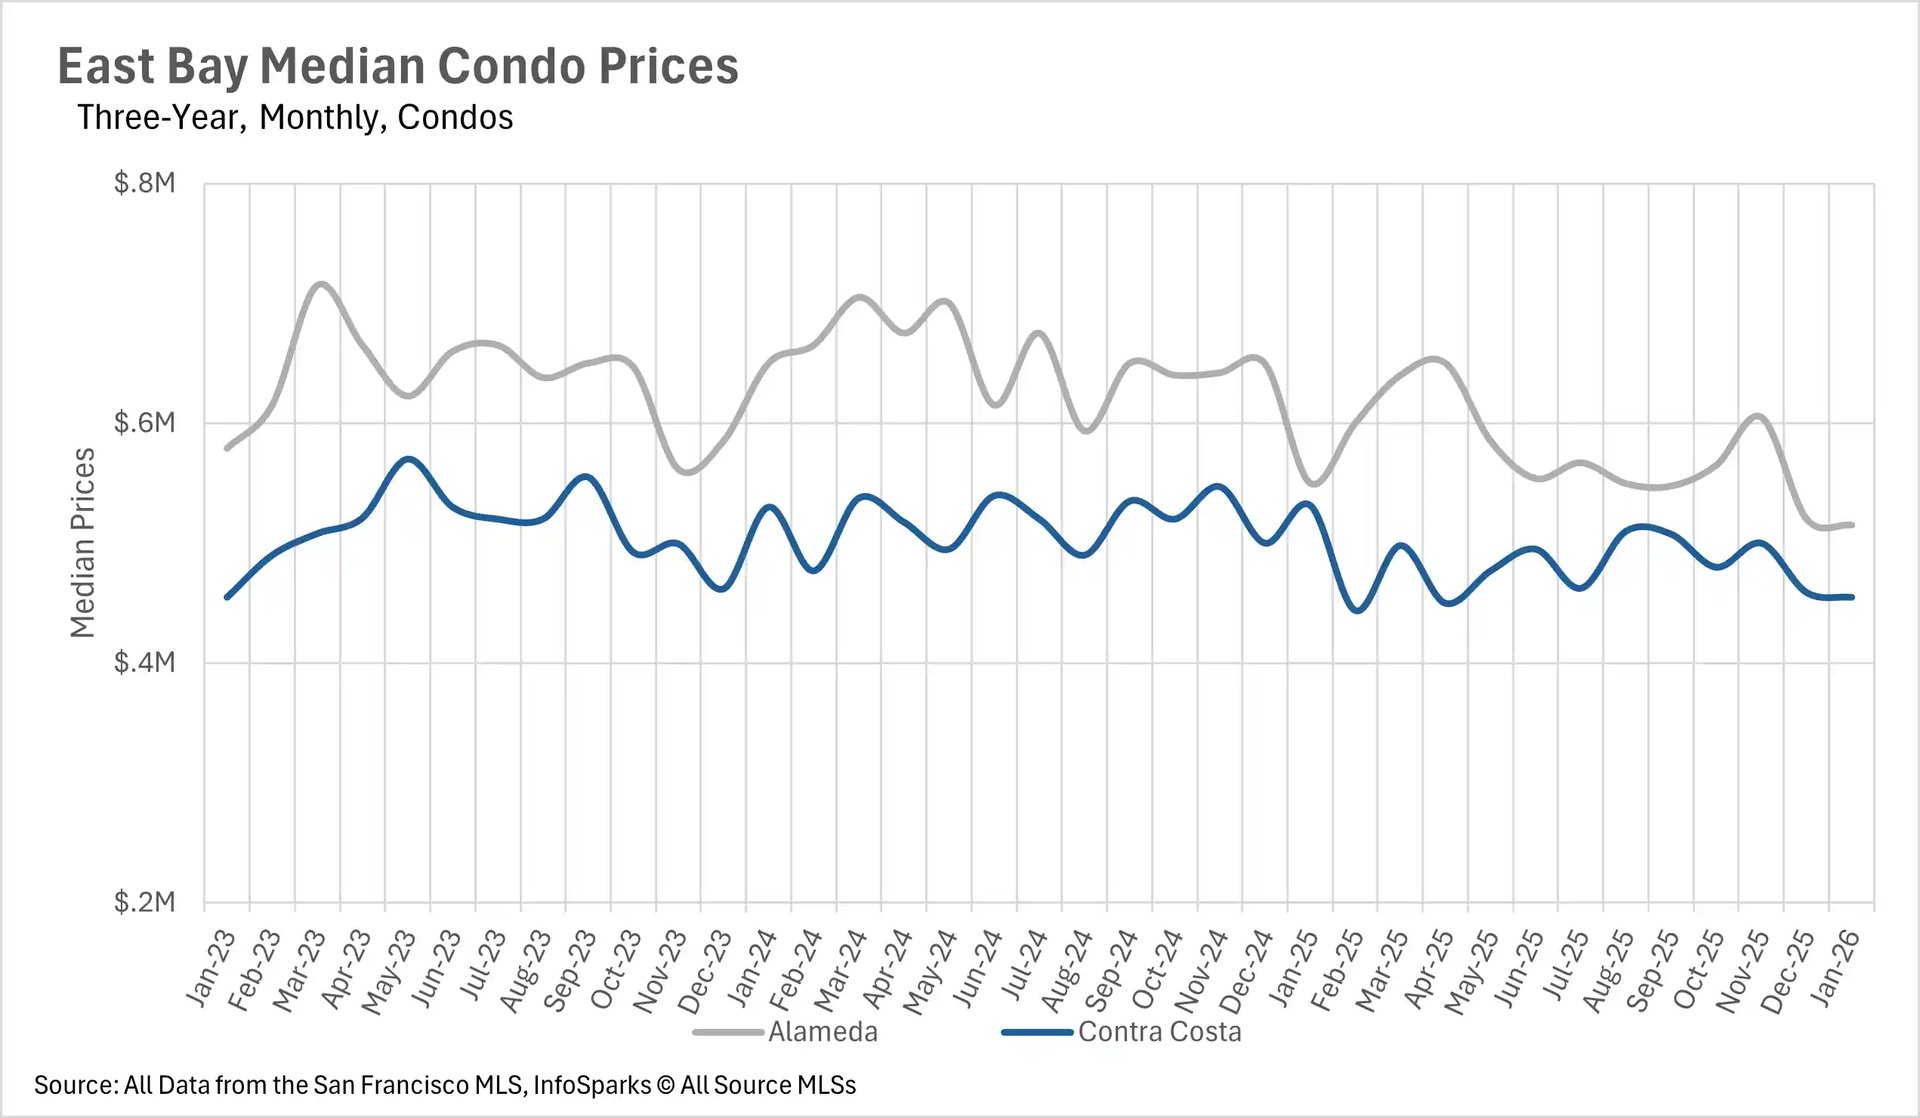
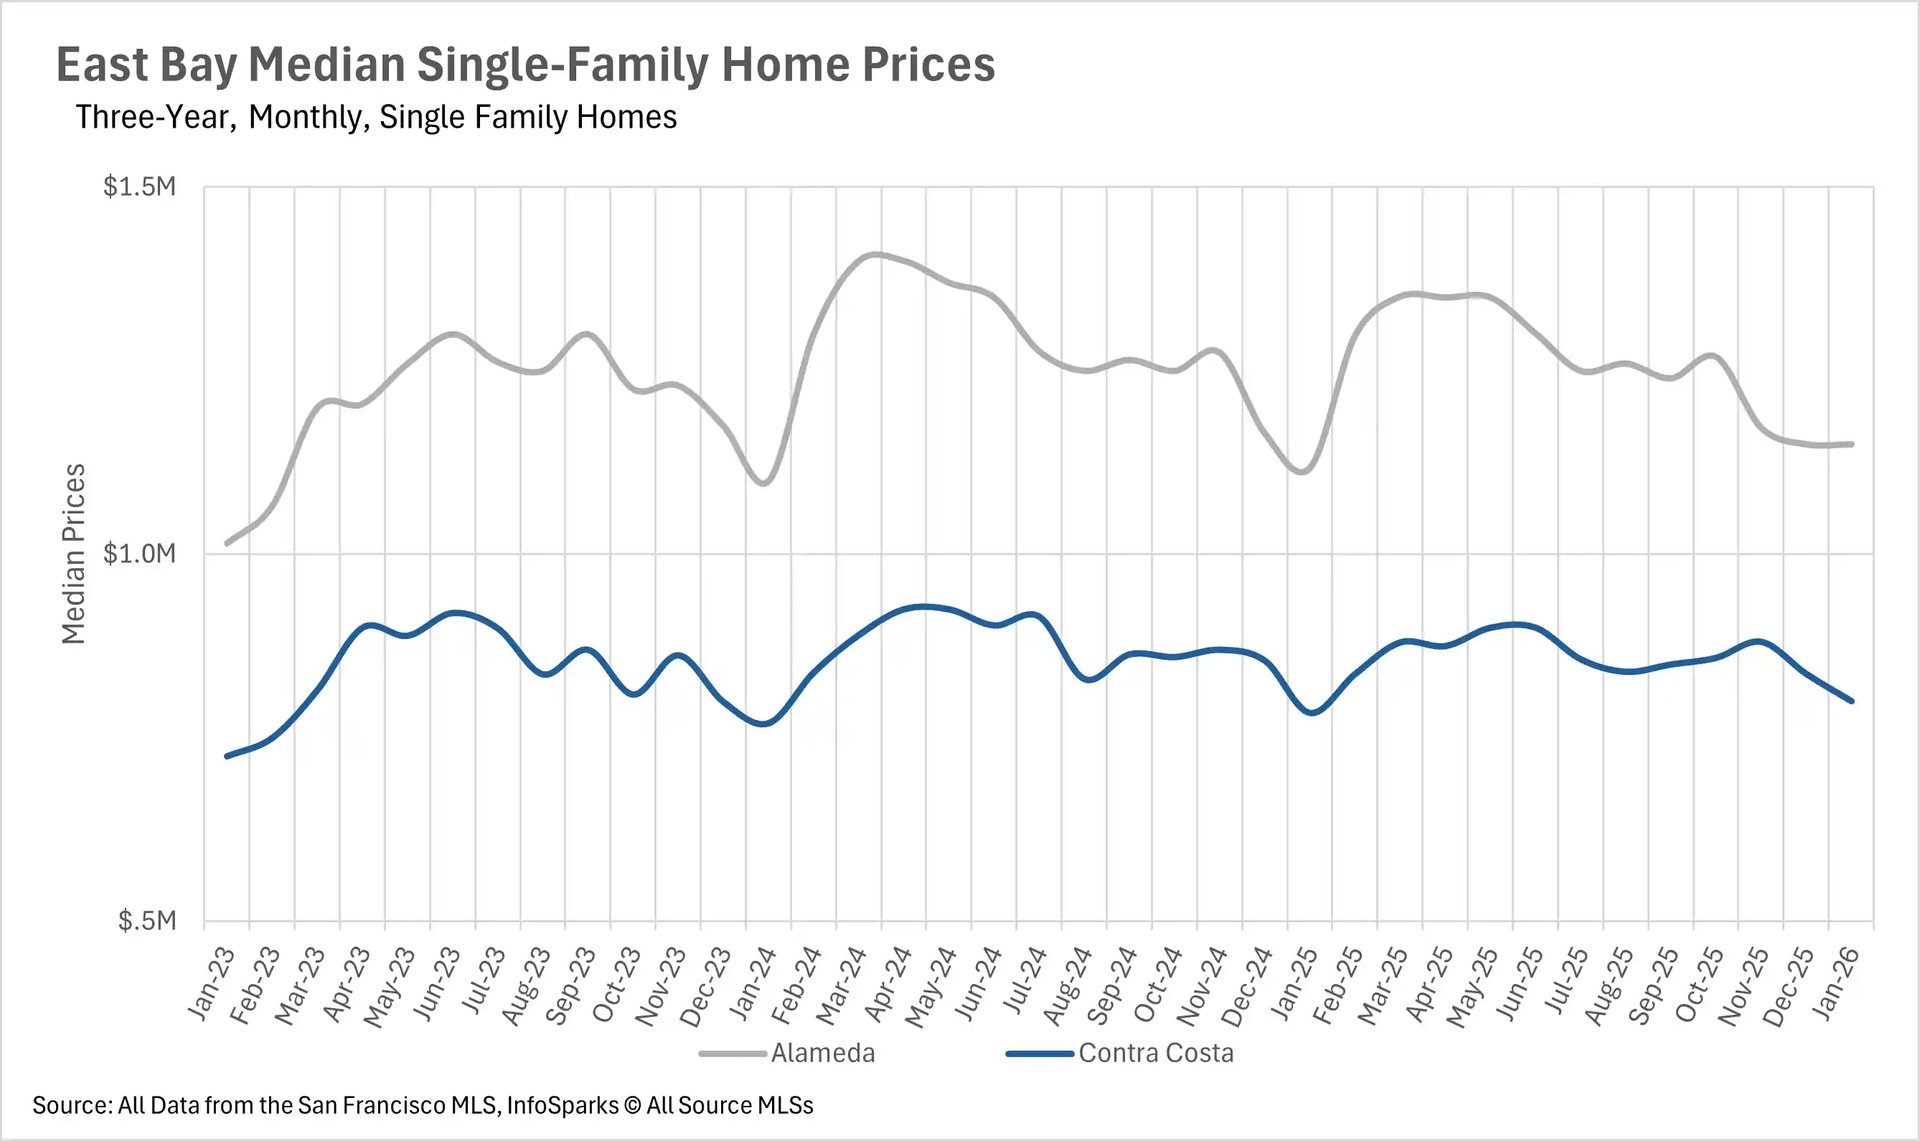
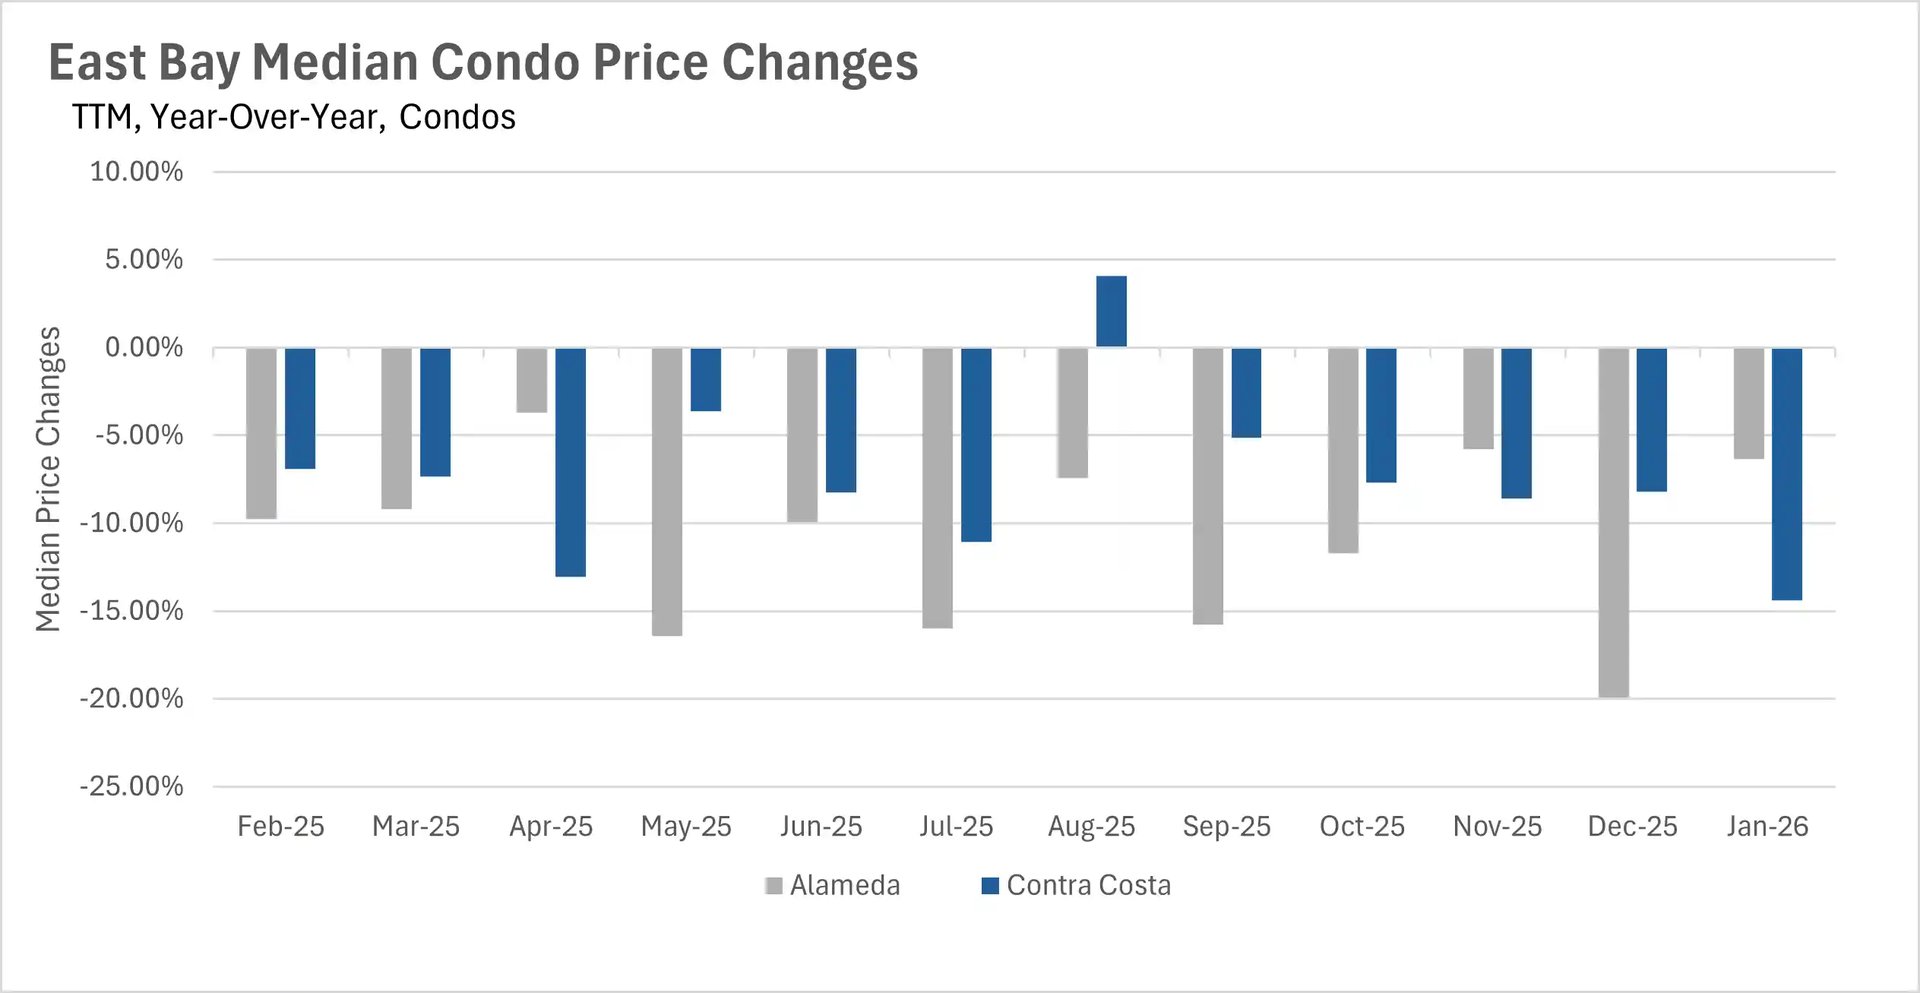
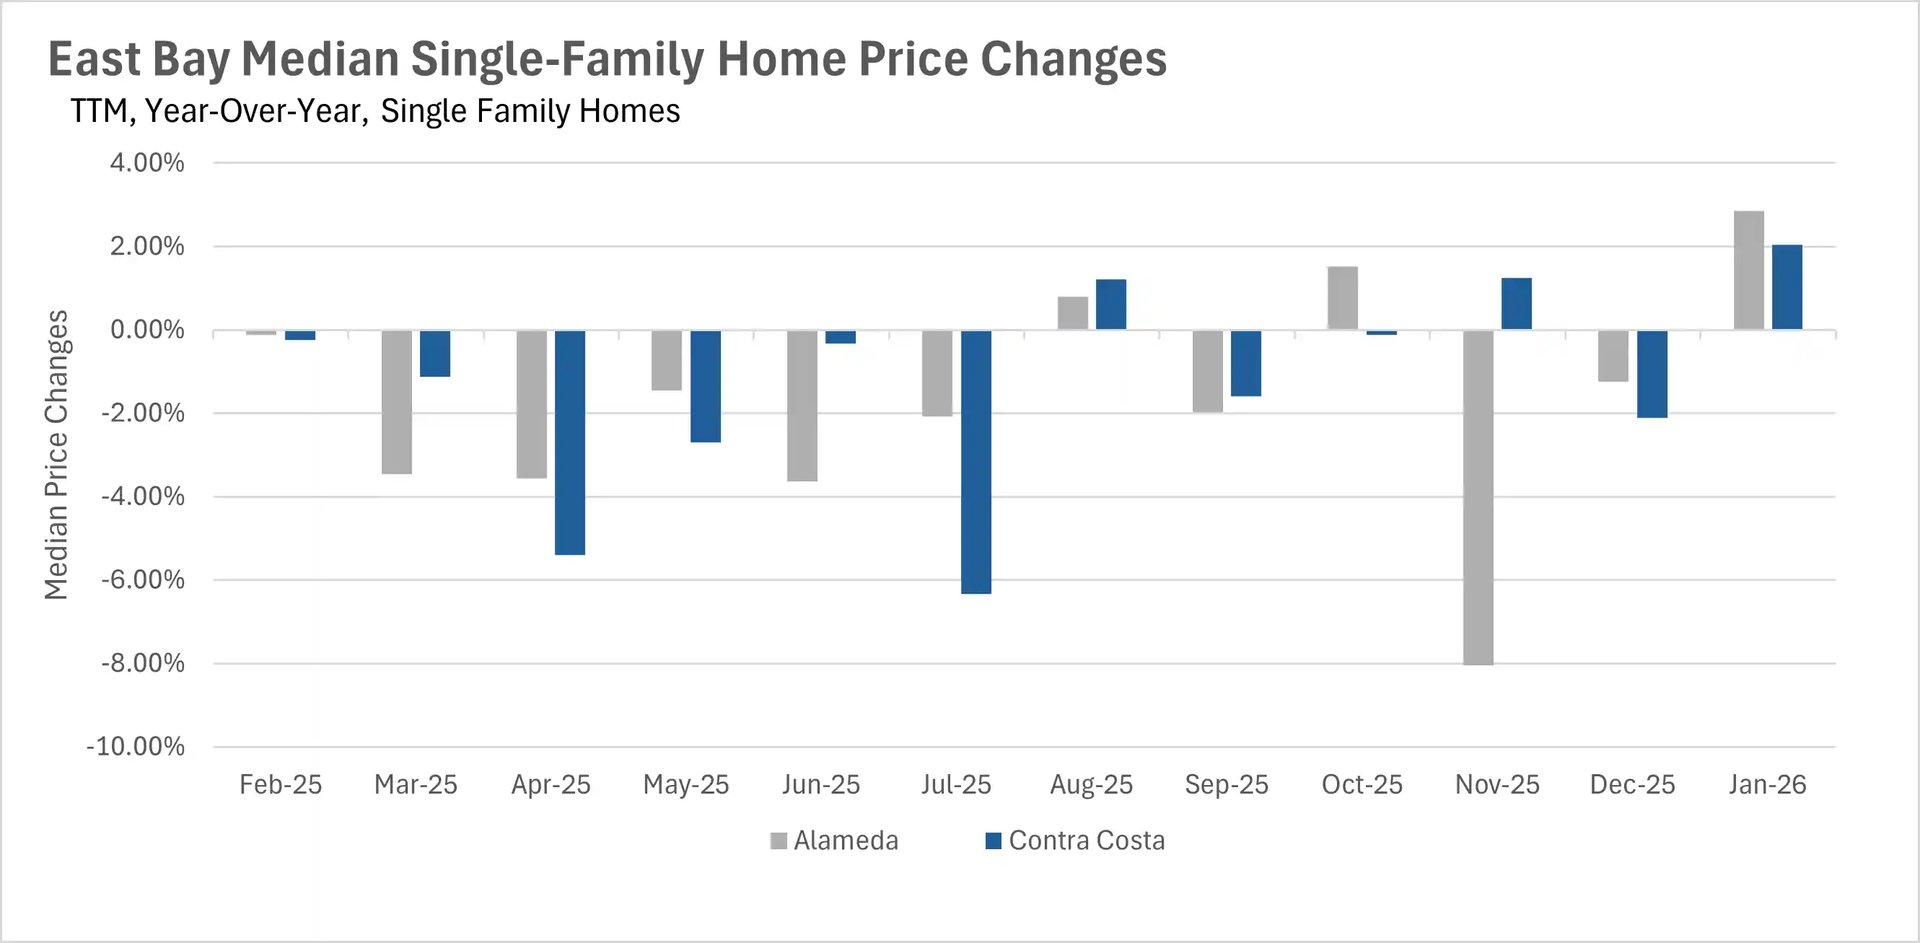
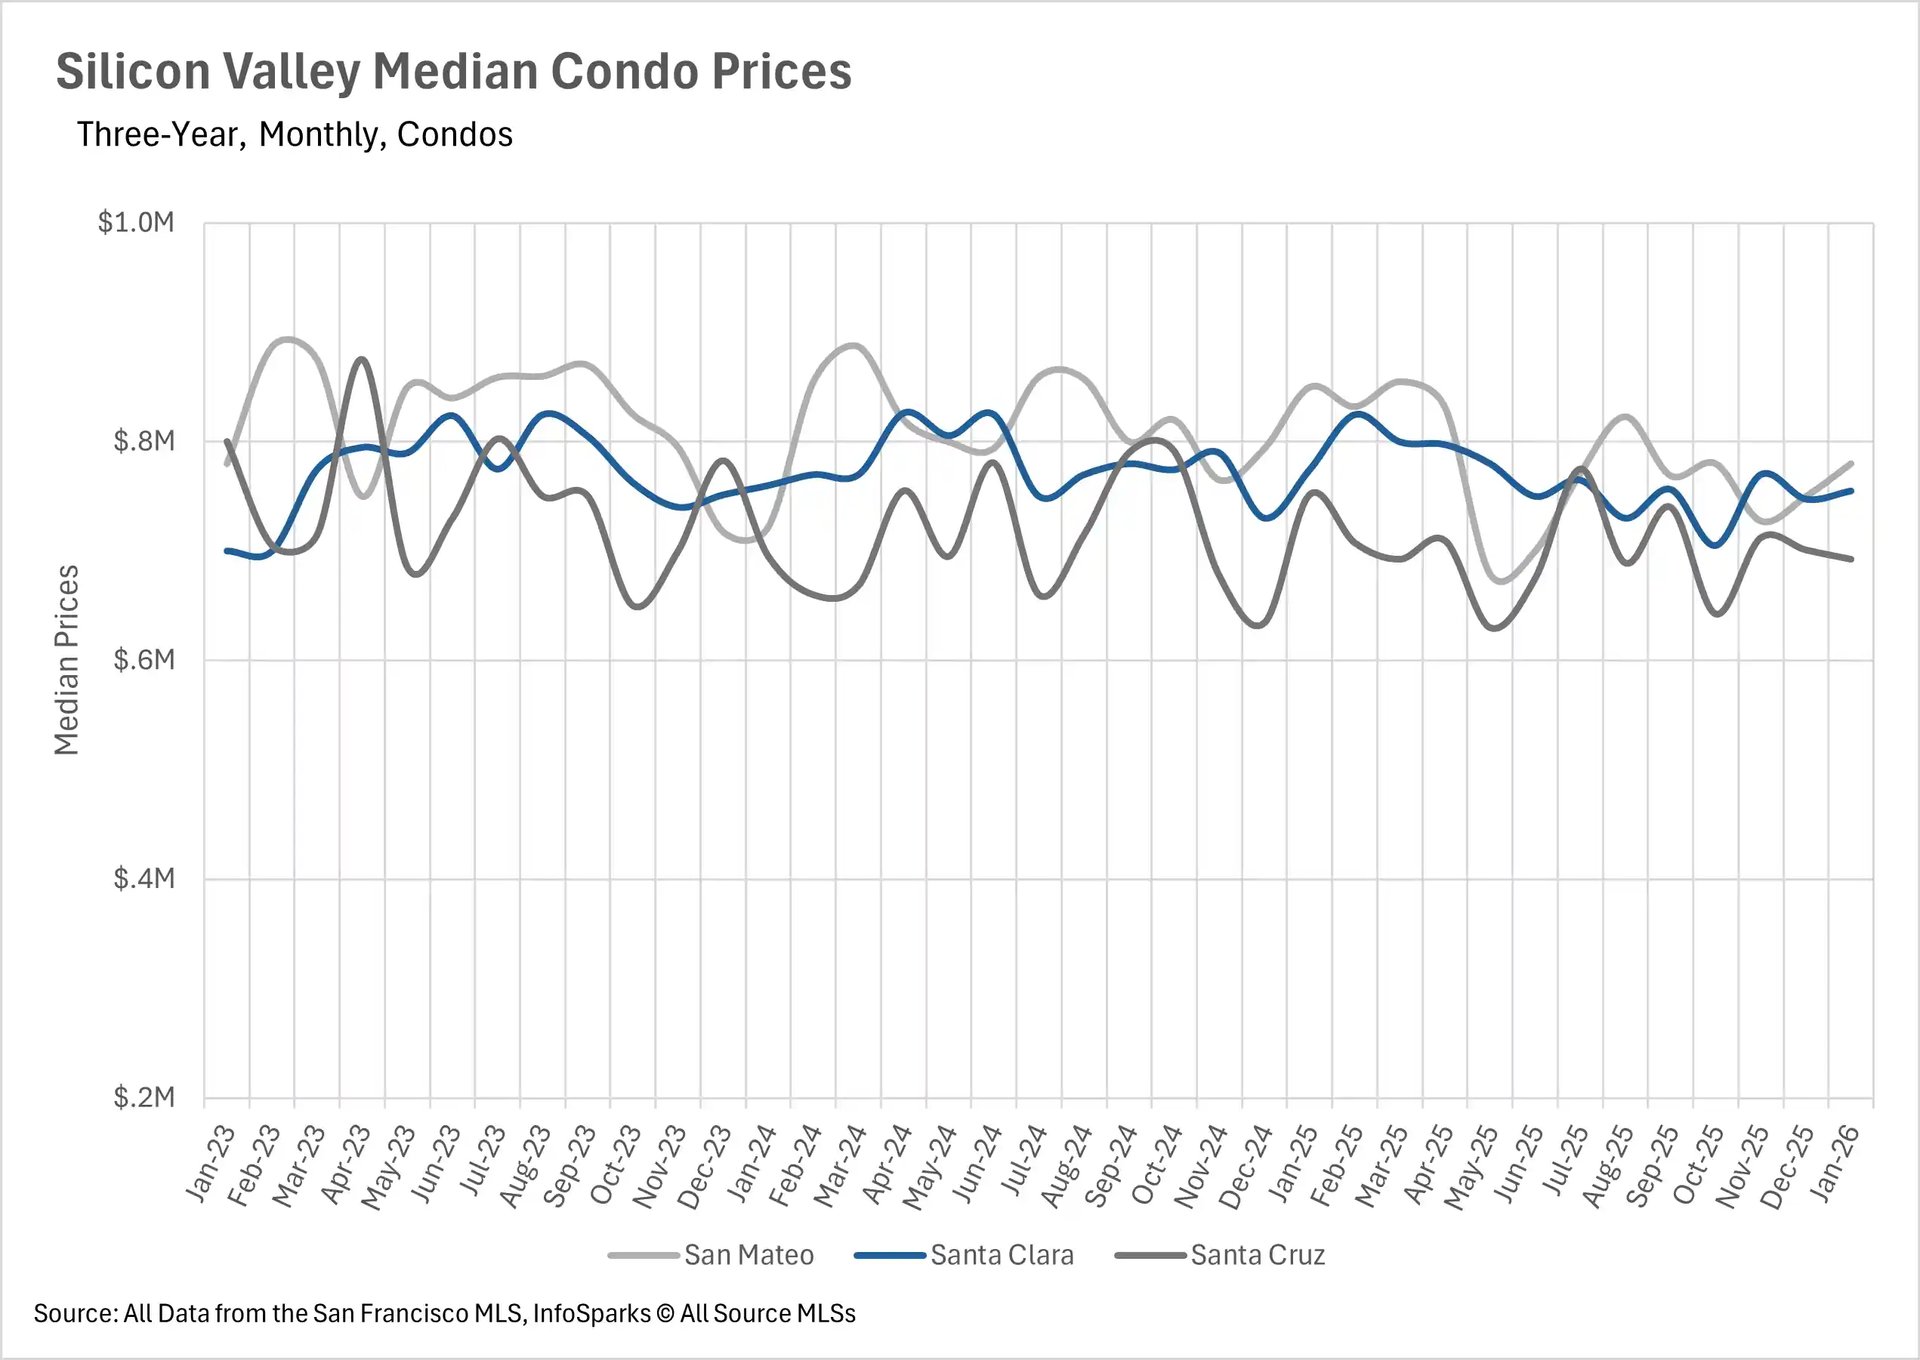
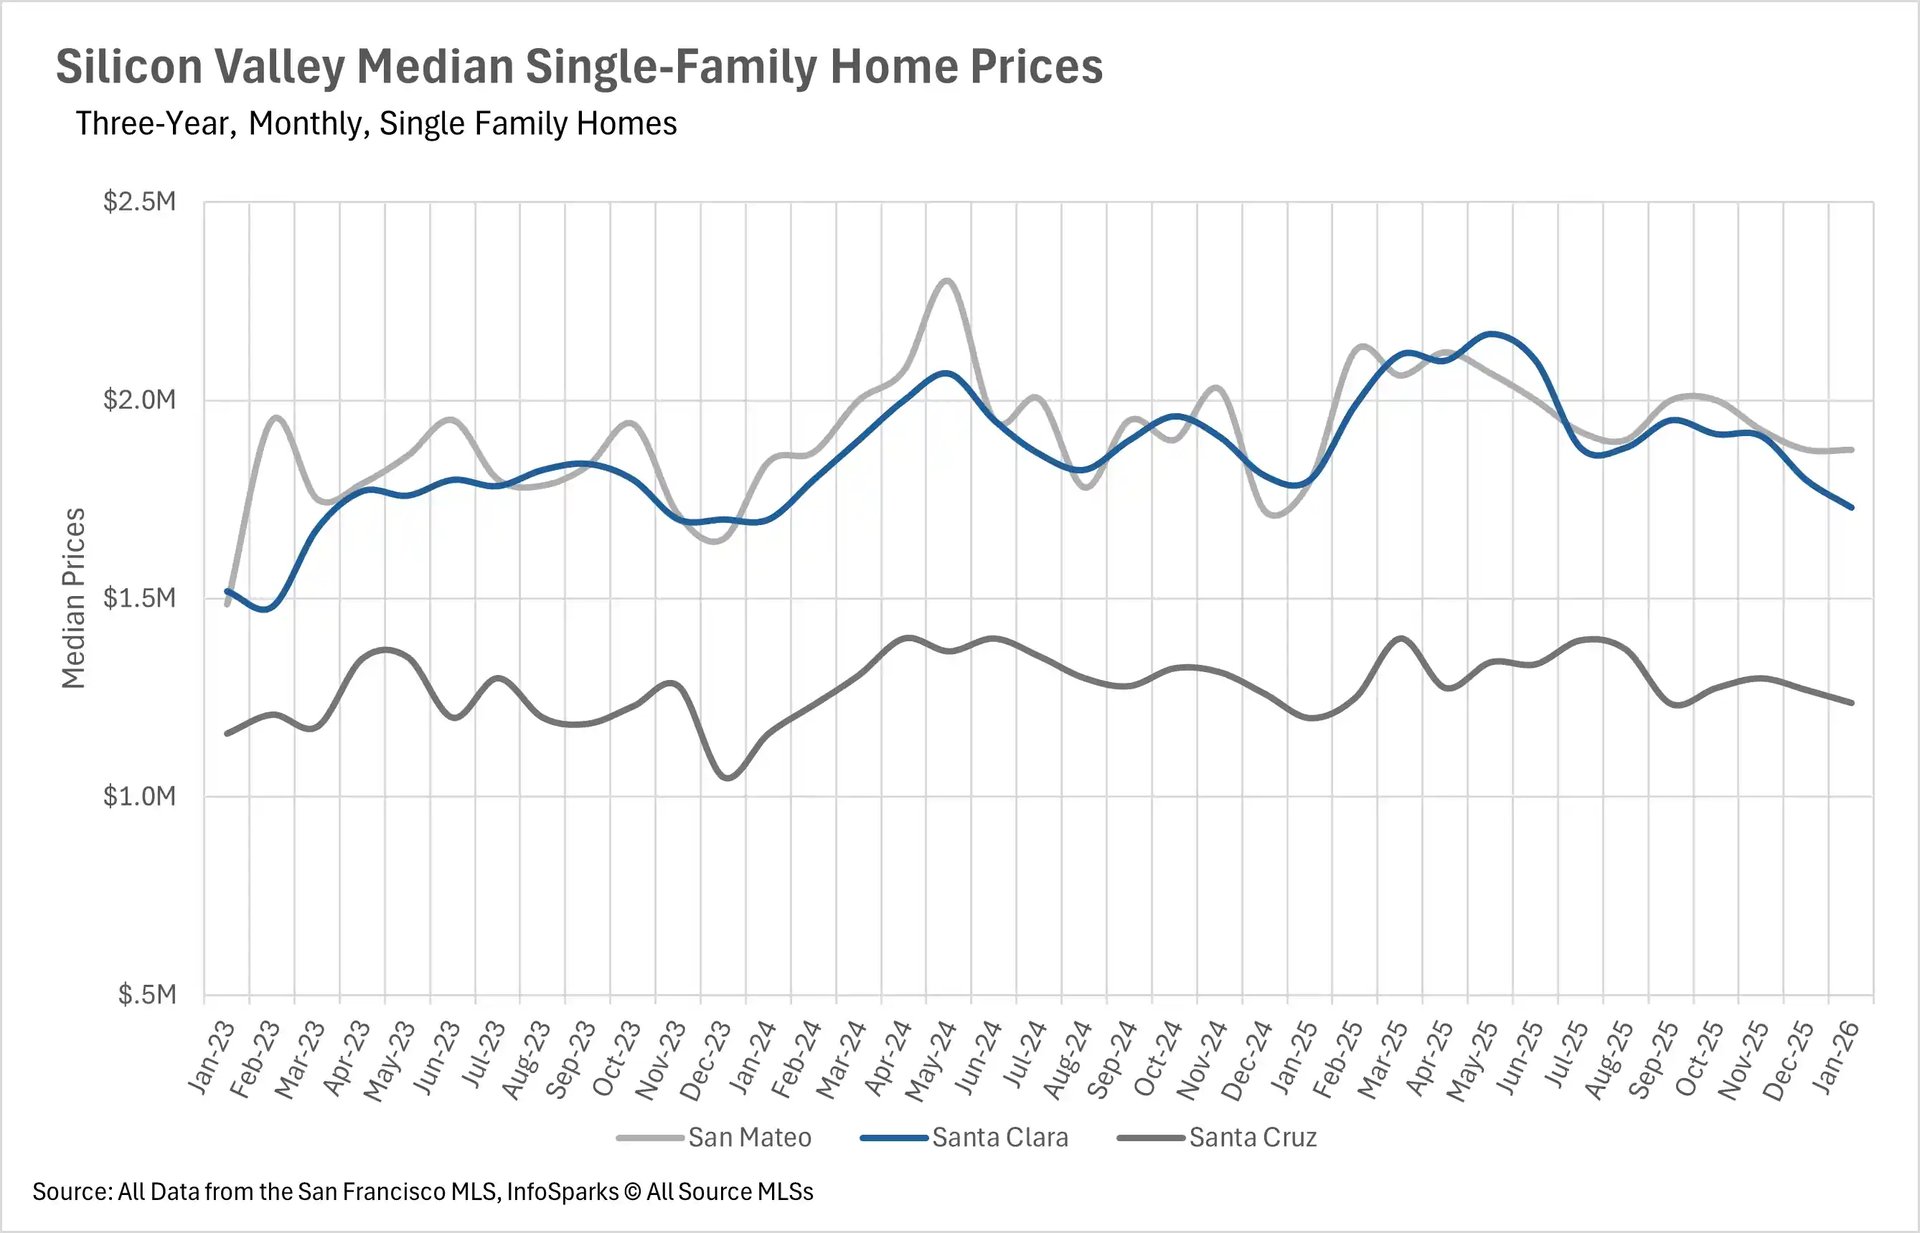
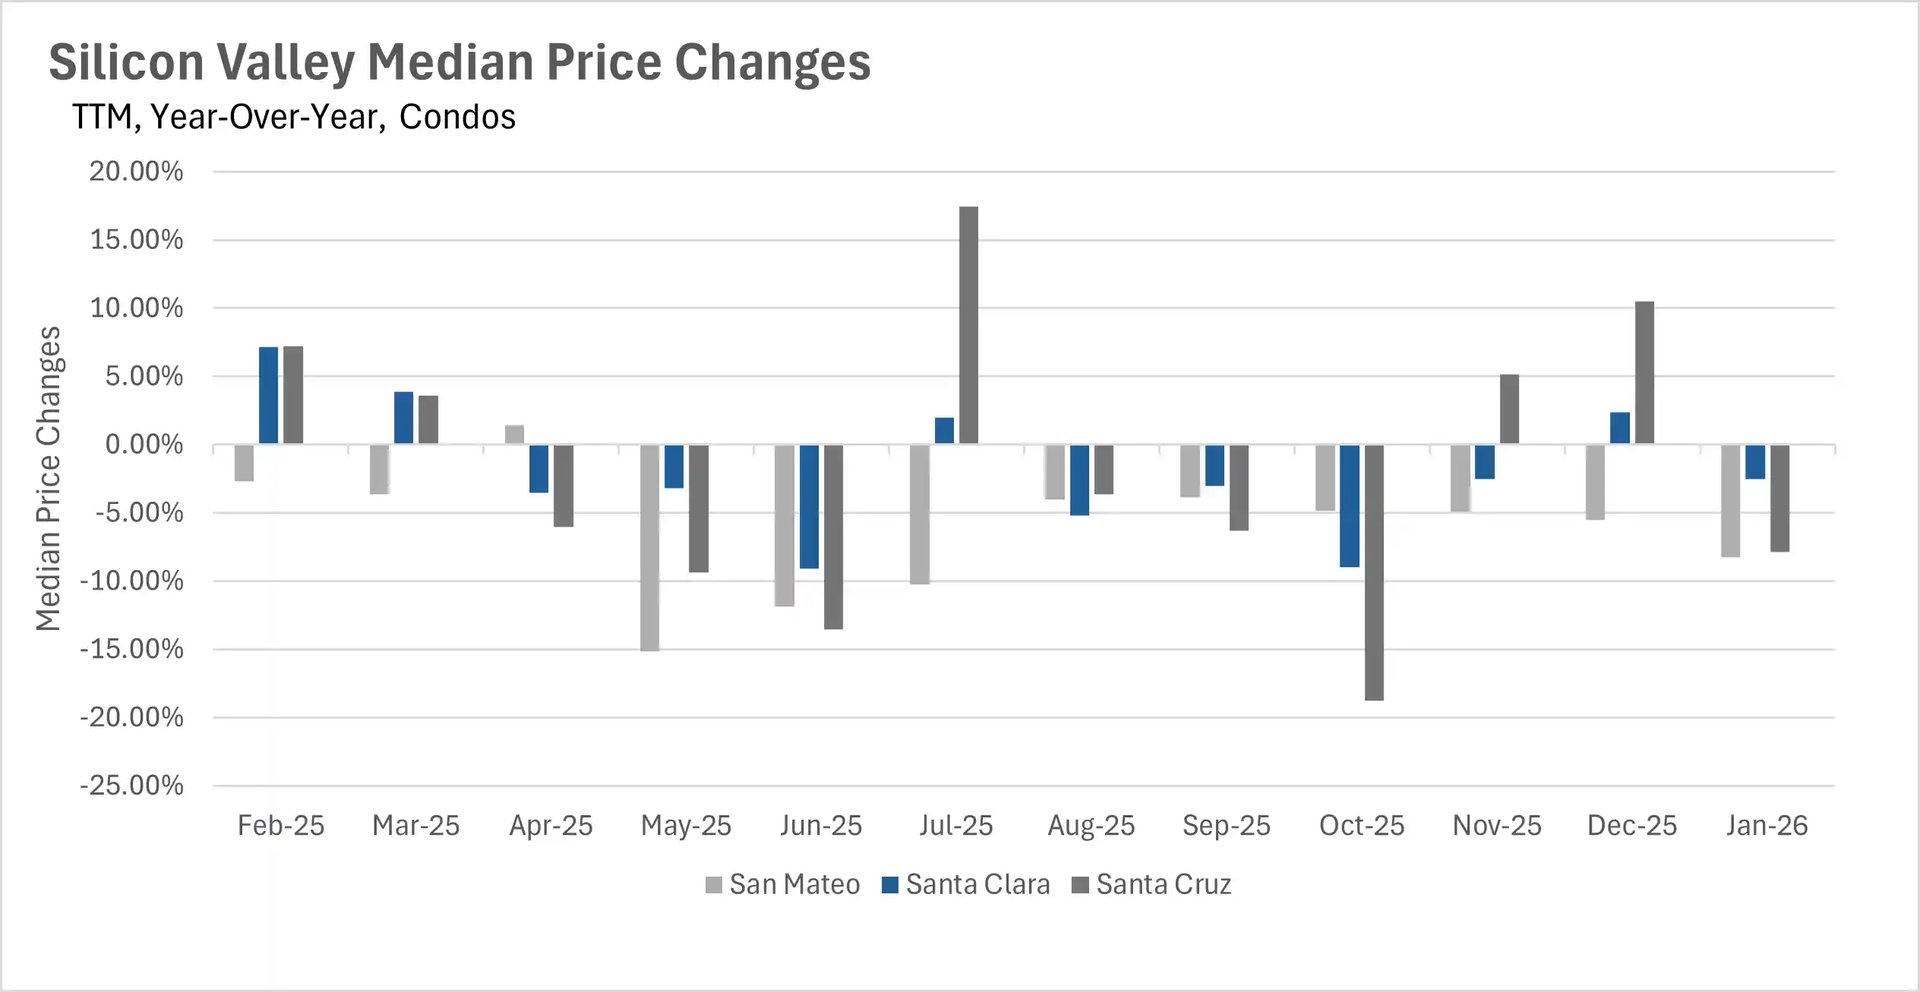
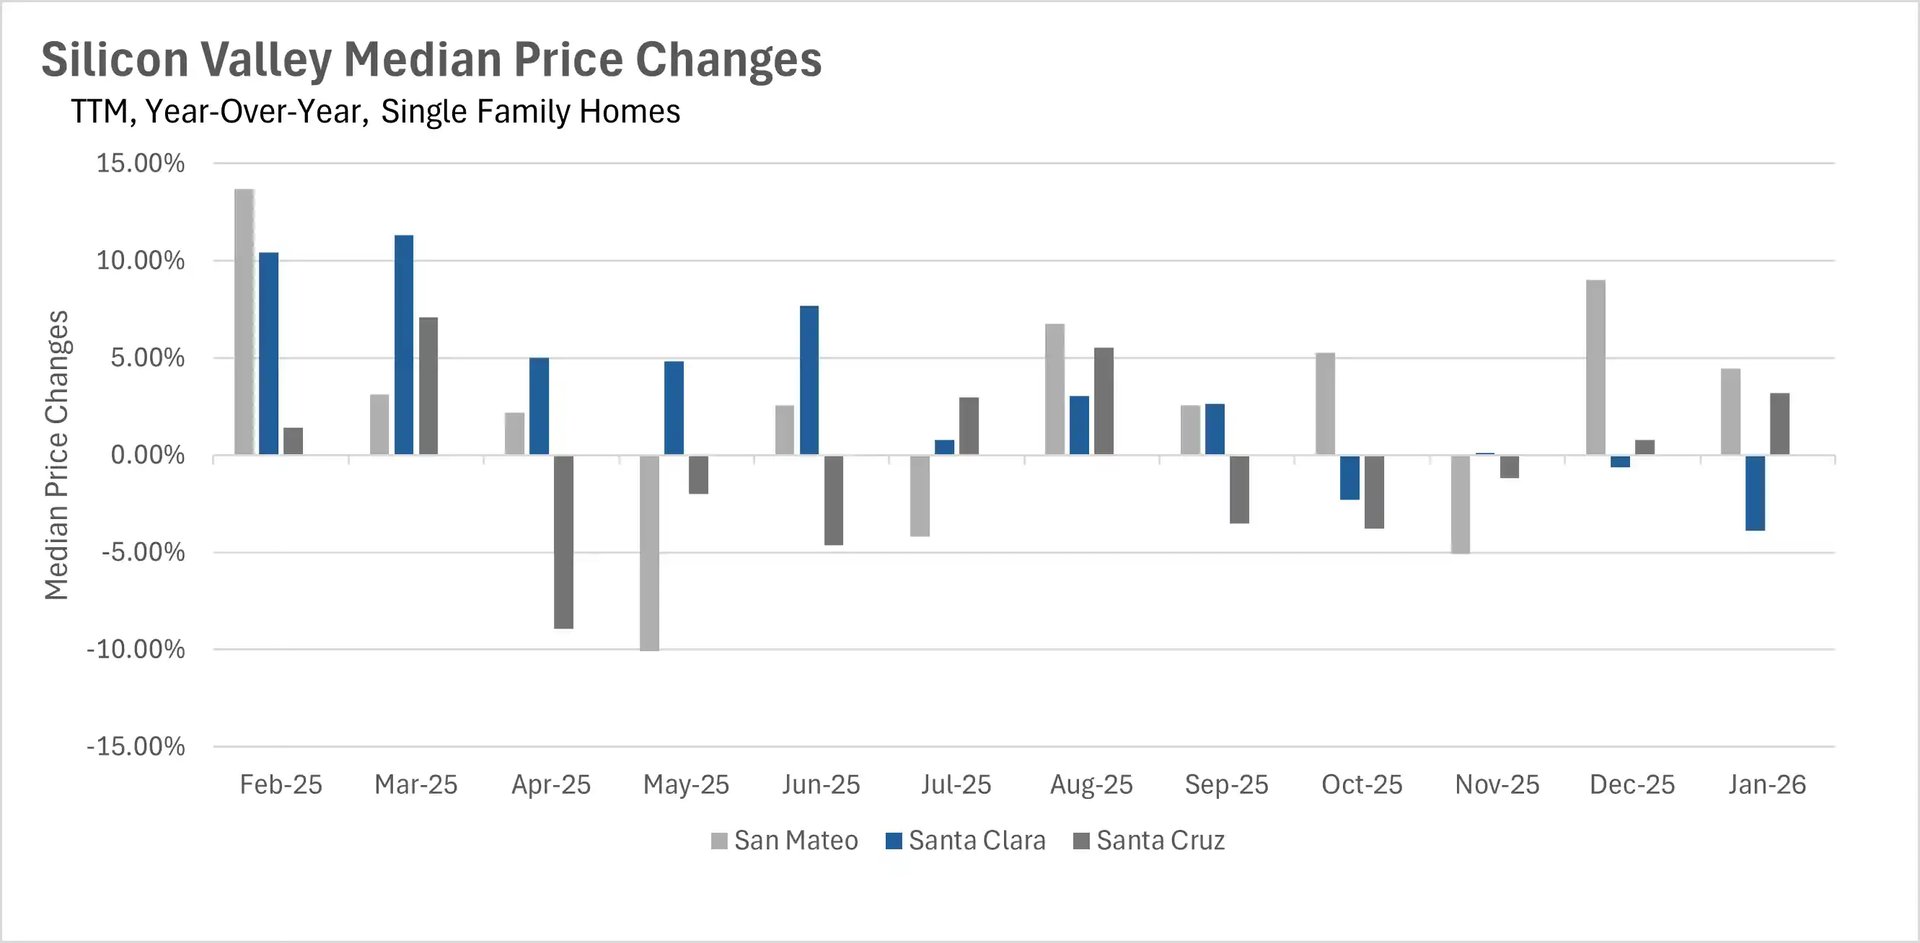
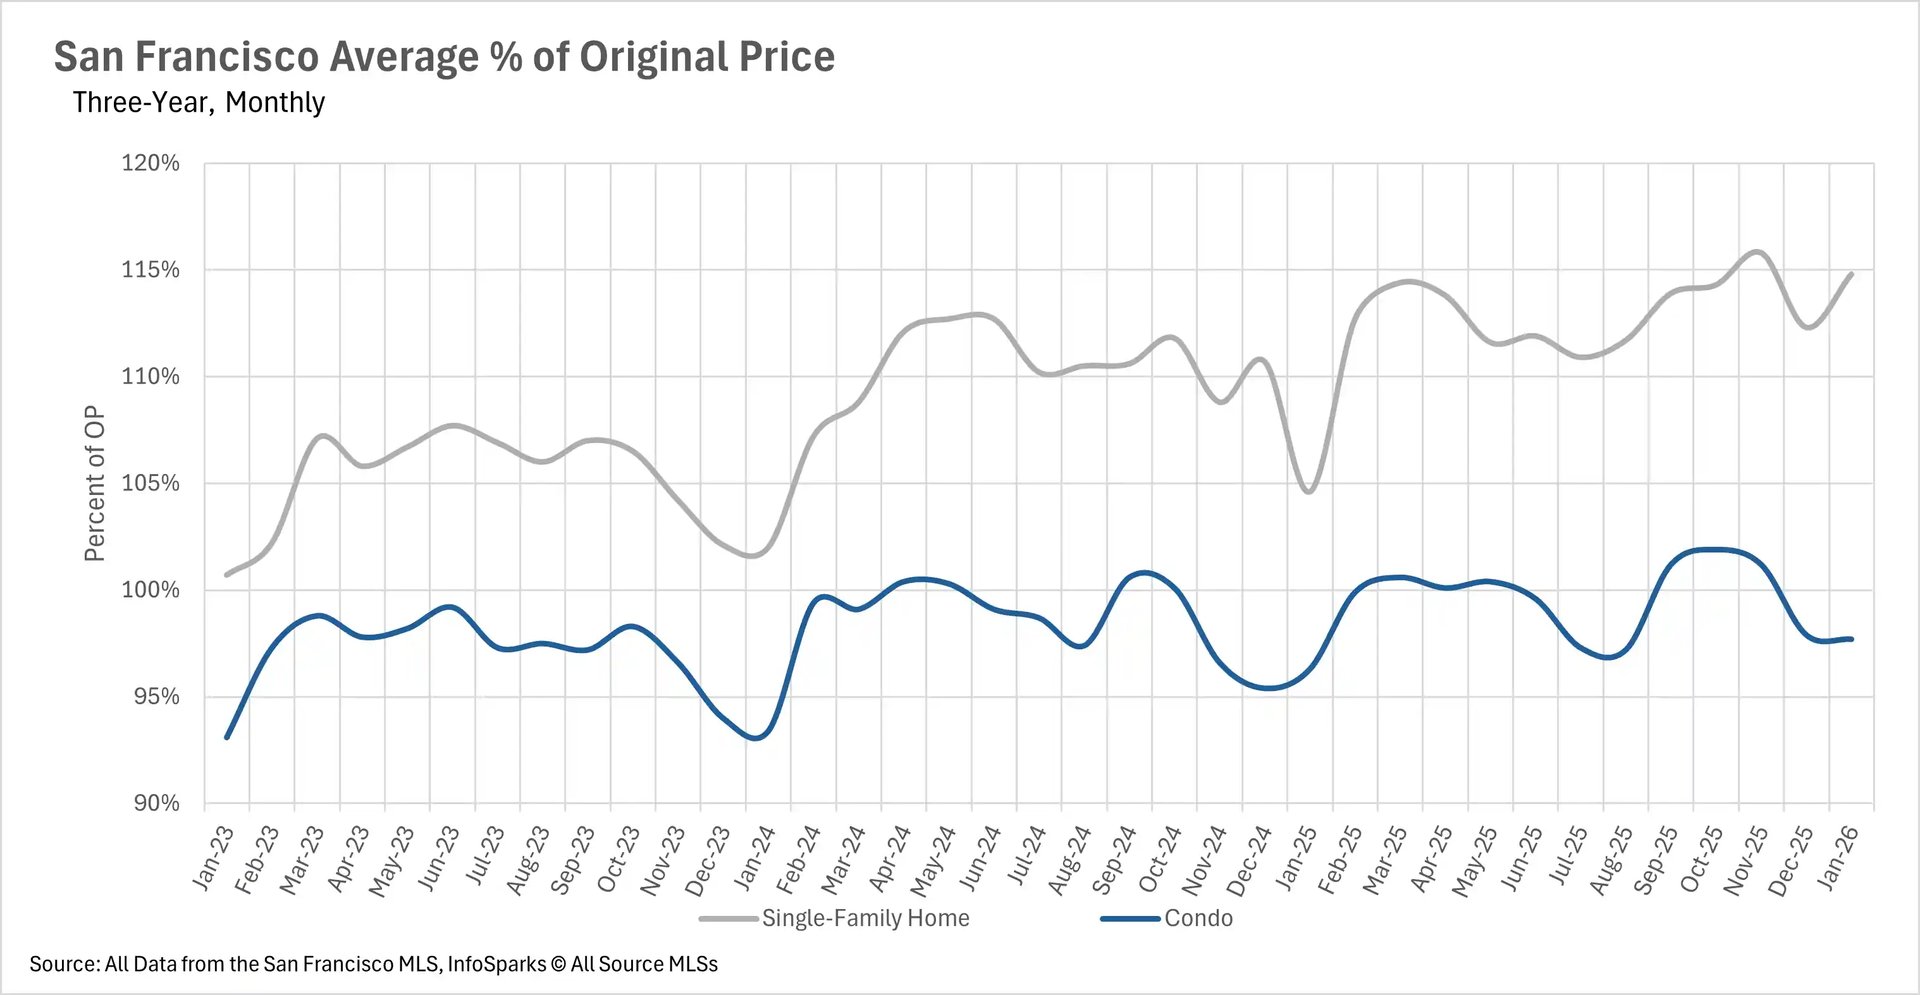
The Bay Area kicked off 2026 with some truly remarkable price appreciation in several key markets. San Francisco's single-family home market posted a stunning 16.23% year-over-year increase in median sale price, with the median home selling for $1,653,325. Not to be outdone, Marin County saw its median single-family home sell for $1,750,000, a 19.86% year-over-year jump. Napa County also posted impressive gains, with single-family homes up 18.75% to a median of $1,045,000. However, not every market is experiencing this level of growth. Santa Clara County saw its median single-family home price decline by 3.89%, while Sonoma and Solano Counties also posted slight year-over-year declines. The condo market continues to tell a very different story, with declines across Silicon Valley and significant weakness in Contra Costa County, where the median condo sold for 14.39% less than it did last January. San Francisco condos were a bright spot, posting a modest 2.77% year-over-year gain.
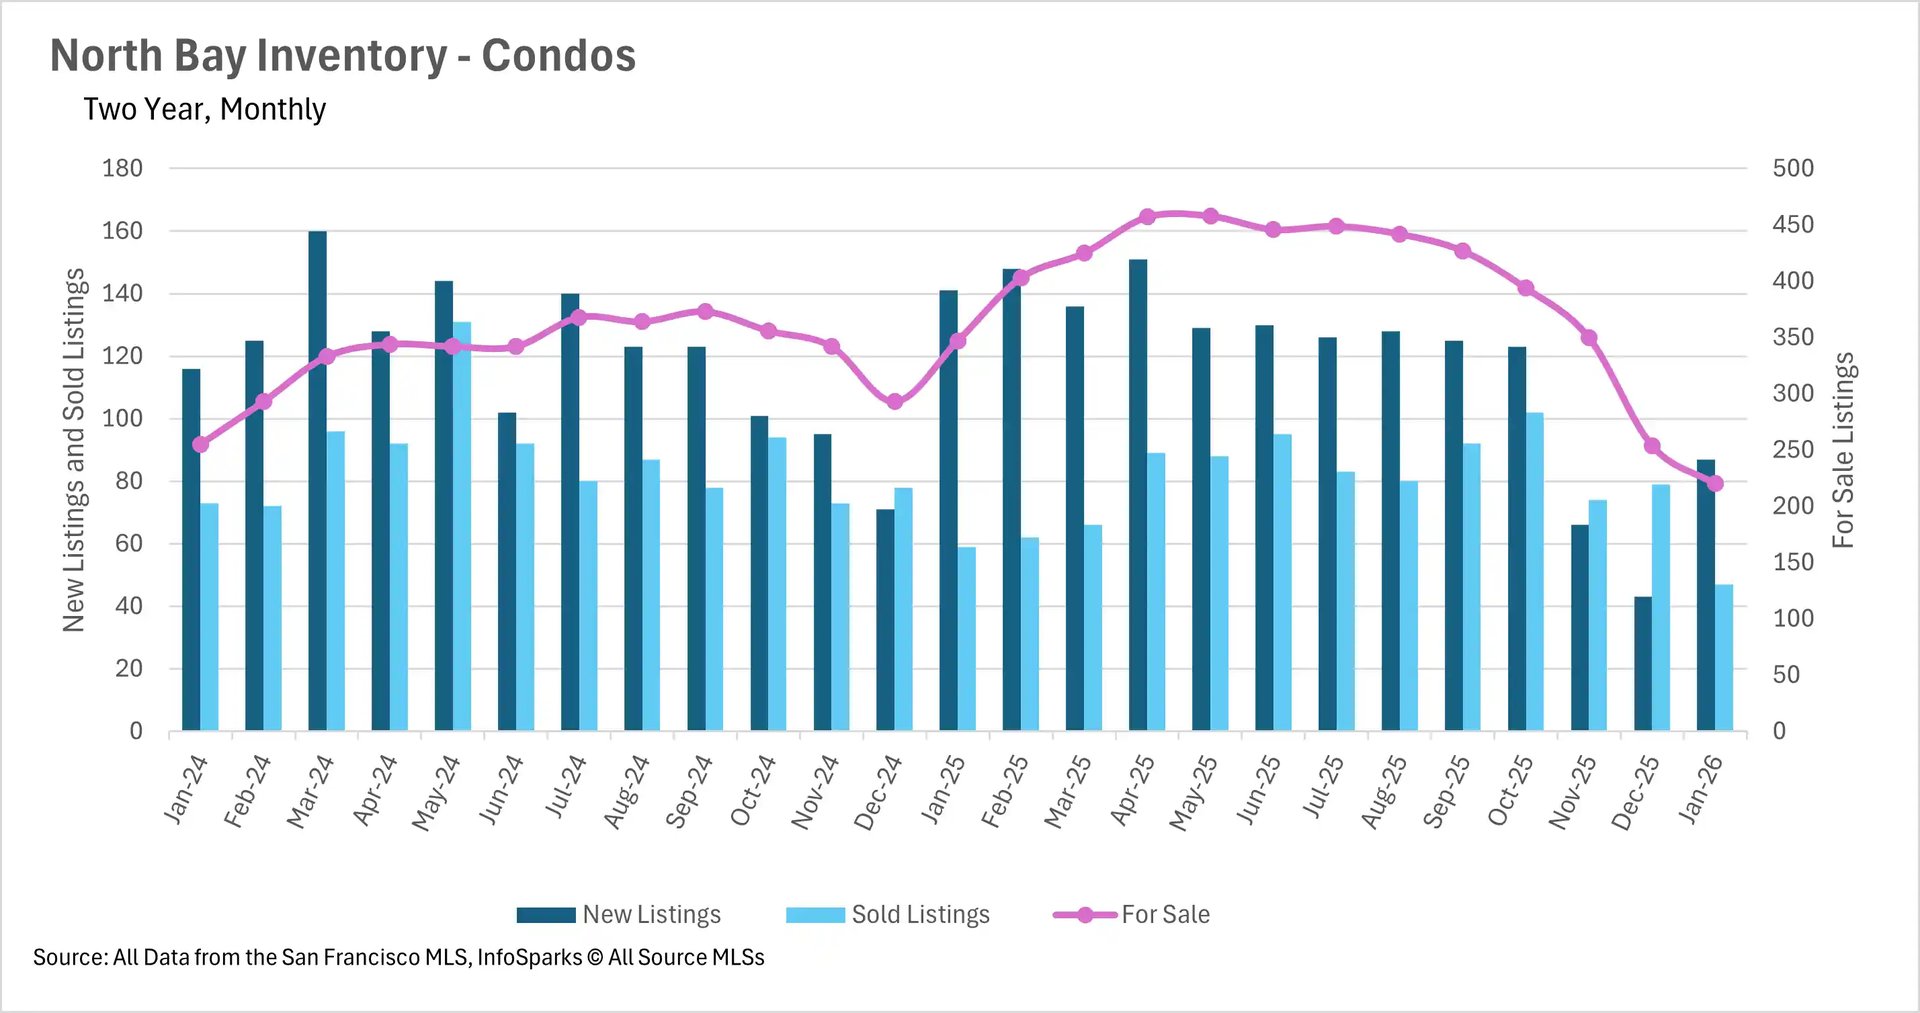
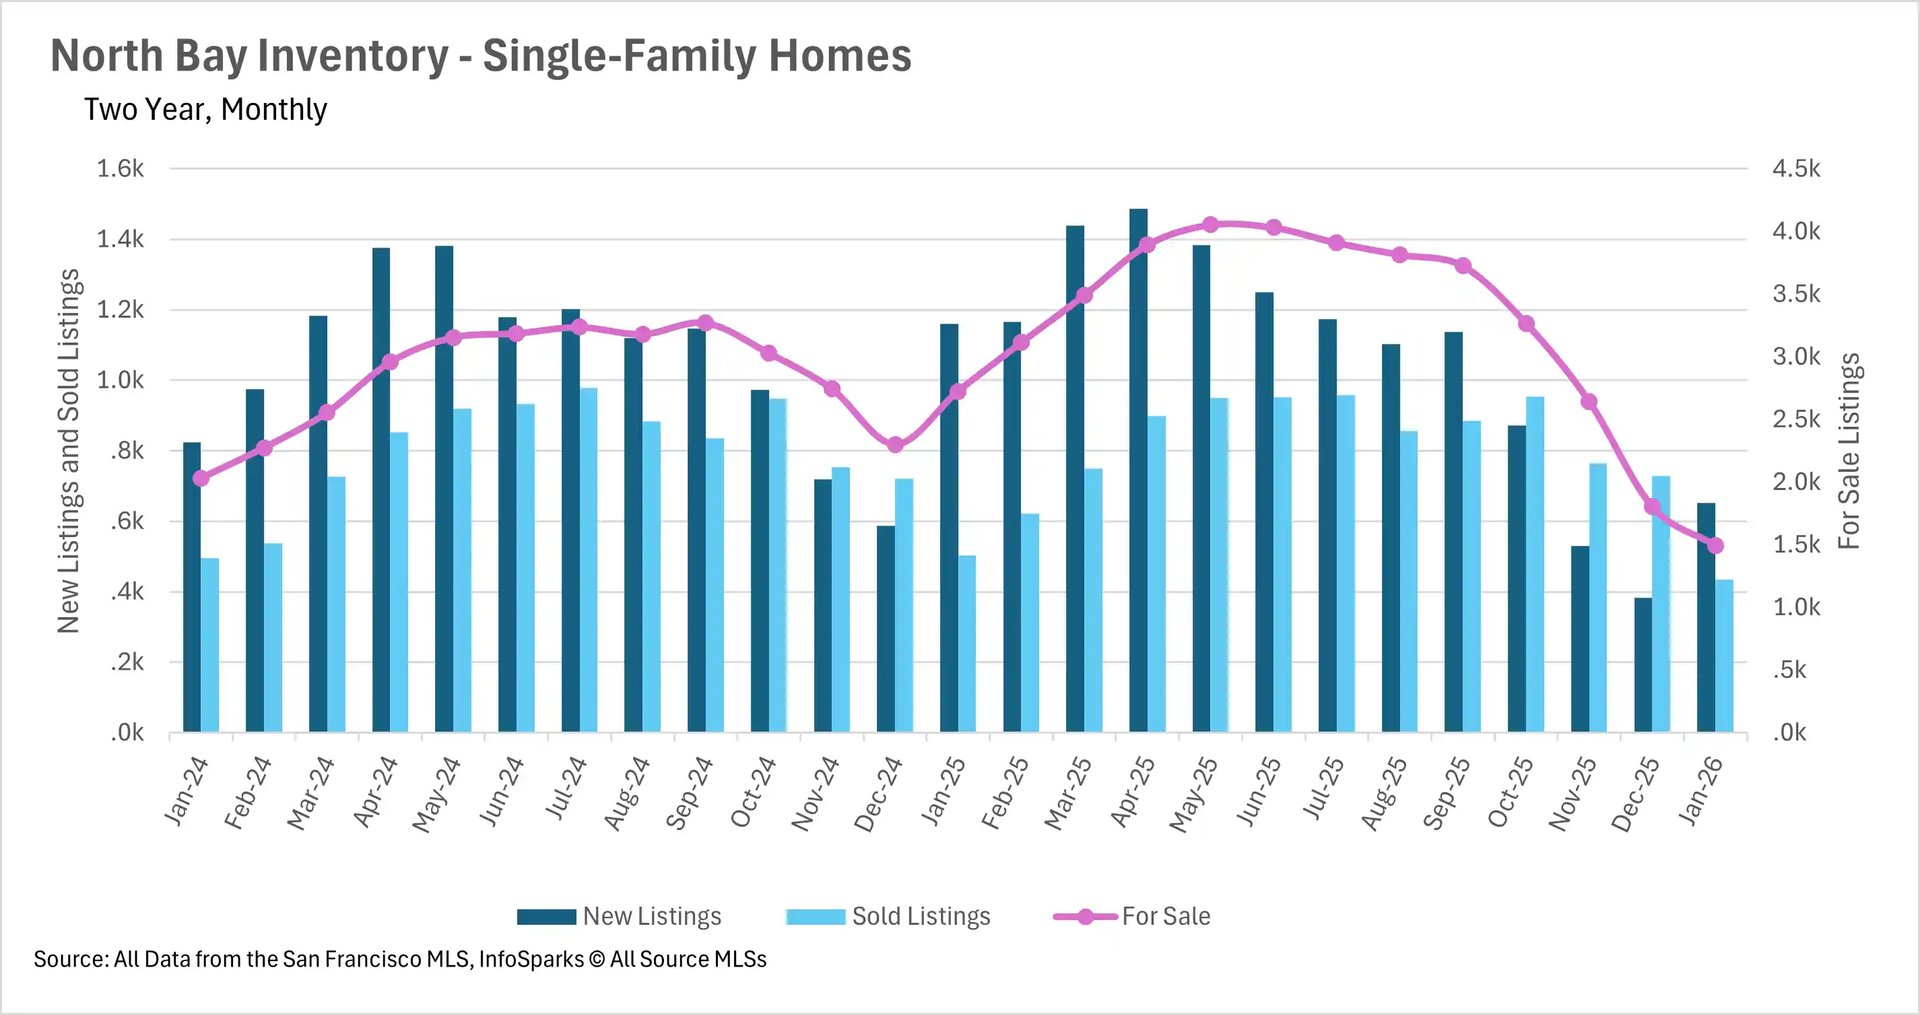
Inventory has reached critically low levels throughout the Bay Area
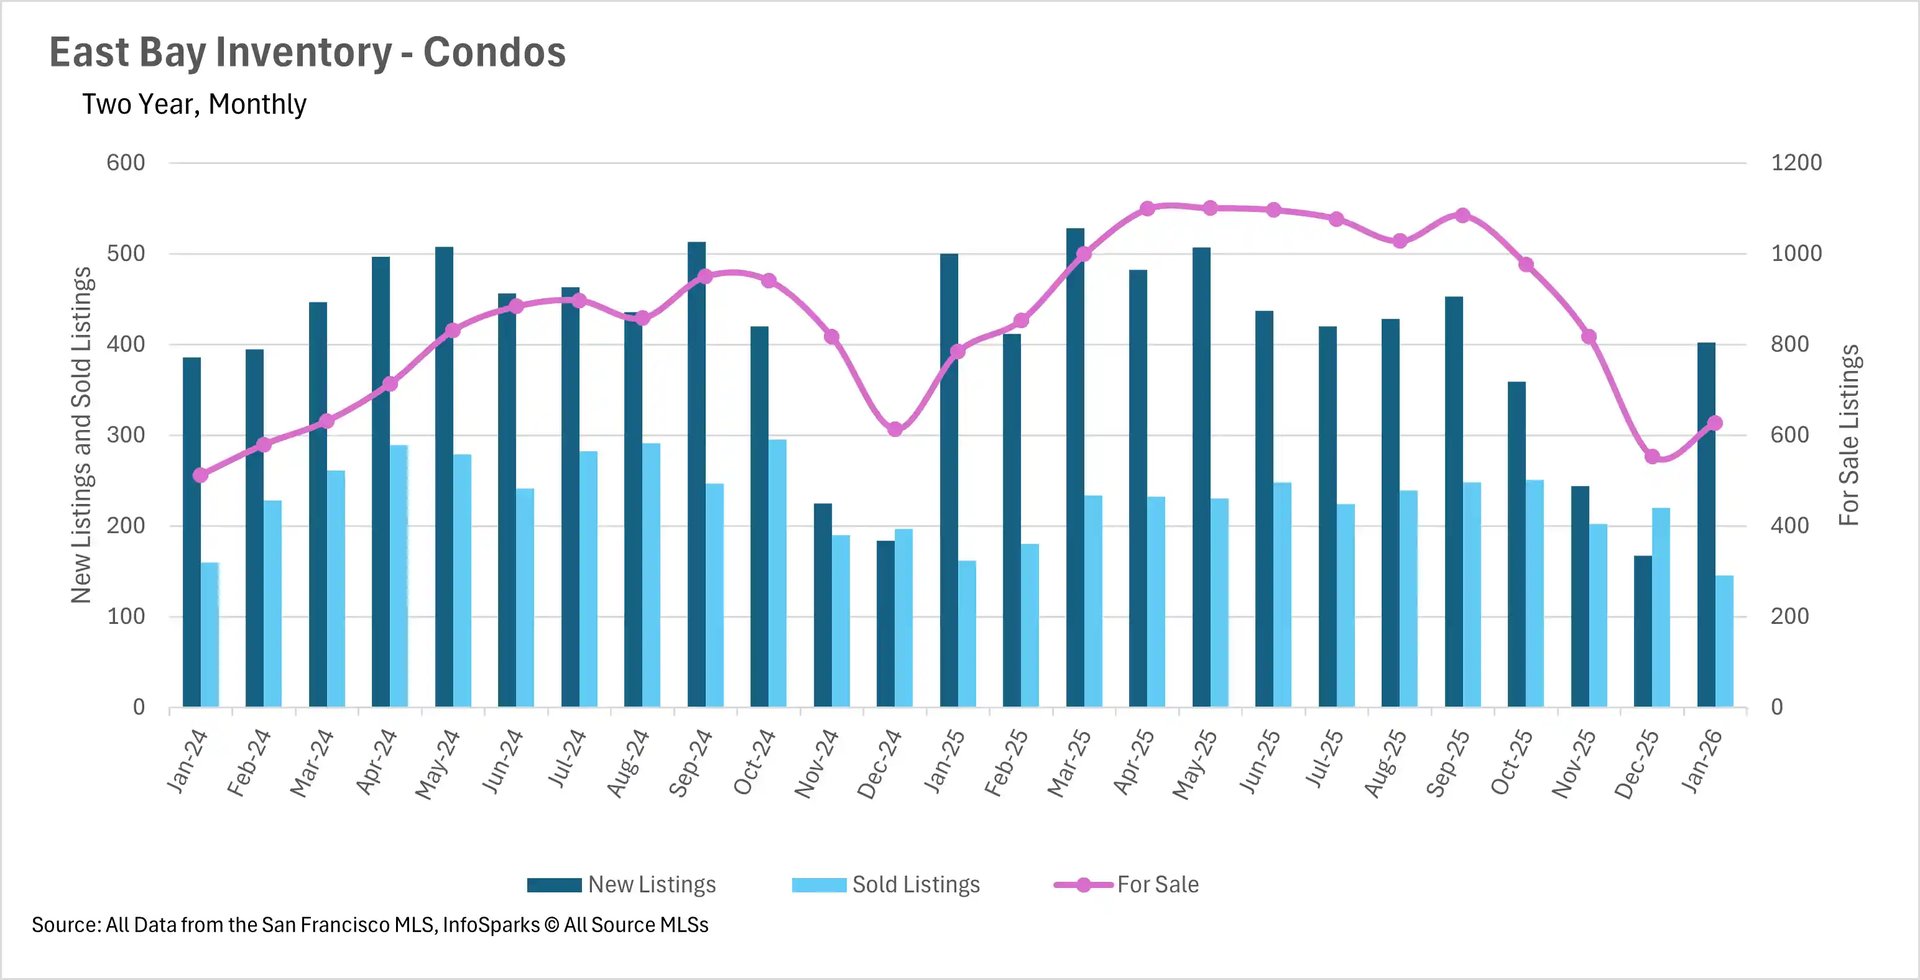
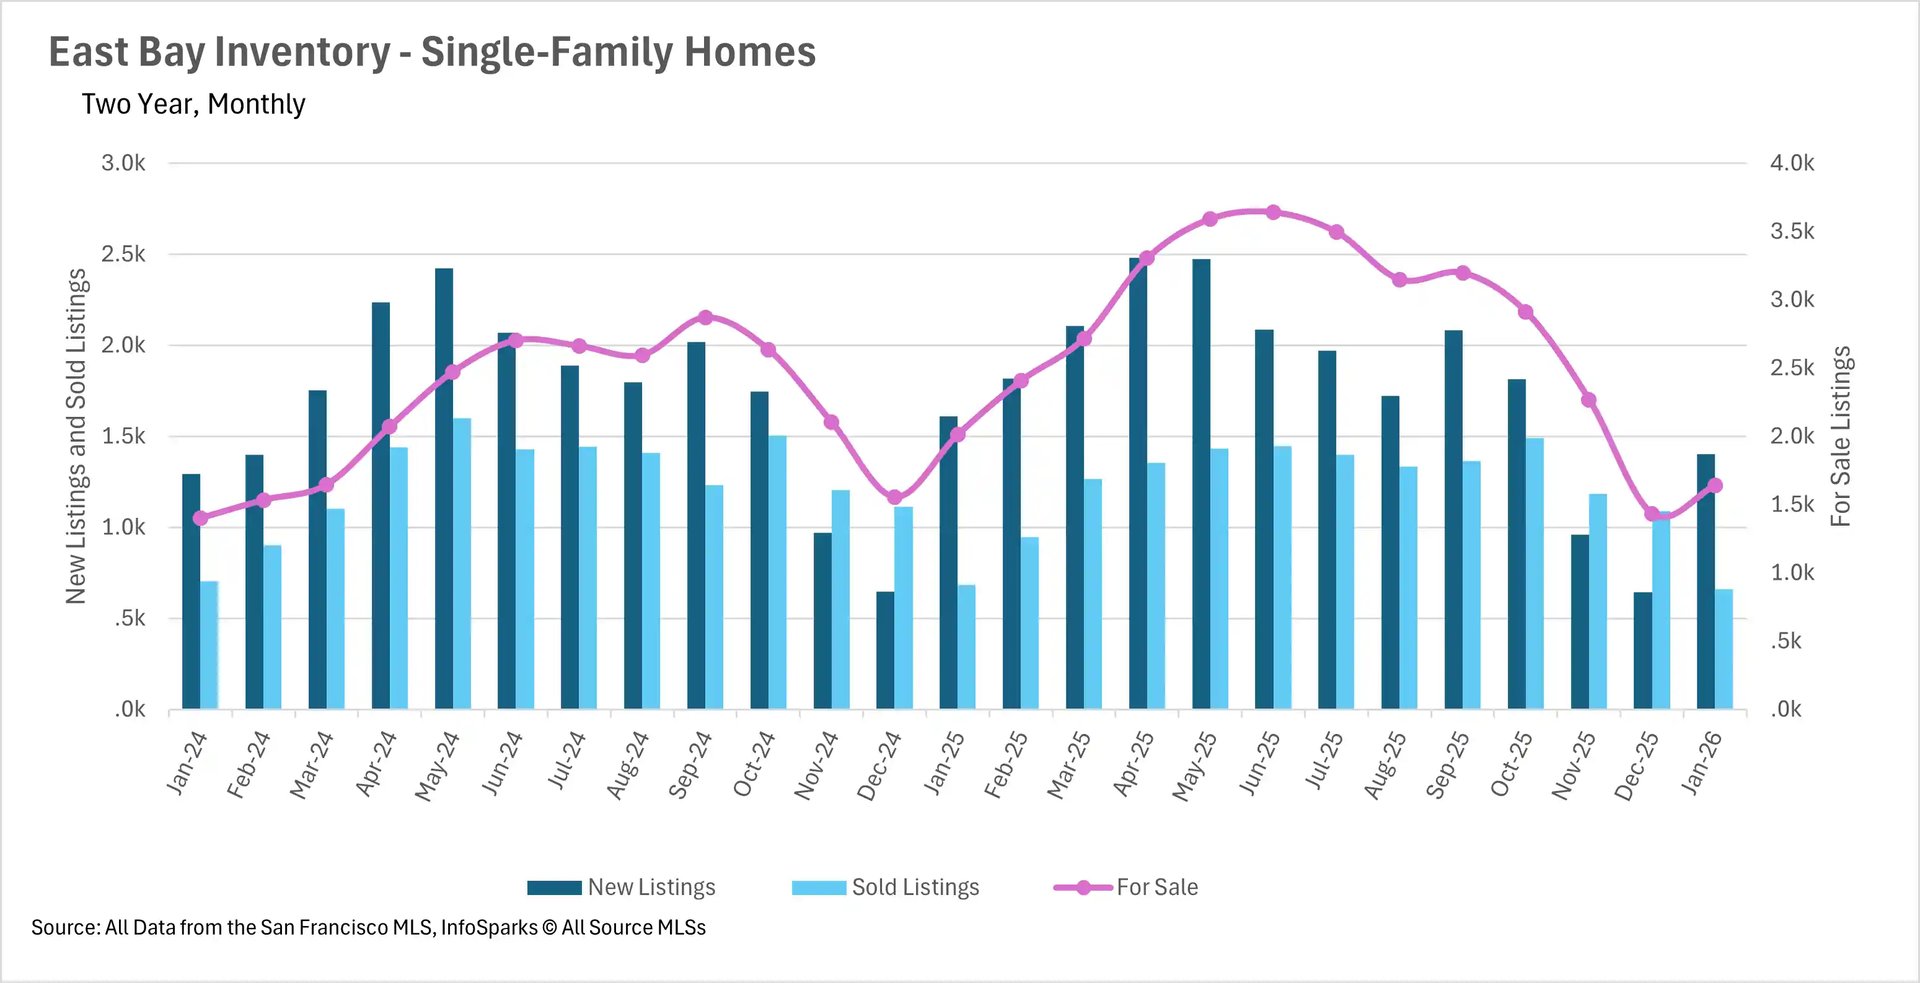
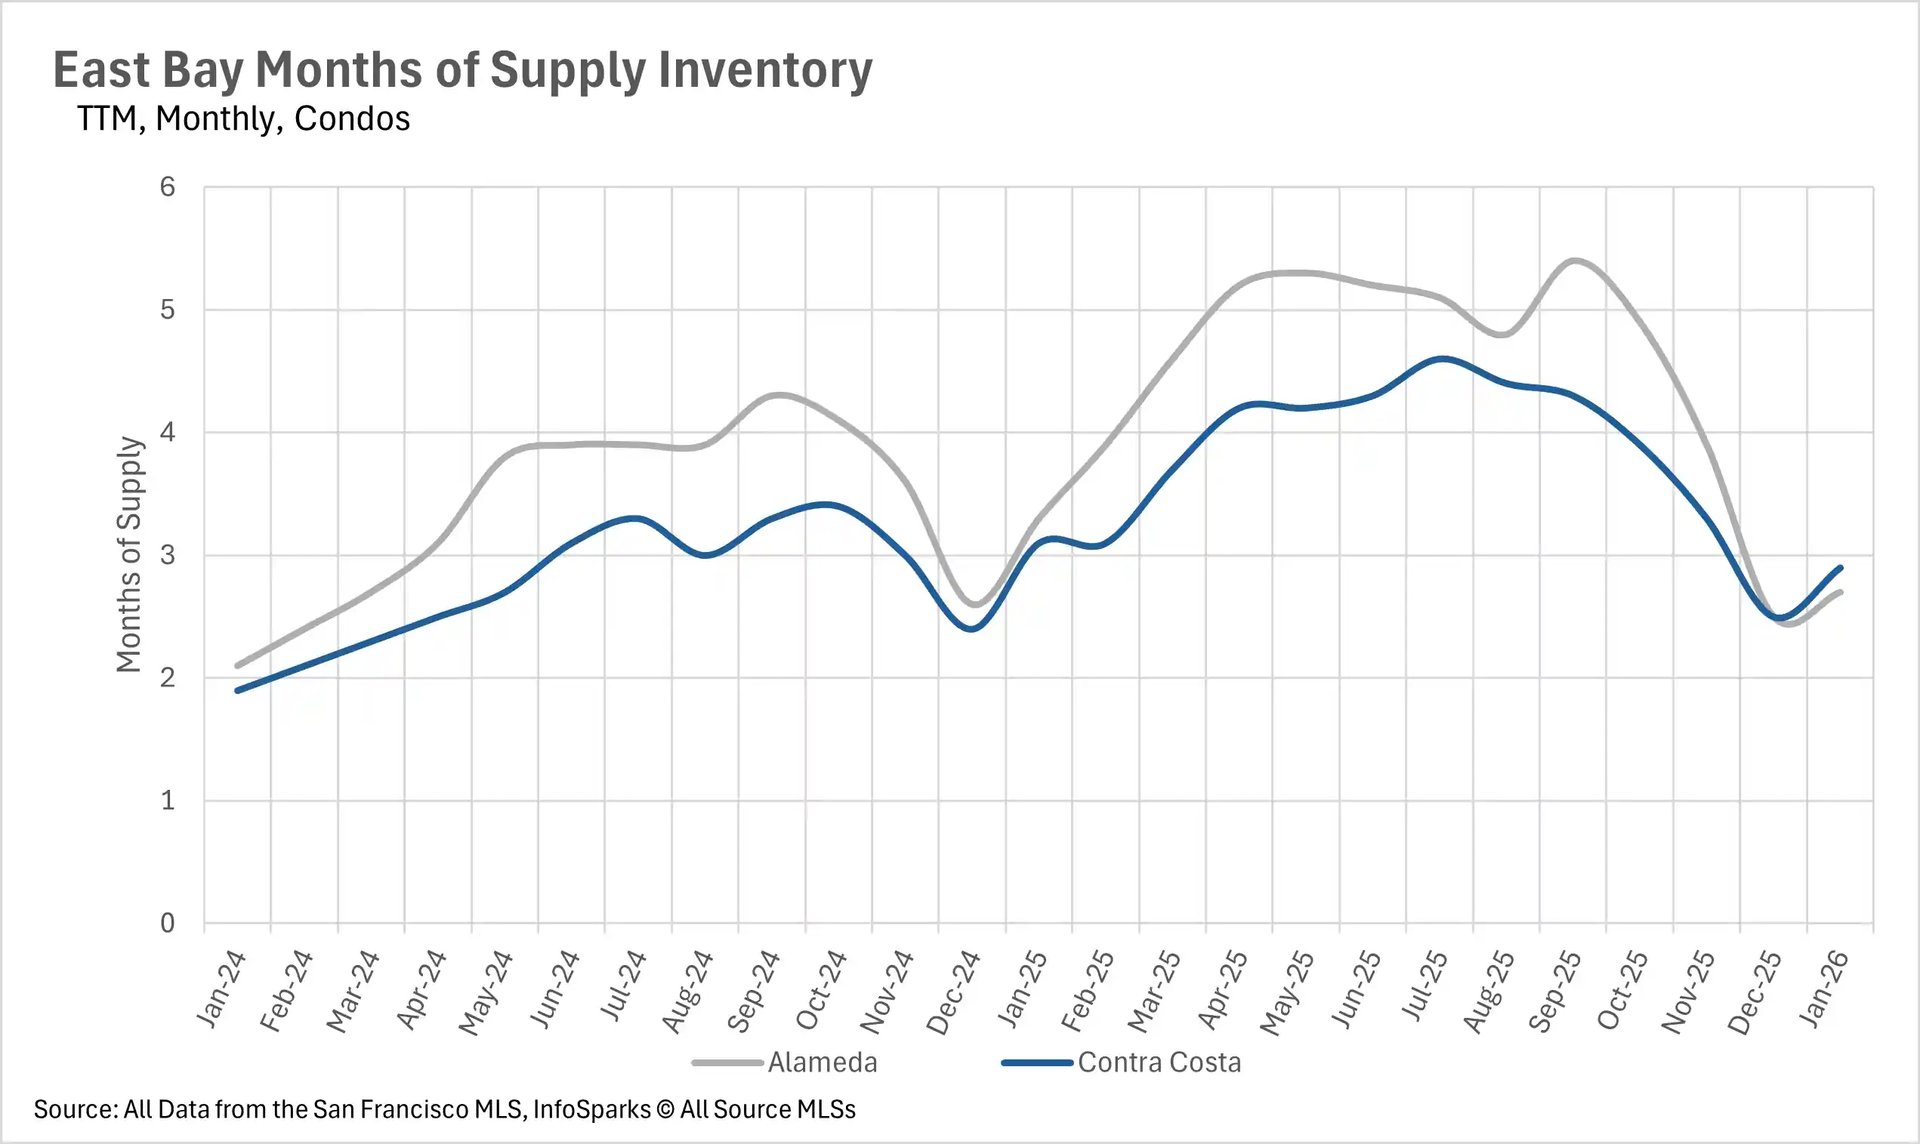
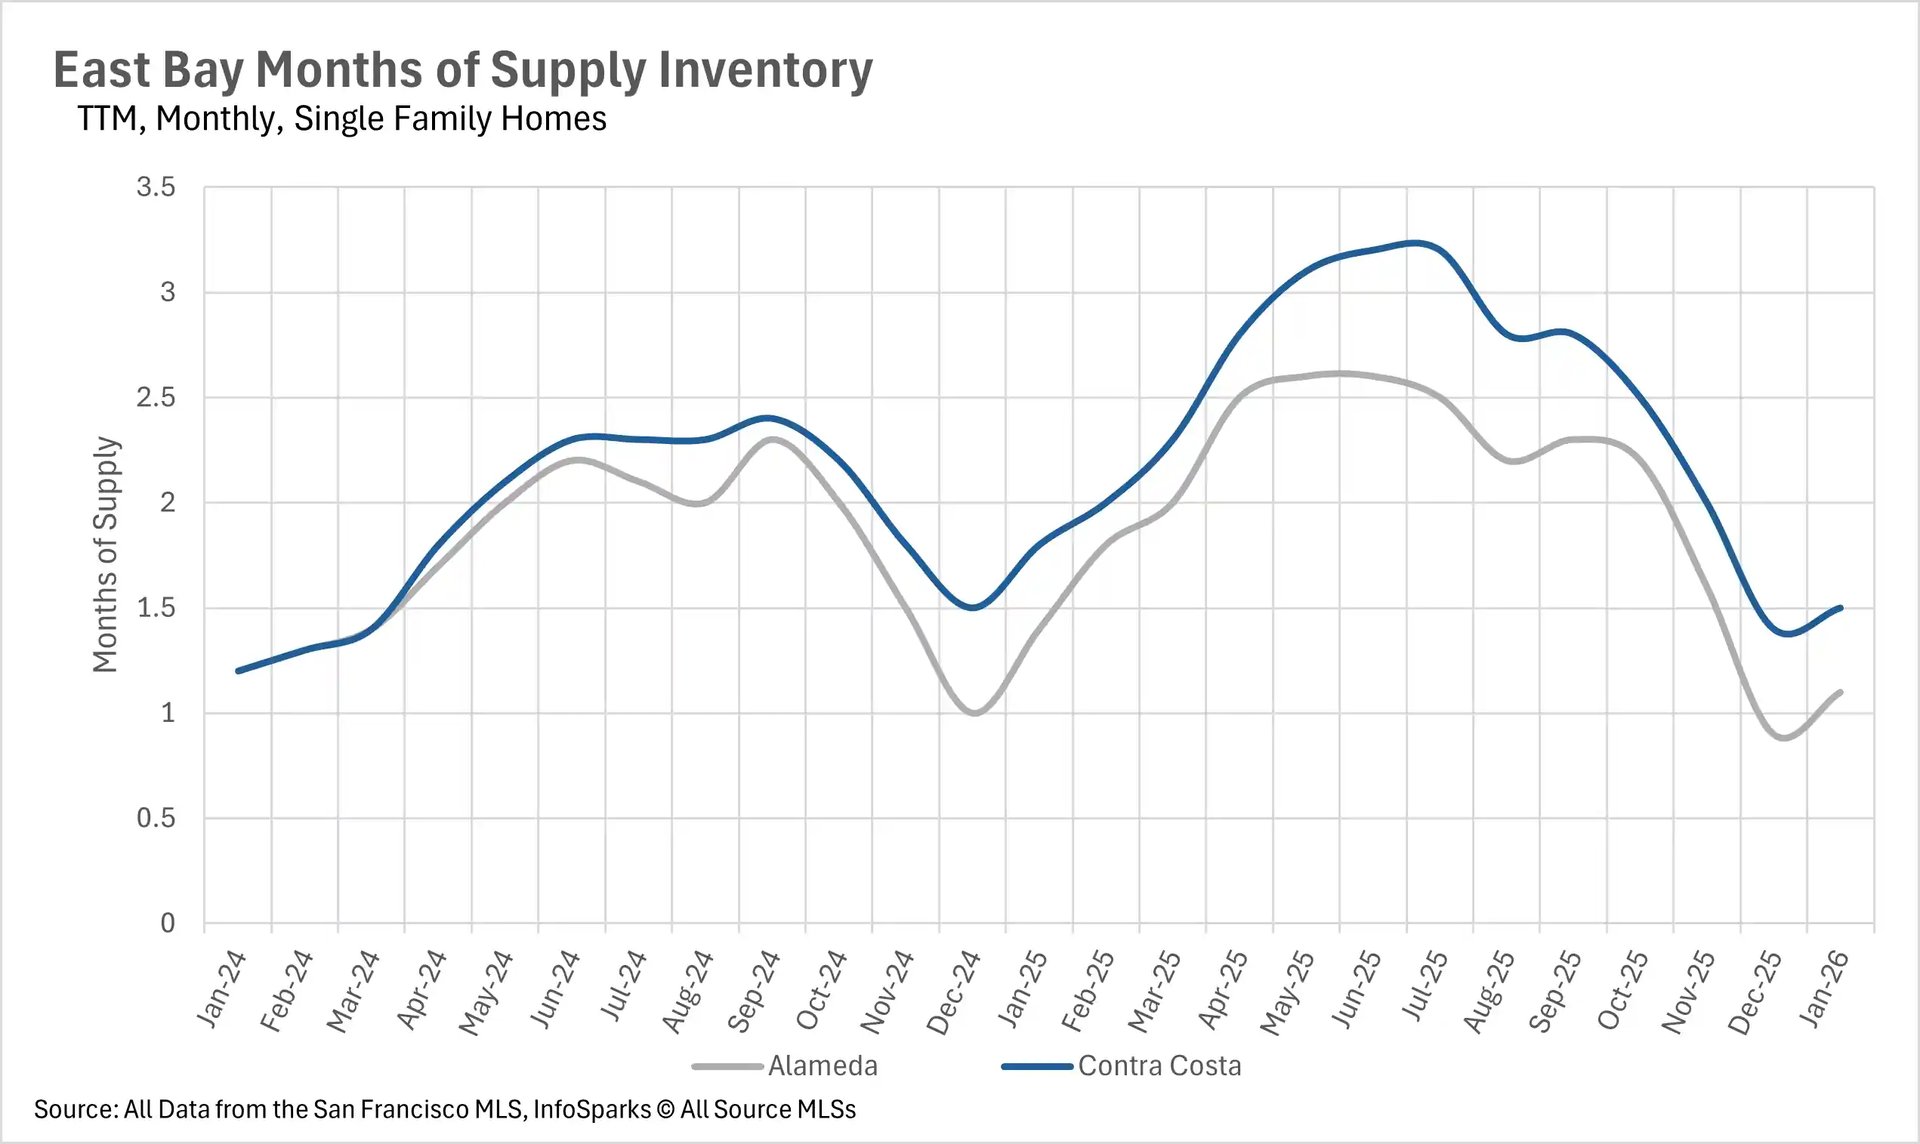
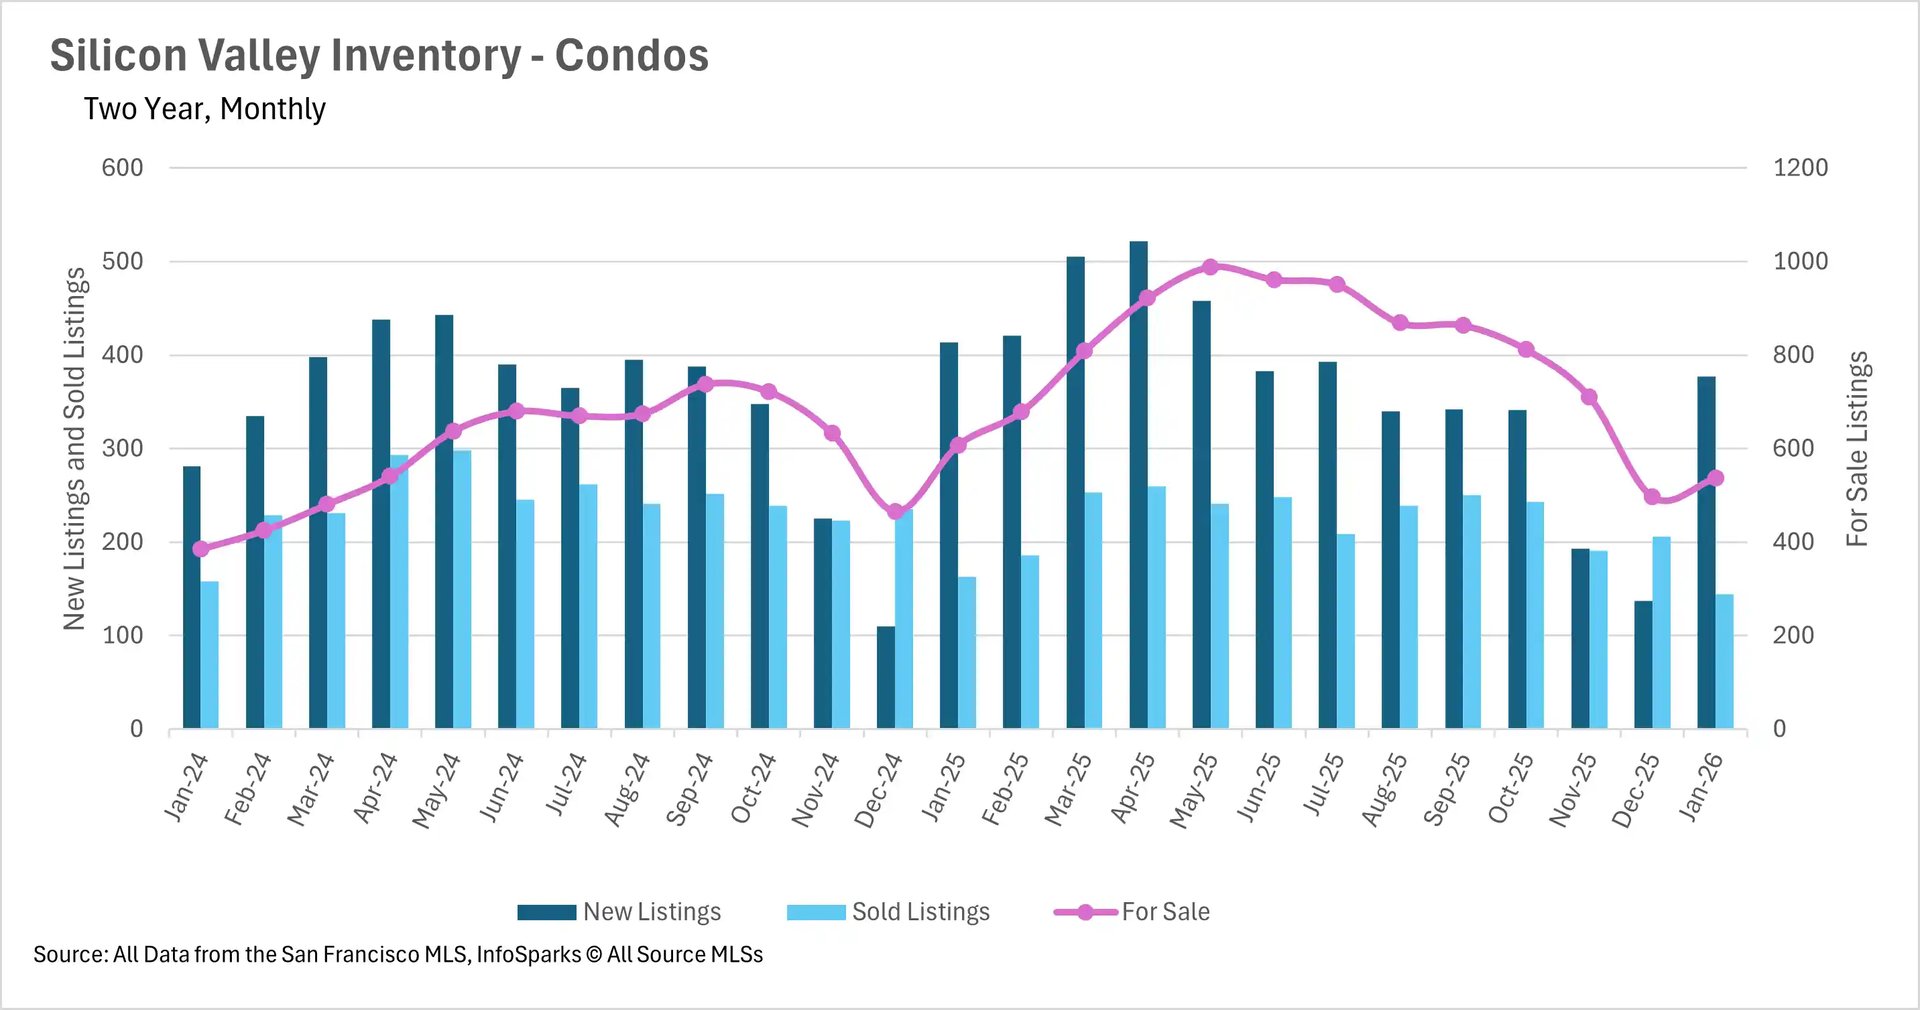
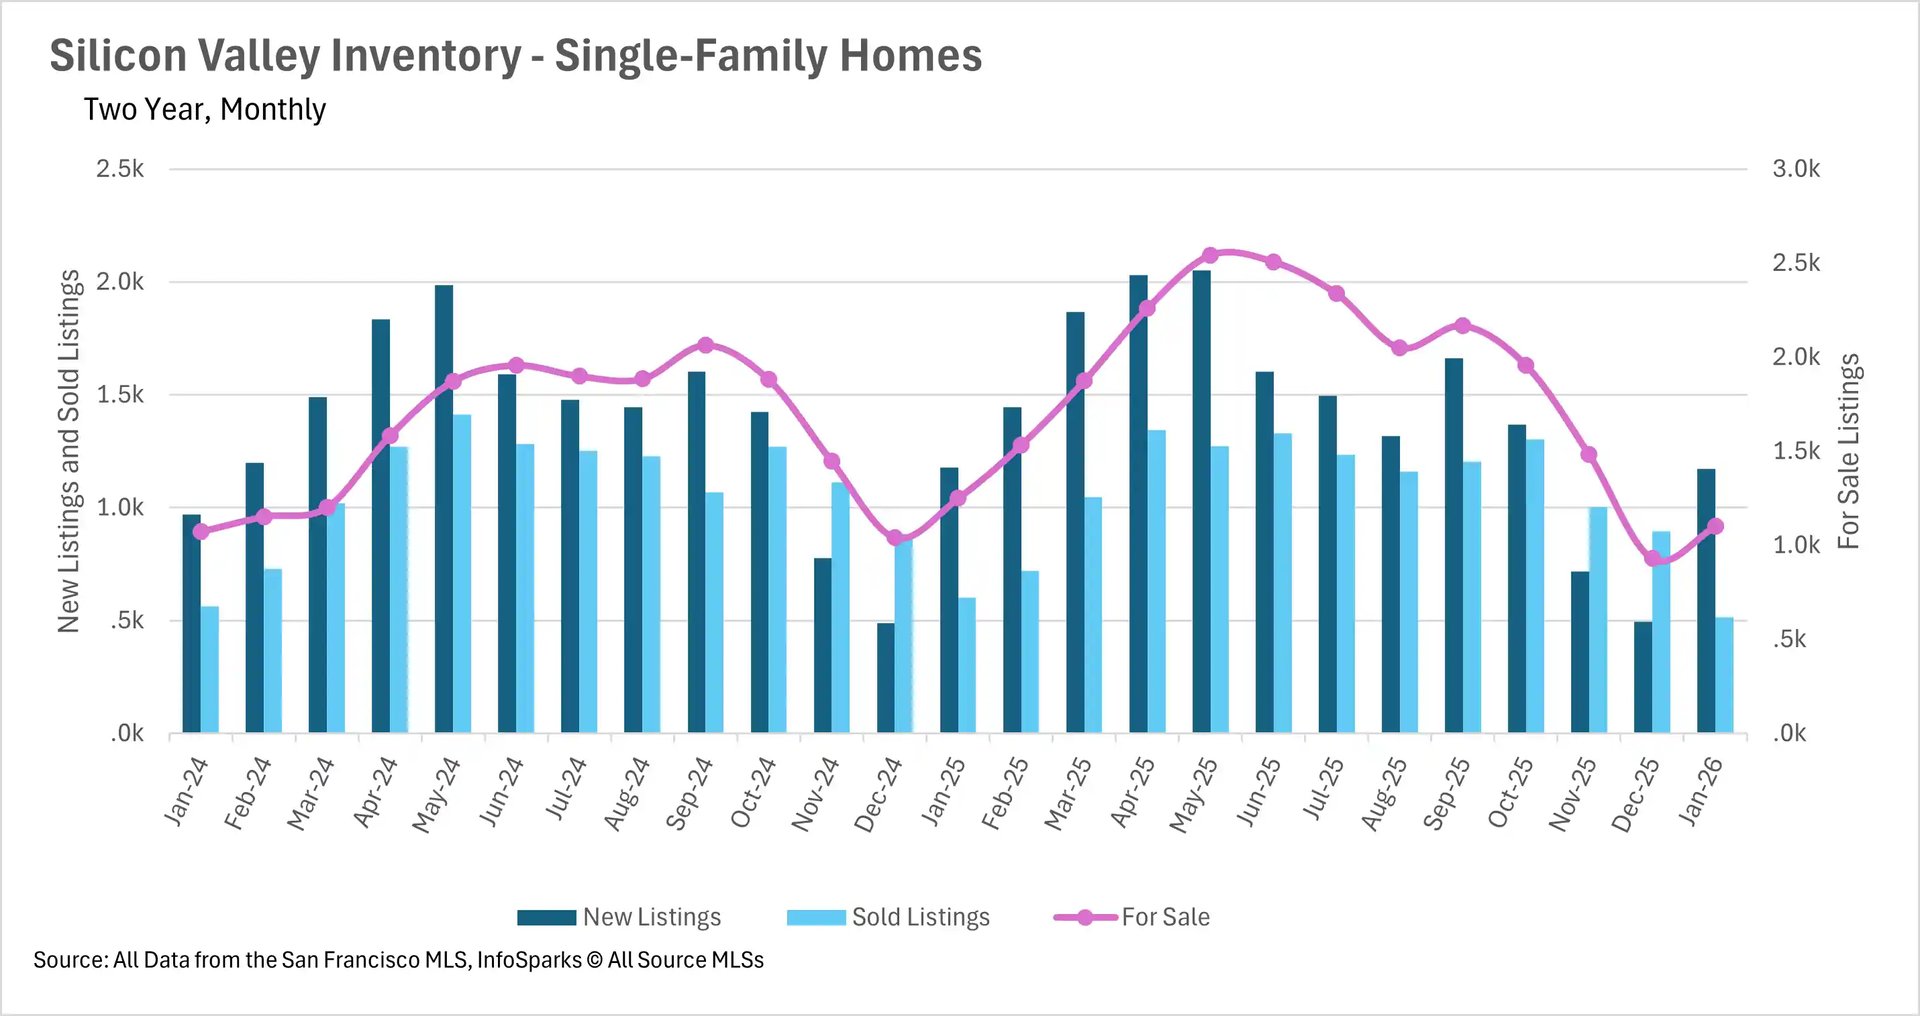
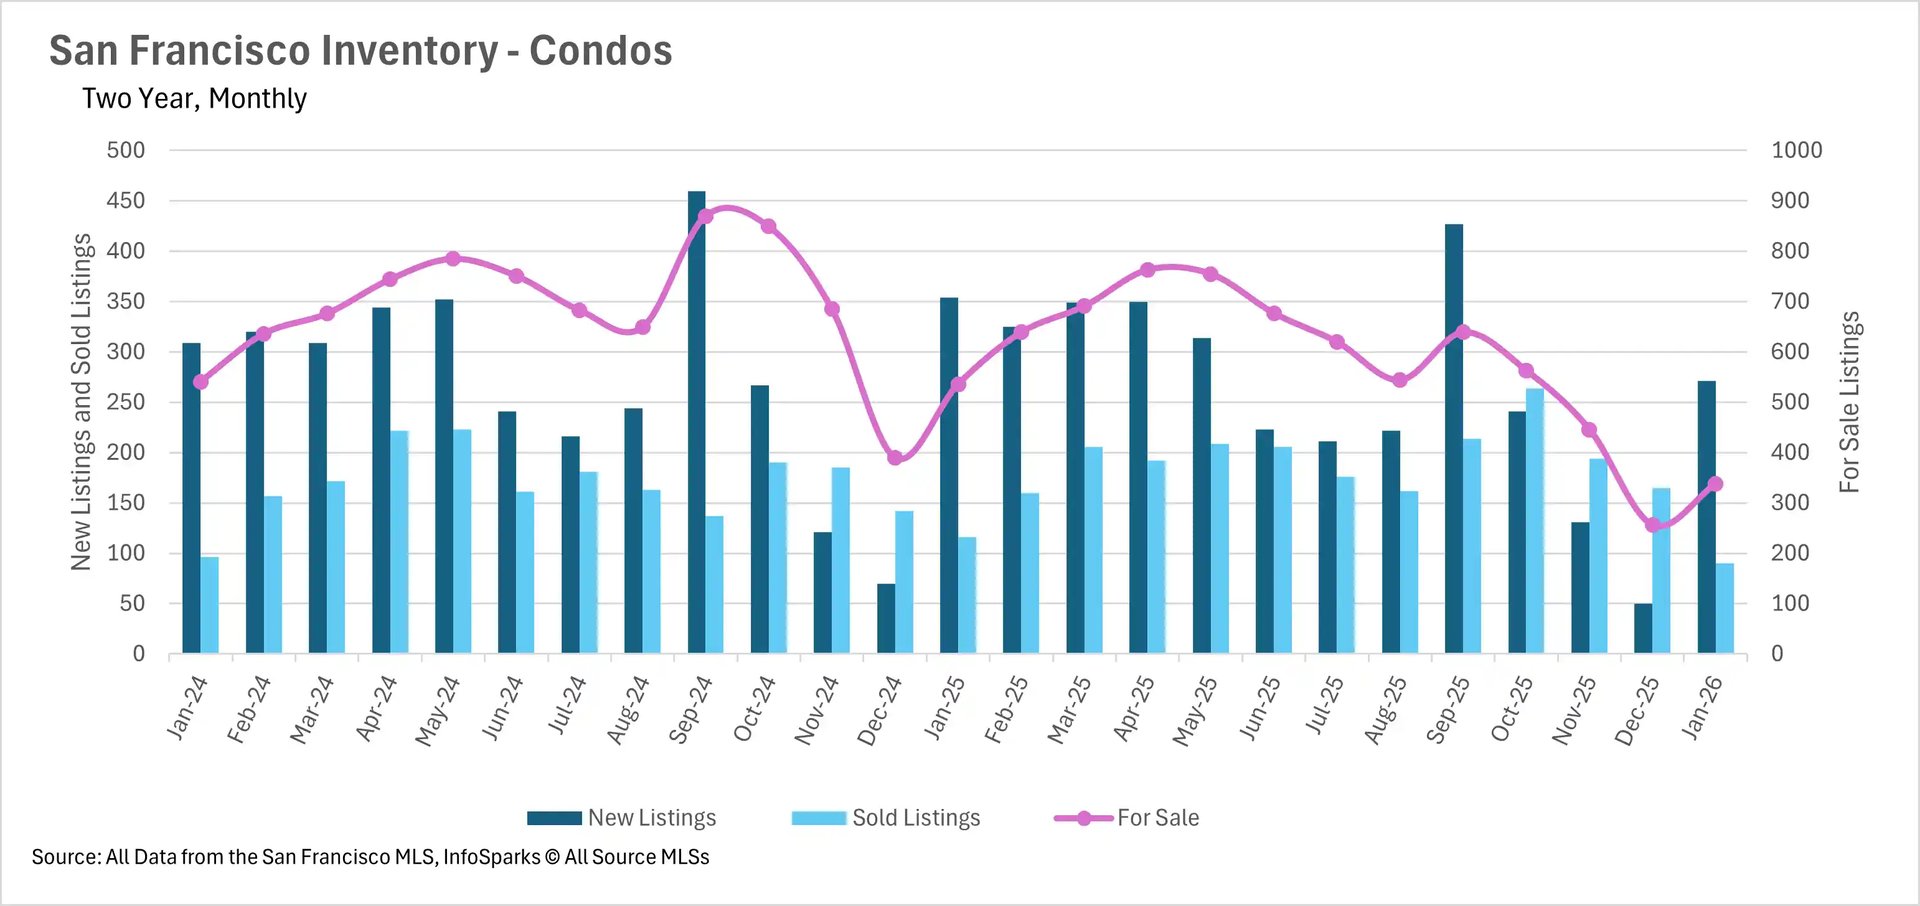
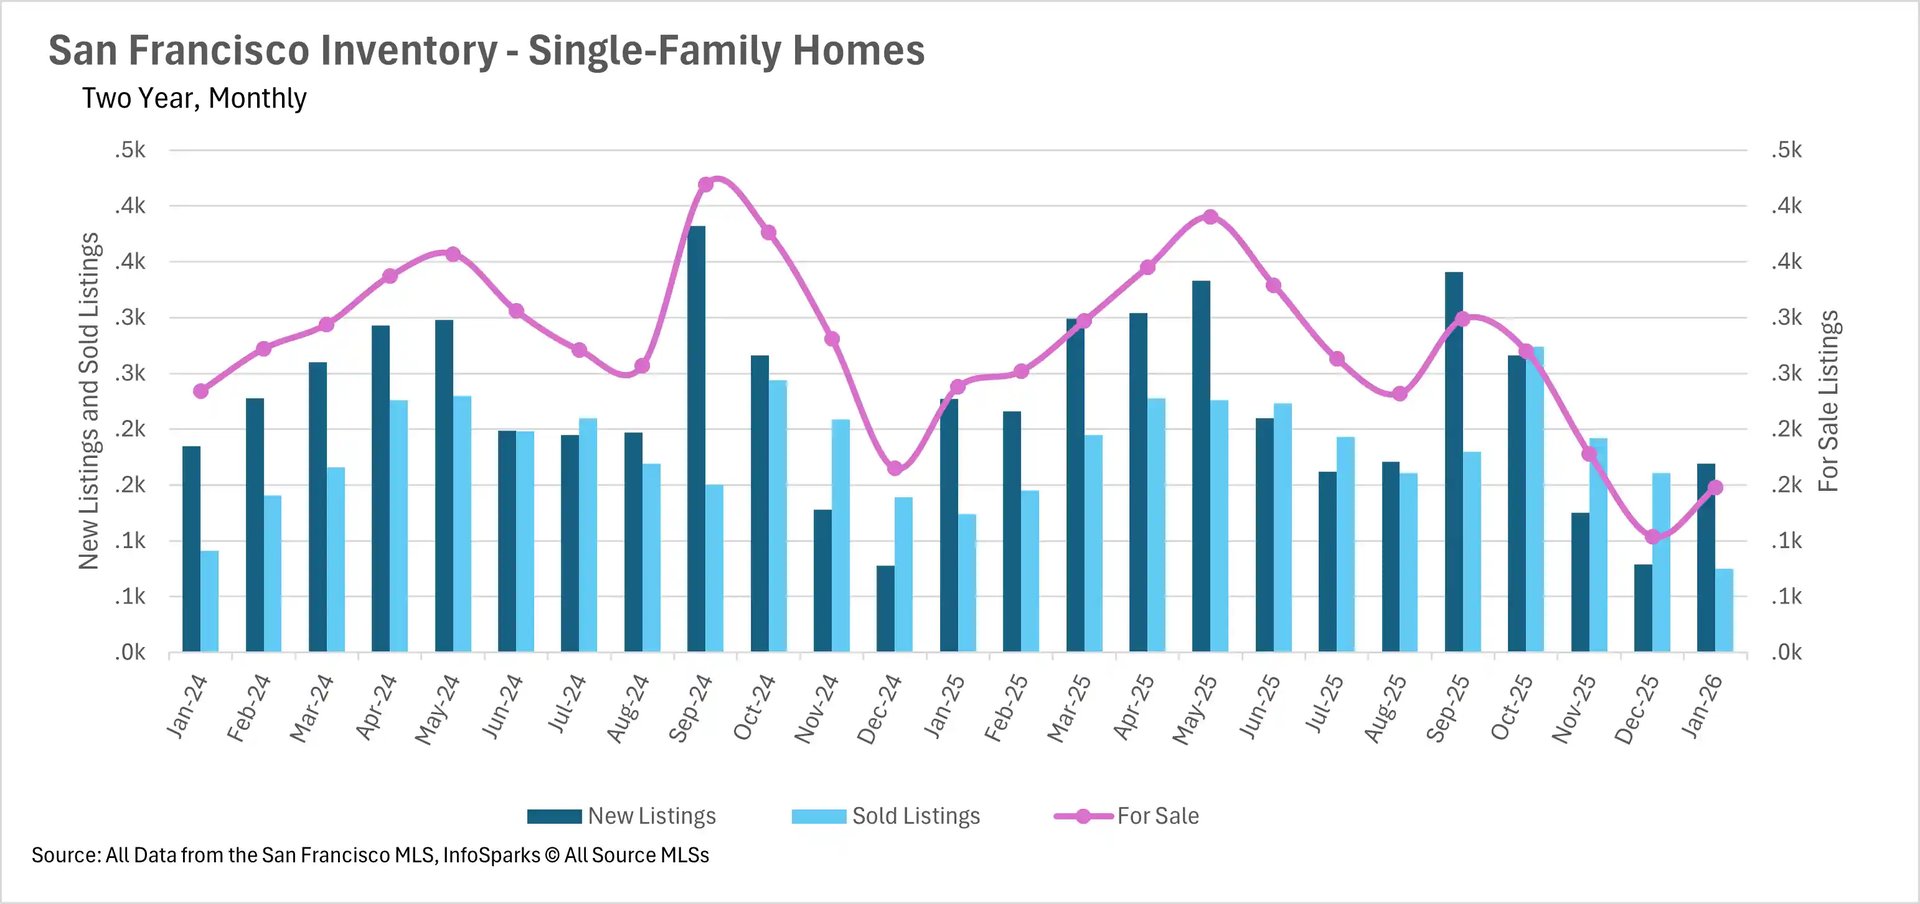
One of the biggest stories heading into 2026 is the dramatic decline in inventory across the Bay Area. After inventories built up throughout the spring and summer of 2025, the correction has been swift and severe. The North Bay saw the most dramatic contraction, with single-family home inventory plummeting 45.19% on a year-over-year basis and condo inventory dropping 36.60%. San Francisco isn't far behind, with single-family inventory down 37.82% and condo inventory down 36.94%, leaving fewer than 500 homes available for sale in the entire city. The East Bay saw declines of 18.58% for single-family homes and 20.03% for condos, while Silicon Valley's single-family inventory is down 12% year-over-year. New listings are beginning to pick up after the holiday slowdown, but they remain well below last year's levels in most markets. Until sellers begin entering the market in greater numbers, buyers will continue to face extremely limited options.
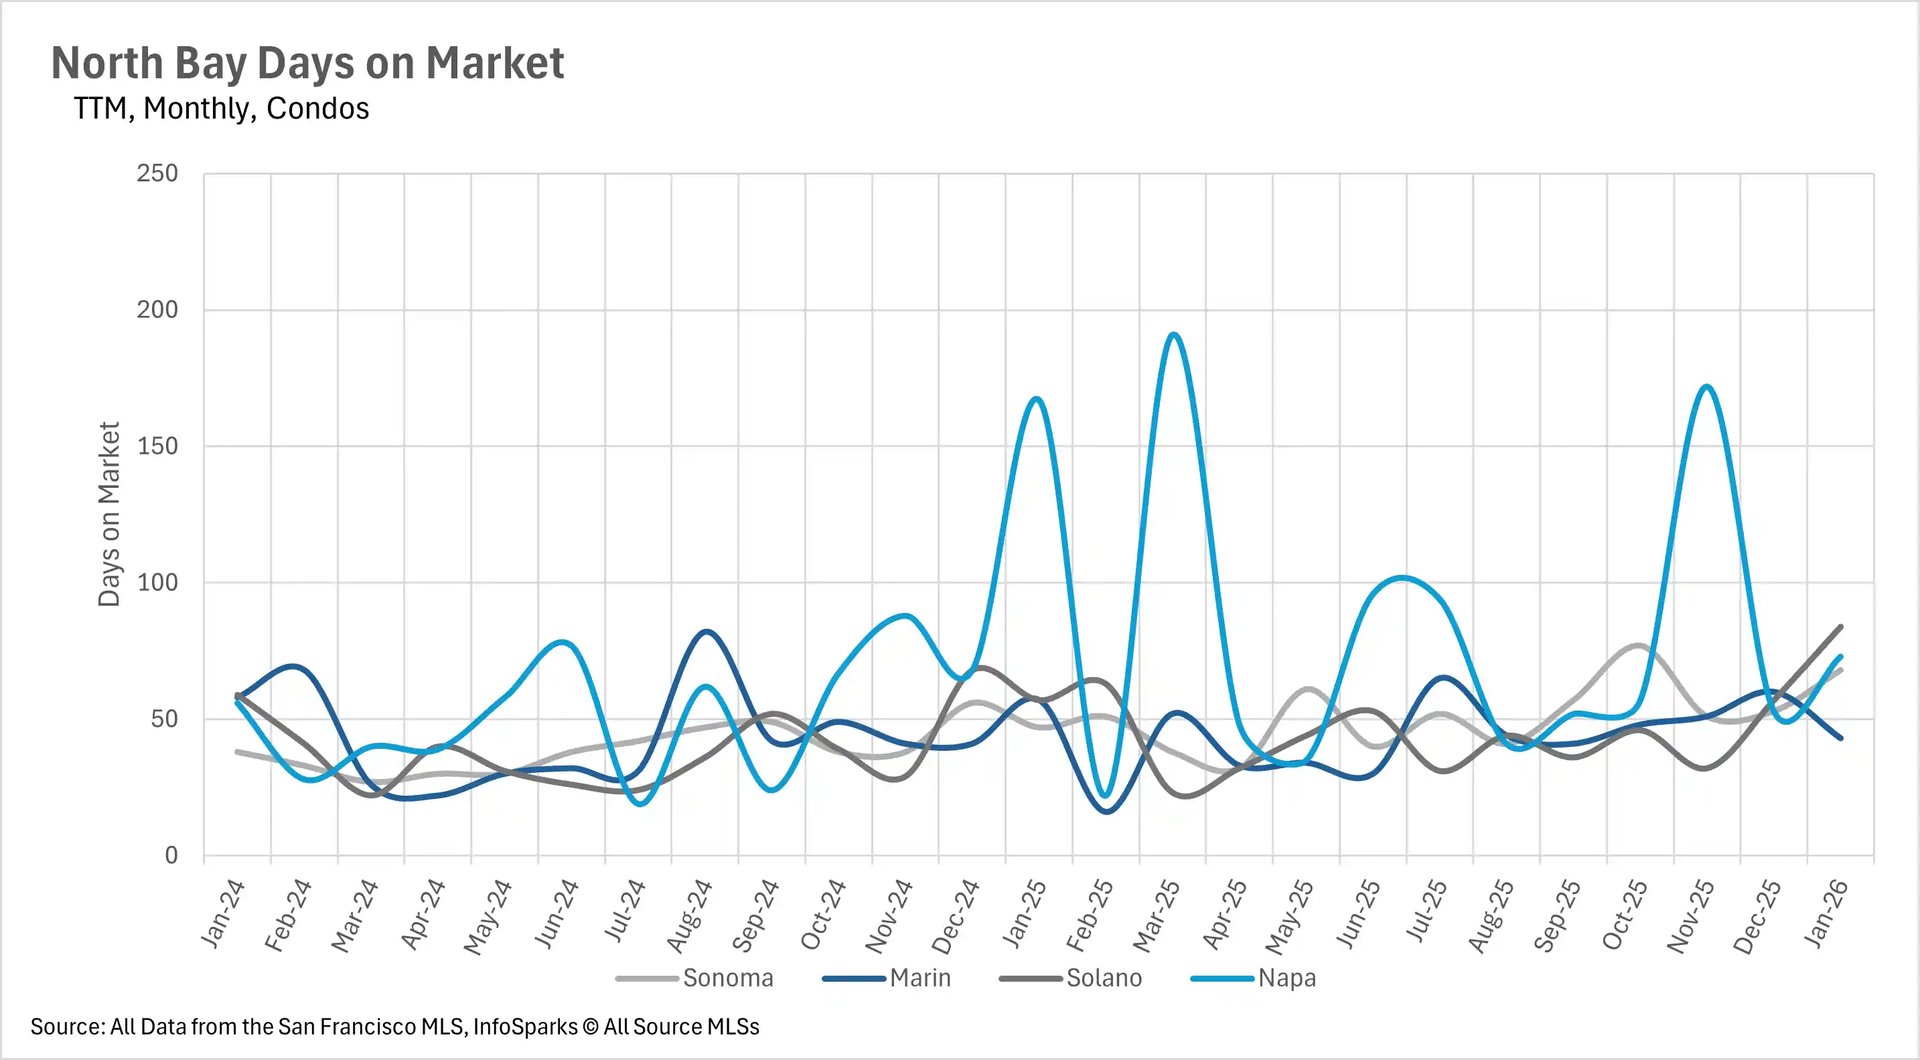
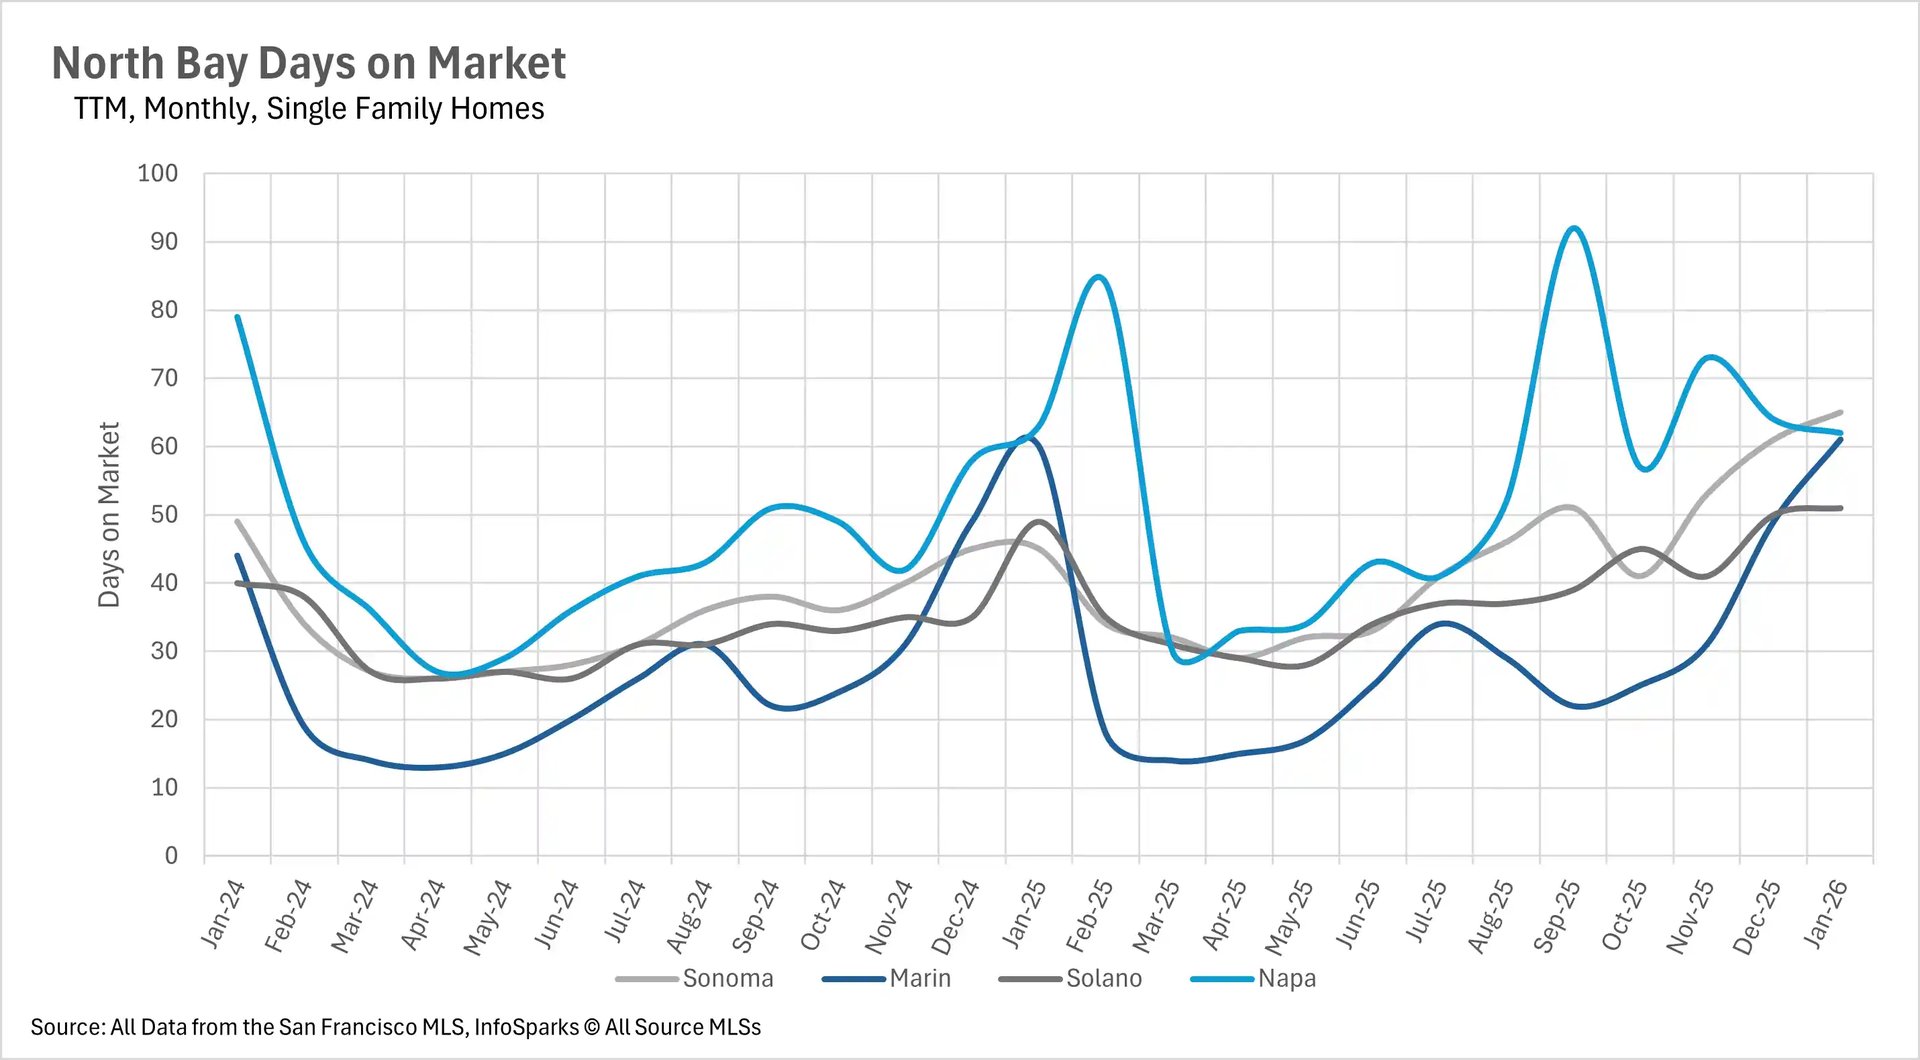
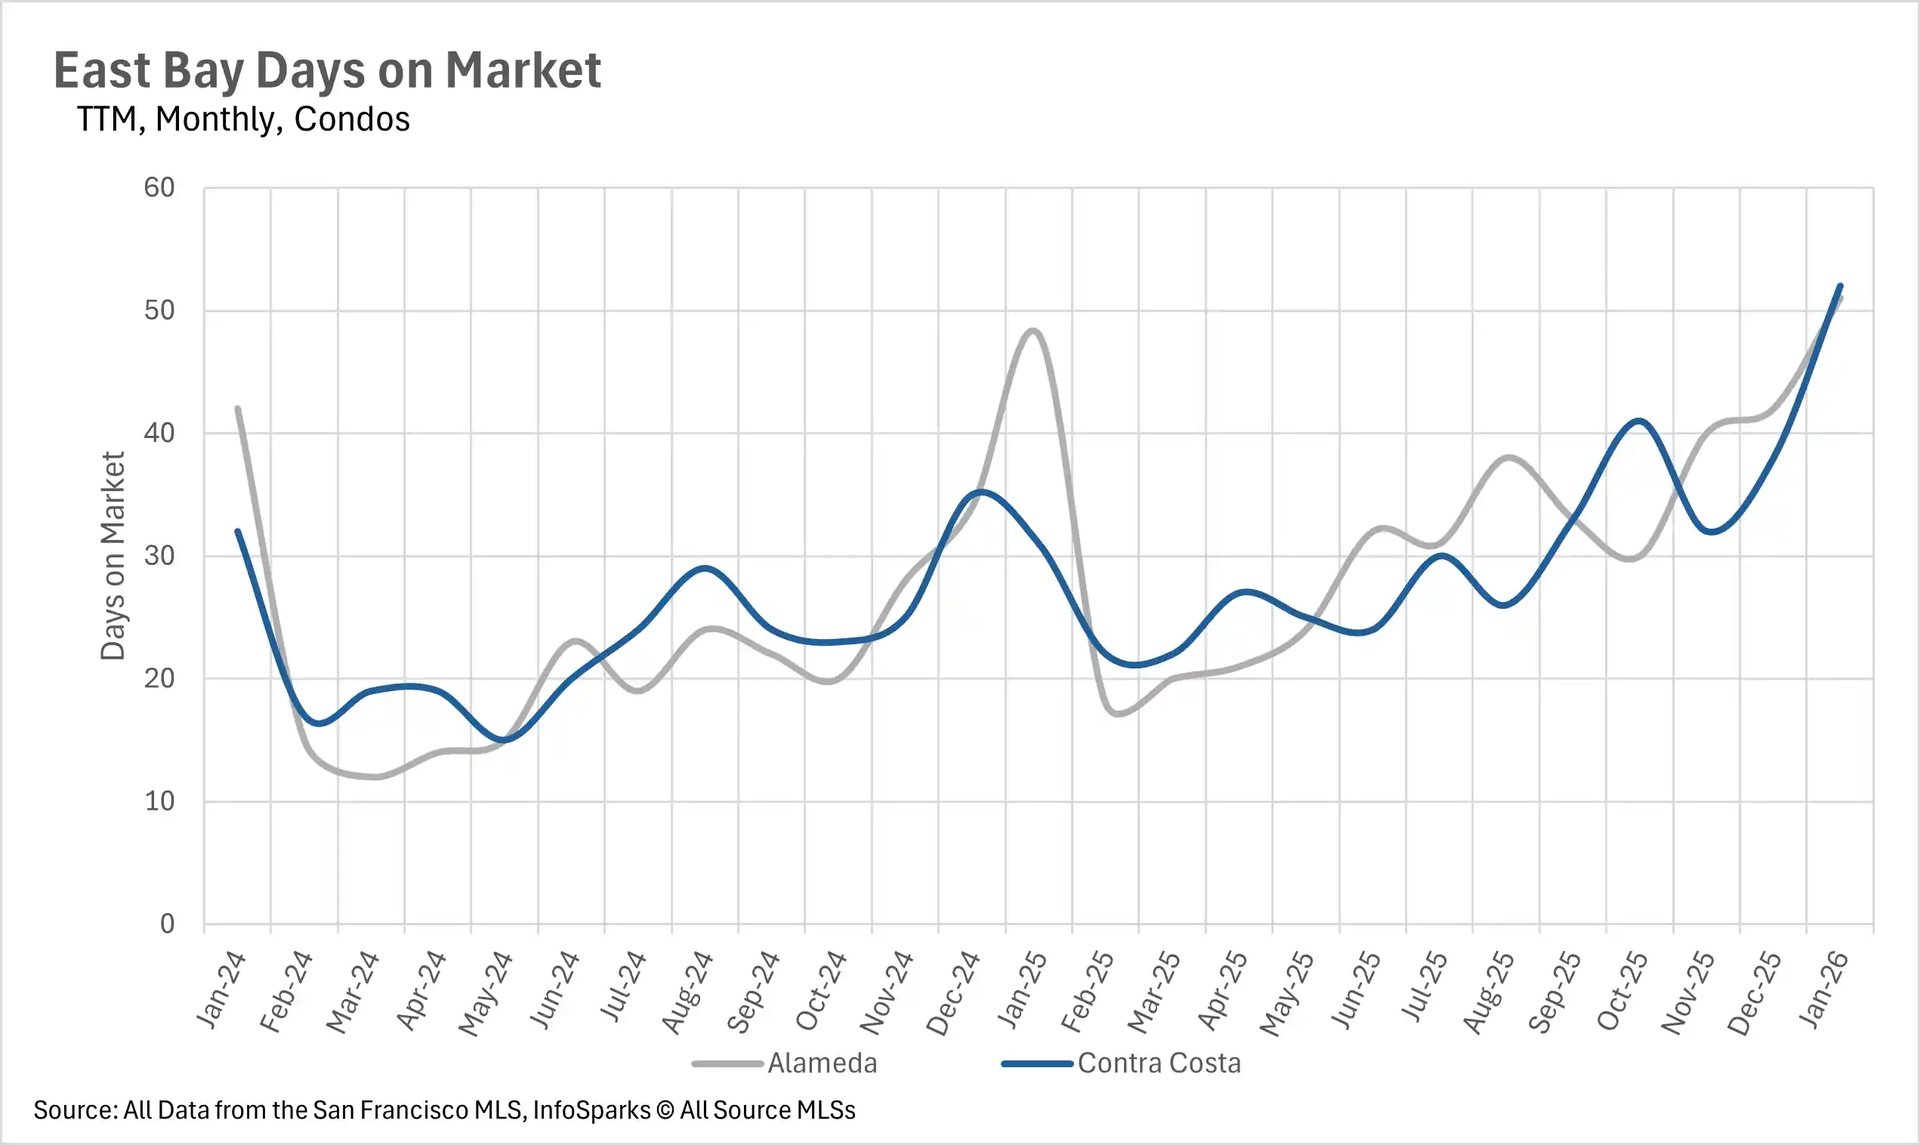
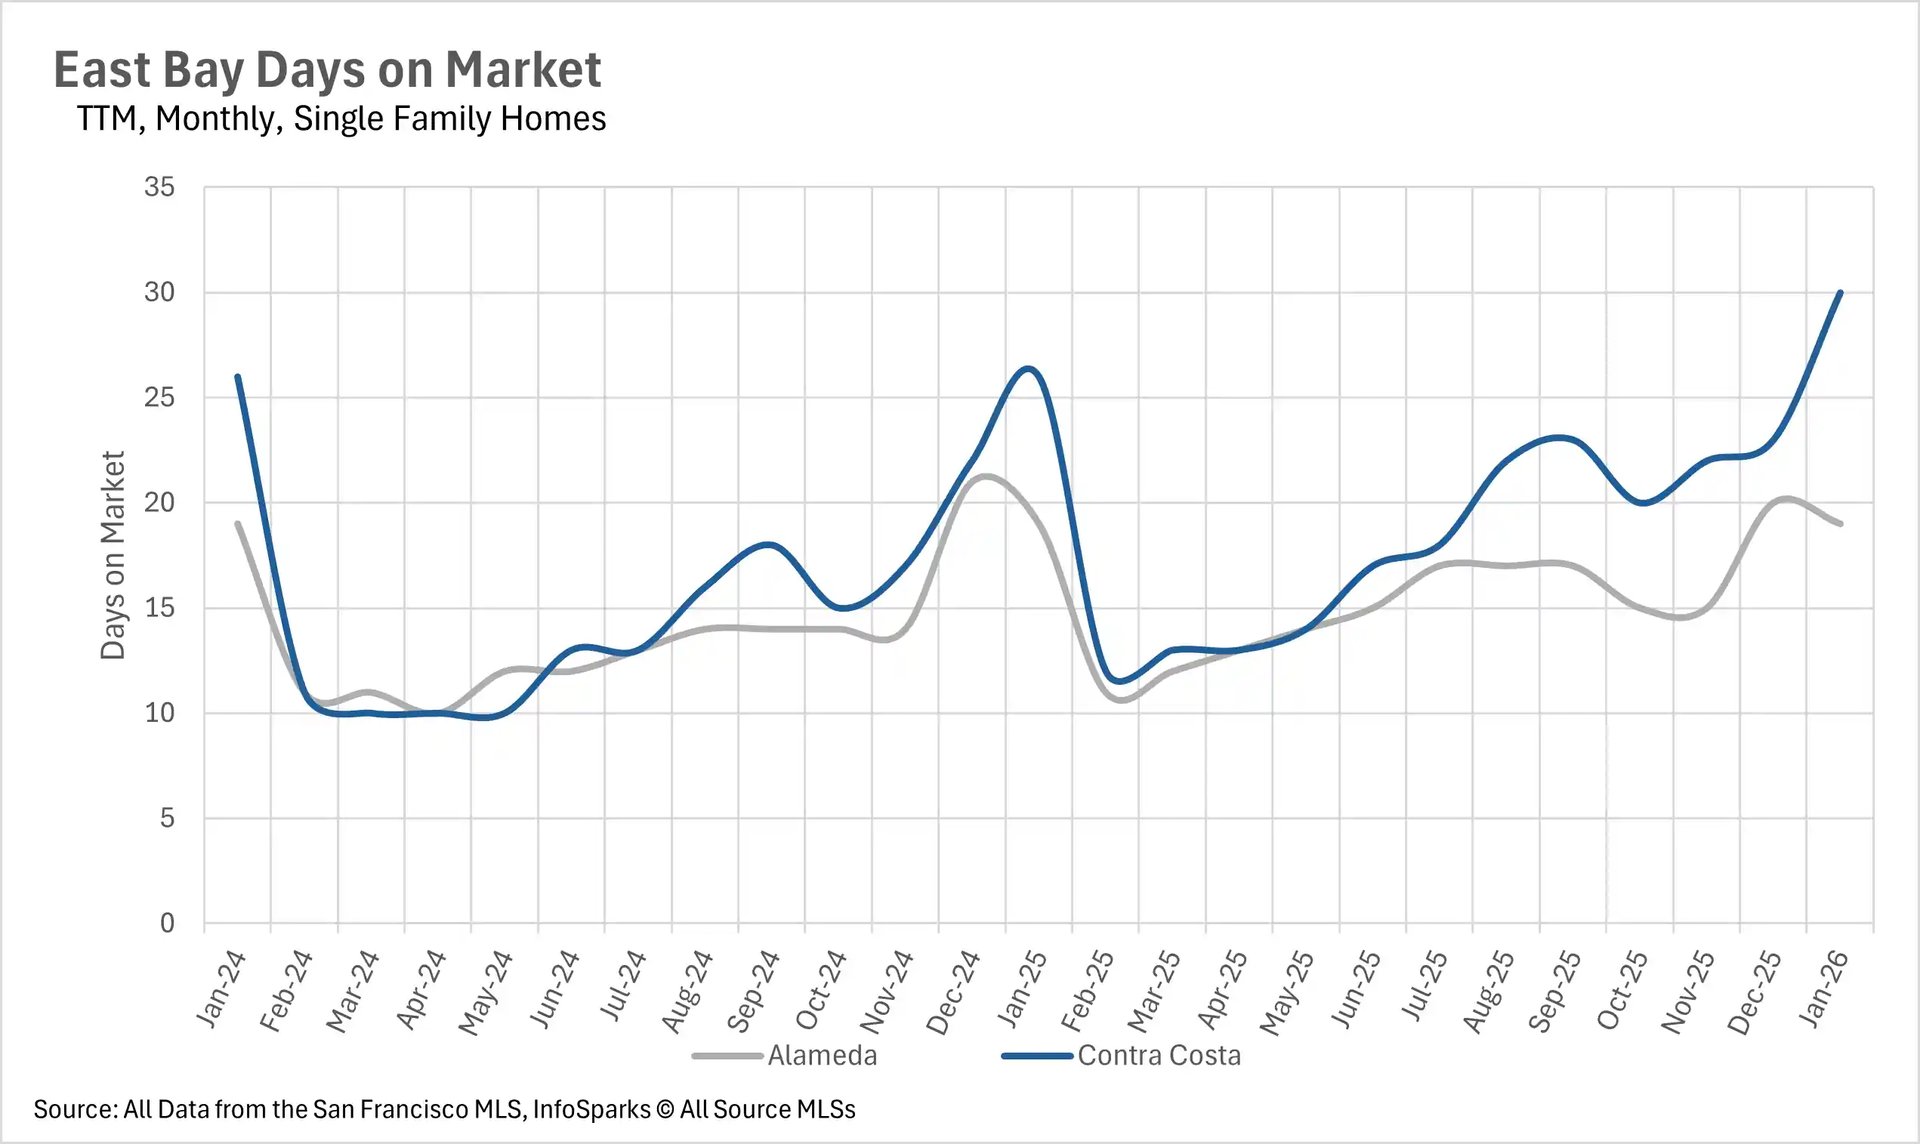
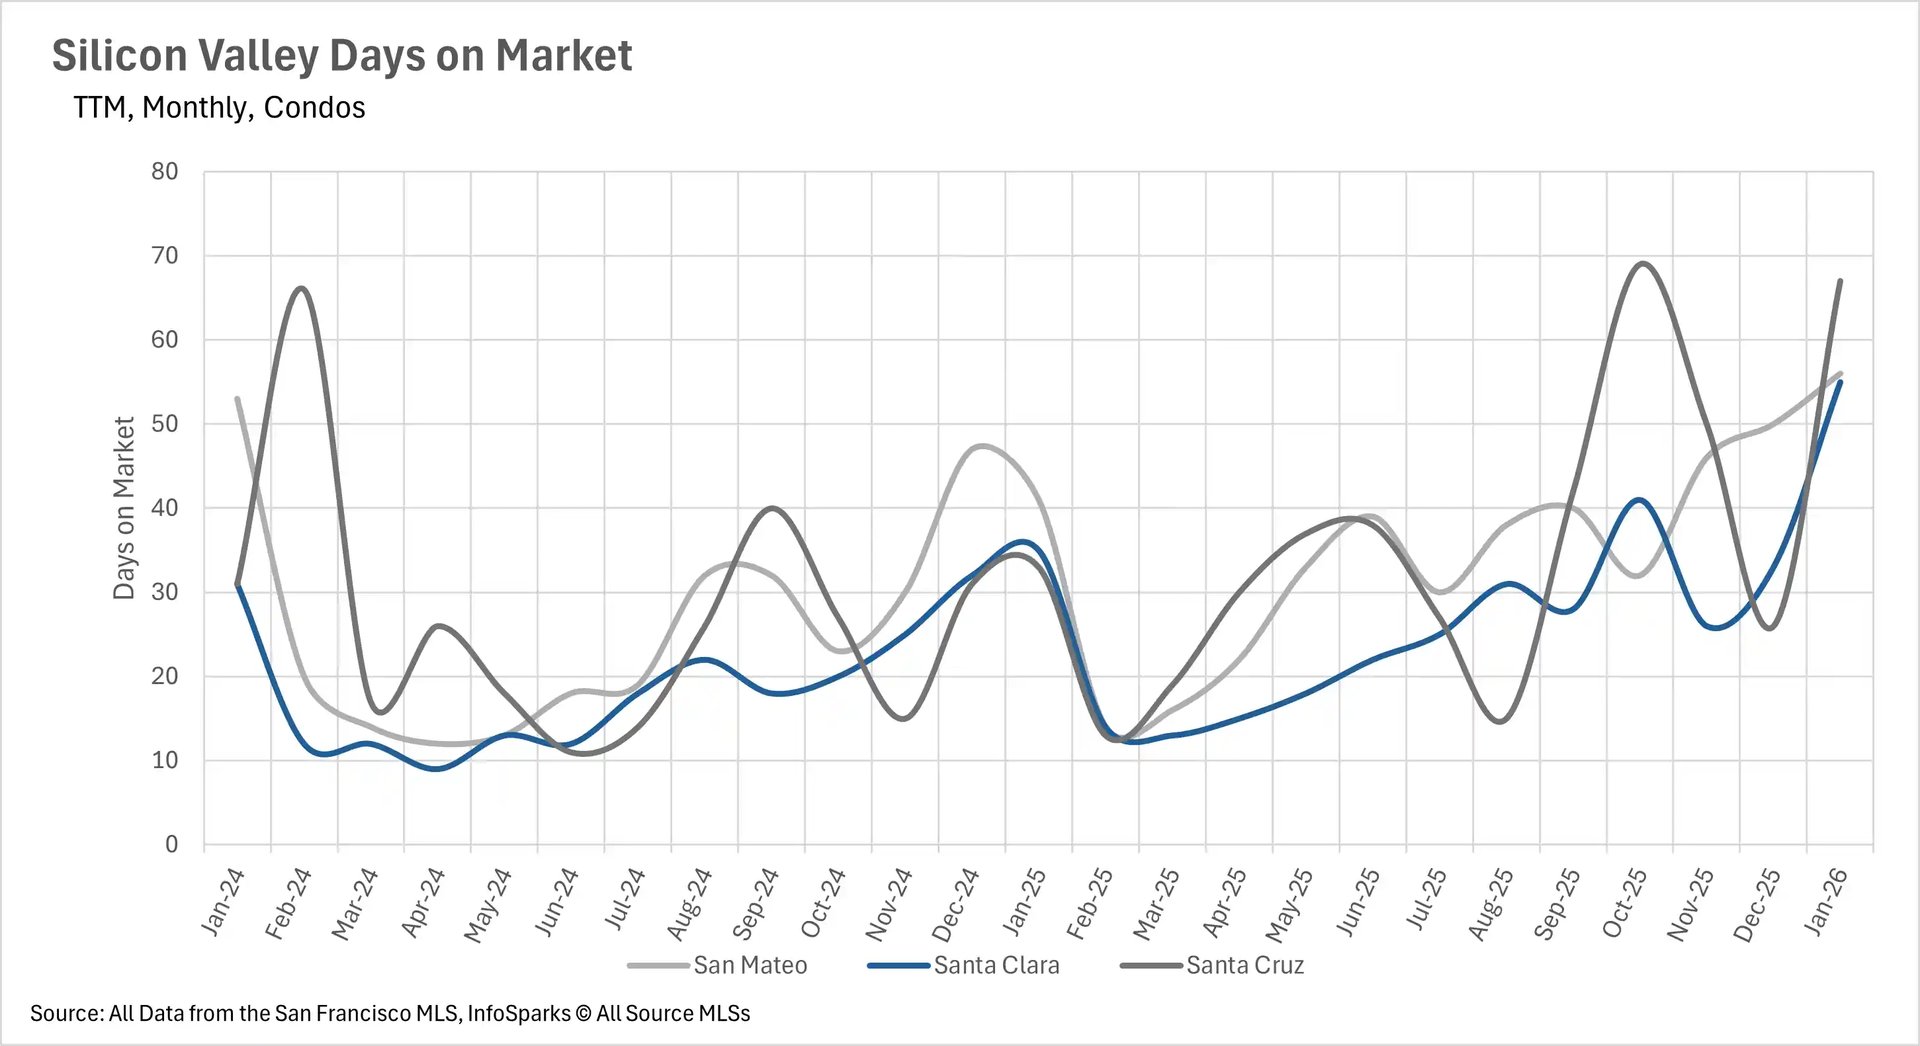
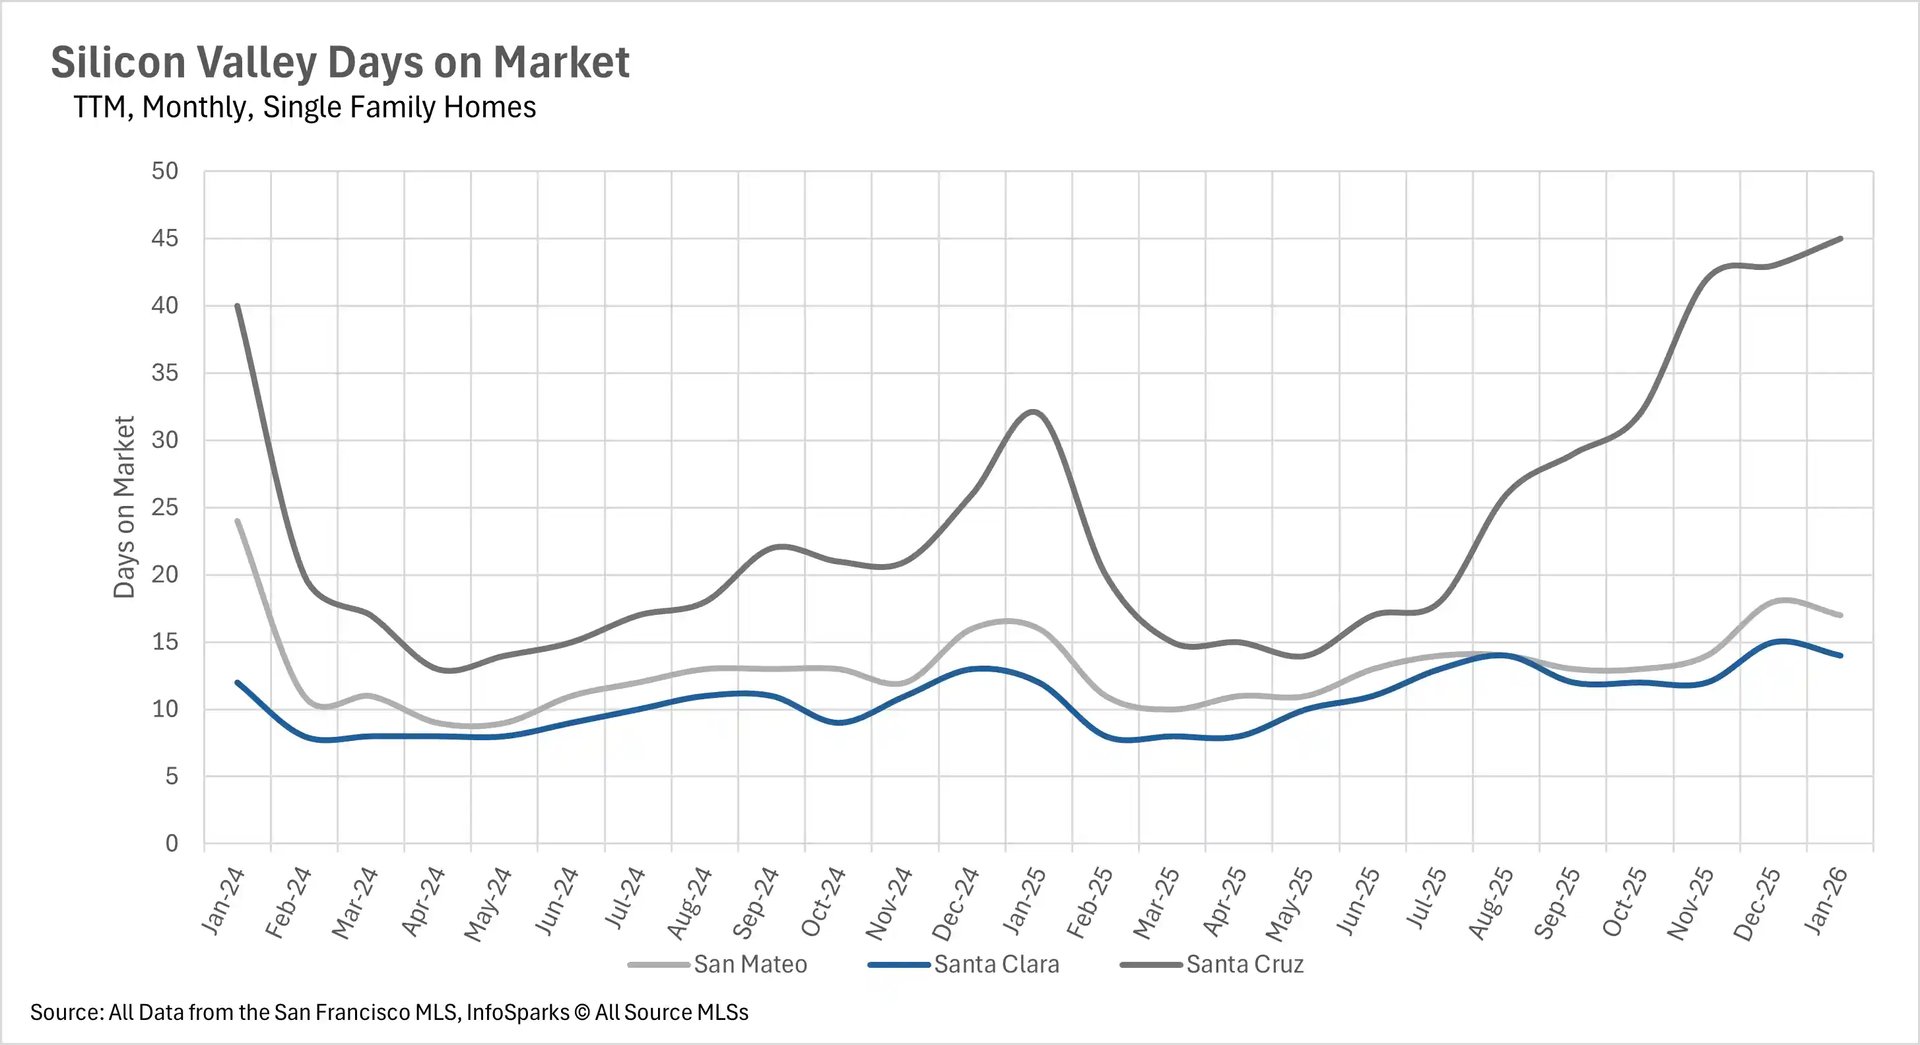
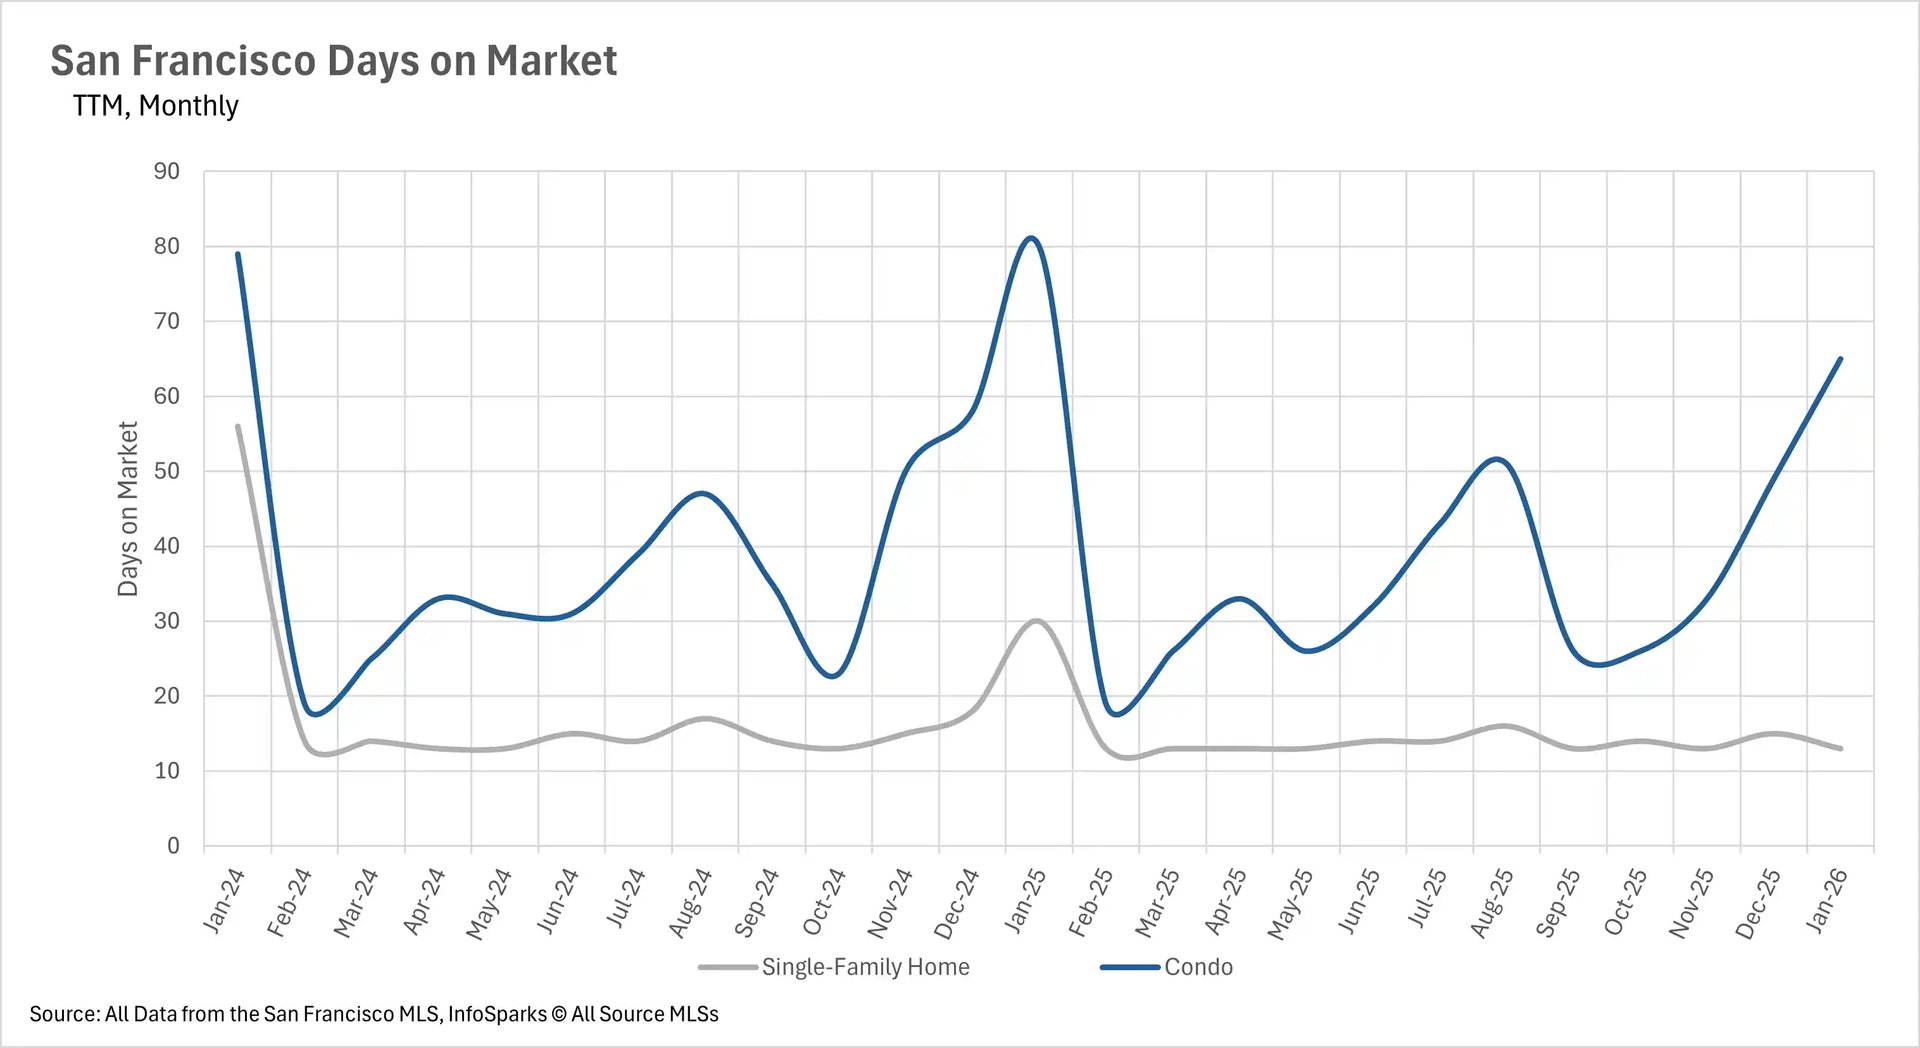
Condos are sitting on the market for dramatically longer, while single-family homes move quickly
The gap between the single-family home market and the condo market continues to widen when it comes to how long listings are spending on the market. In San Francisco, the average single-family home is selling in just 13 days, a 56.67% decrease compared to last January. Alameda County single-family homes are also moving at a brisk pace, selling in just 19 days on average. However, the condo market is a completely different animal. Santa Clara County condos are spending an average of 55 days on the market, a 57.14% year-over-year increase, while Santa Cruz County condos are sitting for 67 days, more than double what we saw in January 2025. In the North Bay, Sonoma County single-family homes are spending 44.44% more time on the market despite plummeting inventory levels, suggesting that even in a tight market, buyers are being cautious and deliberate with their offers.
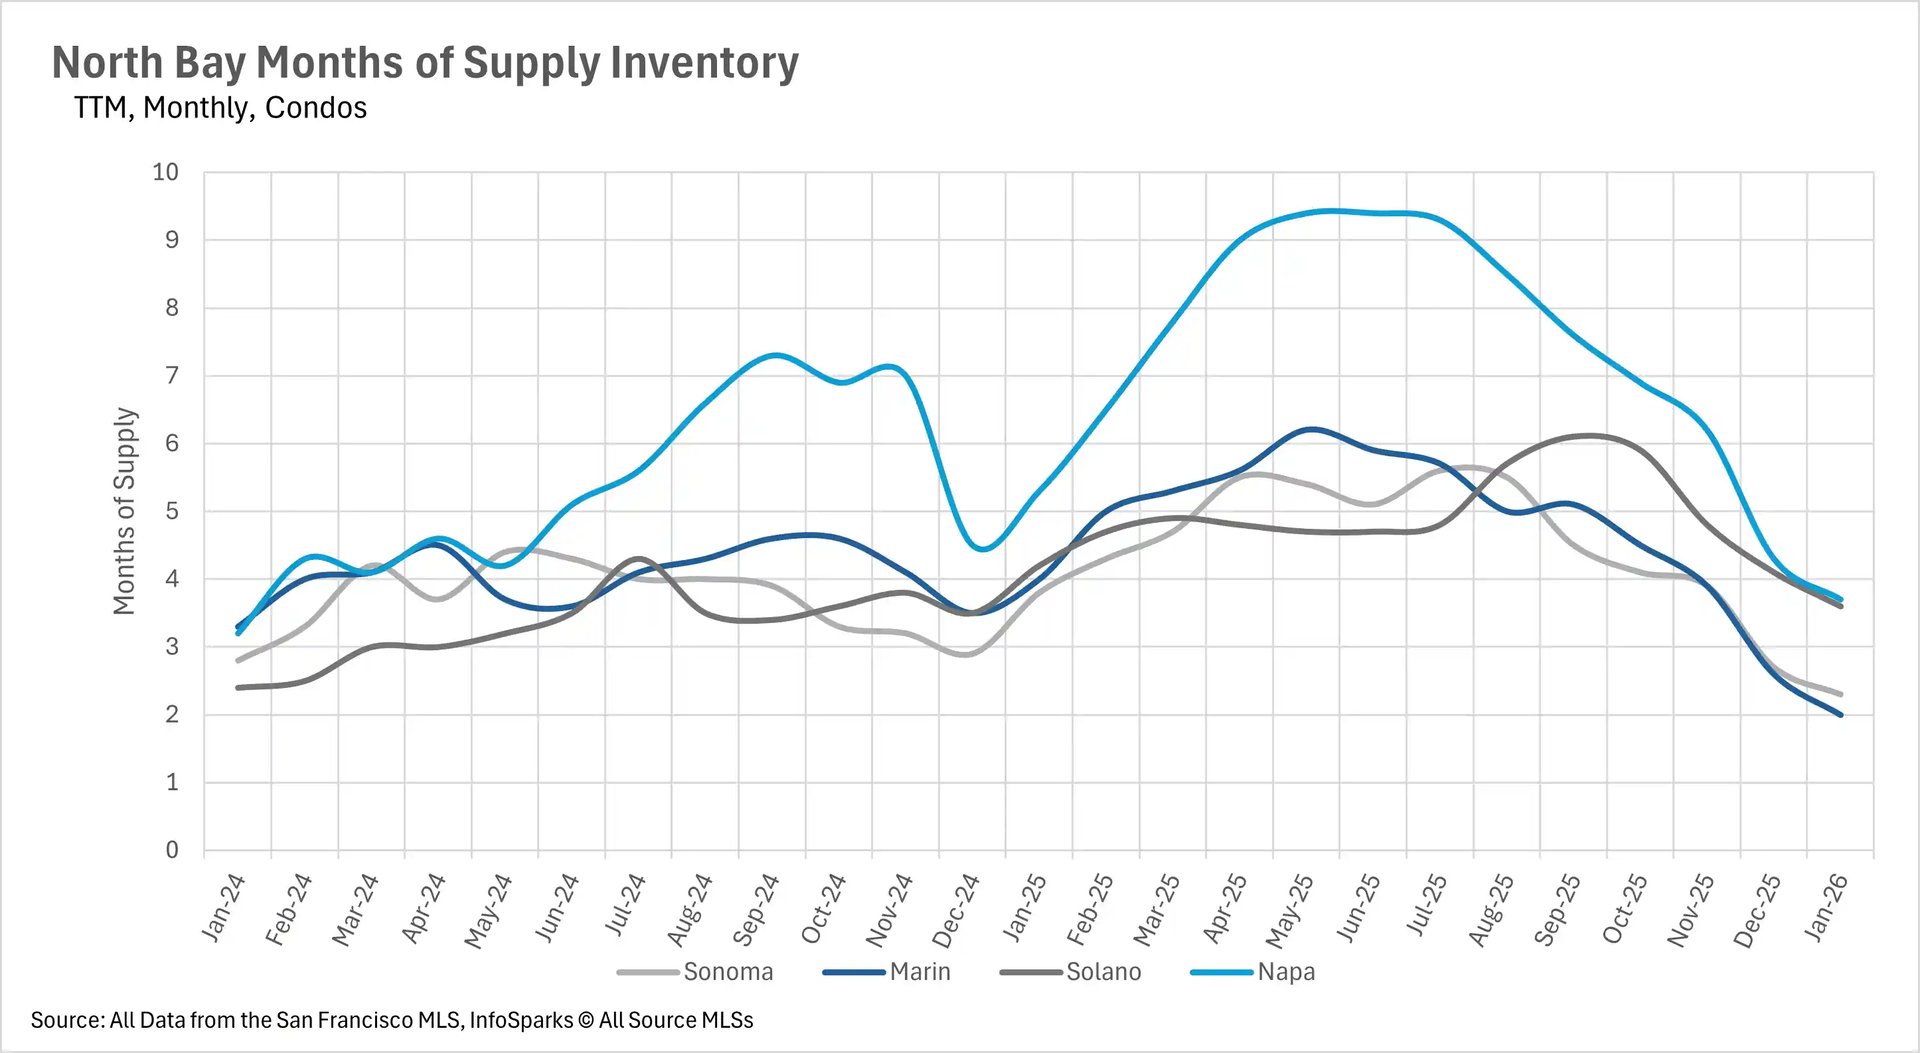
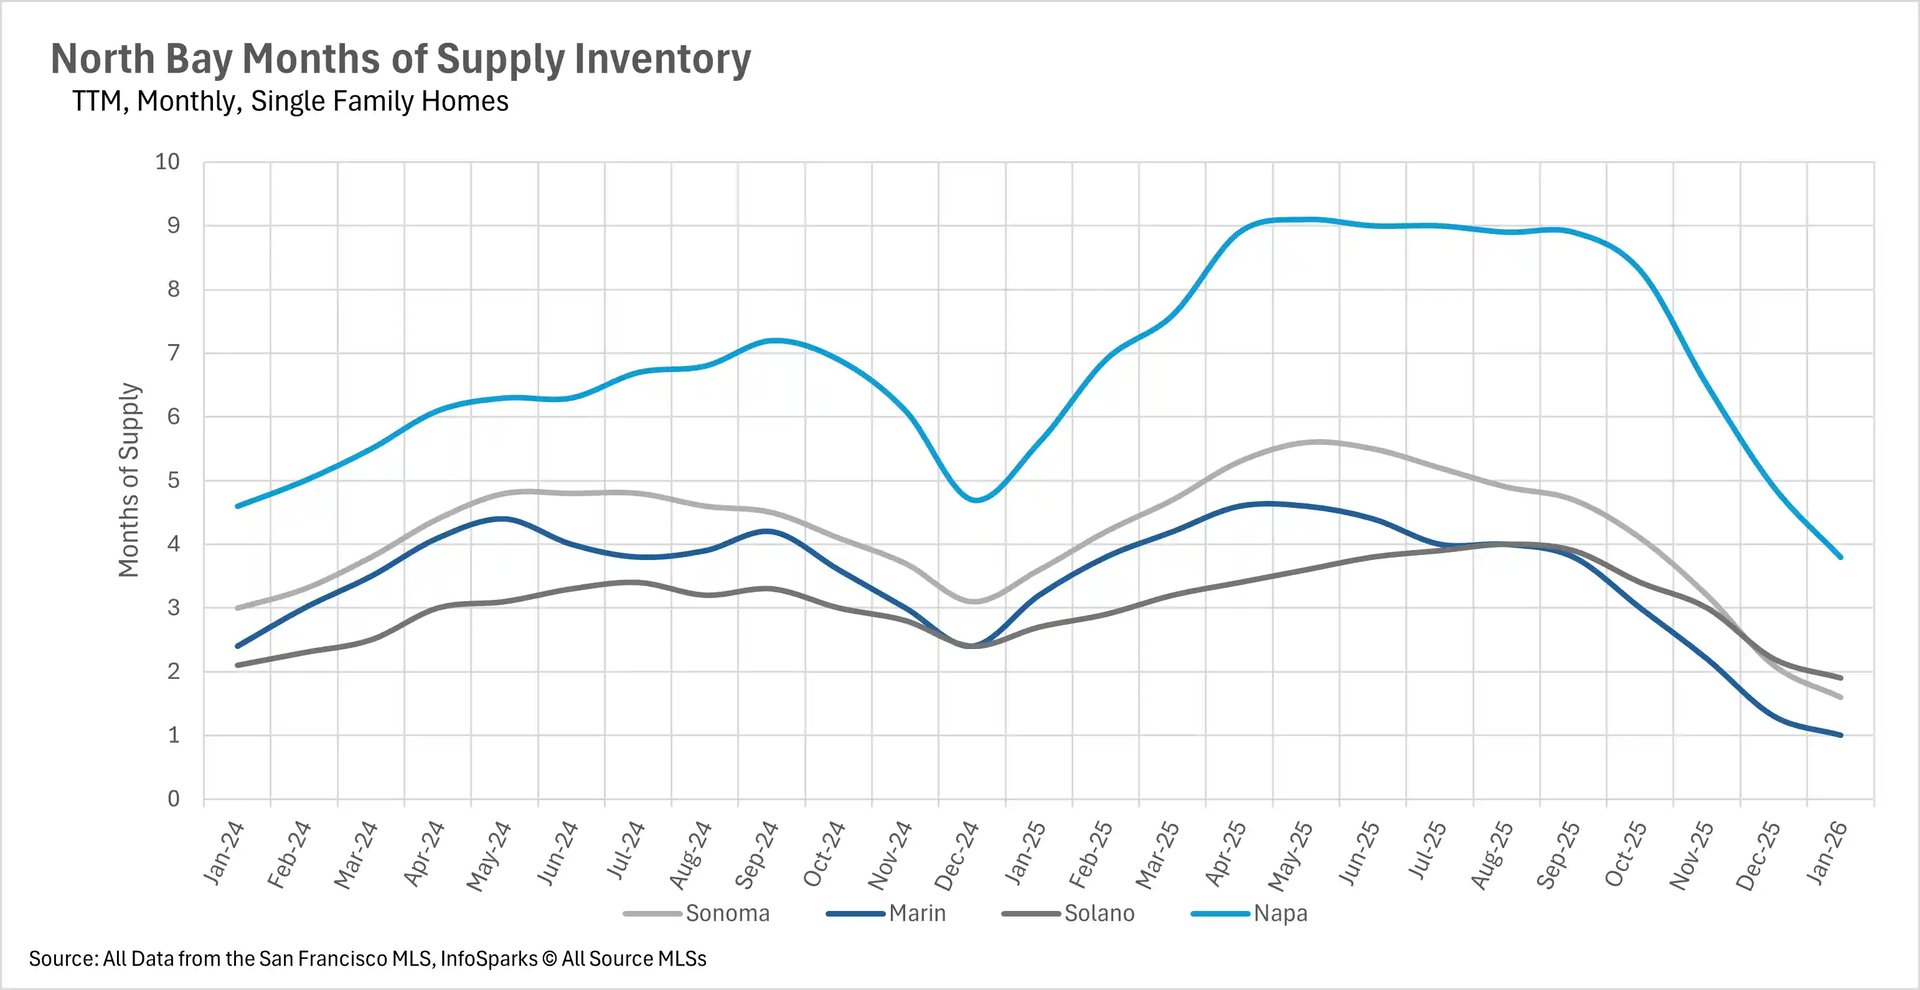
The Bay Area is overwhelmingly a seller's market heading into the spring
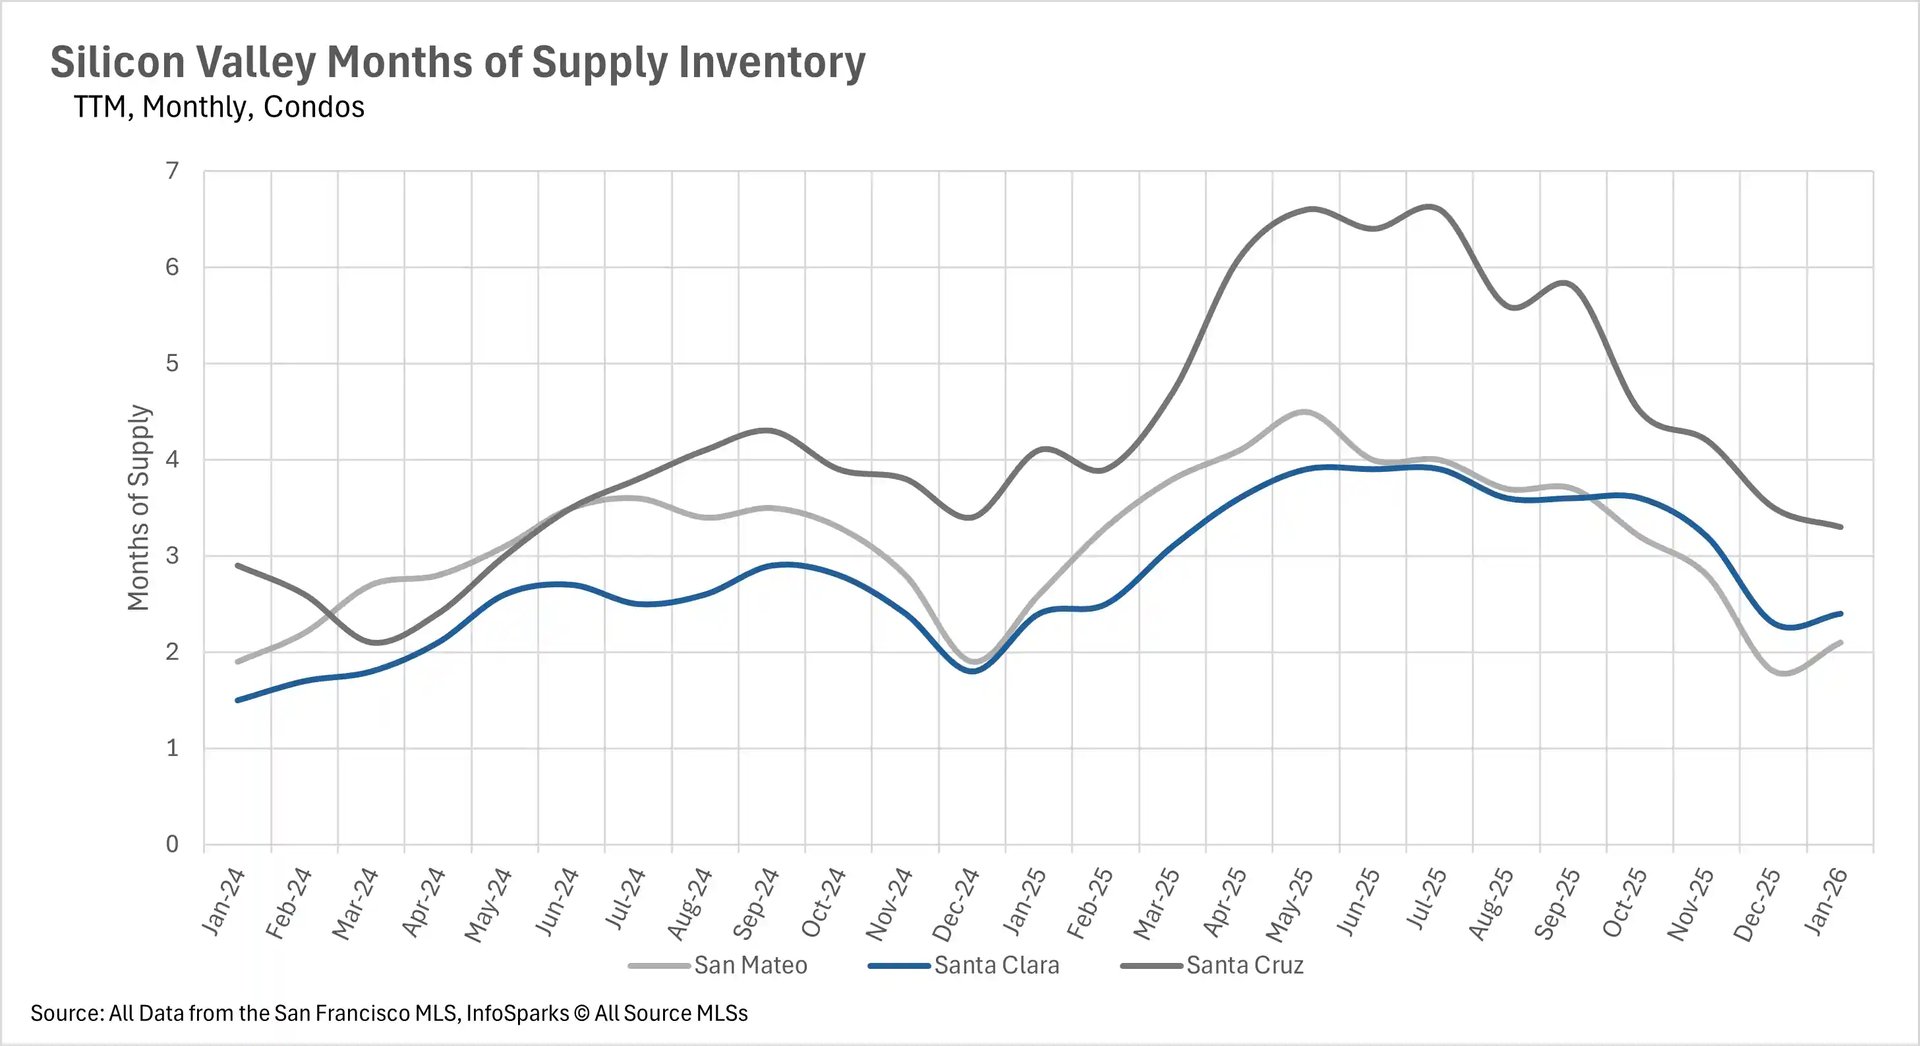
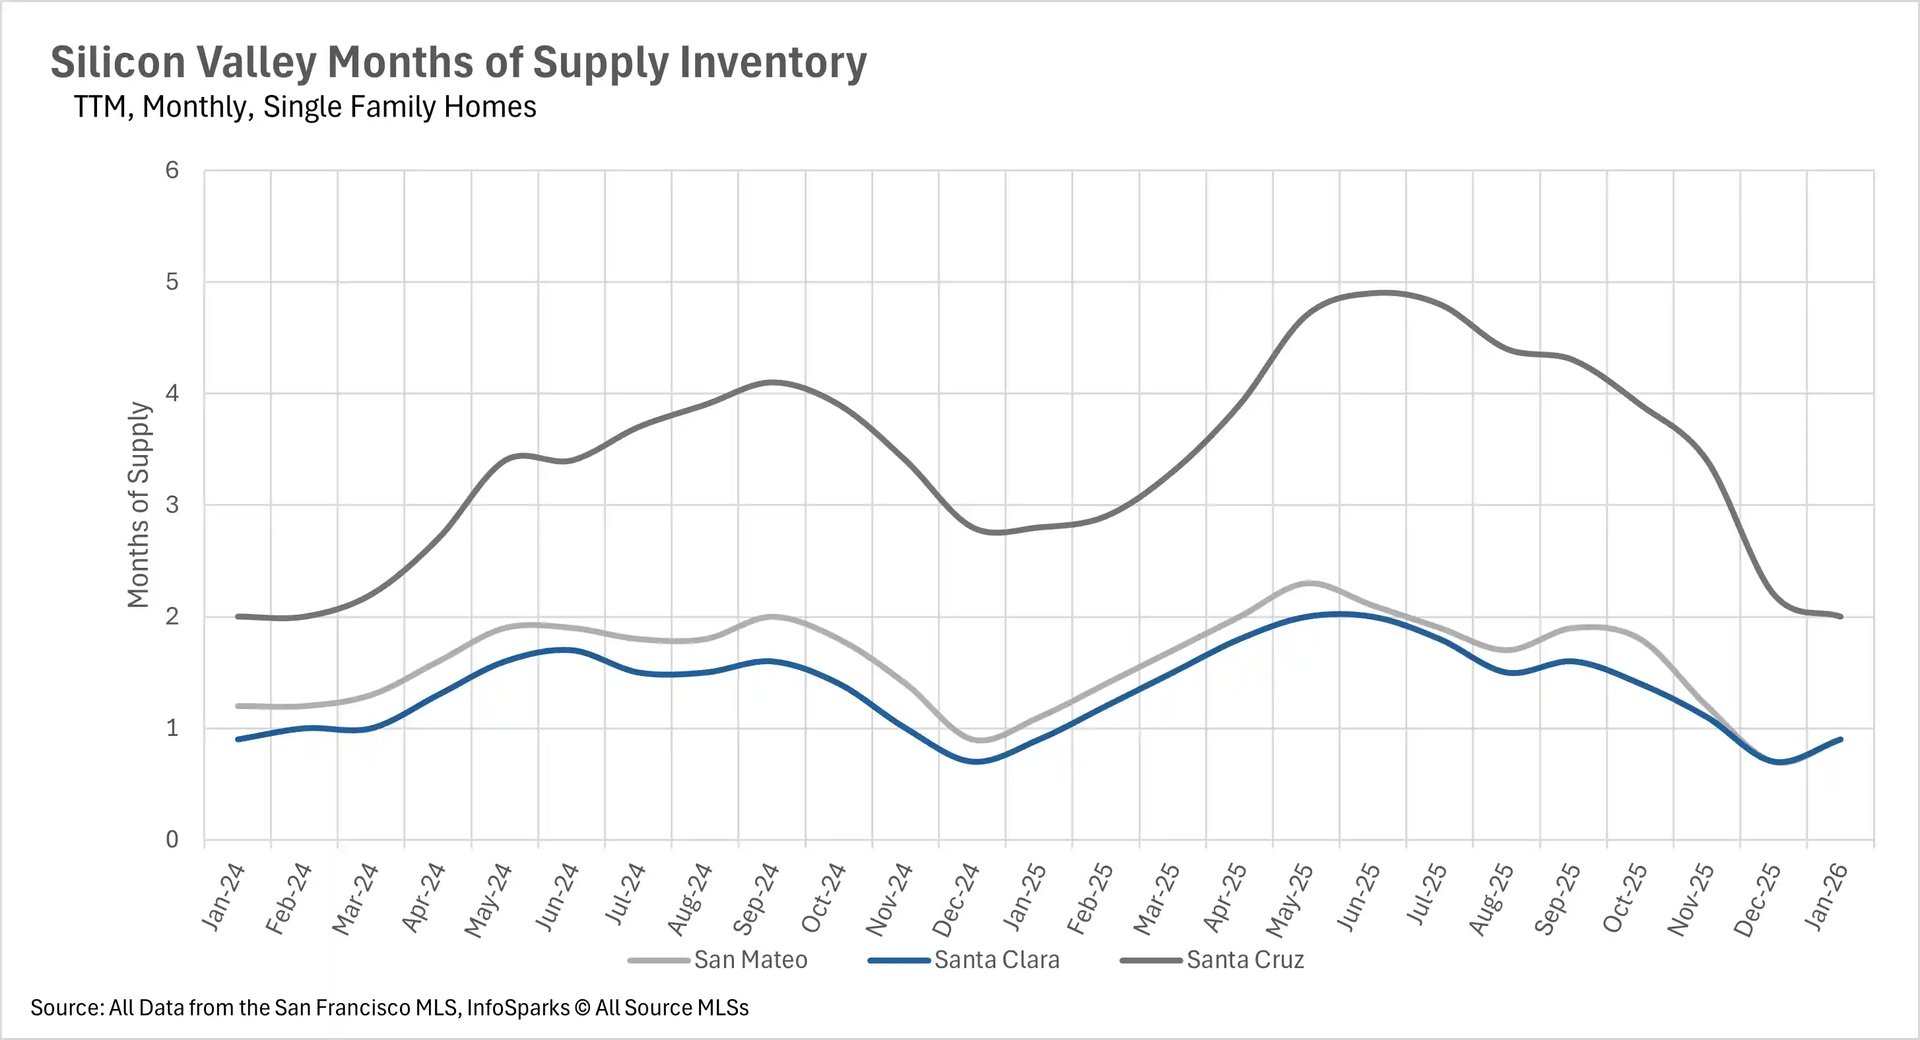
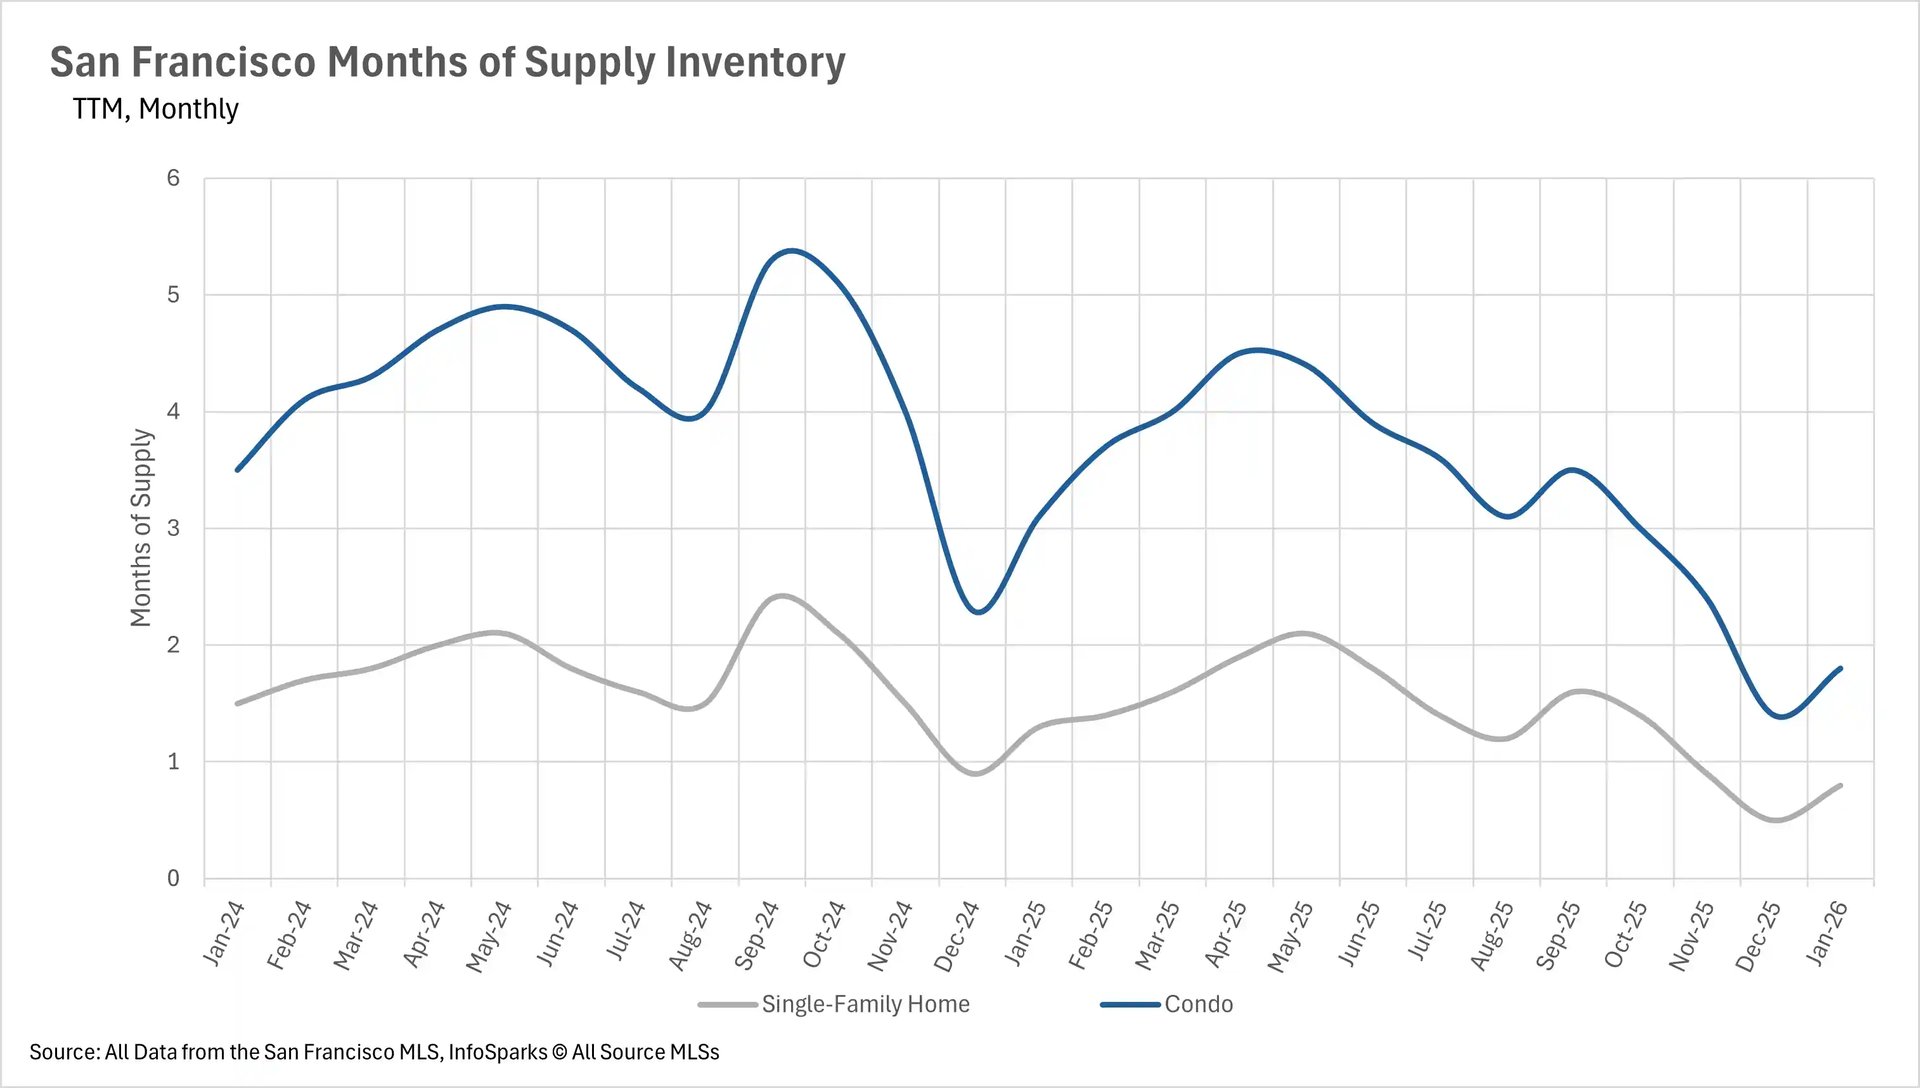
When determining whether a market is a buyers' market or a sellers' market, we look to the Months of Supply Inventory (MSI) metric. The state of California has historically averaged around three months of MSI, so any area with at or around three months of MSI is considered a balanced market. Any market that has lower than three months of MSI is considered a seller's market, whereas markets with more than three months of MSI are considered a buyers' market.
January brought seller's market conditions to nearly every corner of the Bay Area's single-family home market. San Francisco and Santa Clara County are sitting at just 0.8 and 0.9 months of supply, respectively, while Marin County has just 1 month of supply, down an incredible 68.75% year-over-year. Alameda County has 1.1 months, Contra Costa County has 1.5 months, and Sonoma County has 1.6 months. Even Napa County, which was a strong buyer's market throughout much of 2025, has dropped to 3.8 months. The condo market has also tightened considerably, though a few pockets remain in buyer's market territory, including Santa Cruz County at 3.3 months, Solano County at 3.6 months, and Napa County at 3.7 months. With inventory at historically low levels and the busy spring selling season right around the corner, sellers are in an excellent position heading into the next few months.