If you prefer to bypass The Big Story and jump straight to the Local Market Report, click here.
The Big Story
Quick Take:
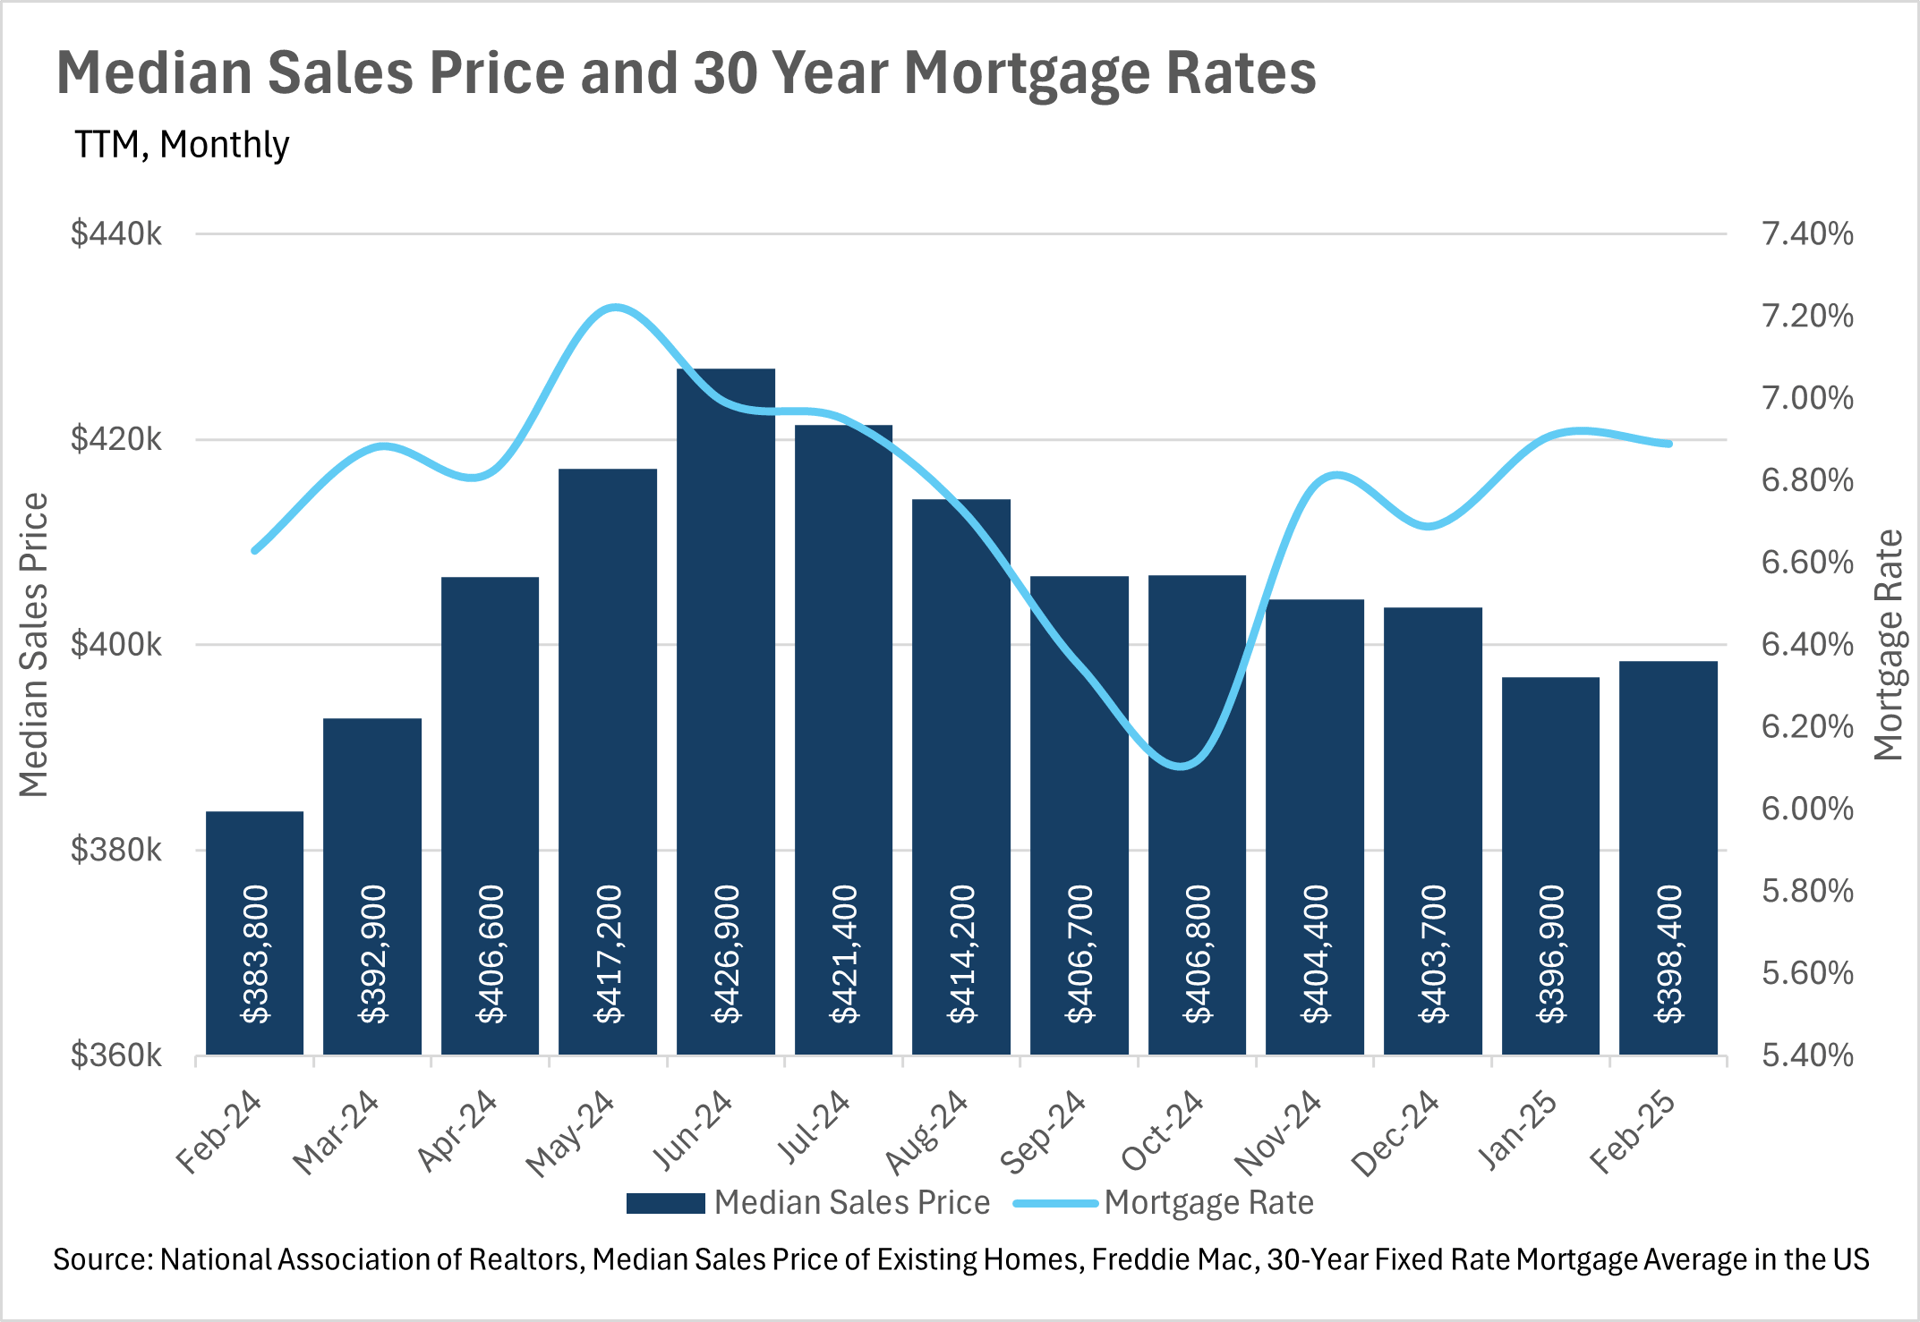
- Mortgage rates have ticked up slightly over the course of the past year, and coincidentally, so has the median sale price of a home in the US.
- According to Freddie Mac, the average 30-year mortgage rate is 6.62%, as of April 10th.
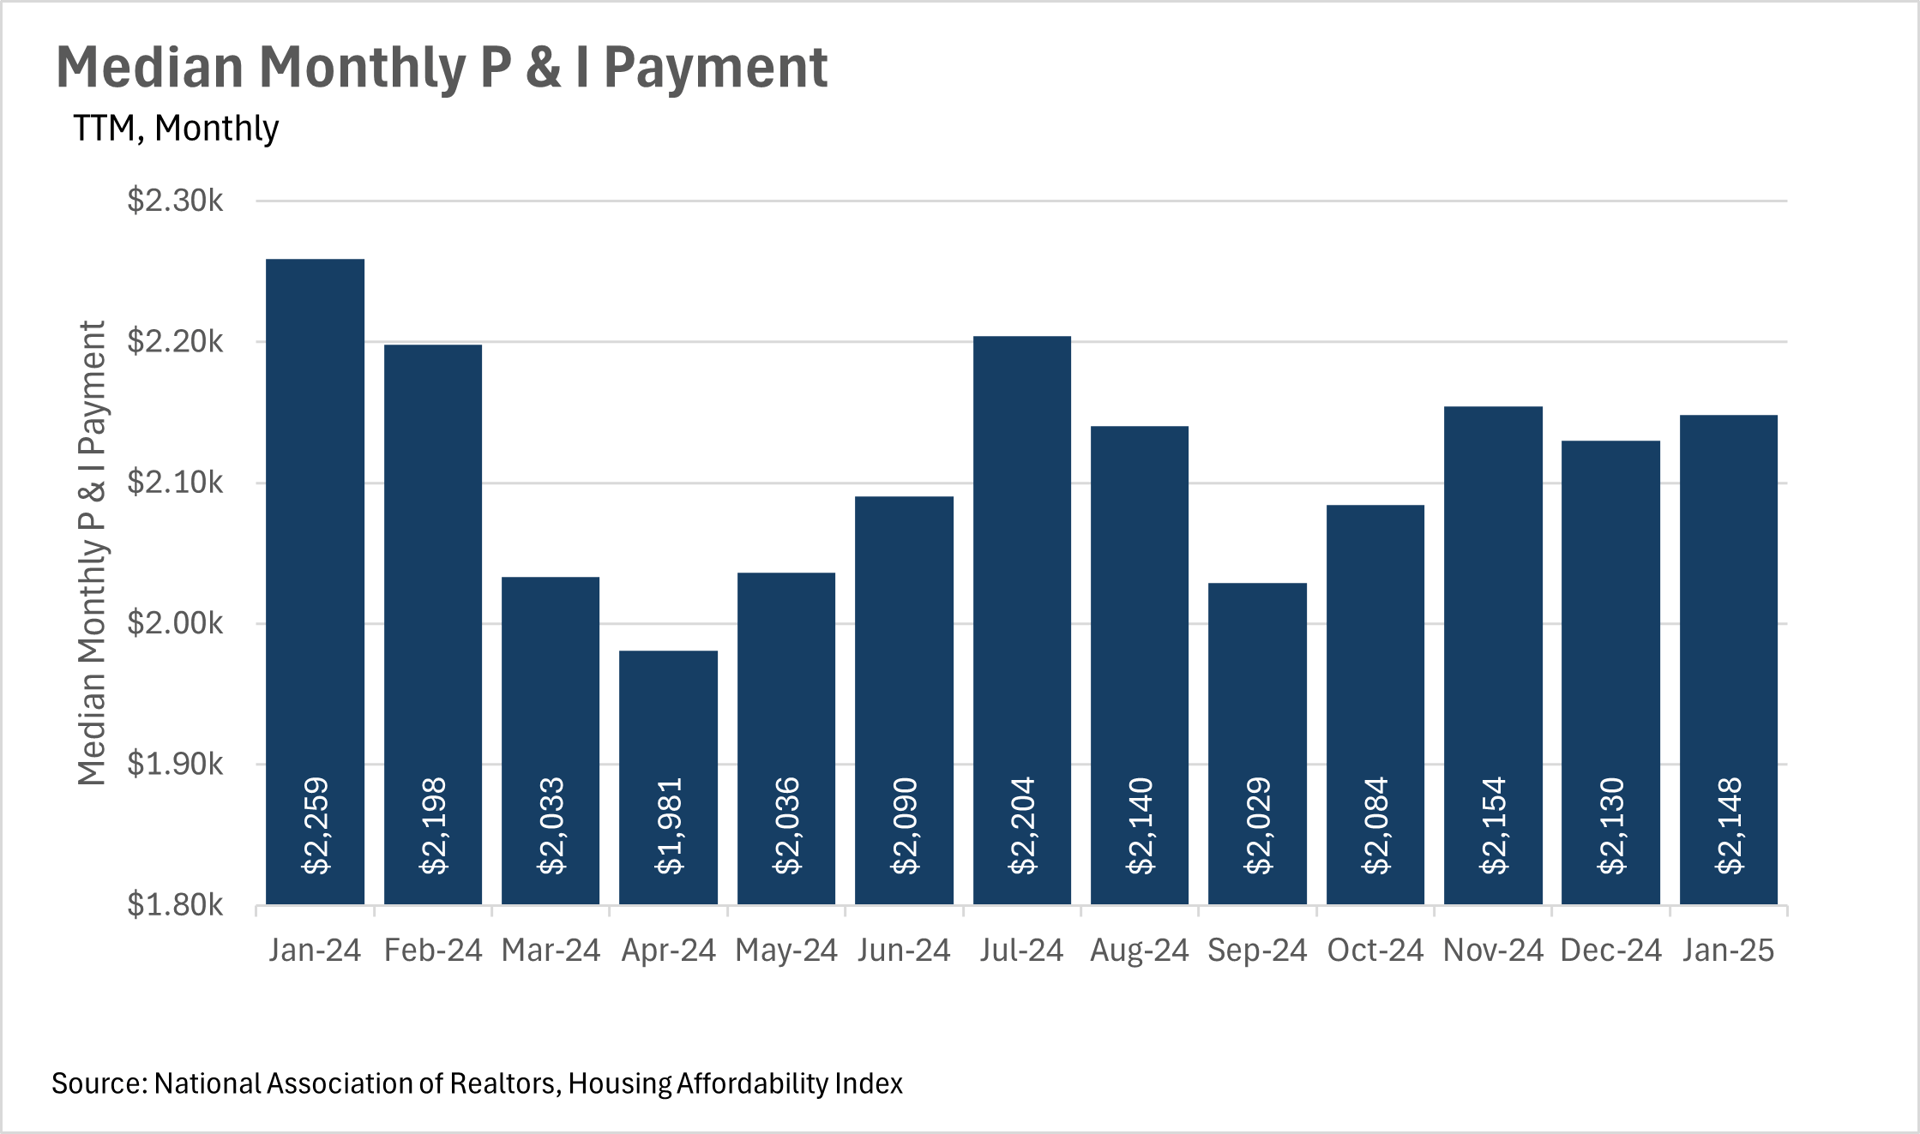
- Although affordability remains an issue throughout the country, the median monthly P&I payment has declined by over $100 on a year-over-year basis, representing a considerable savings for consumers!
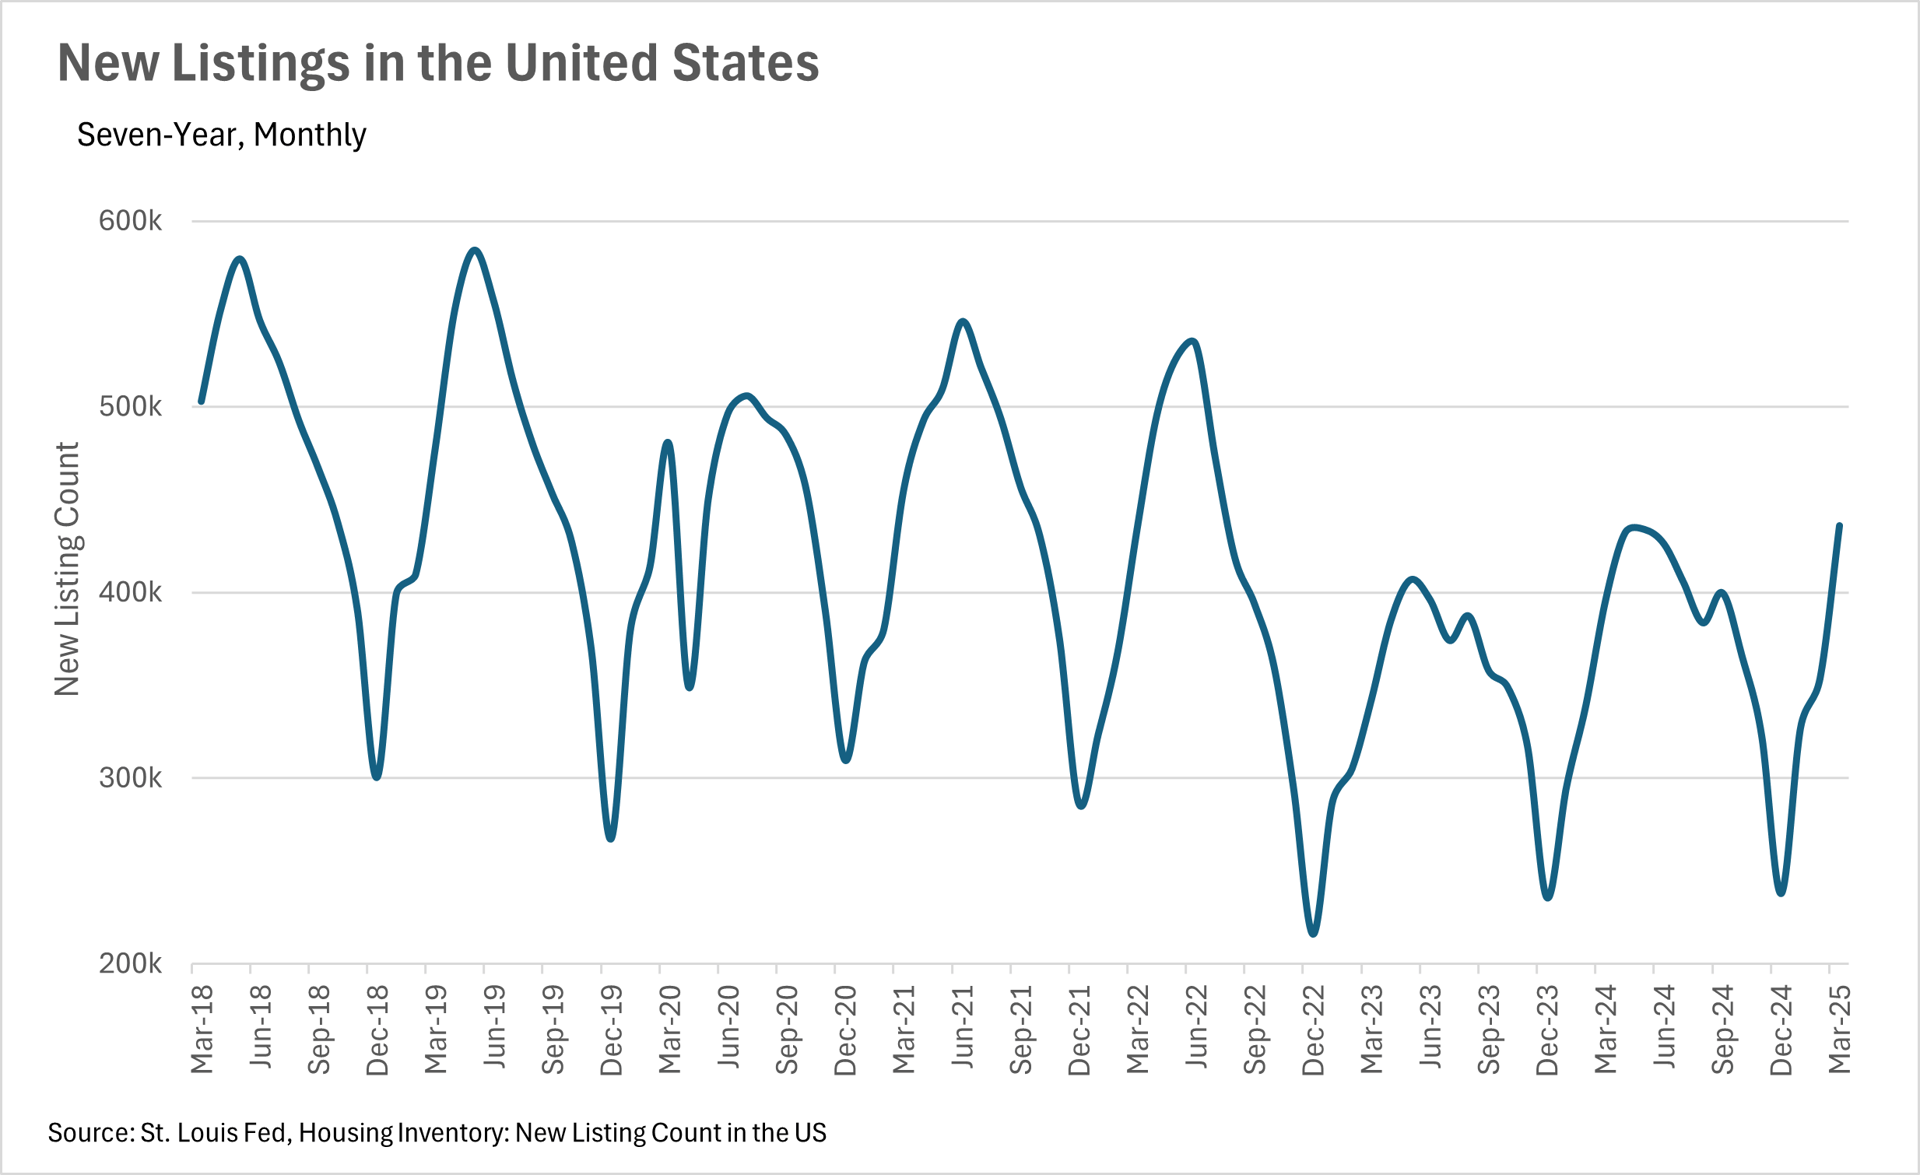
- We are seeing the trend of more new listings hitting the market continue, as we saw roughly 10% more new listings added in March when compared to a year ago.
Note: You can find the charts & graphs for the Big Story at the end of the following section.
*National Association of REALTORS® data is released two months behind, so we estimate the most recent month's data when possible and appropriate.
Home sales are roughly stagnant compared to last year
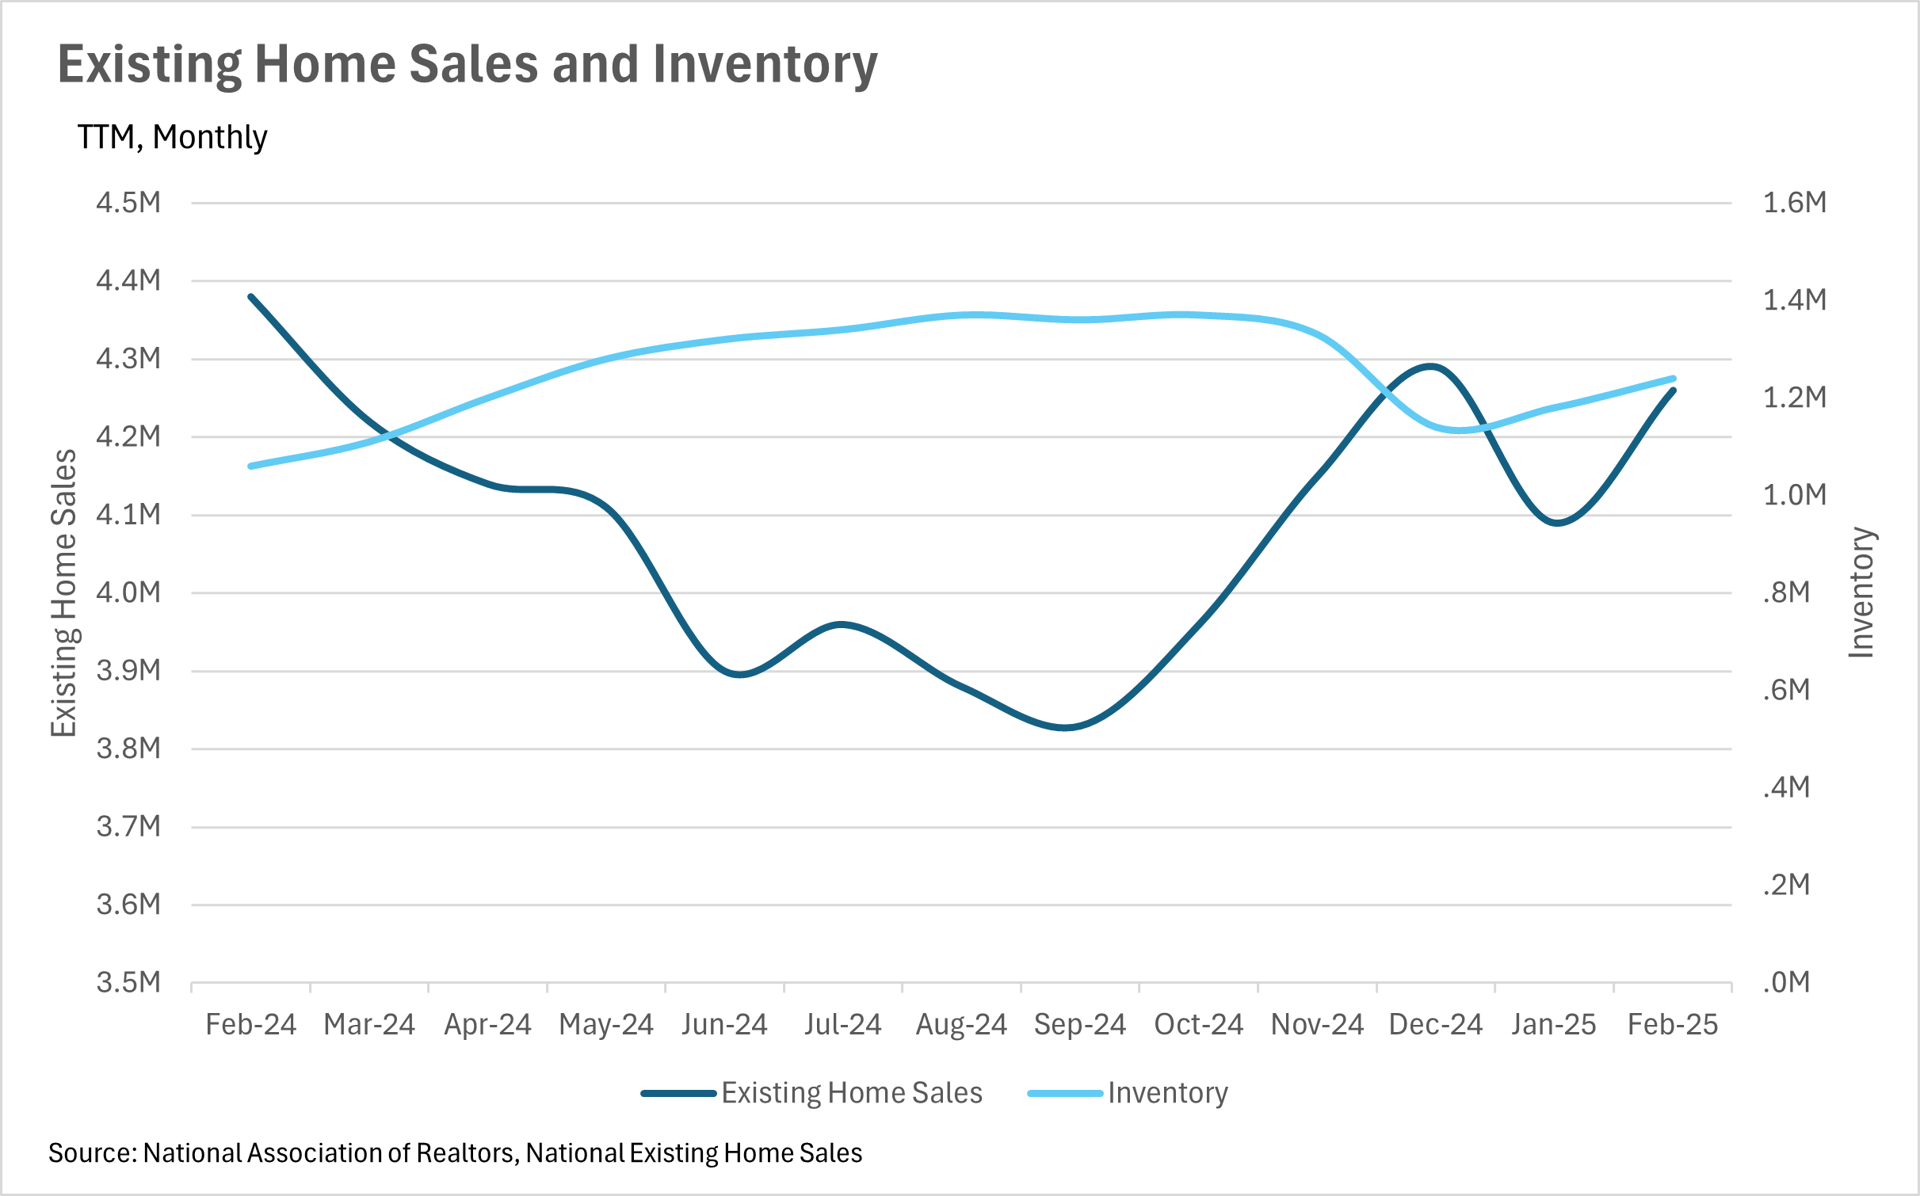
Although we are just about to exit the slow season for real estate sales, things are looking great overall. We saw a slight decrease in the number of sales on a year-over-year basis in February, with there being 4,260,000 sales in February 2025, compared to 4,380,000 in February 2024. However, on the flip side, we saw considerably more inventory added this year, with 1,240,000 homes on the market in February of this year, compared to 1,060,000 homes on the market around this time last year.
This means that all over the country, buyers have many more options than in recent years, which may lead to listings sitting on the market for a bit longer than what we’ve seen over the past couple of years. When you couple this with the fact that there are more new listings being added to the market, with just over 10% more listings added in March of 2025, compared to March of 2024, we might see some power start moving away from sellers to the buyers.
Additionally, this uptick in new listings might be an indication that sellers are starting to accept the fact that considerably lower mortgage rates aren’t coming anytime soon. Although many were holding out hope over the course of the past couple of years, the Fed has made it very clear that they’re not looking to drop rates by a considerable margin anytime soon. This, of course, means that prospective sellers have an important choice to make - whether they should sell, or continue holding out. From the data that we’re seeing, it seems that many sellers are beginning to choose the former option!
When turning to affordability, we saw a rather interesting phenomenon - median monthly P&I payments decreased by nearly 5%, all while interest rates and median sale prices increased by just under 4%. This likely means that there was a considerable cohort of homeowners out there that locked in rates toward the end of 2023 when rates were at a local high, and recently refinanced when rates came down a bit. The median consumer having an additional $100 in their pocket each and every month is a great thing for the economy, especially when we face economic uncertainty, tariffs, and ever-changing geopolitics!
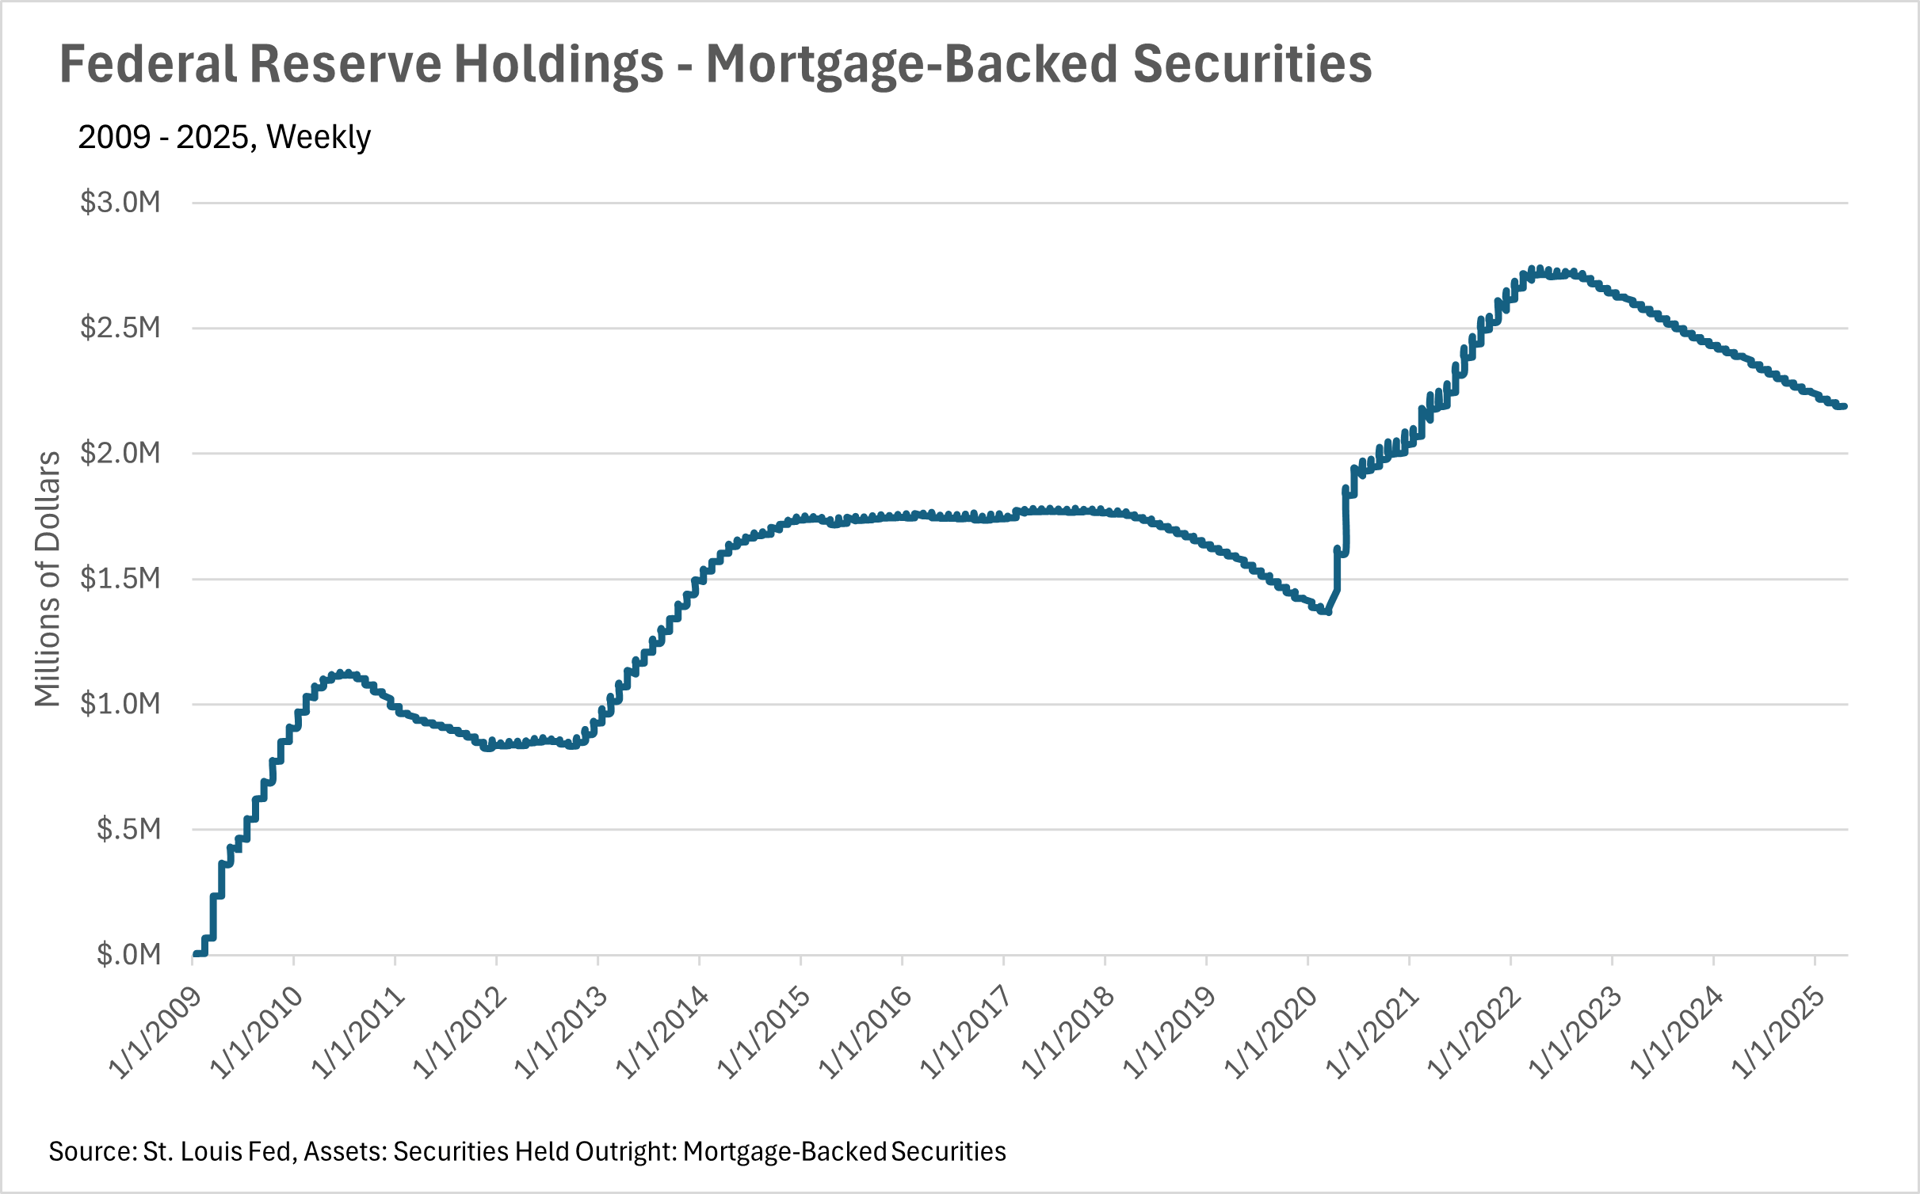
Lastly, it’s important to note that it’s business as usual in terms of the Federal Reserve. In their recent FOMC meeting, they decided to hold the federal funds rate firmly where it has been over the past couple of months. Fed officials also indicated that they are not in a rush to lower rates by a considerable margin anytime soon. However, that could always change, as we’re living in an incredibly dynamic era right now! Additionally, the Fed is continuing to offload mortgage-backed securities at a steady pace!
Ultimately though, this is just what we’re seeing at a national level. As we all know, real estate is an incredibly localized industry, so knowing what’s going on in your own market is pivotal. Below is our local lowdown, that outlines everything you need to know about what’s happening around you in your neighborhood and surrounding areas!
Big Story Data
The Local Lowdown
Quick Take:
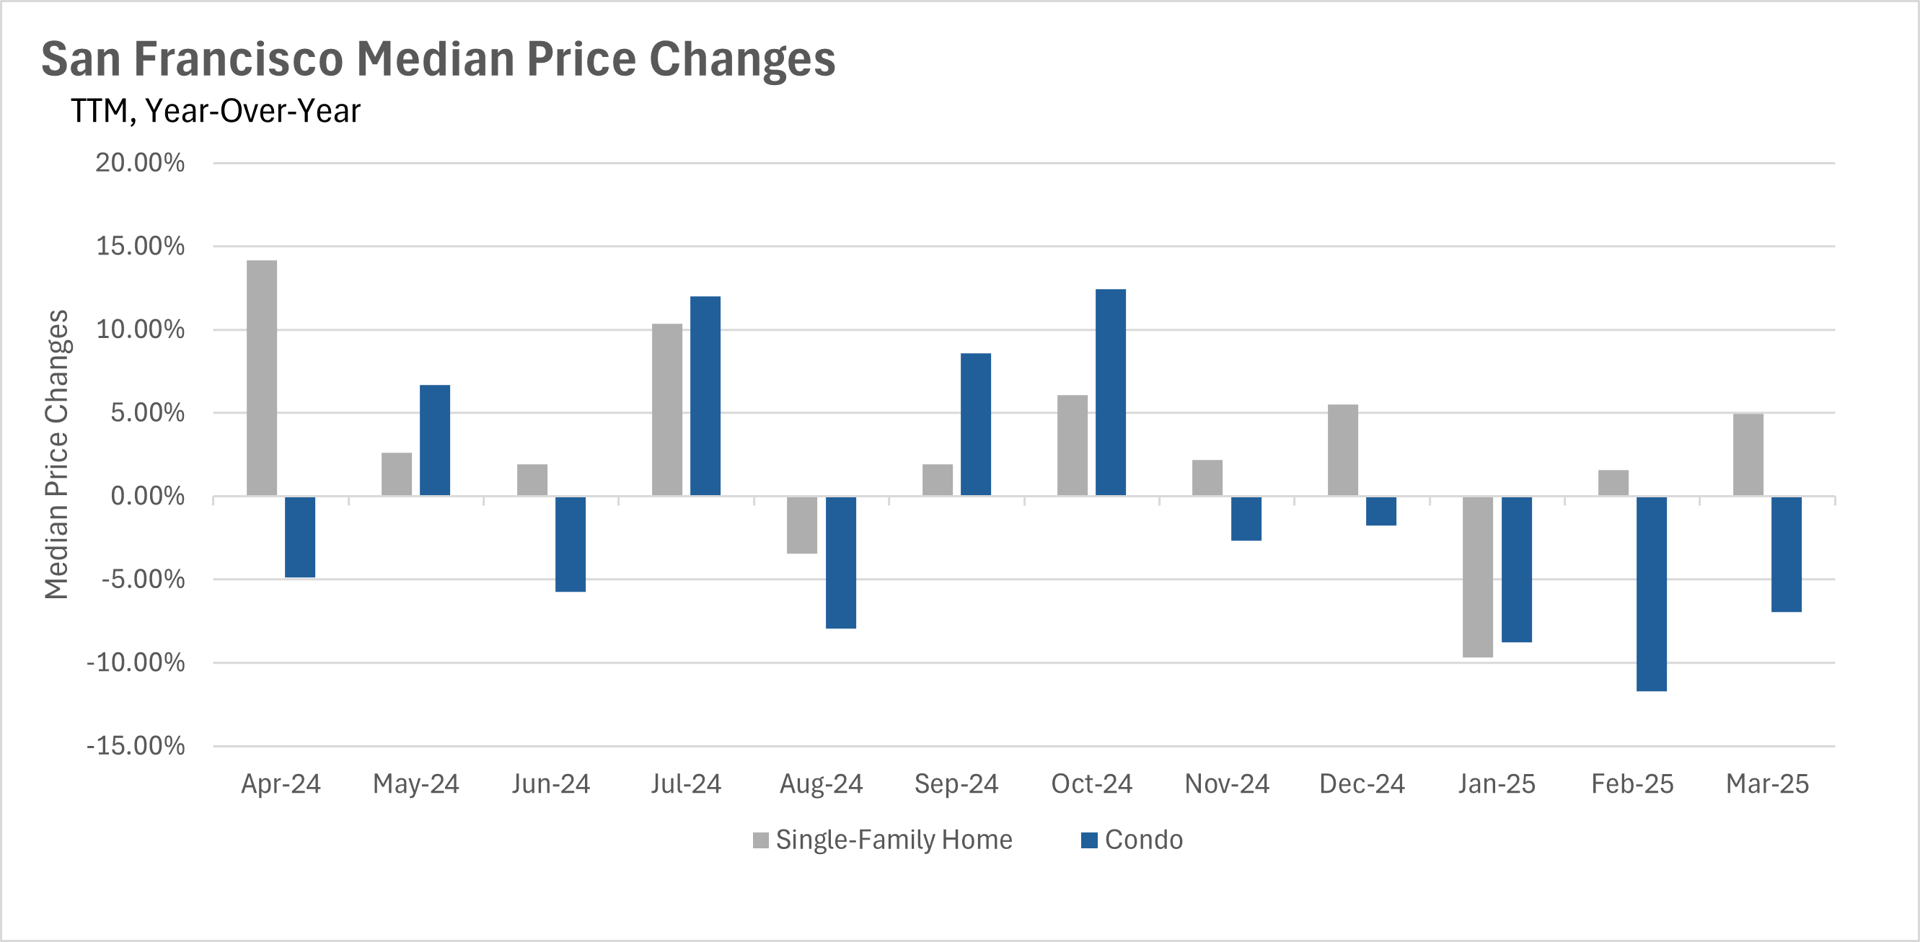
- Single-family homes continue to hold their value, while condo values continue to trend downward over time.
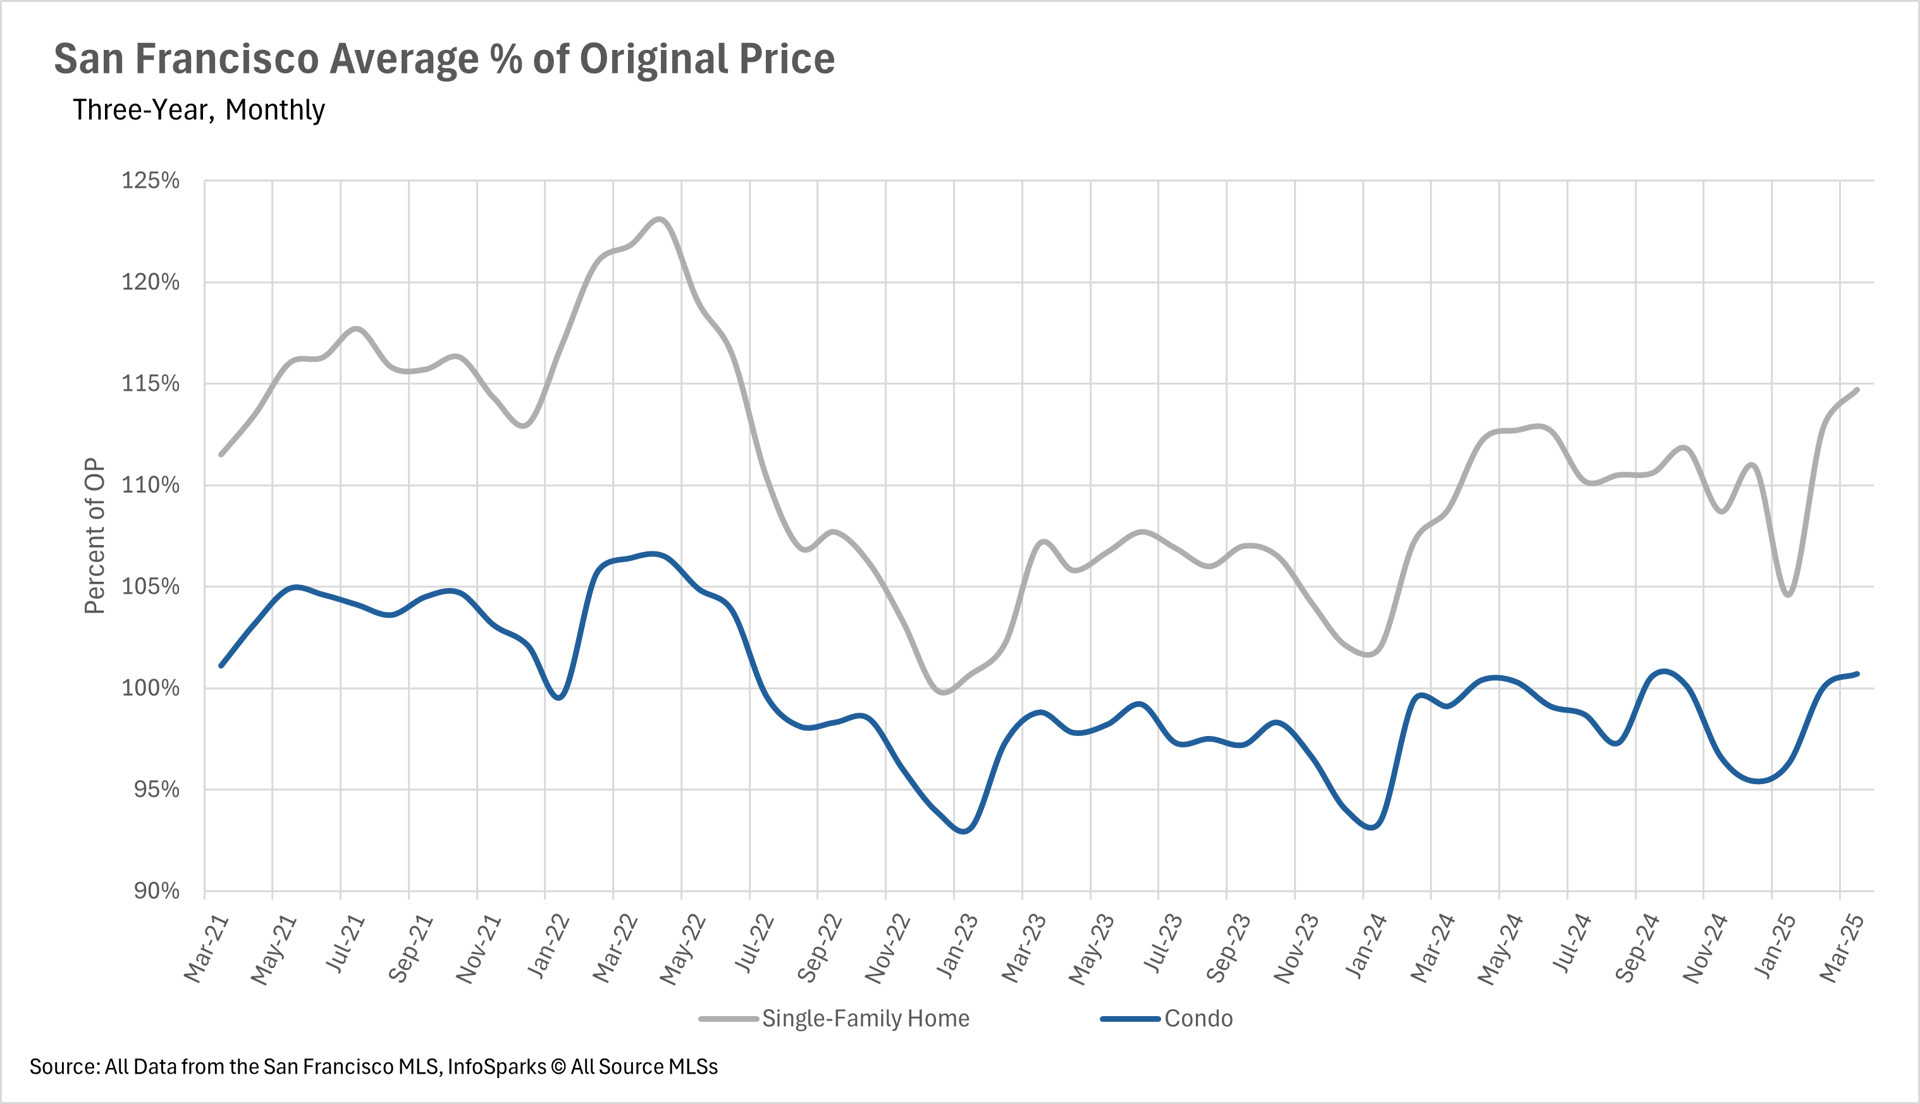
- Single-family homes are selling for the highest percentage of their original price that we’ve seen since the Fed started hiking interest rates.
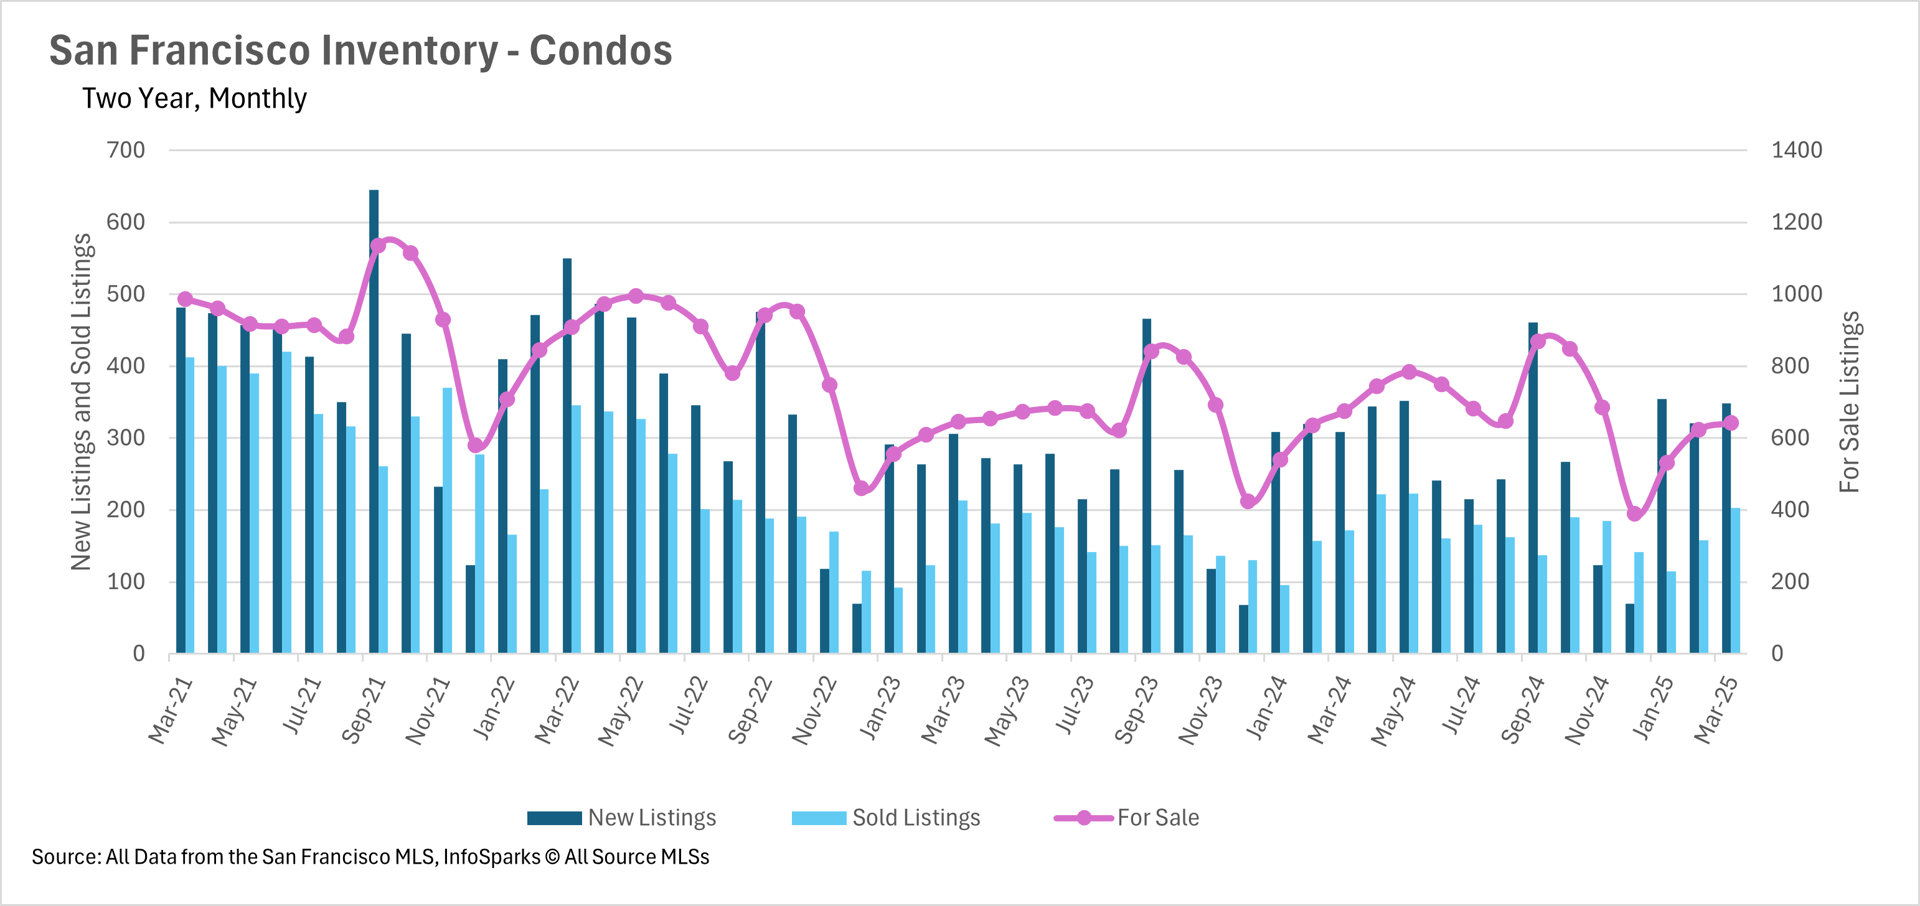
- Inventory continues to be a huge issue for the San Francisco area, as both single-family home and condo inventories downtrend over time.
Want to dive into the data? Scroll to the end for market visuals and deeper insights.
Single-Family Homes Soar, Condos Struggle
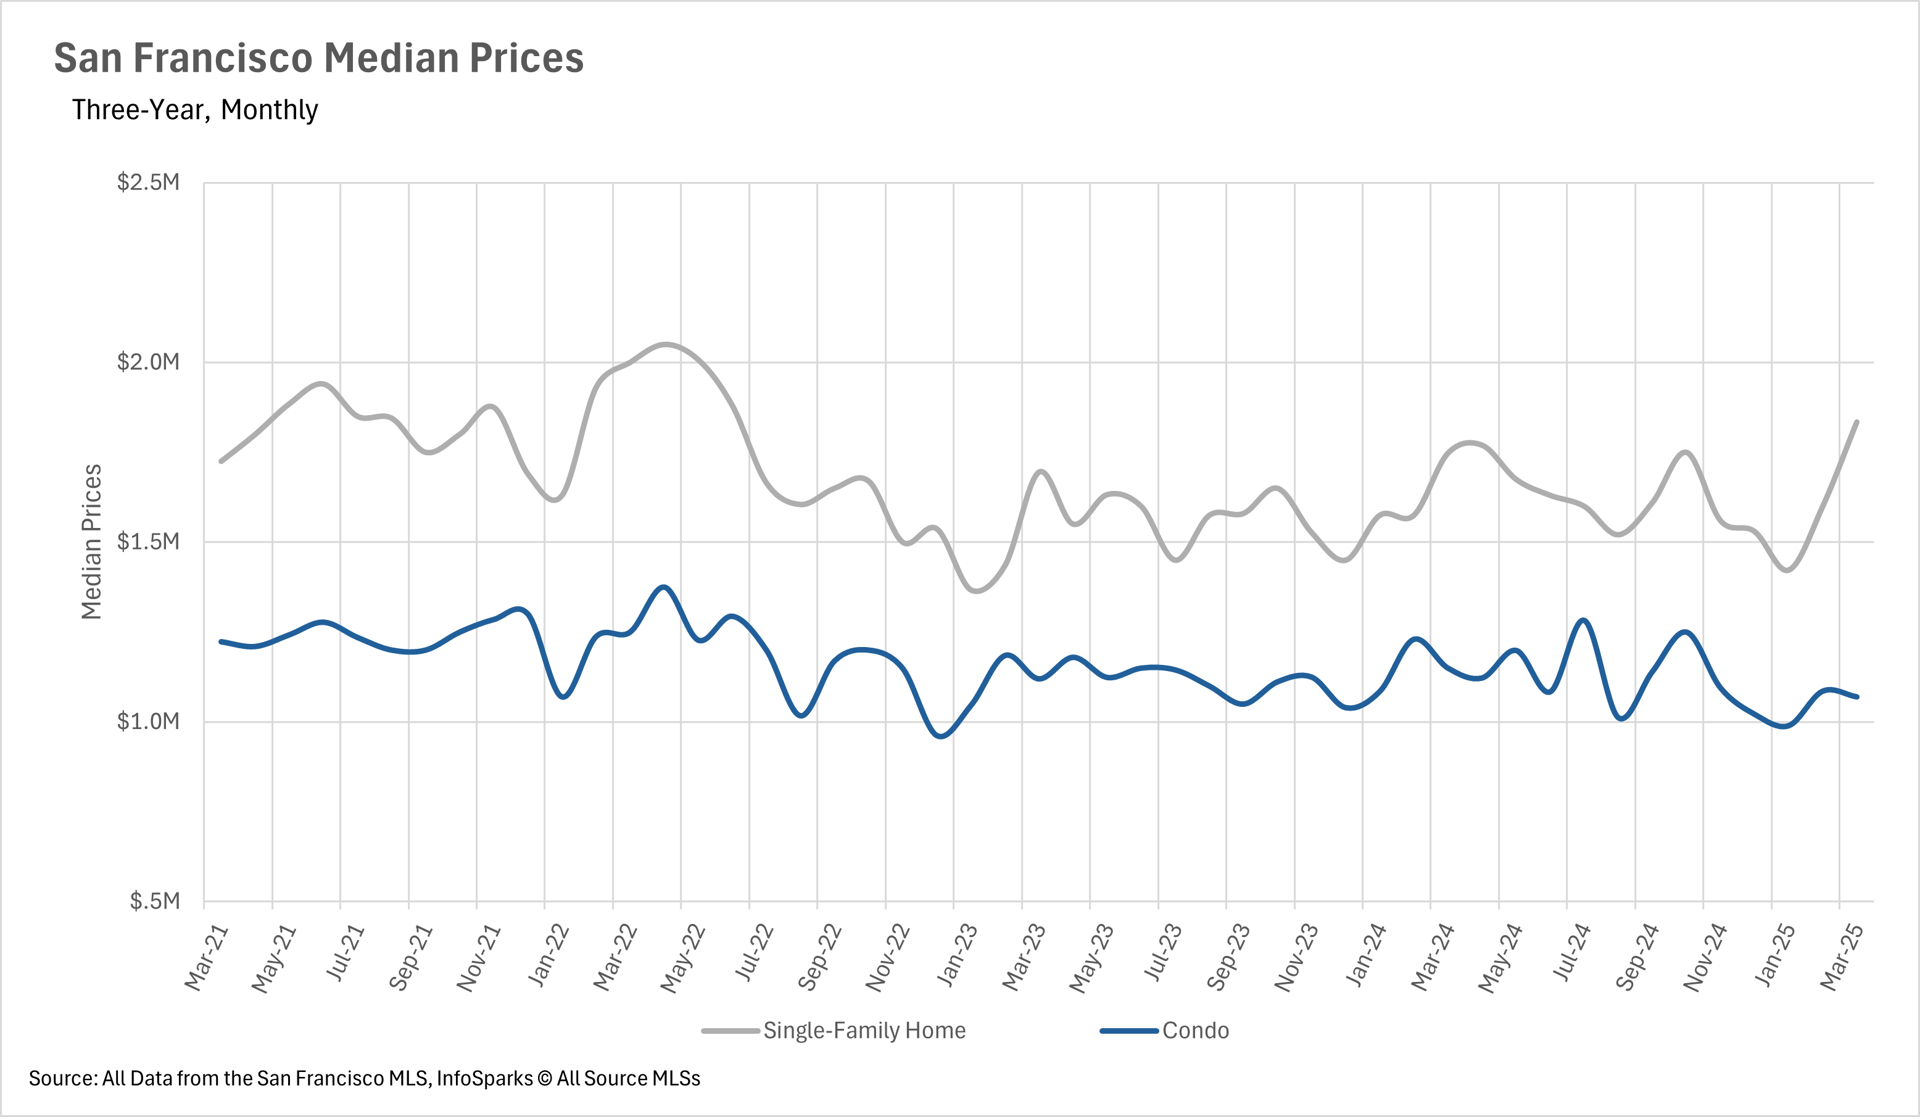
If you’ve been watching the San Francisco housing market over the past few years, you already know—detached homes are golden. Since 2021, the median sale price of single-family homes has climbed by 6.63%, despite economic twists and turns.
On the flip side? Condos in San Francisco haven’t fared as well. The median condo price has dropped a steep 12.52% in the same period. That tells us loud and clear: buyers want privacy, space, and a little breathing room.
Why Single-Family Homes Are Still King
Let’s face it—people crave space. Especially here, where a backyard is more valuable than a parking spot in the Mission. The market reflects that. Buyers are leaning heavily toward standalone homes, which means those homes are retaining and even growing in value
Condo living? It’s a tougher sell right now. Shared walls, HOA fees, limited privacy—it’s just not aligning with today’s homebuyer wishlist, especially post-pandemic.
Want help pricing your single-family home? Start with a free home valuation.
Homes Are Selling Above Asking—Again
Let this sink in: single-family homes are now selling for 114.7% of their original list price. That’s the highest level we’ve seen since the summer of 2022, back before rate hikes chilled the market.
In plain terms? Buyers are overbidding. They're fighting hard for what little inventory is out there. It’s a seller’s market with capital S.
Check out our current featured listings in Noe Valley, Bernal Heights, and the Central Sunset
Inventory is Tight—Like, Really Tight
San Francisco real estate inventory? Yeah… it's basically a trickle. In March, more homes were sold than listed, shrinking an already limited pool of options. And this isn’t just a seasonal blip—inventory has been on a downward trend for months.
Why? Blame interest rates. Homeowners locked into 2–3% mortgage rates aren’t exactly leaping at the chance to trade up to a 7% note. So they stay put, and buyers compete over what’s left.
Want early access to off-market listings? Let’s talk about private sales in your neighborhood.
Who’s Winning? Depends on What You’re Buying.
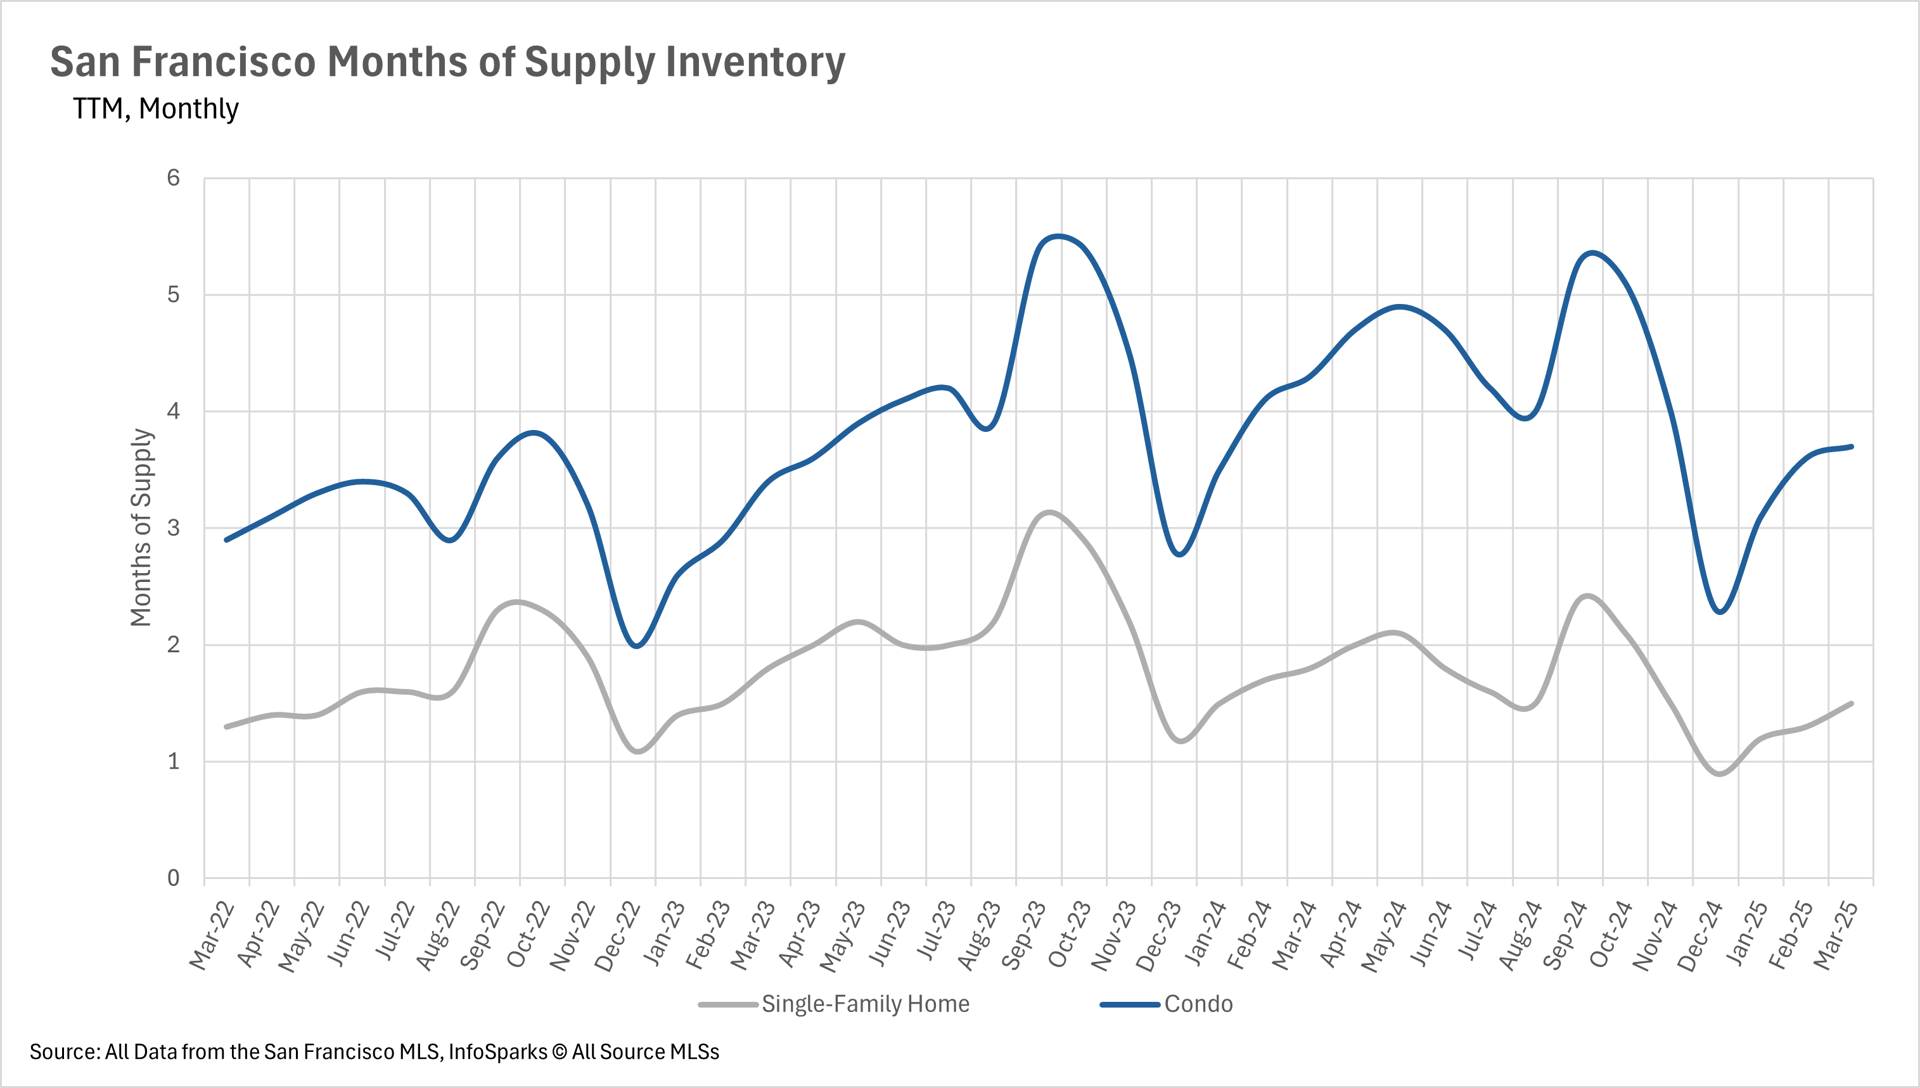
Let’s talk MSI—Months of Supply Inventory. It’s the go-to metric for who has the upper hand: buyers or sellers.
- Single-Family Homes: Just 1.5 months of inventory. Total seller’s market. Expect fast sales and multiple offers.
- Condos: 3.7 months of inventory. This market’s leaning toward buyers, meaning negotiation room and better deals.
Looking to buy a condo near FiDi, SoMa, or South Beach? Here’s where to find value right now.
What This Means for You
For Sellers: If you own a single-family home in San Francisco, this is your moment. Low inventory, high demand, and overbidding? That’s the holy trinity of strong returns. Talk to our team about listing your property.
For Buyers: If you're hunting for value and convenience, the condo market is your friend—especially for first-time buyers. If your heart’s set on a single-family home? Get pre-approved and bring your A-game. You’ll need a savvy strategy and an agent who knows how to play this fast-moving game.
Ready to buy or sell in San Francisco? Let’s connect.