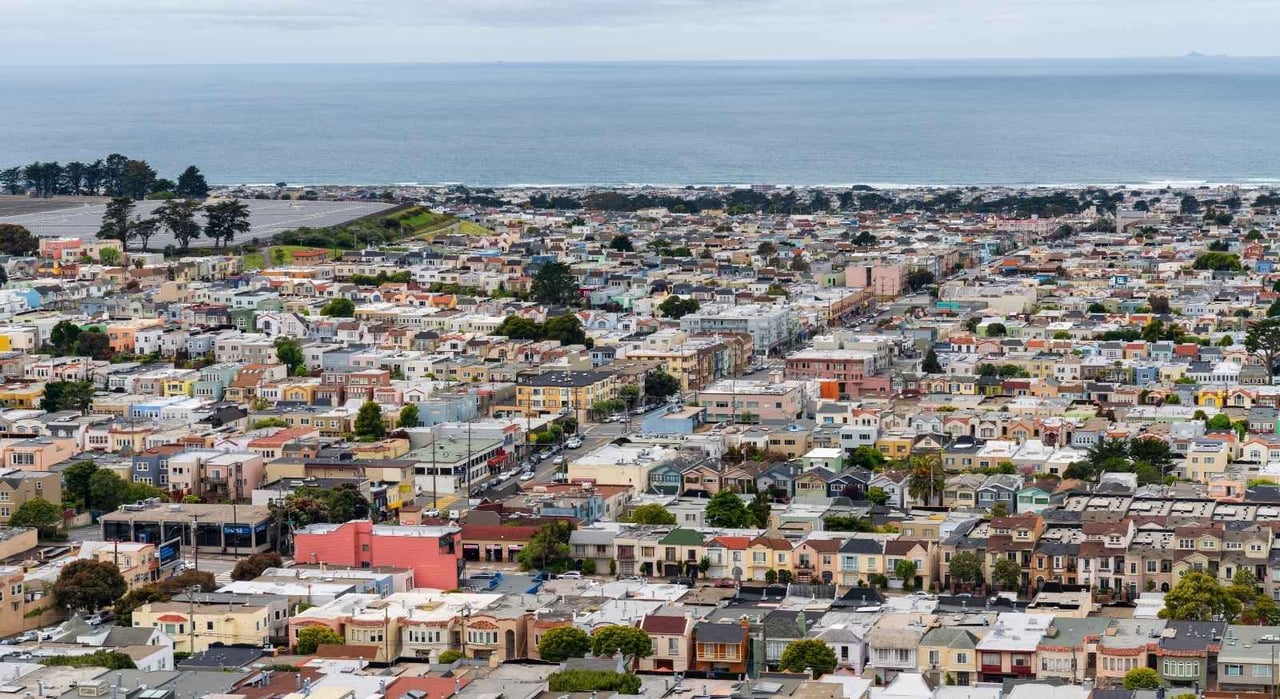
If you've watched a Sunset District listing come and go in under two weeks this year, you're not imagining things. Closed sales across Inner, Central, and Outer Sunset show buyers paying well above asking price in 2026, and the pace has been picking up steadily since 2023.
Inner, Central, and Outer Sunset make up San Francisco's Sunset District, three connected but distinct micro-markets running from Golden Gate Park to Ocean Beach. We pulled sold data going back to 2015 for all three to see how they actually compare right now, not just how they're perceived. The short version: all three are hot, but they're hot in different ways, and the neighborhood that used to be the priciest of the bunch isn't always on top anymore.
Key Takeaways
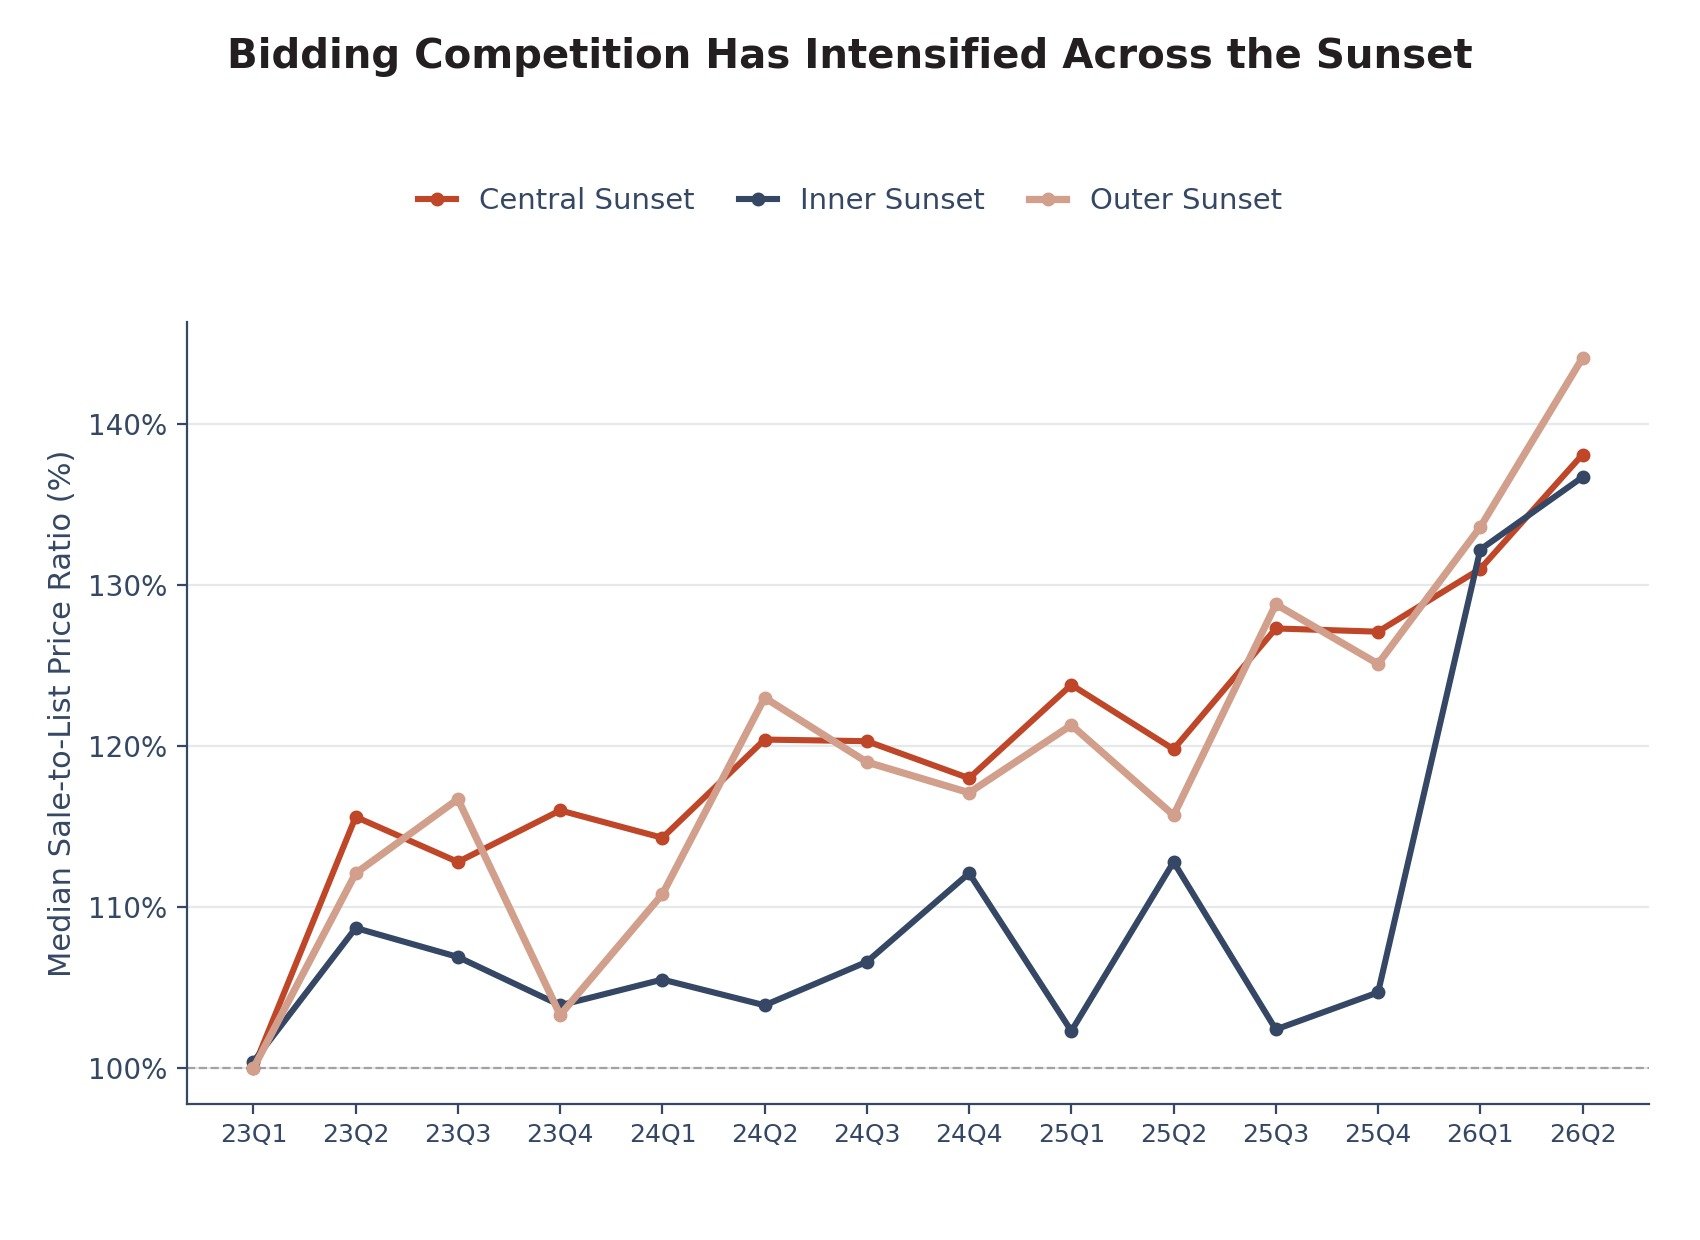
- Sunset homes sold for a median of 130% of list price or higher in Central and Outer Sunset over the past 12 months, up from under 120% the year before.
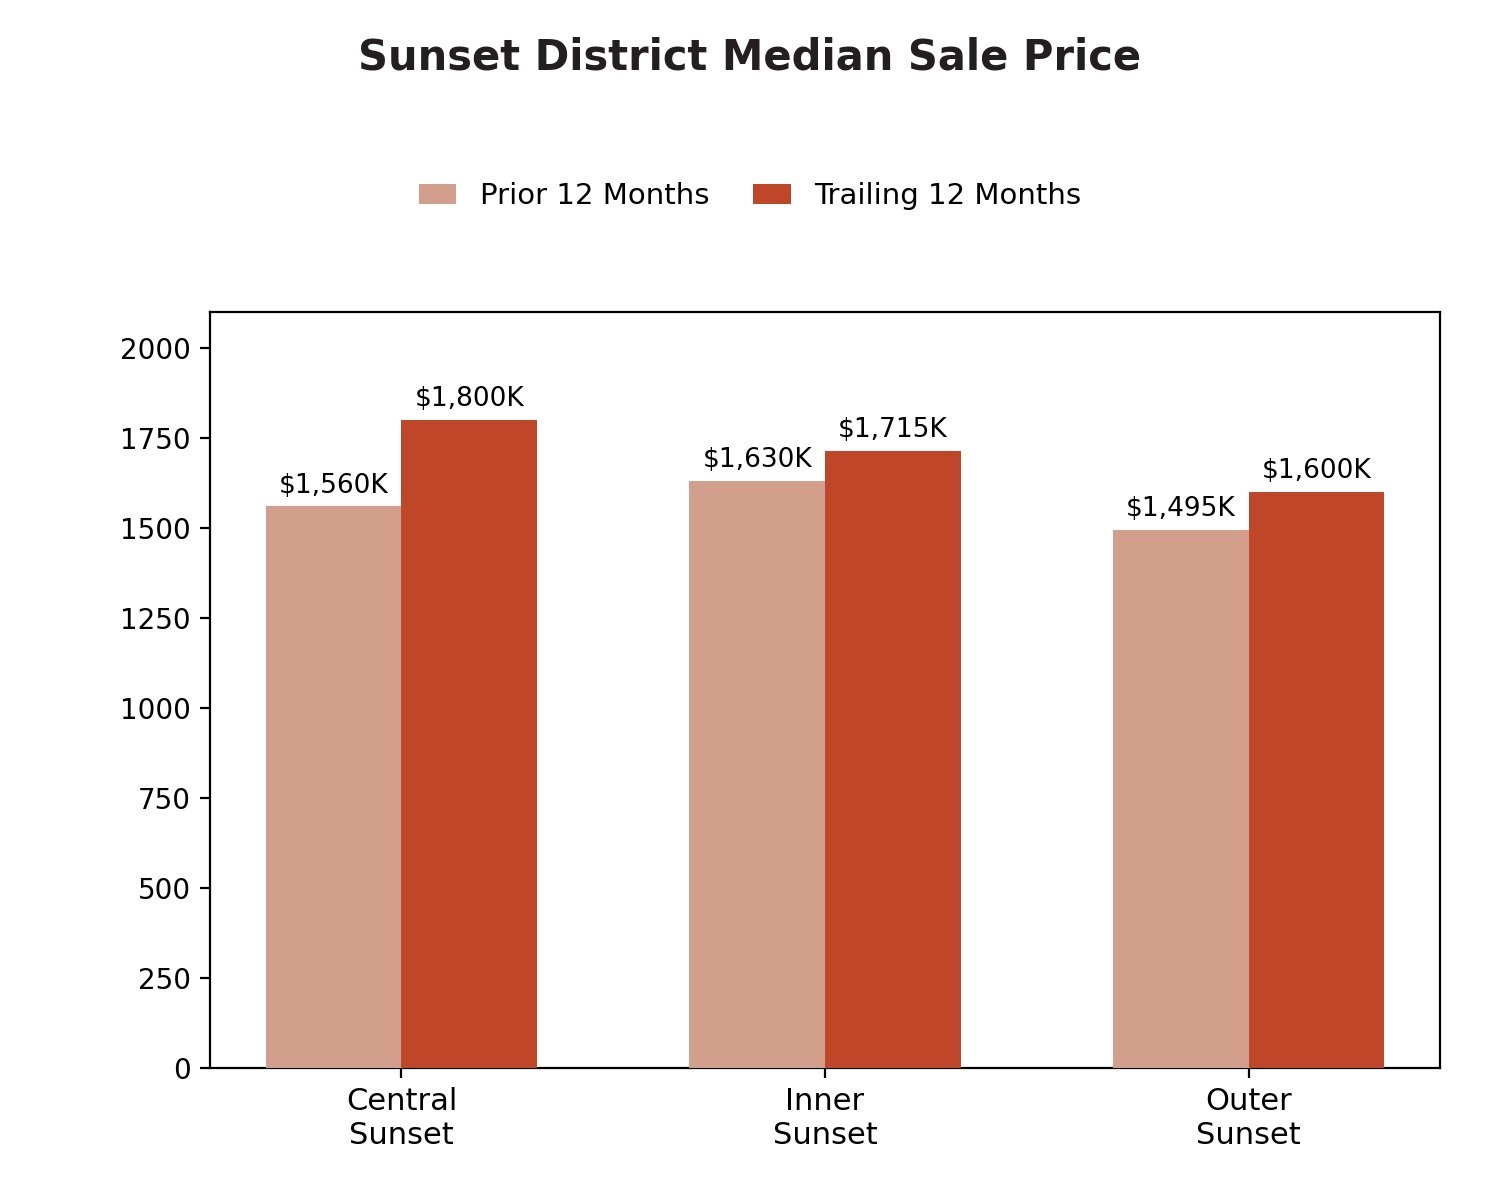
- Central Sunset's median sale price hit $1,800,000 in the past year, edging past Inner Sunset for the first time since 2024.
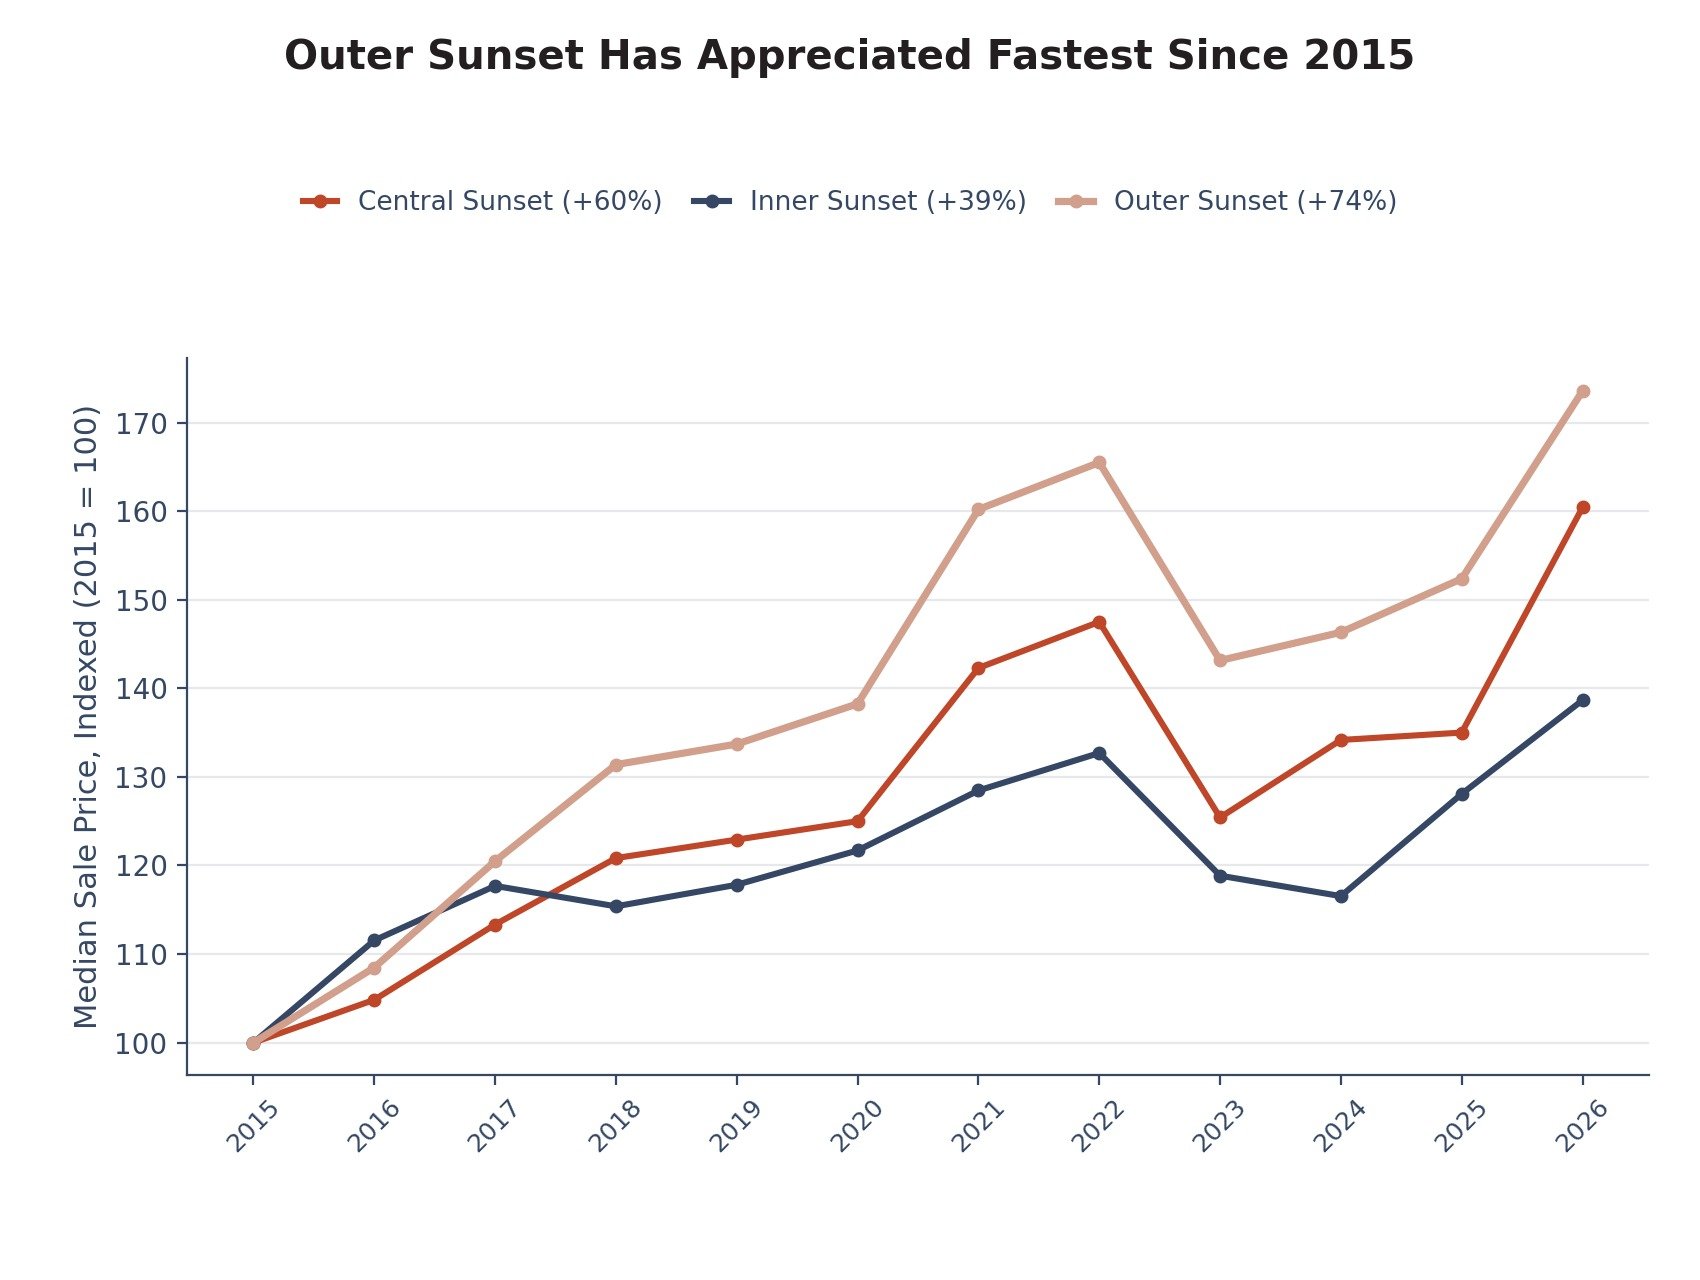
- Outer Sunset has appreciated faster than either neighbor since 2015, up 74% versus 61% in Central Sunset and 39% in Inner Sunset.
- Median days on market sat at just 12 days across all three neighborhoods over the past year.
How Much Have Sunset Home Prices Climbed This Year?
Every corner of the Sunset got more expensive over the past 12 months compared to the 12 months before that. Central Sunset saw the biggest jump: a median sale price of $1,800,000, up about 15% from $1,560,000 the year prior. Outer Sunset followed with a 7% increase, from roughly $1,495,000 to $1,600,000. Inner Sunset grew more modestly, up about 5% to $1,715,000.
Price per square foot tells a similar story. Inner Sunset now commands the highest per-square-foot price of the three at roughly $1,113, followed by Outer Sunset at about $1,161 (yes, technically higher per square foot, even though total prices run lower, since Outer Sunset homes tend to be smaller). Central Sunset sits at roughly $1,063 per square foot, and all three rose between 5% and 8% year over year. Automated home-value snapshots elsewhere can swing a lot month to month in a neighborhood where only 5 to 10 homes close in a typical week, so everything here uses trailing 12-month medians instead, which smooths that noise out:
Neighborhood | Median Sale Price | YoY Change | Price/Sq Ft | Median Days on Market | Median Sale-to-List |
|---|---|---|---|---|---|
Central Sunset | $1,800,000 | +15% | $1,063 | 12 days | 130.0% |
Inner Sunset | $1,715,000 | +5% | $1,113 | 12 days | 116.8% |
Outer Sunset | $1,600,000 | +7% | $1,161 | 12 days | 131.4% |
Why Are Bidding Wars Getting More Intense in the Sunset?
Sale-price-to-list-price ratio is the cleanest way to see competition, and the Sunset's numbers have moved sharply. Back in 2023, quarterly medians across the three neighborhoods sat mostly in the 100% to 117% range, meaning some homes sold right around asking and others got modest bumps. By the second quarter of 2026, that same measure had climbed to 138% in Central Sunset, 137% in Inner Sunset, and 144% in Outer Sunset.
That's not a small shift. A home listed at $1,200,000 selling for 144% of that price closes at roughly $1,728,000, well over half a million dollars above the asking number. We'd guess a mix of tight inventory, still-low mortgage rates relative to a couple years back, and buyers who've been priced out of pricier west-side neighborhoods is driving a lot of this. Whatever the cause, the pattern held across all three neighborhoods, not just one hot pocket.
Days on market backs this up. The median Sunset home sold in about 12 days over the past year, down from 13 to 16 days depending on the neighborhood the year before. Inner Sunset saw the biggest speedup, dropping from a 16-day median to 12.
Central Sunset vs. Inner Sunset: Which Costs More Right Now?
Inner Sunset has typically carried the highest median price of the three neighborhoods, and it held that title for most years between 2015 and 2020. But Central Sunset has been closing the gap since 2021. The two have essentially traded the top spot back and forth every year since: Central led in 2021, 2022, and 2024, while Inner Sunset took it back in 2023 and 2025. Central is on top again this year, with a year-to-date median of $1,925,000 versus Inner Sunset's $1,802,500.
It's worth noting this isn't a clean, one-way trend. It's more like the two neighborhoods have been leapfrogging each other for five years running, and this year happens to favor Central. If you're comparing the two for a purchase, don't assume Inner Sunset is automatically the pricier option. Check the current numbers for whatever property type and size you're targeting, or get a free home valuation for a specific address.
Outer Sunset Is Closing the Gap Faster Than Either Neighbor
Outer Sunset has long been the value play among the three, and it still is on an absolute dollar basis. But it's appreciated the fastest by a wide margin. Since 2015, Outer Sunset's median sale price is up about 74%, compared to 61% in Central Sunset and just 39% in Inner Sunset.
Some of that is simple math: Outer Sunset started from a lower base in 2015 (a median of $991,000, versus $1,300,000 in Inner Sunset), so the same dollar gains produce a bigger percentage move. Even so, the trend line matters if you're thinking about where appreciation is headed next. Outer Sunset isn't the discount neighborhood it once was relative to its neighbors, even if it's still the more affordable entry point today.
What's Actually for Sale? Condos, TICs, and Single-Family Homes
Here's a distinction that doesn't show up in headline price numbers: Inner Sunset has a meaningfully different mix of housing stock than its two neighbors. Roughly 40% of Inner Sunset's closed sales since 2015 have been condos or tenancy-in-common style units, compared to about 6% in both Central and Outer Sunset, where single-family homes dominate the market.
Neighborhood | Single-Family Homes | Condos & TICs | Median Condo Price |
|---|---|---|---|
Central Sunset | ~94% | ~6% | $1,100,000 |
Inner Sunset | ~60% | ~40% | $1,350,000 |
Outer Sunset | ~94% | ~6% | $847,000 |
That matters for buyers weighing entry points. Inner Sunset condos have a median sale price around $1,350,000, well above Central Sunset condos at roughly $1,100,000 and Outer Sunset condos at about $847,000. If you're priced out of a single-family home but want to be in Inner Sunset specifically, close to UCSF, Golden Gate Park, and the N-Judah line, a condo or TIC is a far more common path there than it is in Central or Outer Sunset. You can browse current Sunset listings by property type to see what's actually on the market right now.
When Is the Best Time to Buy or Sell in the Sunset?
Looking at more than a decade of closed sales, spring is consistently the most competitive season across all three neighborhoods. March through July brings the highest sale-price-to-list ratios (typically 119% to 125%) and the fastest closings (12 to 13 days median). January is the opposite end of the spectrum, with ratios dipping to around 110% and median days on market stretching to 24, more than double the spring pace.
If you're a buyer hoping for slightly less competition, late fall or January listings tend to draw fewer bidders. If you're selling and want the fastest close at the strongest price, spring has consistently delivered both. For the broader citywide backdrop, our San Francisco market updates track this same seasonal pattern beyond just the Sunset.
What This Means If You're Buying or Selling in the Sunset
For sellers, this is about as favorable a market as the Sunset has seen in more than a decade of closed sales. Homes are closing fast and well above asking across all three neighborhoods, and pricing strategically below market to spark multiple offers is working better than it has in years.
For buyers, it's a tougher environment, but not an identical one everywhere. Outer Sunset still offers the lowest entry price of the three, even as it appreciates the fastest. Inner Sunset's condo and TIC inventory opens a lower-cost path into a neighborhood where single-family homes are increasingly out of reach. And timing your search for the fall or winter months, rather than spring, may mean facing less competition, even if the overall pool of available homes is smaller.
Every property is different, and these are neighborhood-wide medians, not a quote for your specific home or budget.
Curious how your specific block or property type fits into these numbers? Get in touch and we'll pull the comparables for your situation.
Frequently Asked Questions
Is Central Sunset or Inner Sunset more expensive?
It depends on the year. The two neighborhoods have traded the higher median sale price back and forth since 2021. Over the past 12 months, Central Sunset led at $1,800,000 median versus Inner Sunset's $1,715,000, but Inner Sunset held the top spot as recently as 2025.
How much have Sunset home prices gone up since 2015?
Outer Sunset has seen the largest gain at roughly 74%, followed by Central Sunset at about 61% and Inner Sunset at about 39%, based on median sale prices from closed transactions.
How competitive is the Sunset District market right now?
Very. Over the past year, median sale-price-to-list-price ratios ran from 117% in Inner Sunset to over 130% in Central and Outer Sunset, with homes closing in a median of about 12 days.
Are there condos in the Sunset District, or mostly houses?
Central and Outer Sunset are overwhelmingly single-family homes, with condos and TICs making up roughly 6% of sales. Inner Sunset has a much larger share, closer to 40%, giving buyers there more options at a lower price point.
What's the best time of year to buy in the Sunset?
Late fall and January have historically brought the least competition, with lower sale-to-list ratios and homes sitting on the market roughly twice as long as they do in spring.
Why do Sunset District home price estimates vary between websites?
Most home-value tools report a single month's median, and with only a handful of closed sales per neighborhood each month, one high or low sale can swing that number by six figures. Trailing 12-month medians, pulled directly from closed MLS transactions, smooth out that noise.
Data is current as of July 21, 2026, and reflects closed Central Sunset, Inner Sunset, and Outer Sunset sales reported to SFAR MLS. Statistics may shift as pending sales close and additional listings are reported.
Kevin Gueco, CA DRE# 01461677 | Nini Gueco, CA DRE# 01908351