If you prefer to bypass The Big Story and jump straight to the Local Market Report, click here, click here.
The Big Story
Quick Take:
- Affordability remains a concern across the country despite lower interest rates compared to this time last year.
- New homes are being added to the market, with the US seeing a 4.21% year-over-year increase in the number of new listings in February
- Inventory is getting back to healthier levels as we see backlogs begin to build across the country.
Note: You can find the charts & graphs for the Big Story at the end of the following section.
*National Association of REALTORS® data is released two months behind, so we estimate the most recent month's data when possible and appropriate.
Affordability continues to be an issue nationwide
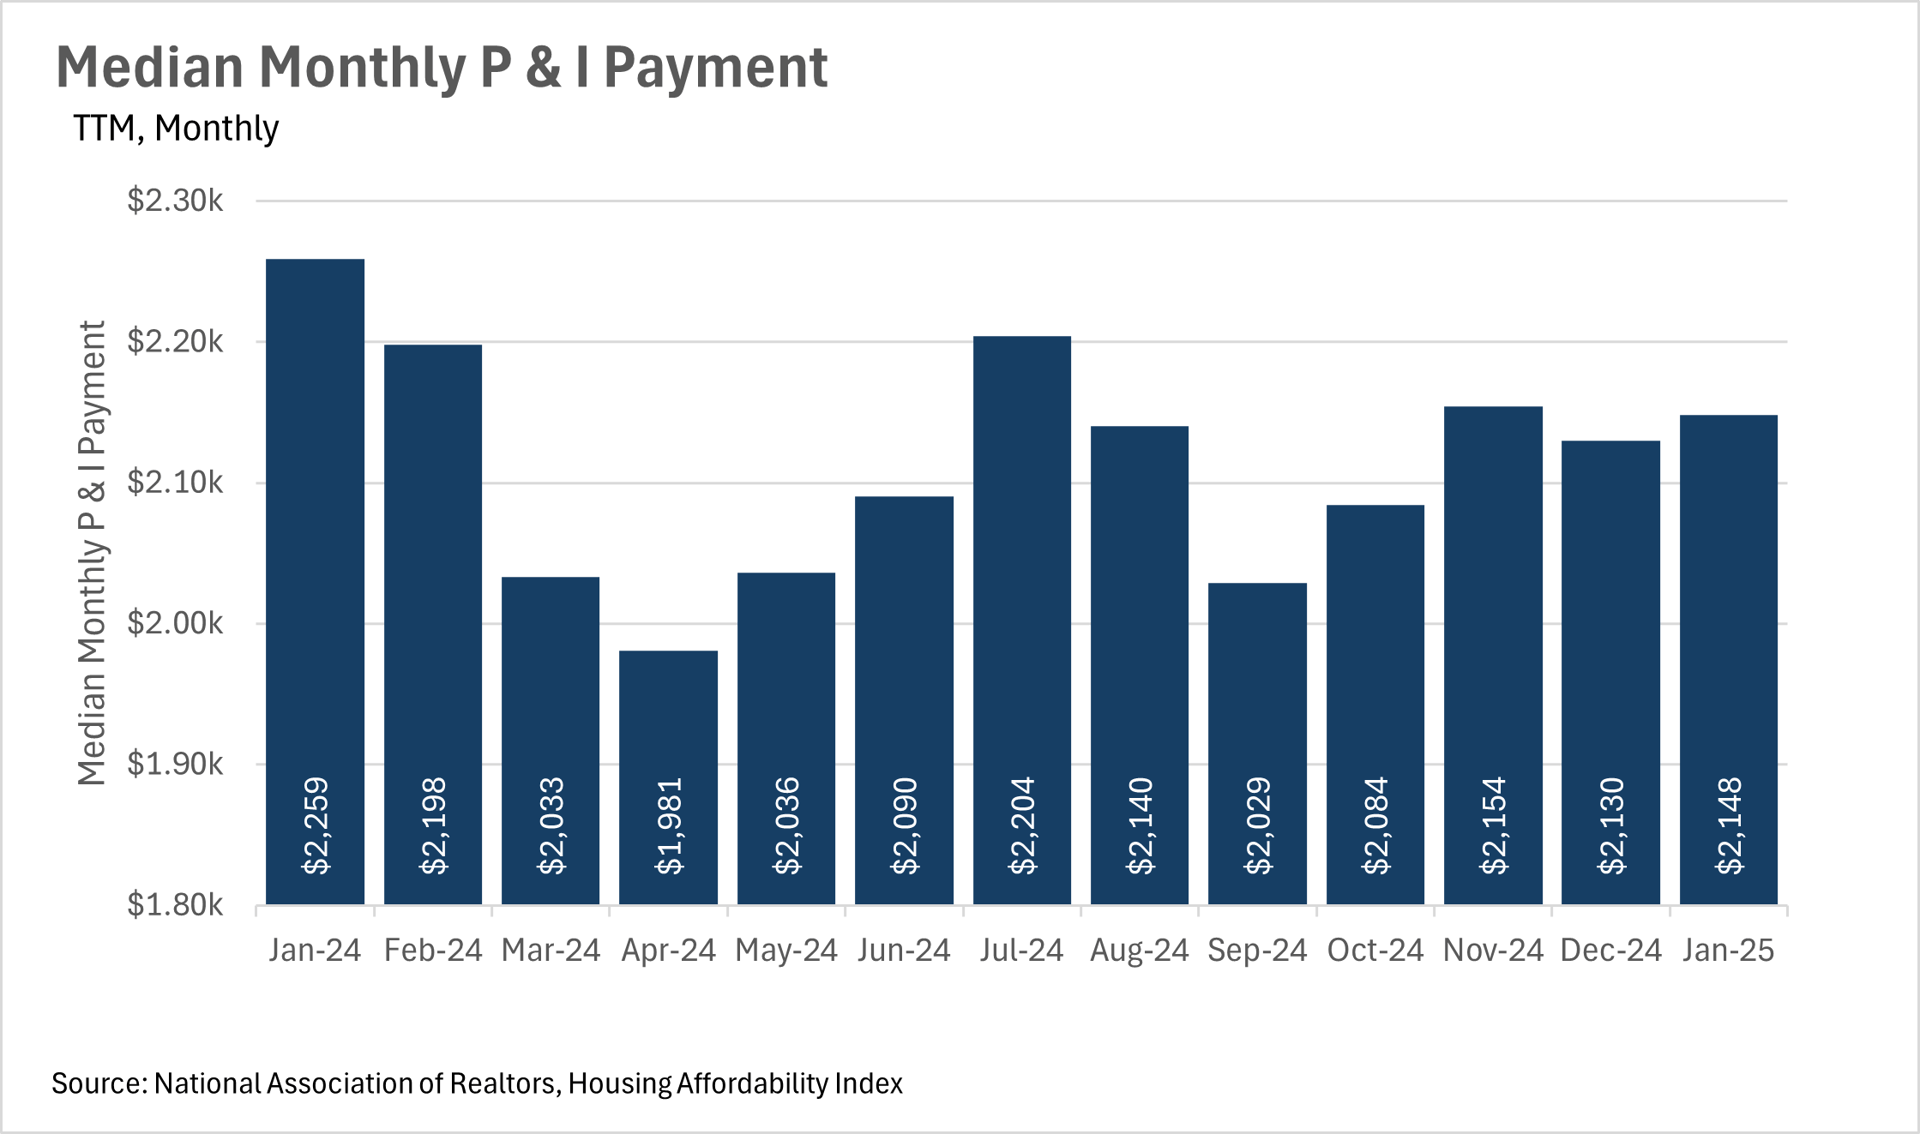
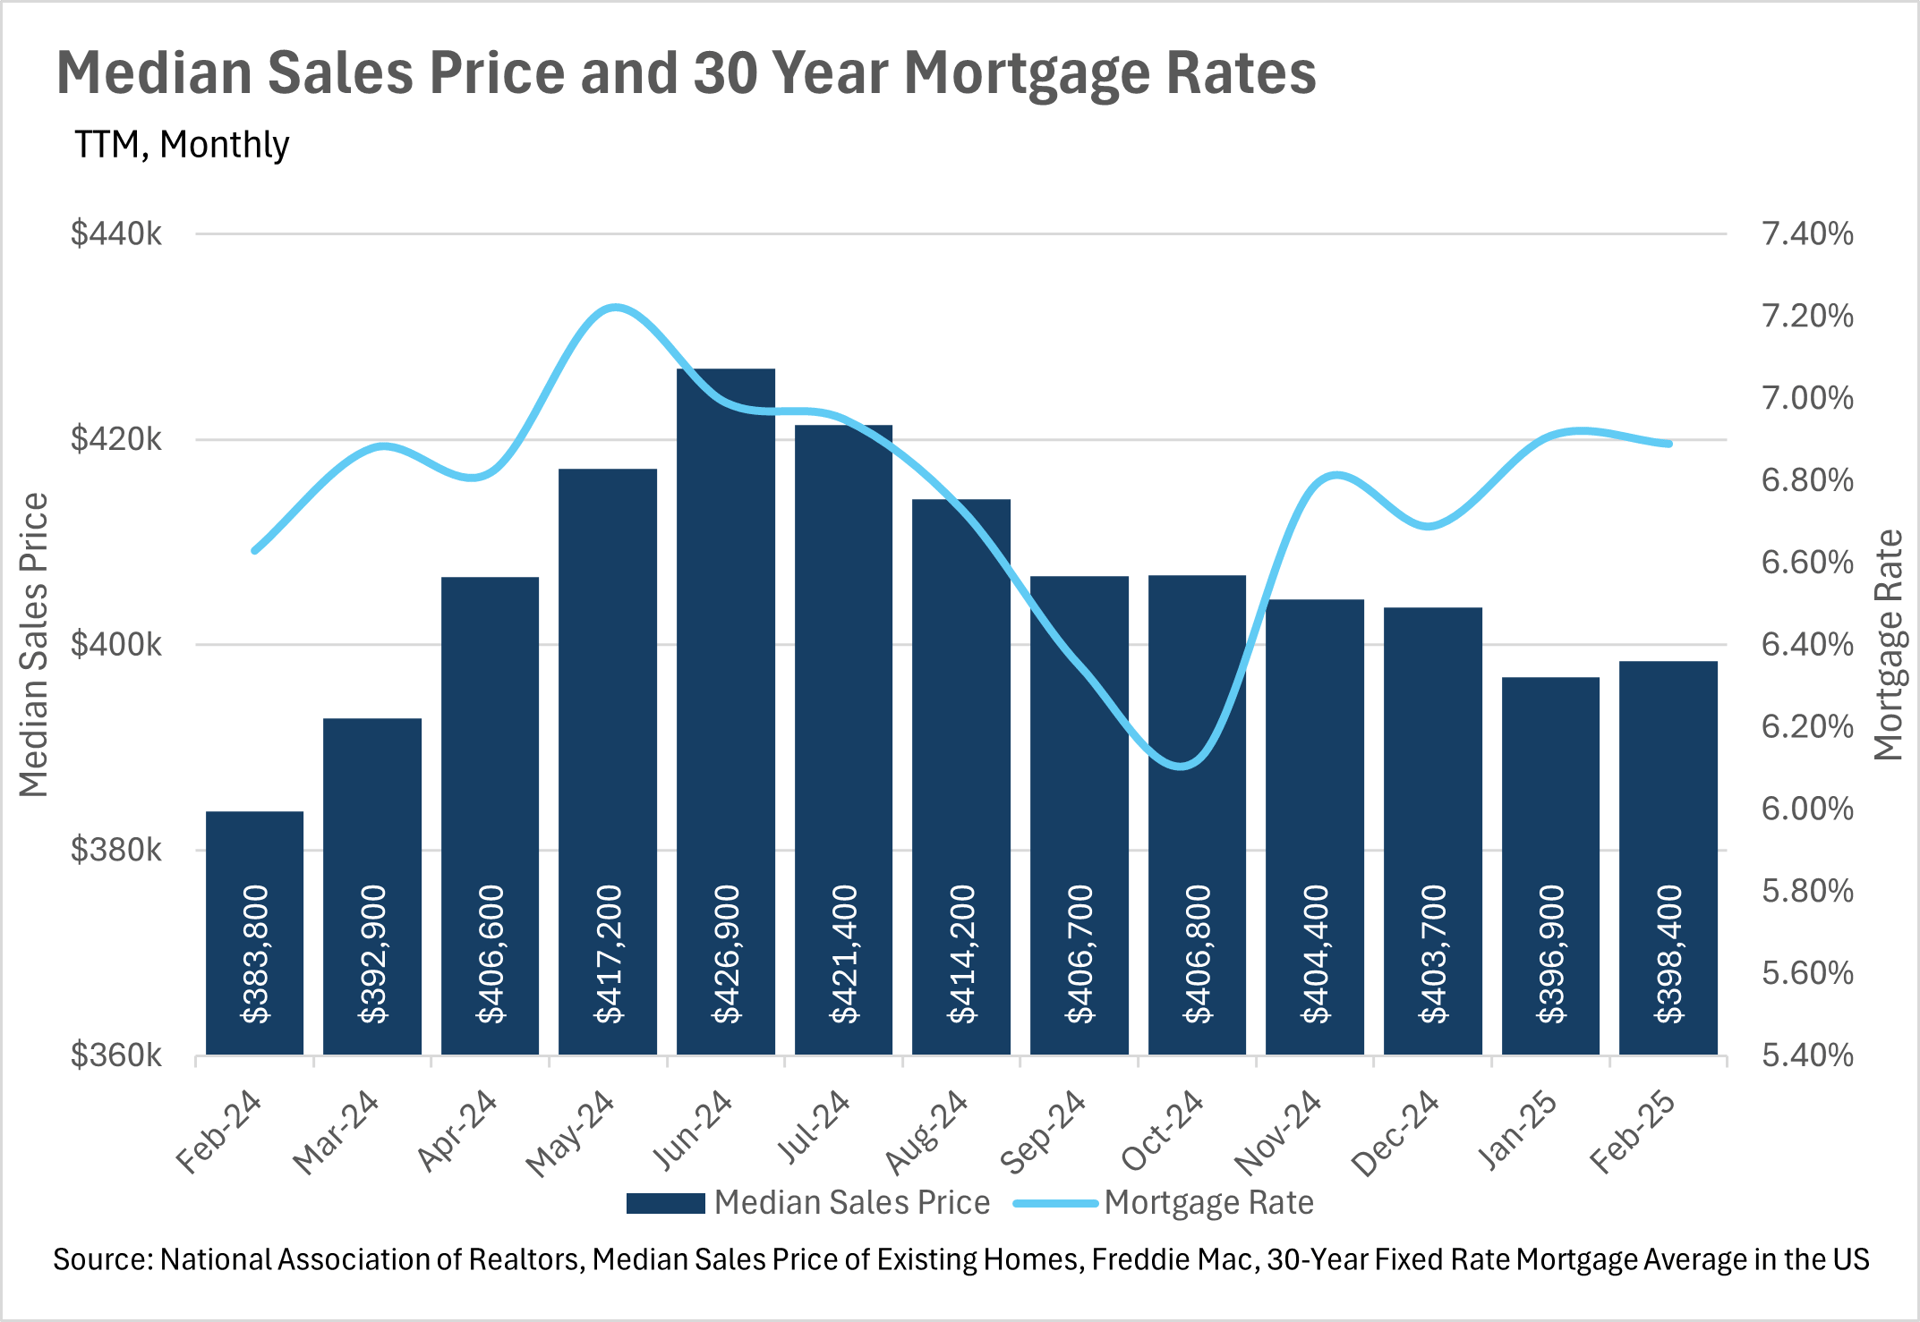
One of the headline issues in the real estate industry over the past few years has been, of course, the affordability (or rather the unaffordability) of homes. Unfortunately for new buyers, and more specifically first time home-buyers, this issue looks like it will persist throughout 2025. Mortgage rates remain comparatively high, and home prices largely have not given back their pandemic-era gains.
This has, of course, made the dreams of homeownership difficult to achieve for countless people around the country. With the median monthly principal and interest payment exceeding $2,100 per month on a nationwide level, people are struggling to afford the purchase of a new home!
New homes are starting to hit the market again
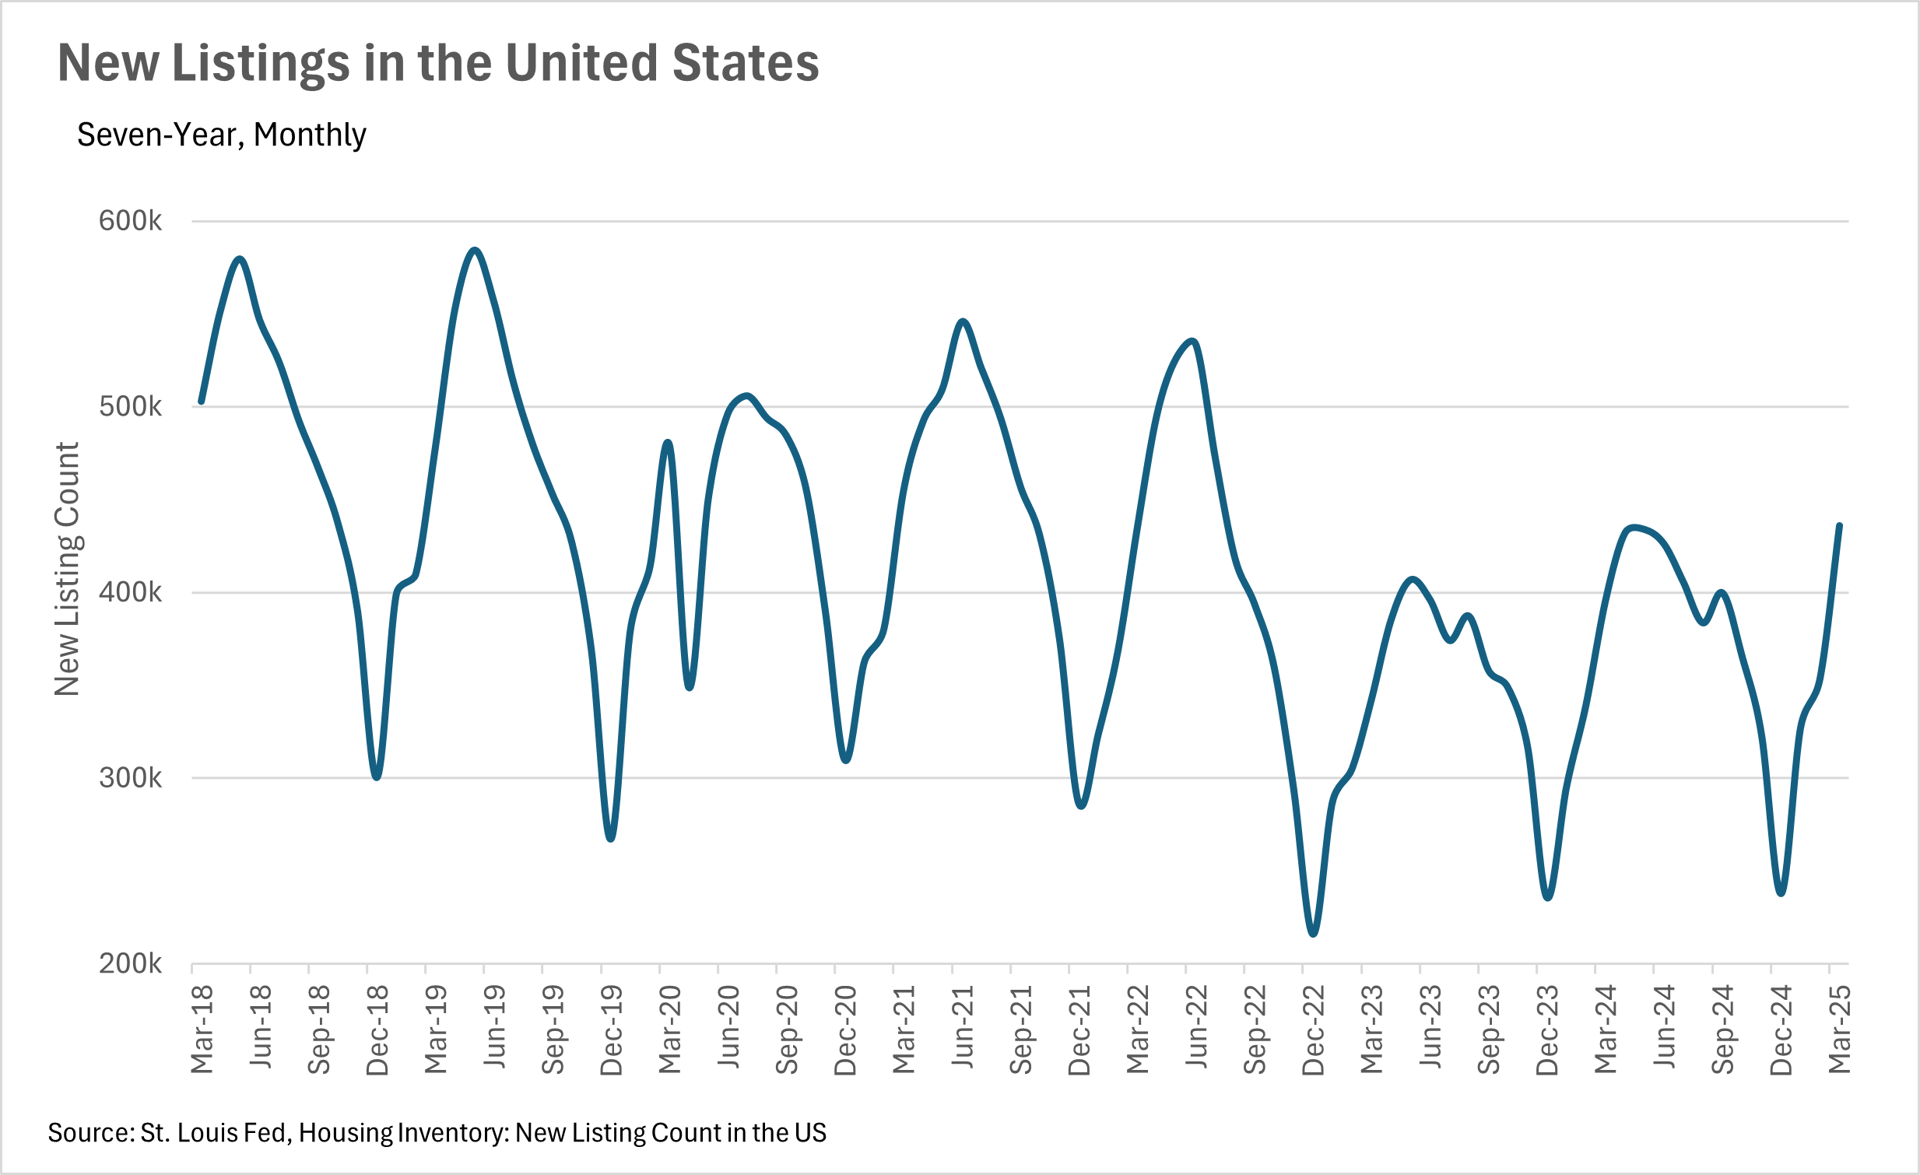
Fortunately for the market, there are plenty of new homes hitting the market though. While there are countless people sitting on the sidelines, waiting for lower interest rates to sell their current home and buy a new one, some of these holdouts are giving up and listing their homes. The writing seems to be on the wall, meaning more and more people are giving up on the thought that we will see lower interest rates in the short term, causing them to list their homes.
This has resulted in a pleasant jump in new home listings, despite us being at the tail end of the slow season. In the month of february, we saw more than 353,000 homes hit the market nationwide. This represents a 4.21% increase on a year-over-year basis, and an 8.15% increase on a month-over-month basis!
Inventories are beginning to build, offering more options for buyers
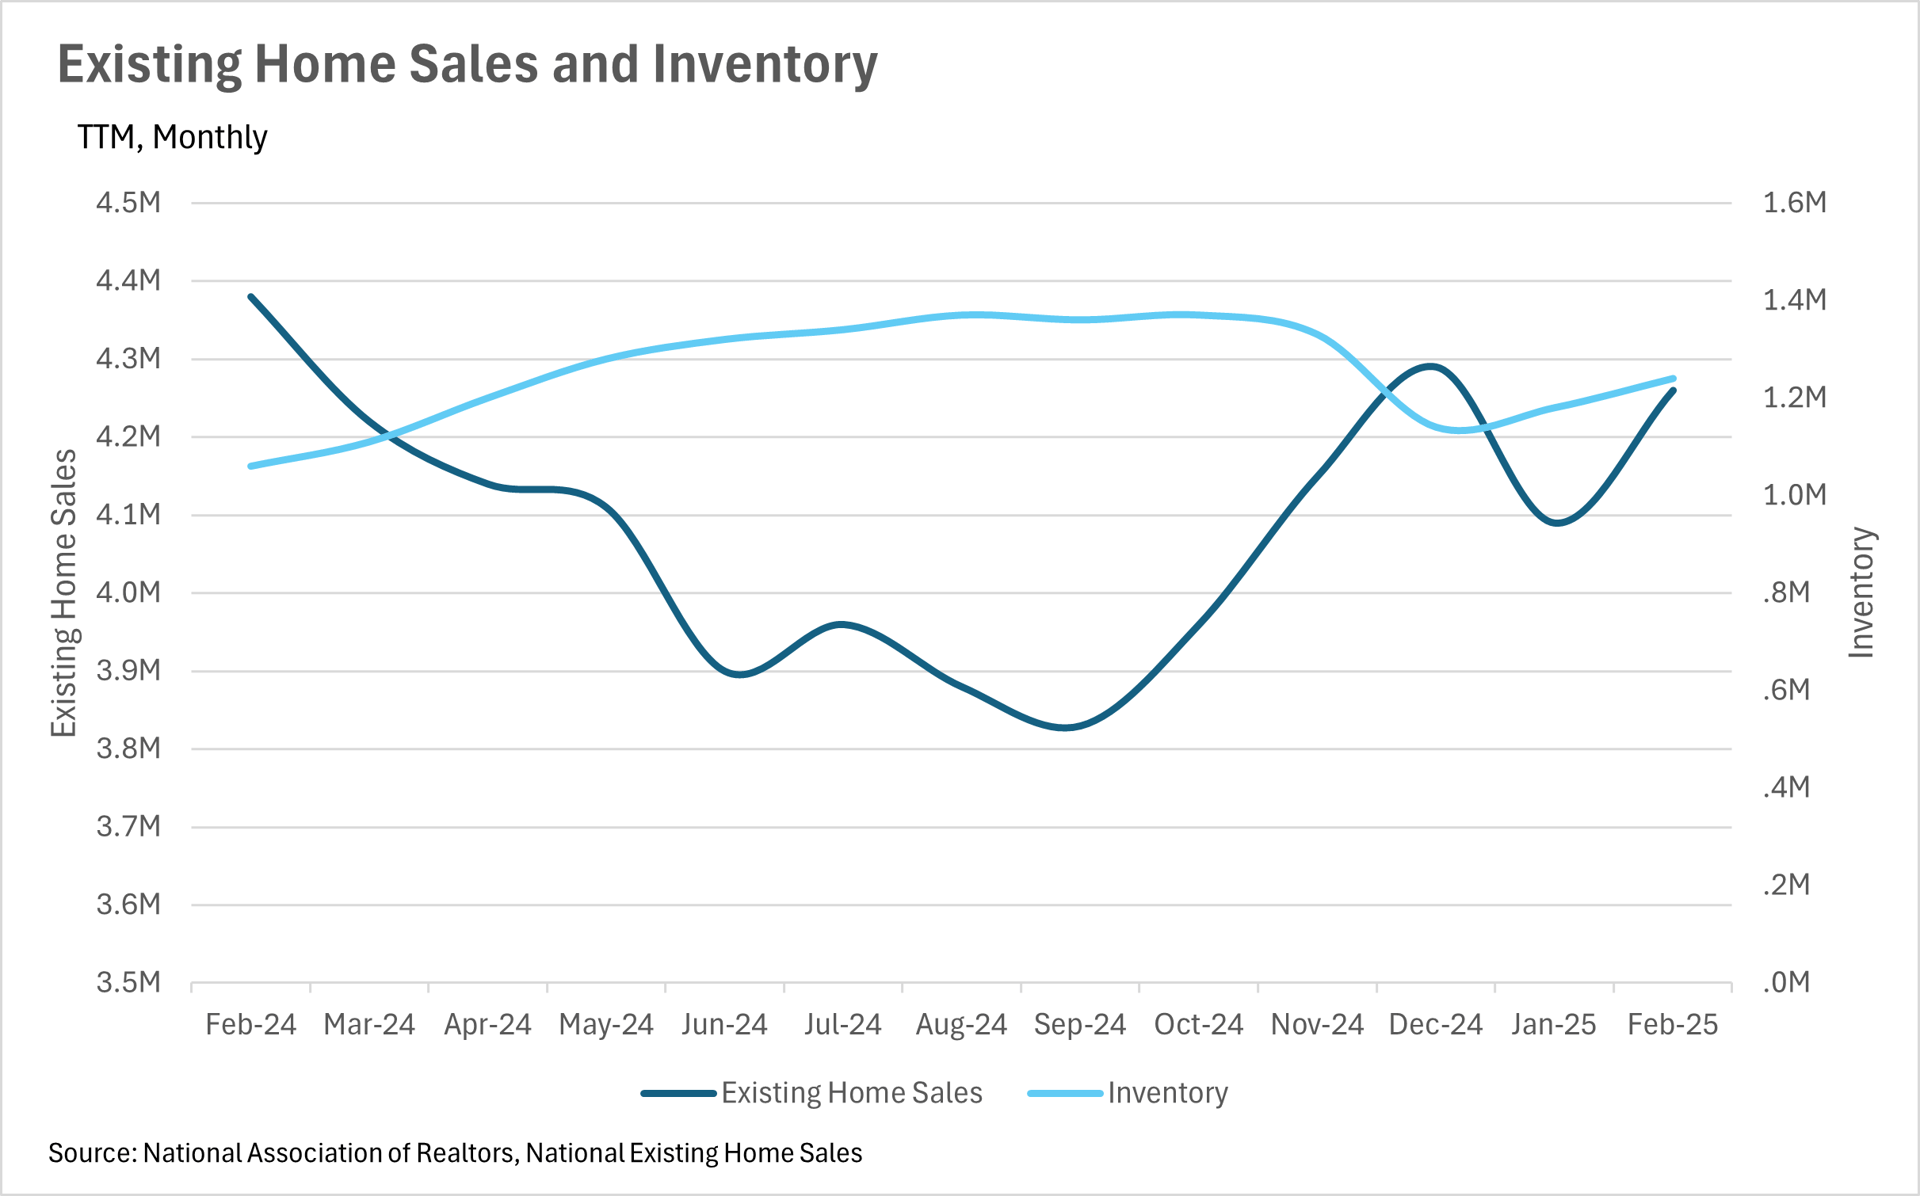
Since we are seeing new inventory hit the market and a steady level of demand, this is causing inventories to build, which is a great sign for those looking to enter the market! In the month of January, there were 1,180,000 homes listed on the market, representing a 16.83% increase on a year-over-year basis and a 3.51% increase on a month-over-month basis. At the same time, we’re seeing demand stagnate a bit, with 4,080,000 homes sold in January, representing a 2% increase when compared to last year and a 4.9% decrease when compared to last month!
Although a top-tier property will likely end up in a bidding war, no matter if it’s in Kansas City or Calabasas, this increase in inventory could mean that there are some deals to be had on listings that sit on the market for a few weeks.
While there are areas that deviate from the national trends, this is generally what's happening nationwide. Below, you'll find a local lowdown that provides you with the in-depth coverage of your area that you need. We will continue to monitor the housing market and overall economy to help guide you in buying or selling your home.
Big Story Data
>
The Local Lowdown
Quick Take:
- The entire Silicon Valley continues to be a hotspot for growth, as home values continue to increase at a rapid rate.
- Despite strong trends in median sales prices, inventory continues to build, as tons of new listings hit the market.
- New listings are still being bought up at an incredibly fast rate, considering the amount of inventory that has built up over the past couple of months.
Note: You can find the charts/graphs for the Local Lowdown at the end of this section.
Why Silicon Valley Continues to Be a Hotspot for Real Estate Investment
Silicon Valley has long been a symbol of innovation and prosperity, and its real estate market reflects this reputation. Even in 2025, the region’s housing market is demonstrating why itremains one of the most desirable places to buy, sell, and invest. From its thriving tech scene to its unparalleled lifestyle, Silicon Valley continues to attract homebuyers and investors alike.
The Appeal of Silicon Valley Real Estate
Silicon Valley’s status as the global epicenter of technology is a key driver of its real estate demand. Major corporations like Apple, Google, and Meta not only provide jobs but also create a dynamic, innovation-driven culture that attracts talent from around the world. This influx of professionals has led to steady population growth, which in turn fuels demand for housing.
Beyond the economic opportunities, Silicon Valley offers a high quality of life. The region boasts excellent schools, a temperate climate, and diverse cultural and recreational amenities. Neighborhoods like Palo Alto and Los Altos, known for their tree-lined streets and family-friendly environments, are highly sought after. The combination of these factors makes Silicon Valley a magnet for those seeking a vibrant yet balanced lifestyle.
Historically, Silicon Valley’s real estate market has been resilient, consistently appreciating over the years. Even during economic fluctuations, the region has maintained its status as a stable and lucrative investment. This enduring appeal is evident in the 2025 market trends.
Understanding the 2025 Market Trends
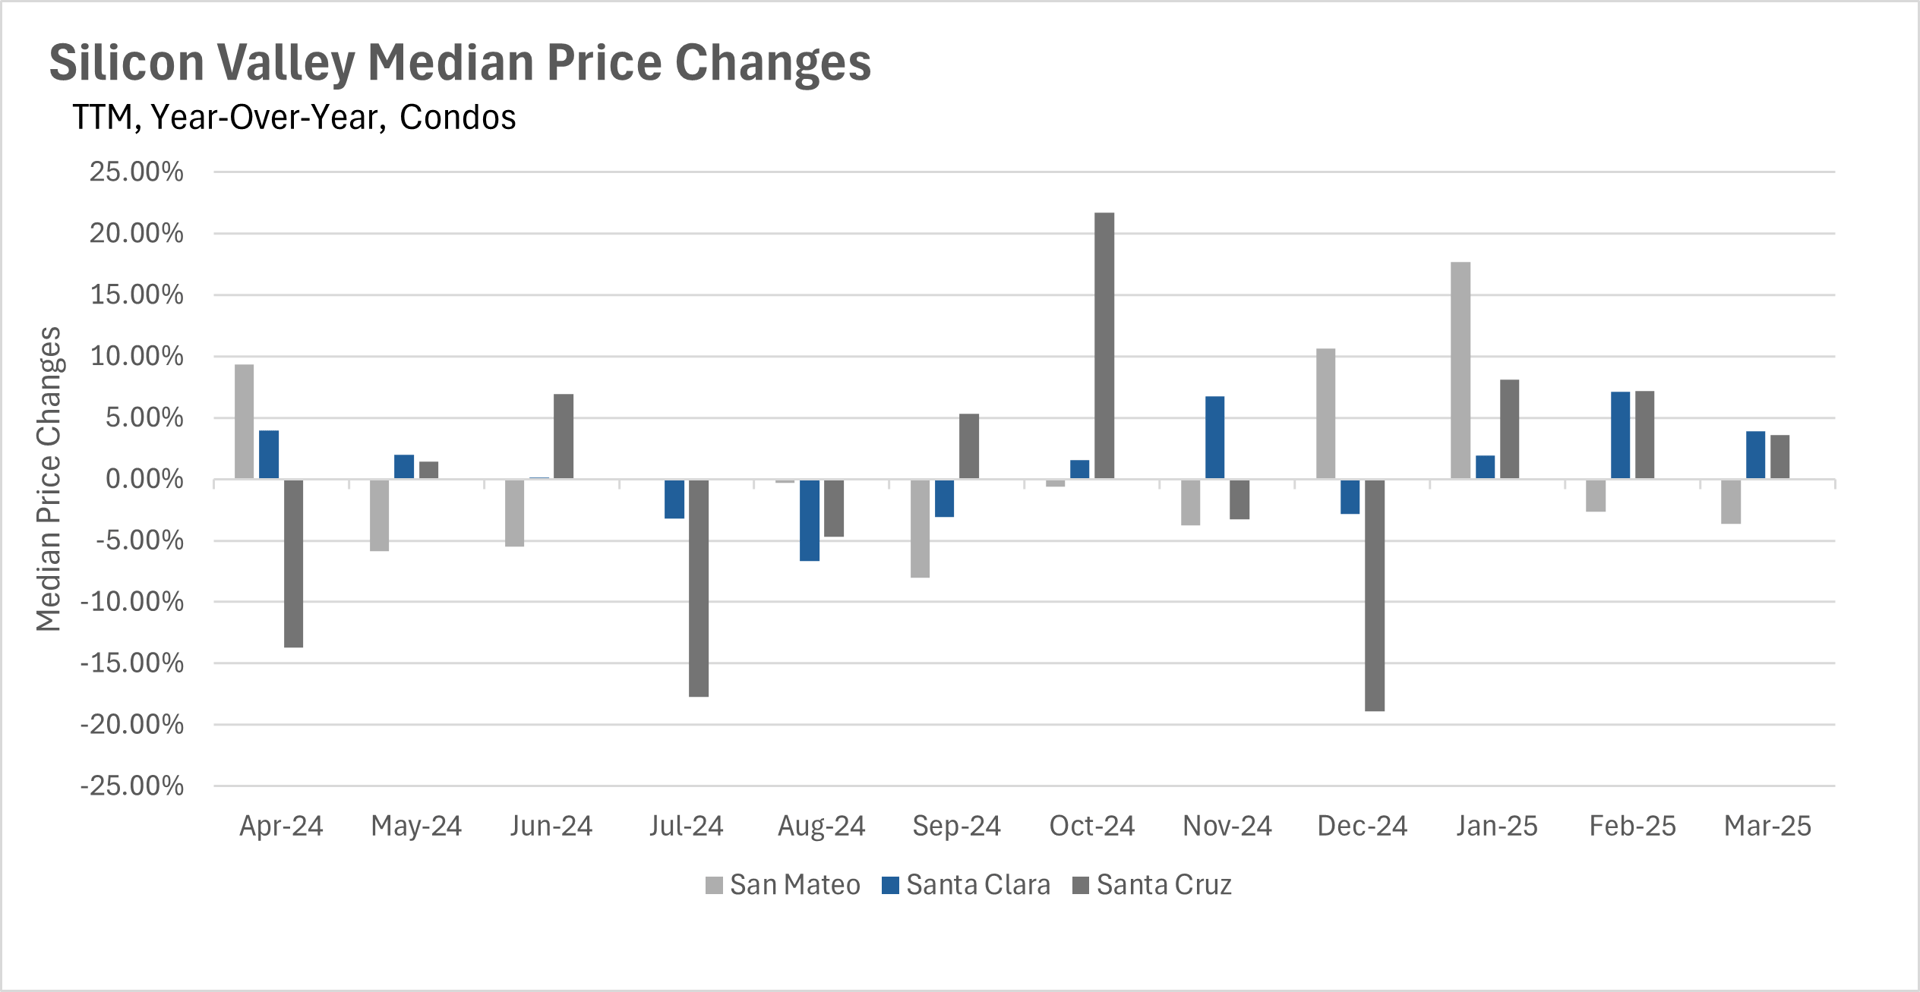
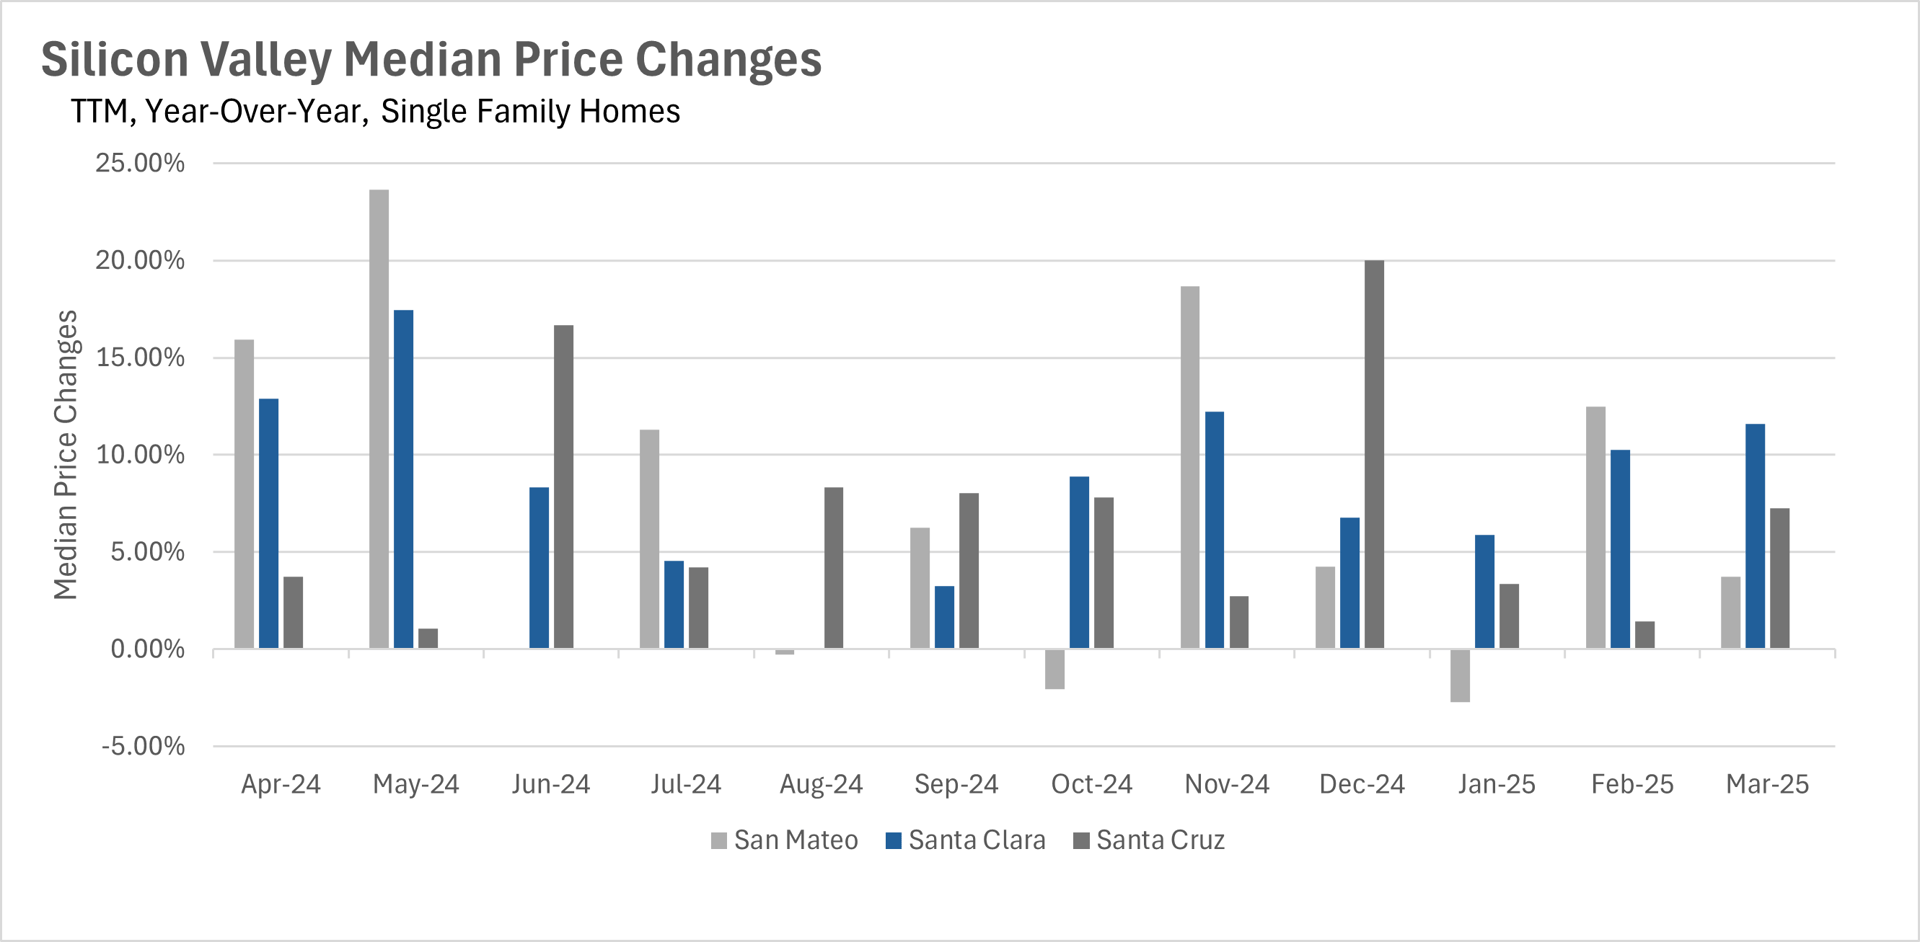
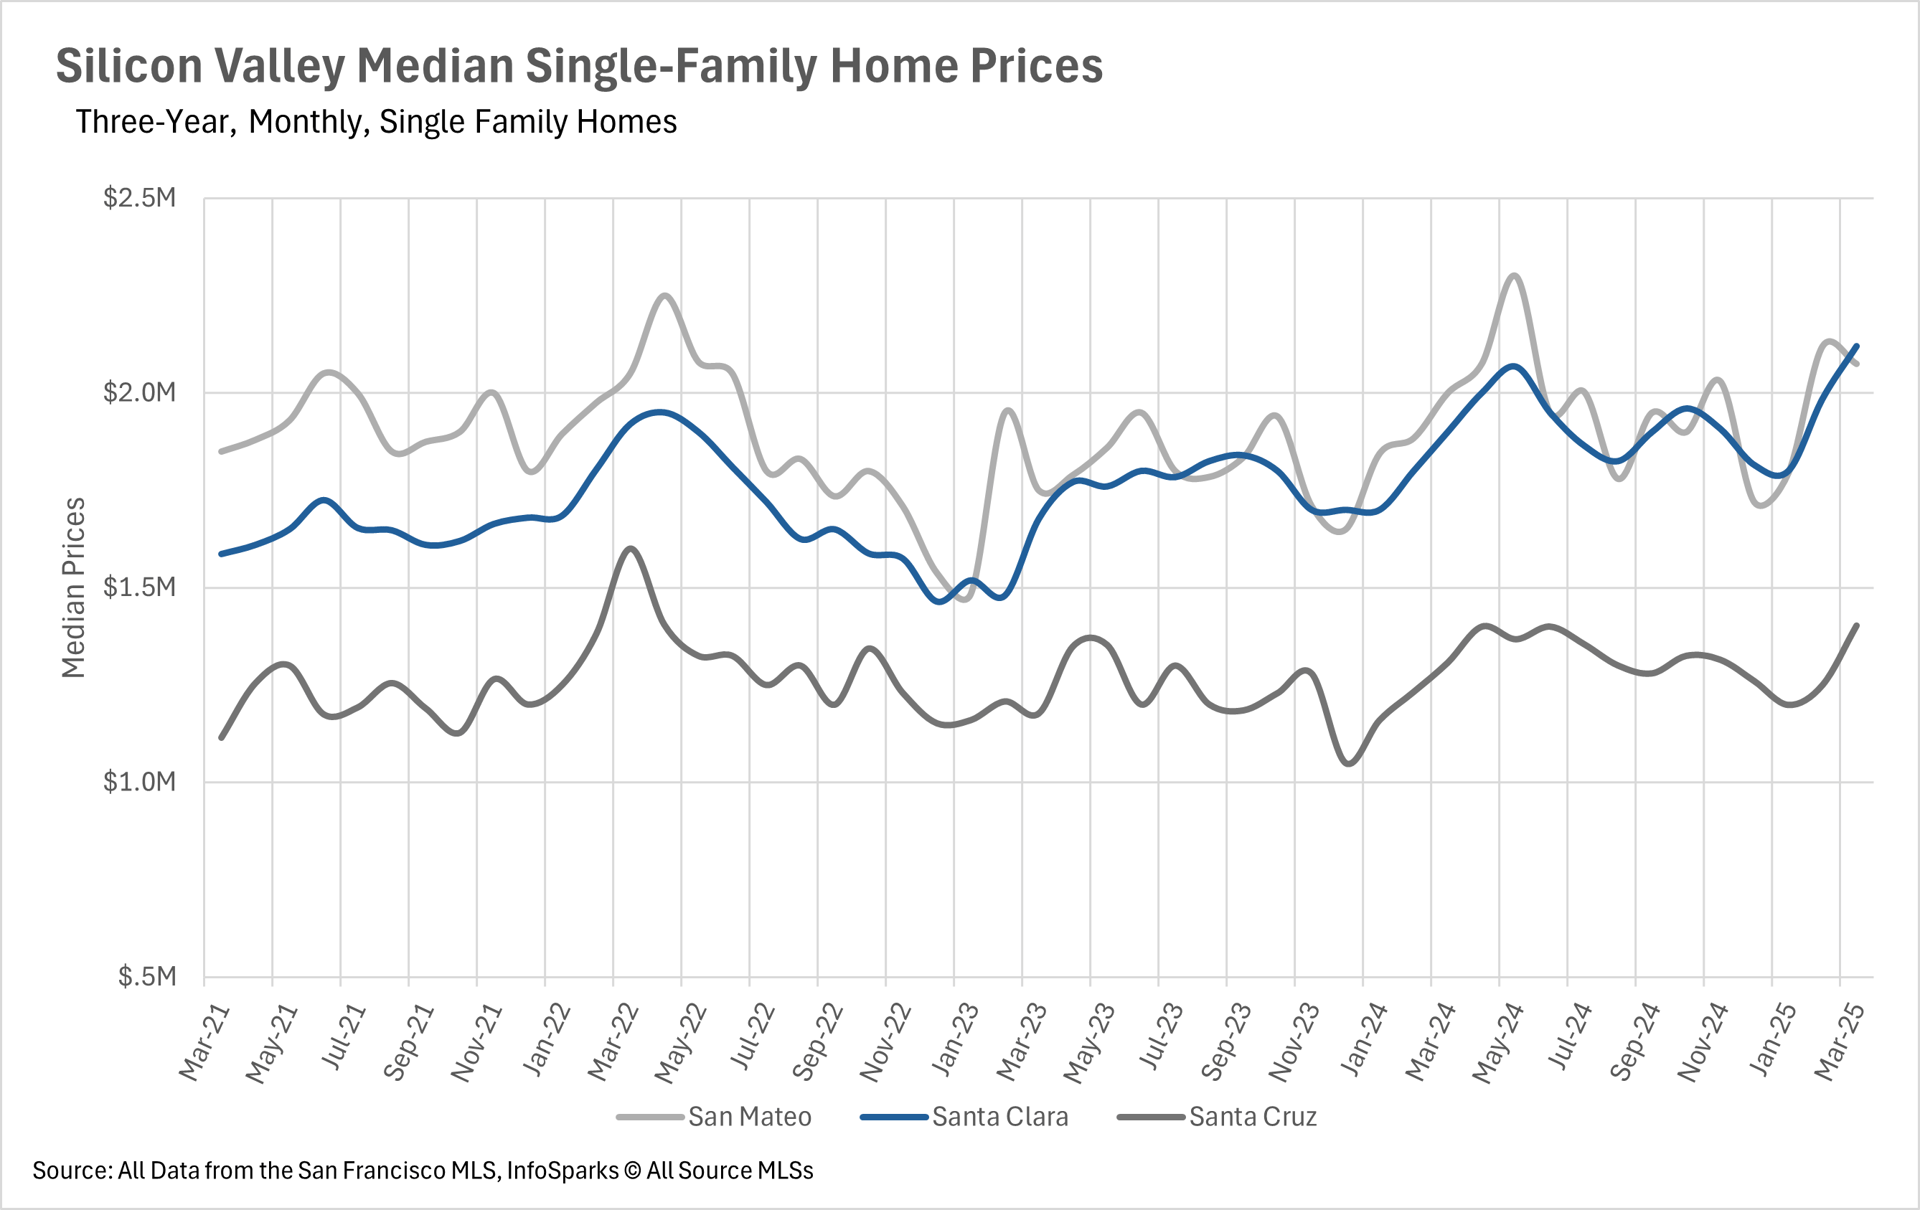
This year, the Silicon Valley real estate market continues to perform strongly. Median sale prices have risen significantly across the region. For example, in March 2025, San Mateo County saw a 3.75% increase in median sale prices compared to the previous year. Santa Cruz County experienced a 7.27% rise, while Santa Clara County surged by an impressive 11.58%. Such growth underscores the area’s enduring value for homeowners and investors alike.
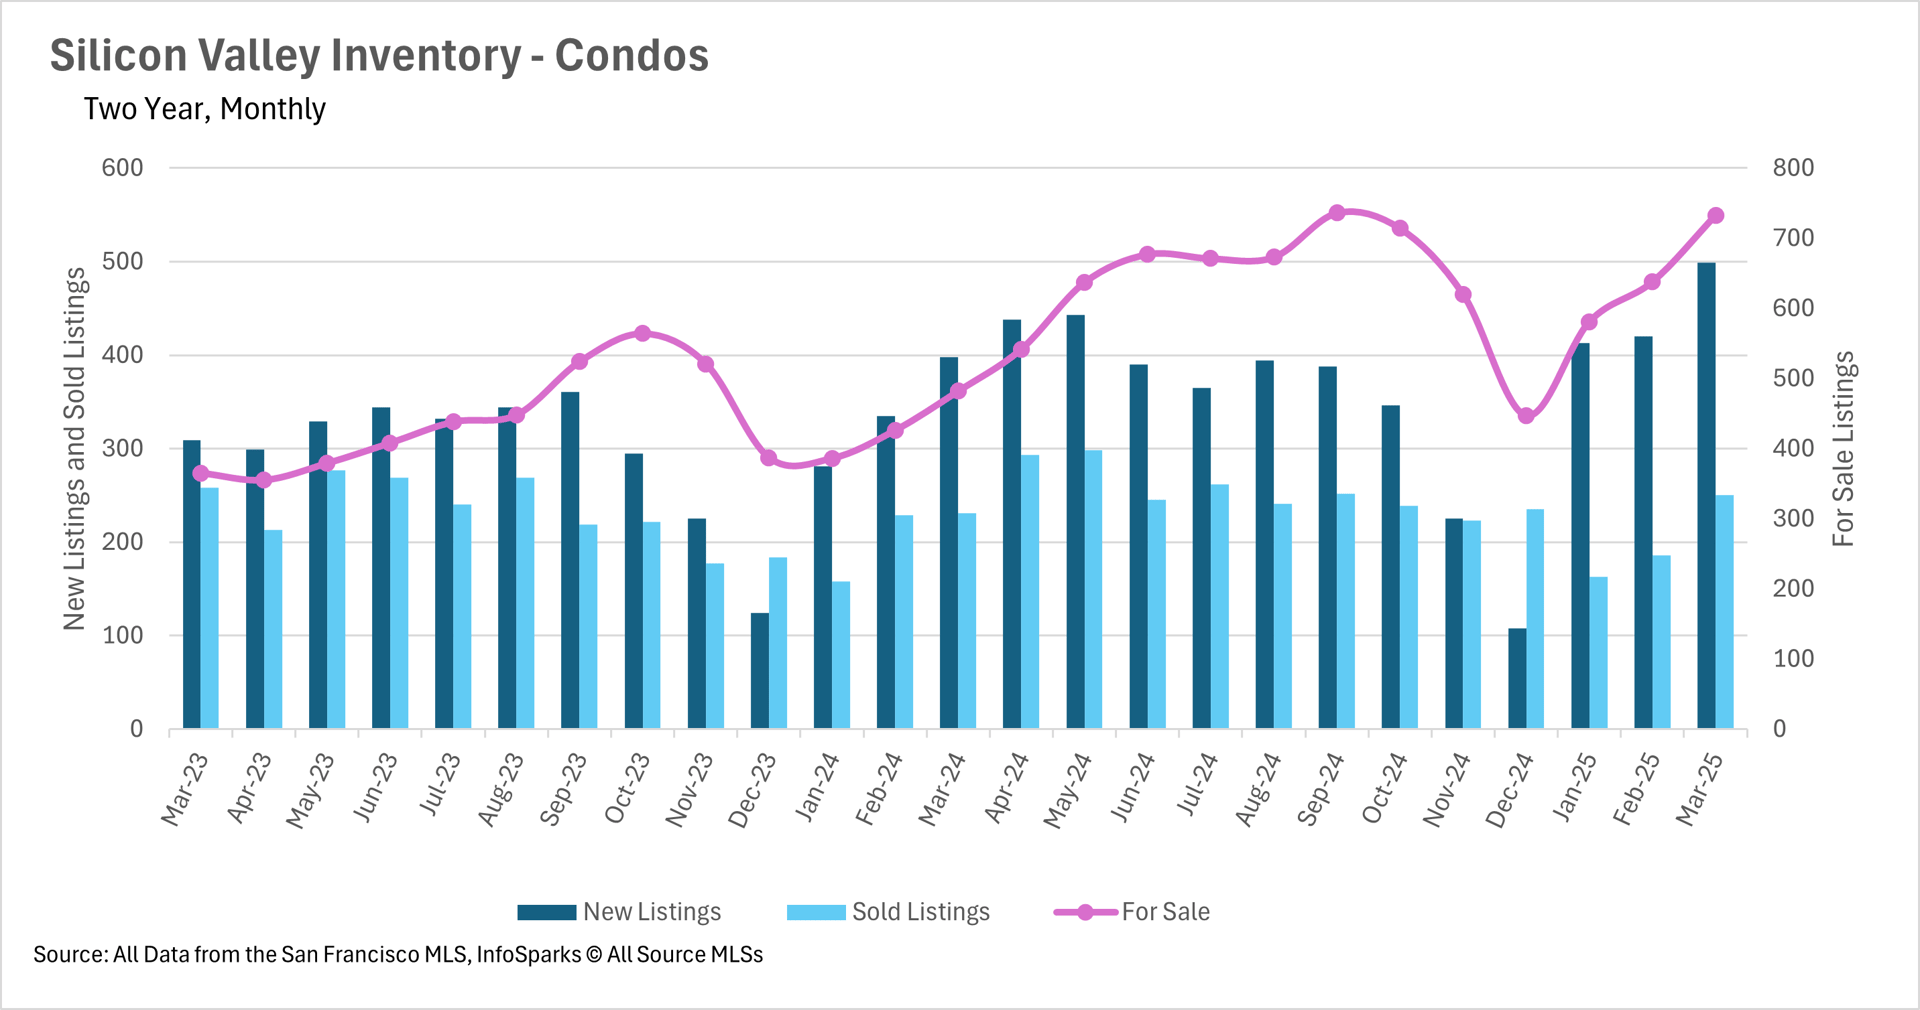
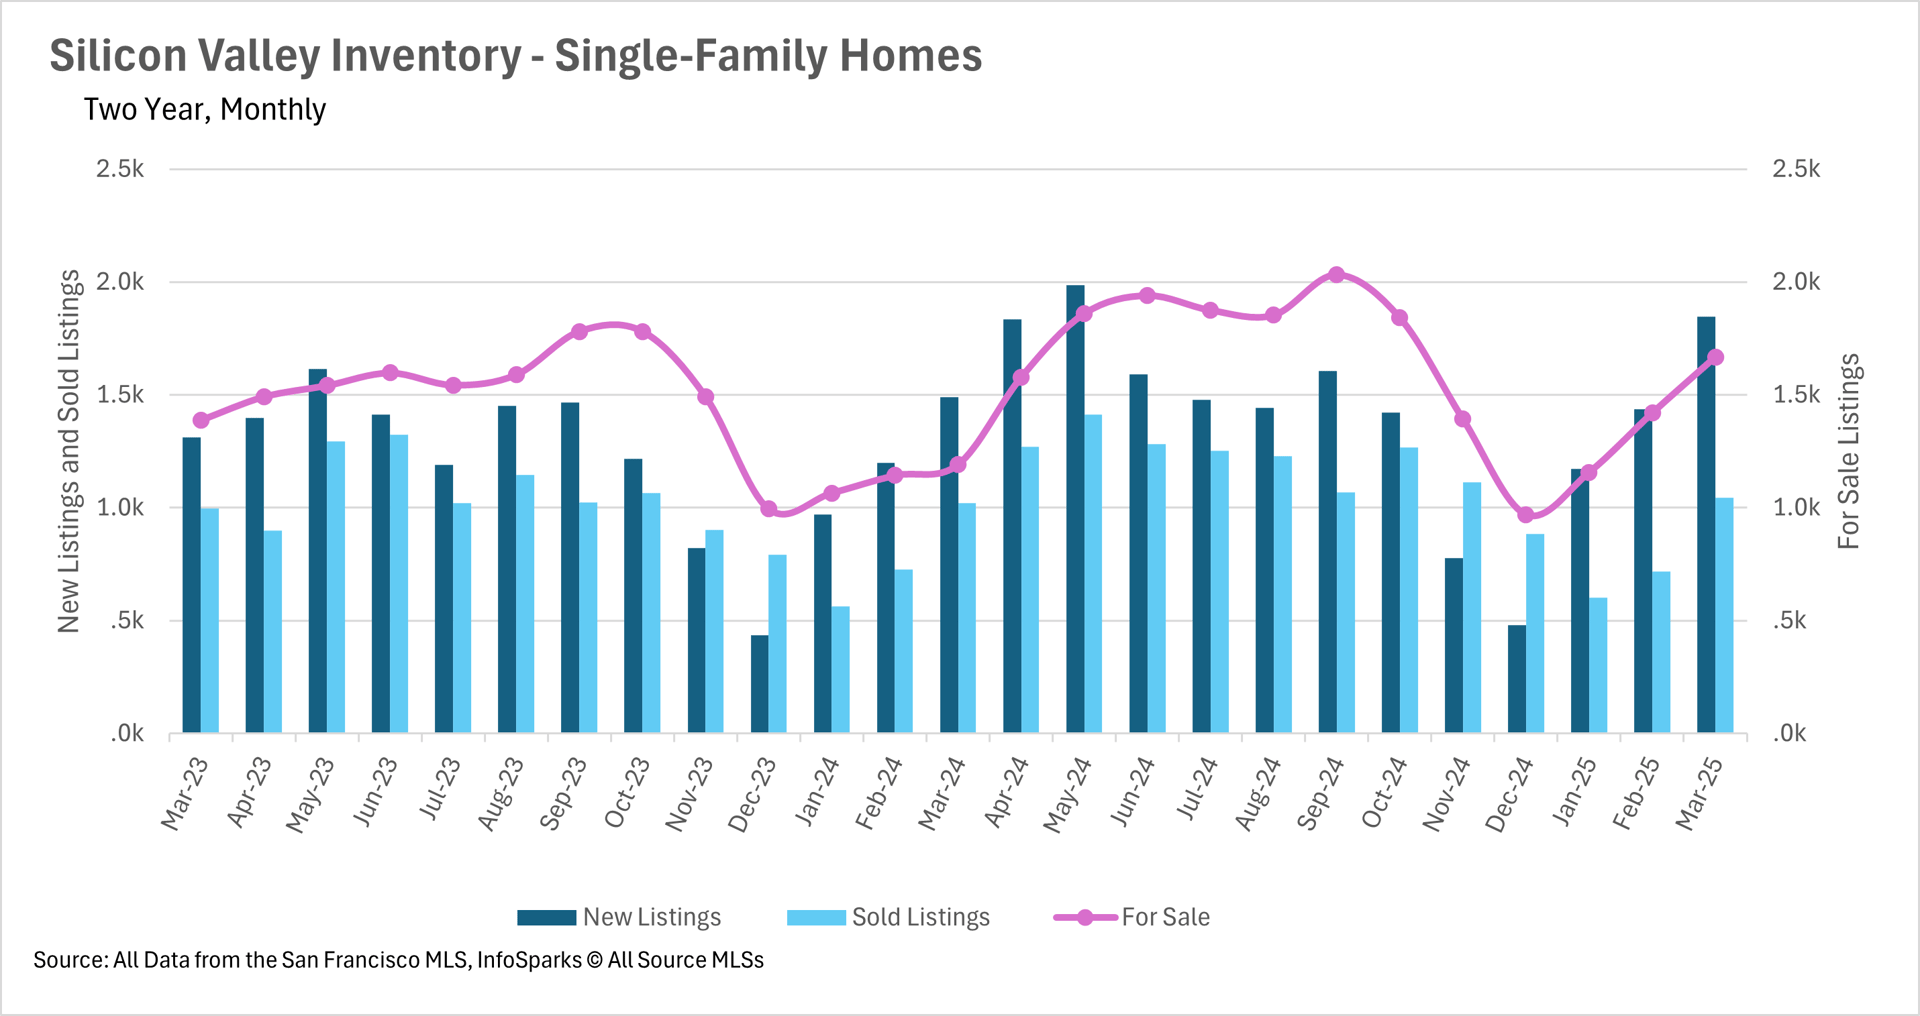
Despite these price increases, inventory levels are also on the rise, alleviating some concerns about housing shortages. In March 2025, single-family home inventories grew by over 40%, driven by a 23.83% increase in new listings compared to the previous year. This balance between rising prices and expanding inventory indicates a healthy, dynamic market.
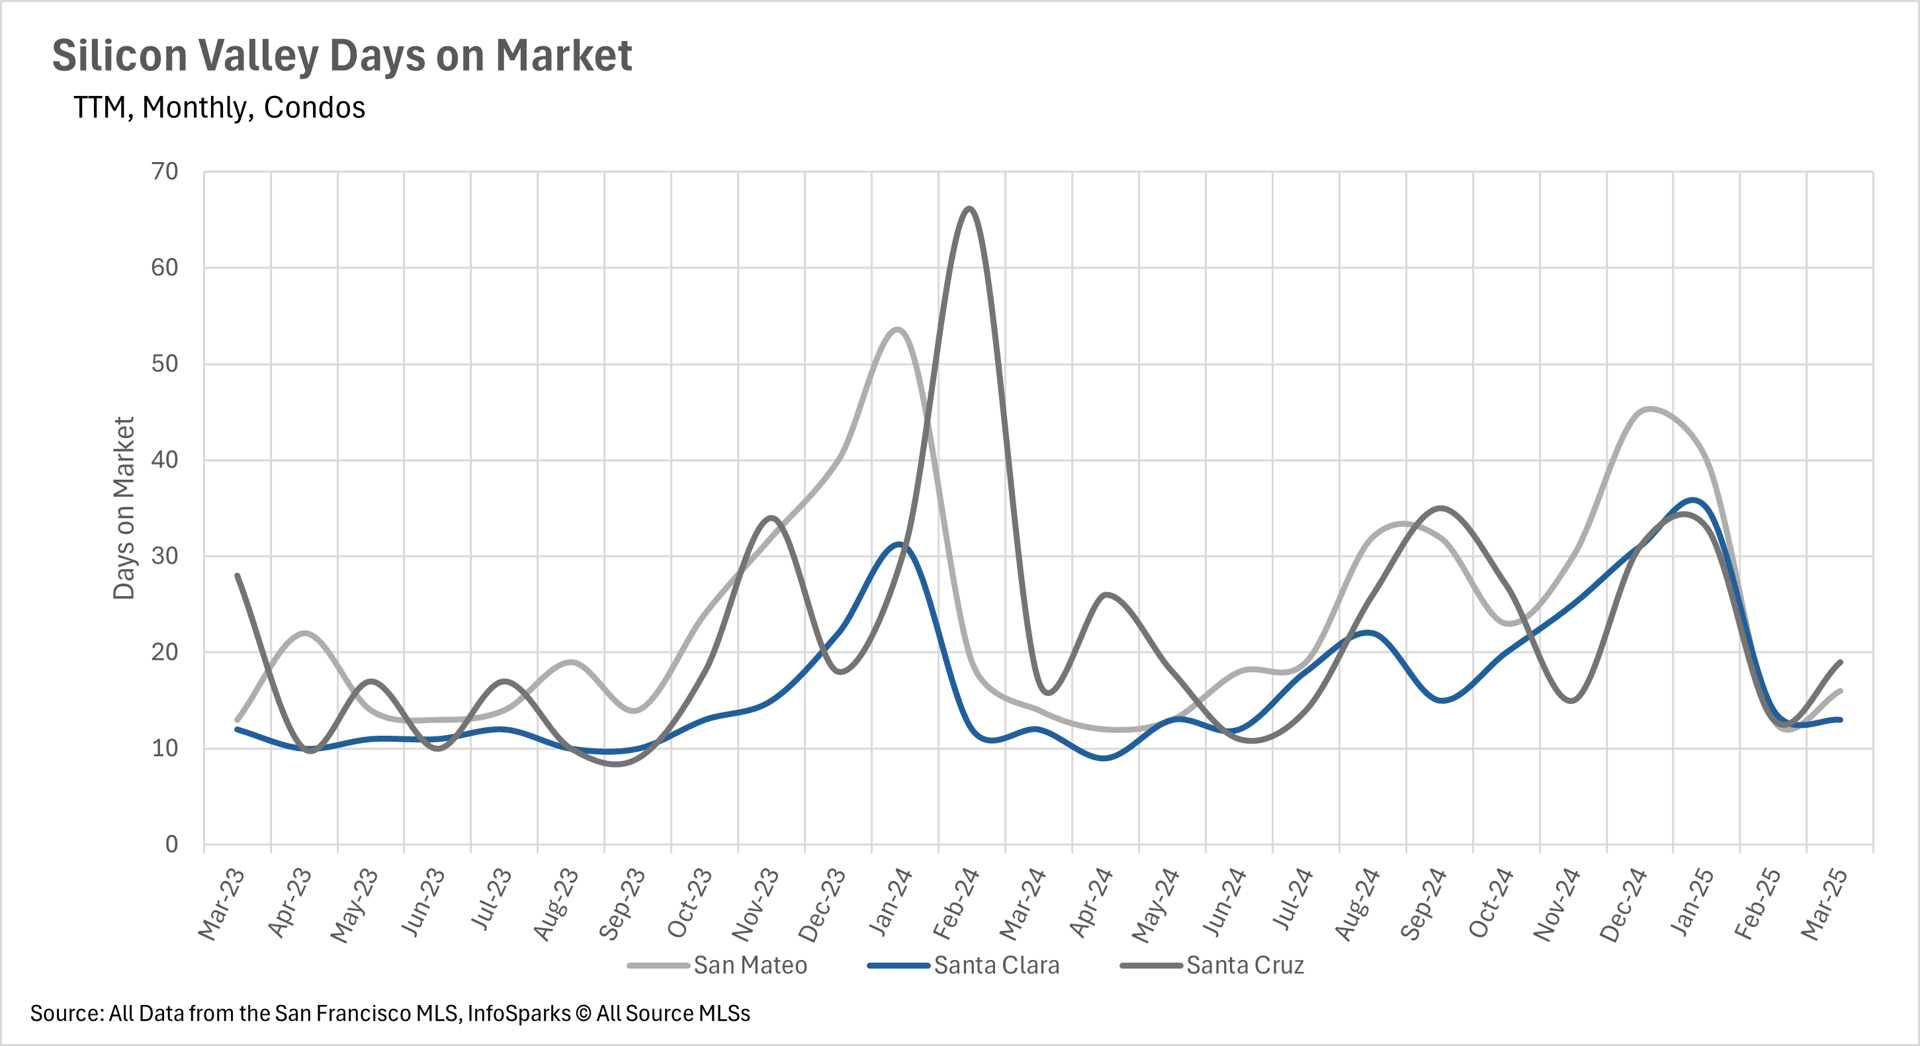
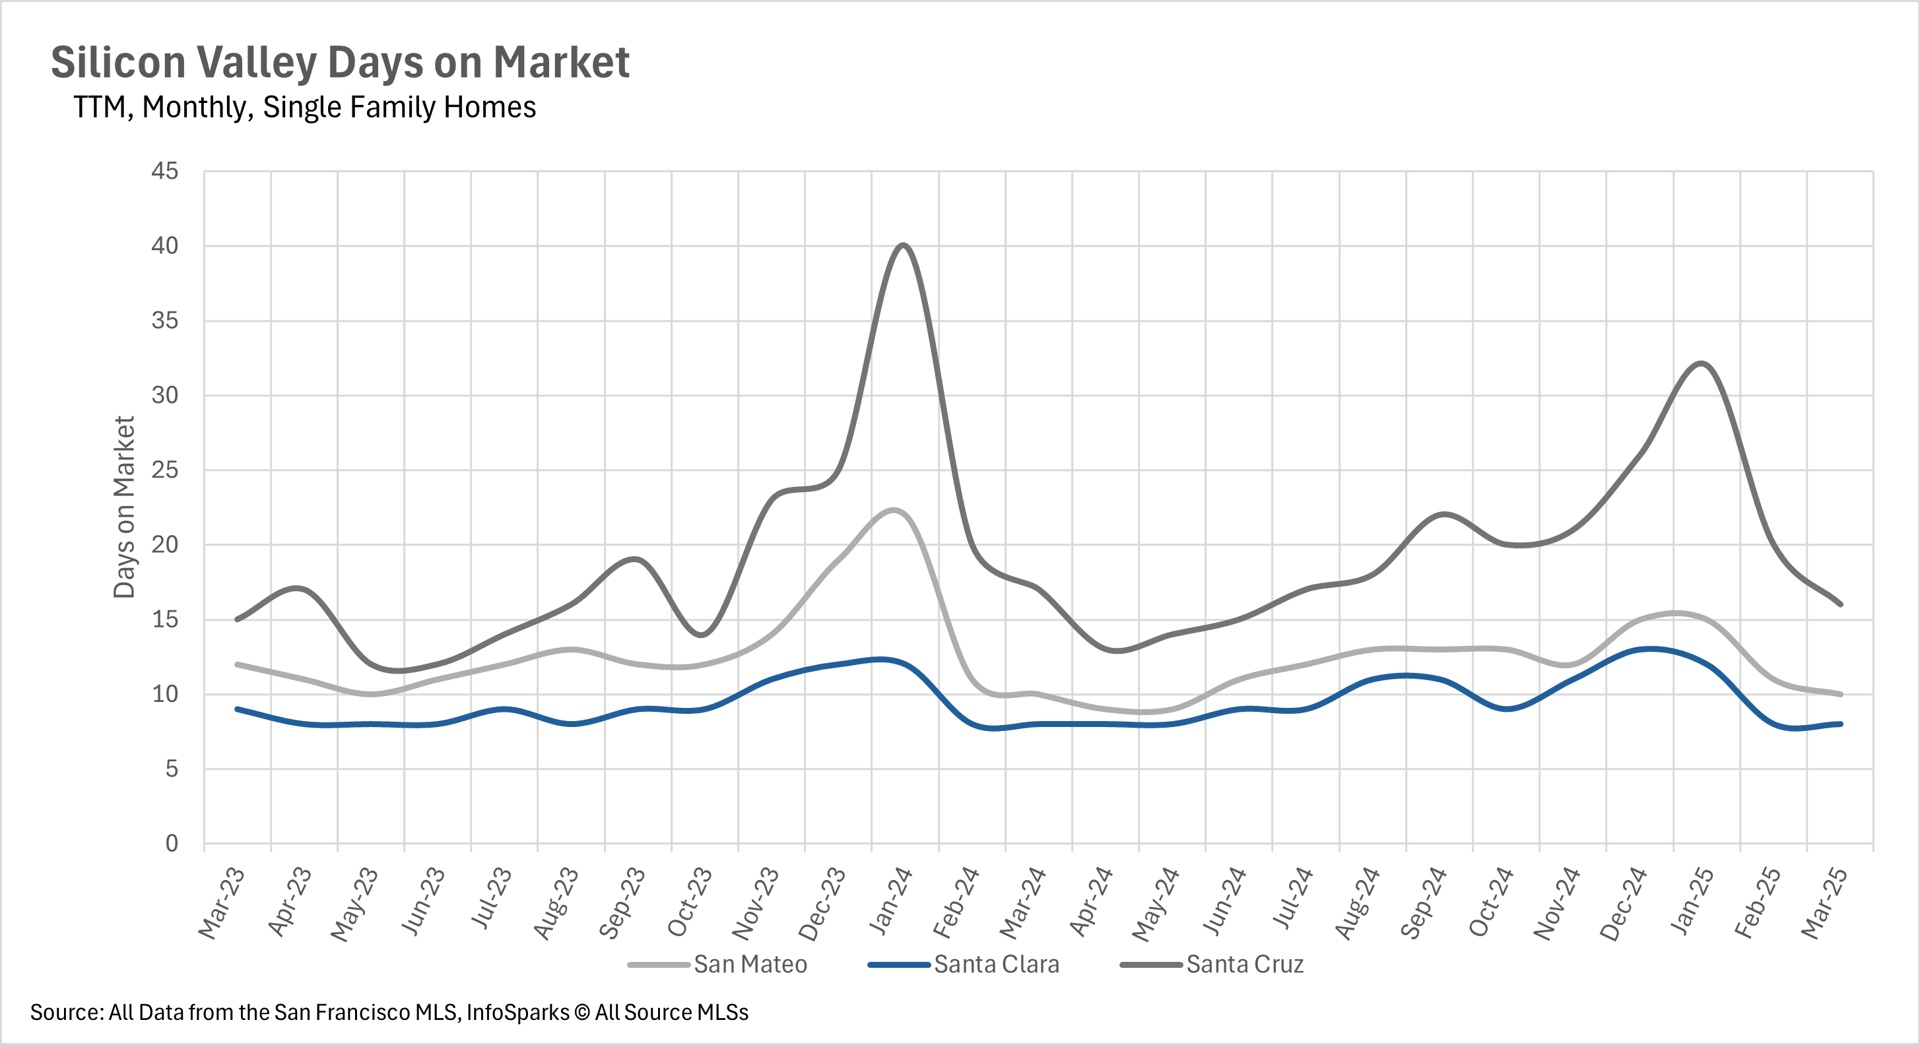
Homes in Silicon Valley continue to sell quickly, reflecting strong buyer interest. Listings in Santa Cruz County, for instance, average just 16 days on the market. In Santa Clara and San Mateo counties, the pace is even faster, with homes selling in only 8 to 10 days. This quick turnover highlights the competitive nature of the market and the high demand for properties in the region.
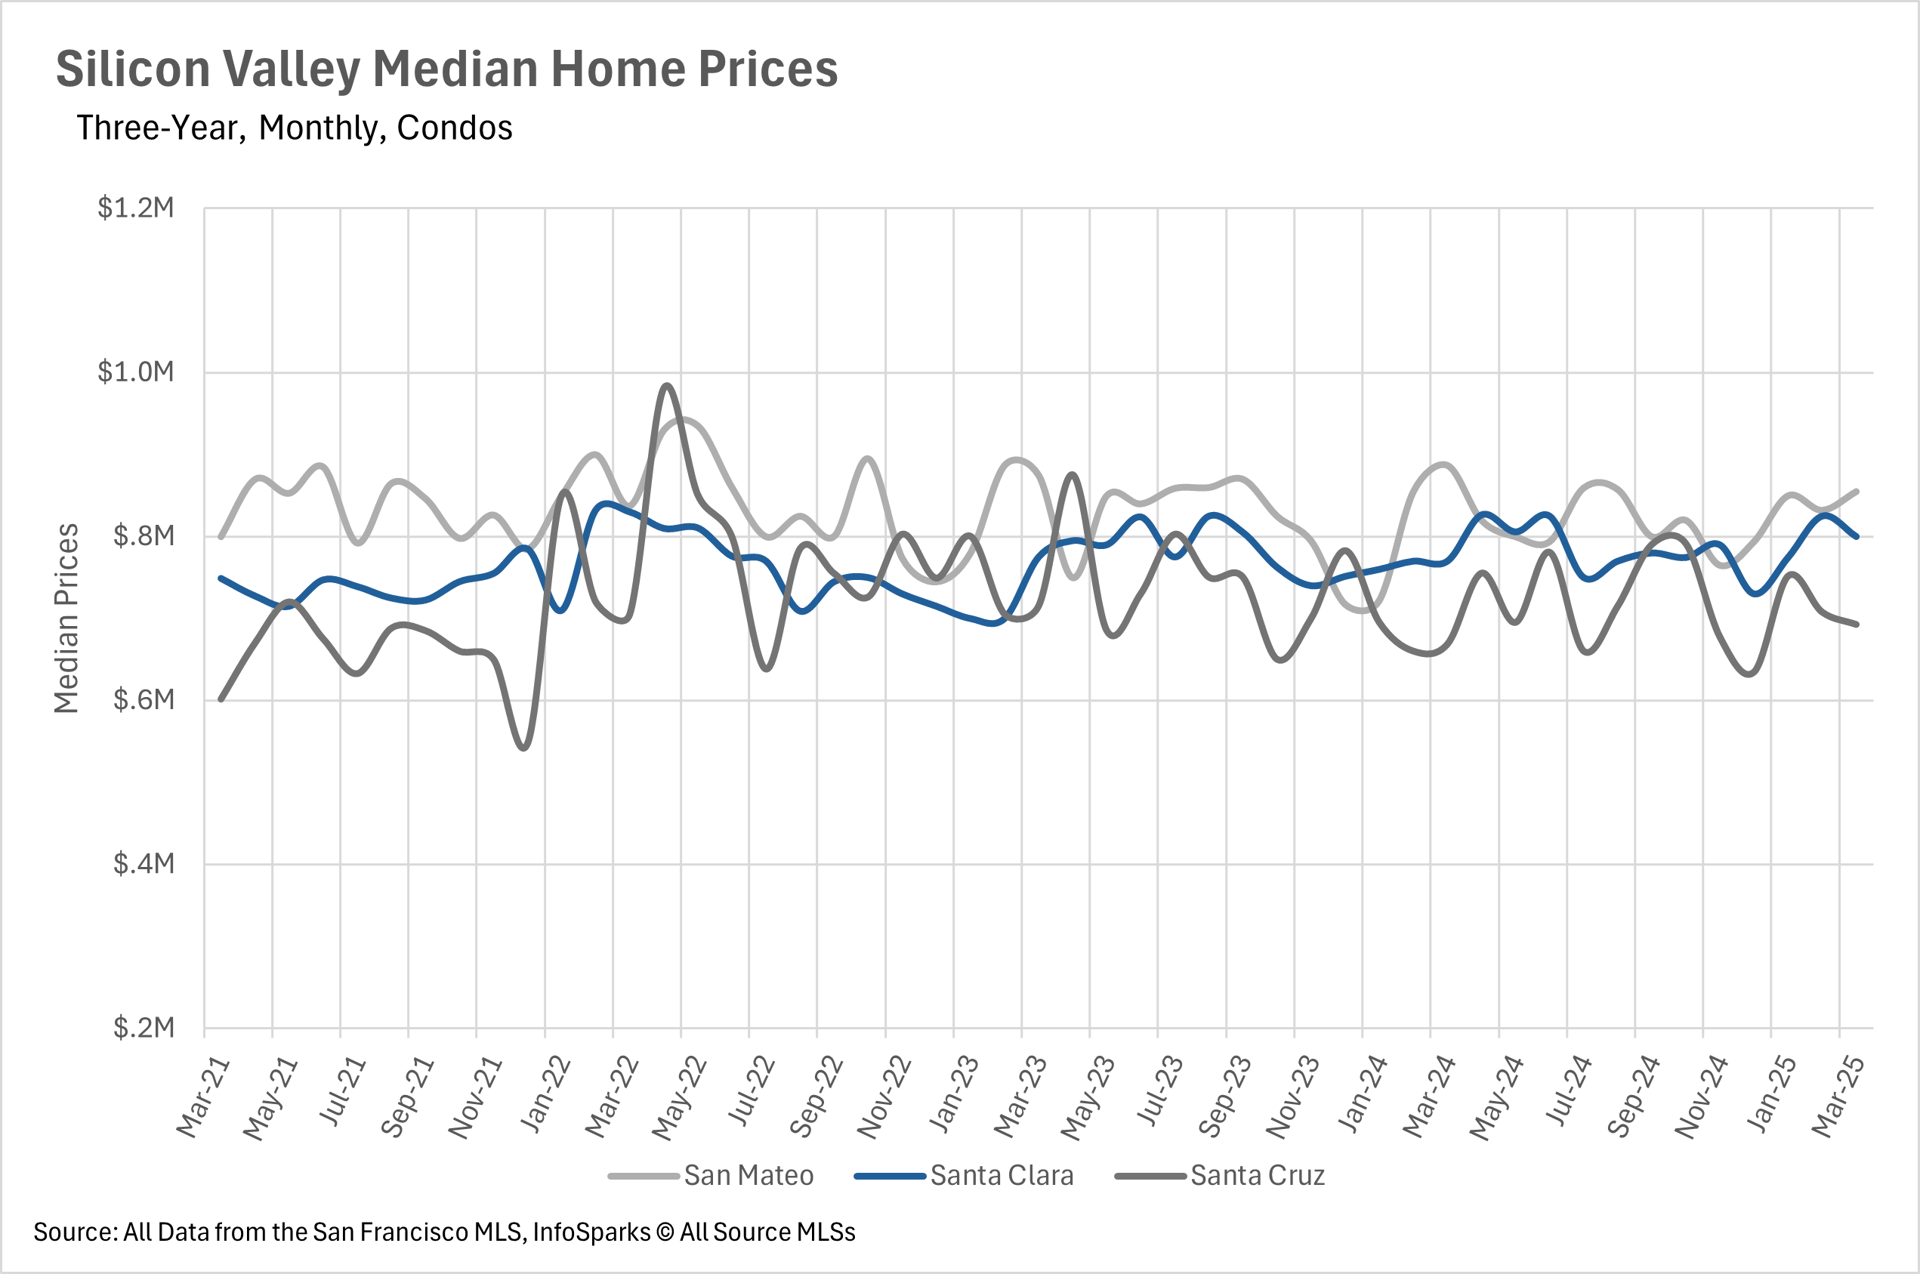
Comparing Single-Family Homes and Condos
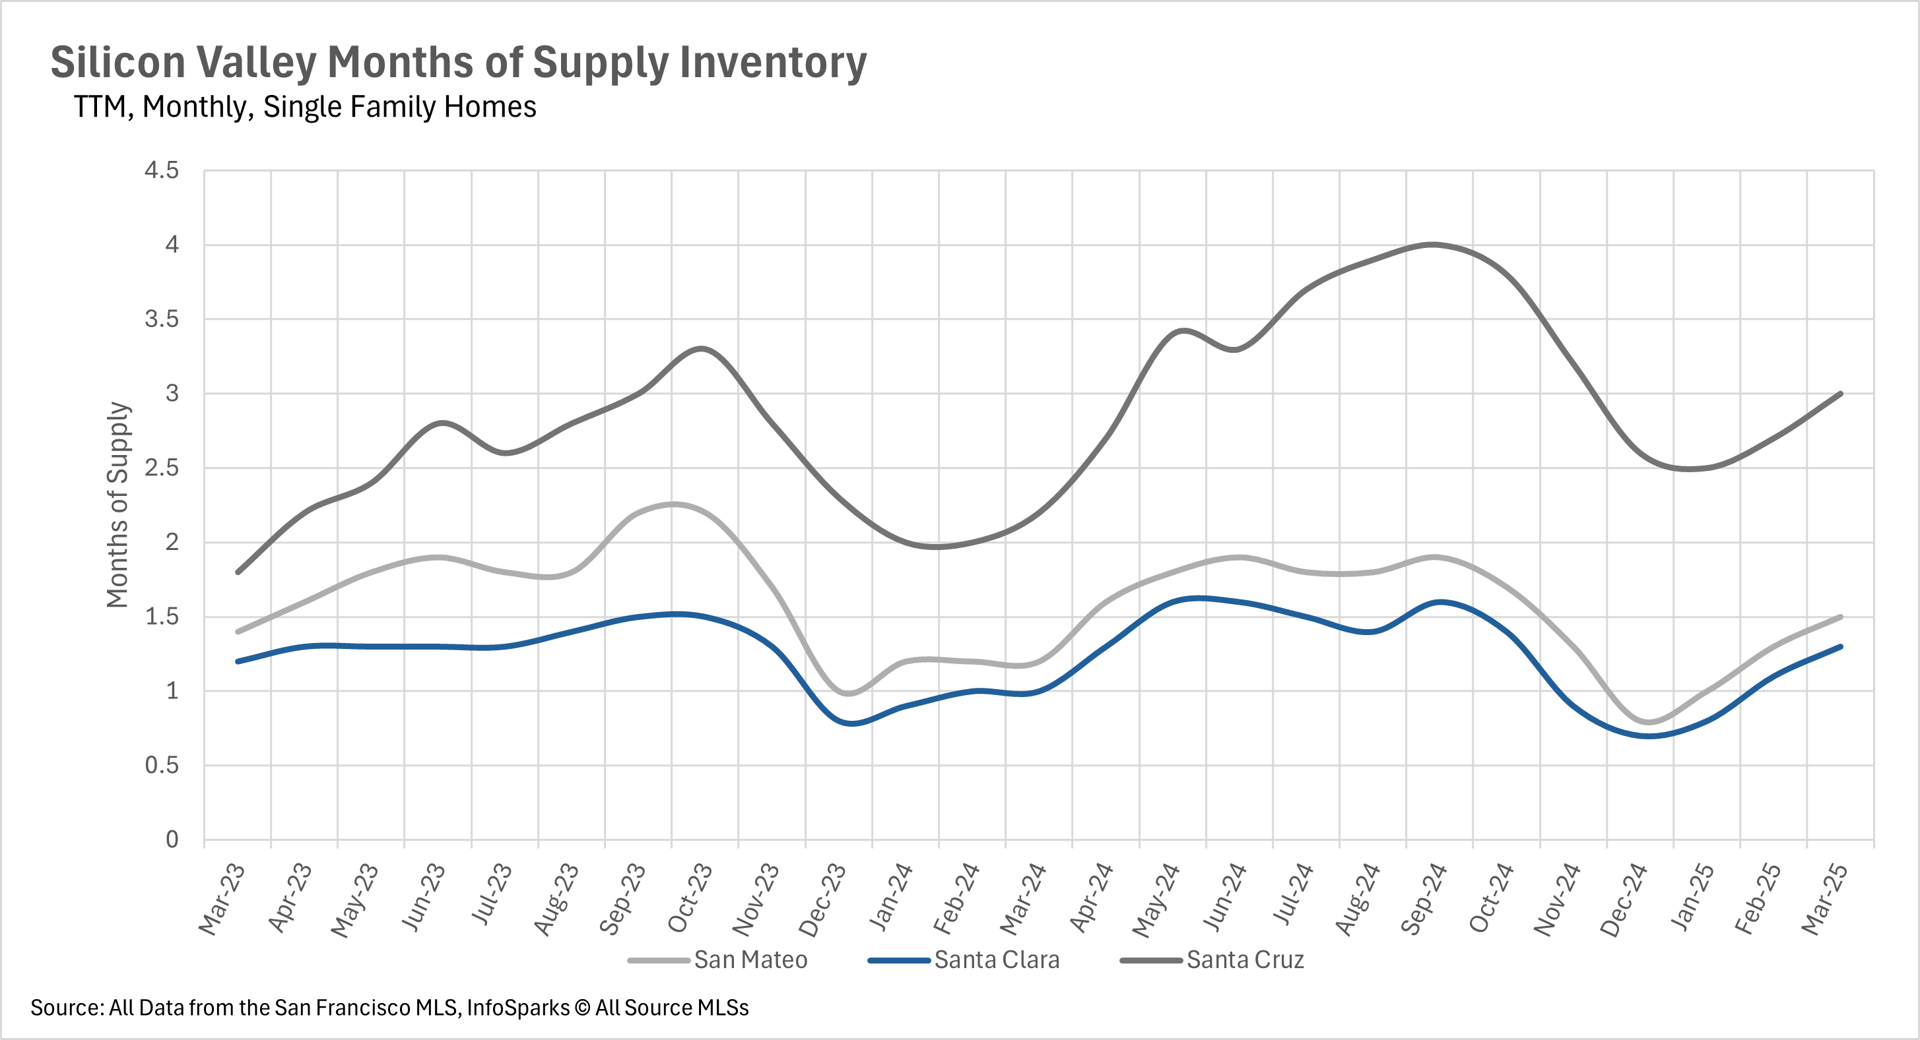
The Silicon Valley market presents different opportunities depending on the type of property. Single-family homes remain a hot commodity, with low inventory levels creating a seller’s market in areas like Santa Clara and San Mateo counties. These counties have just 1.3 and 1.5 months’ worth of supply, respectively, well below the three-month threshold for a balanced market.
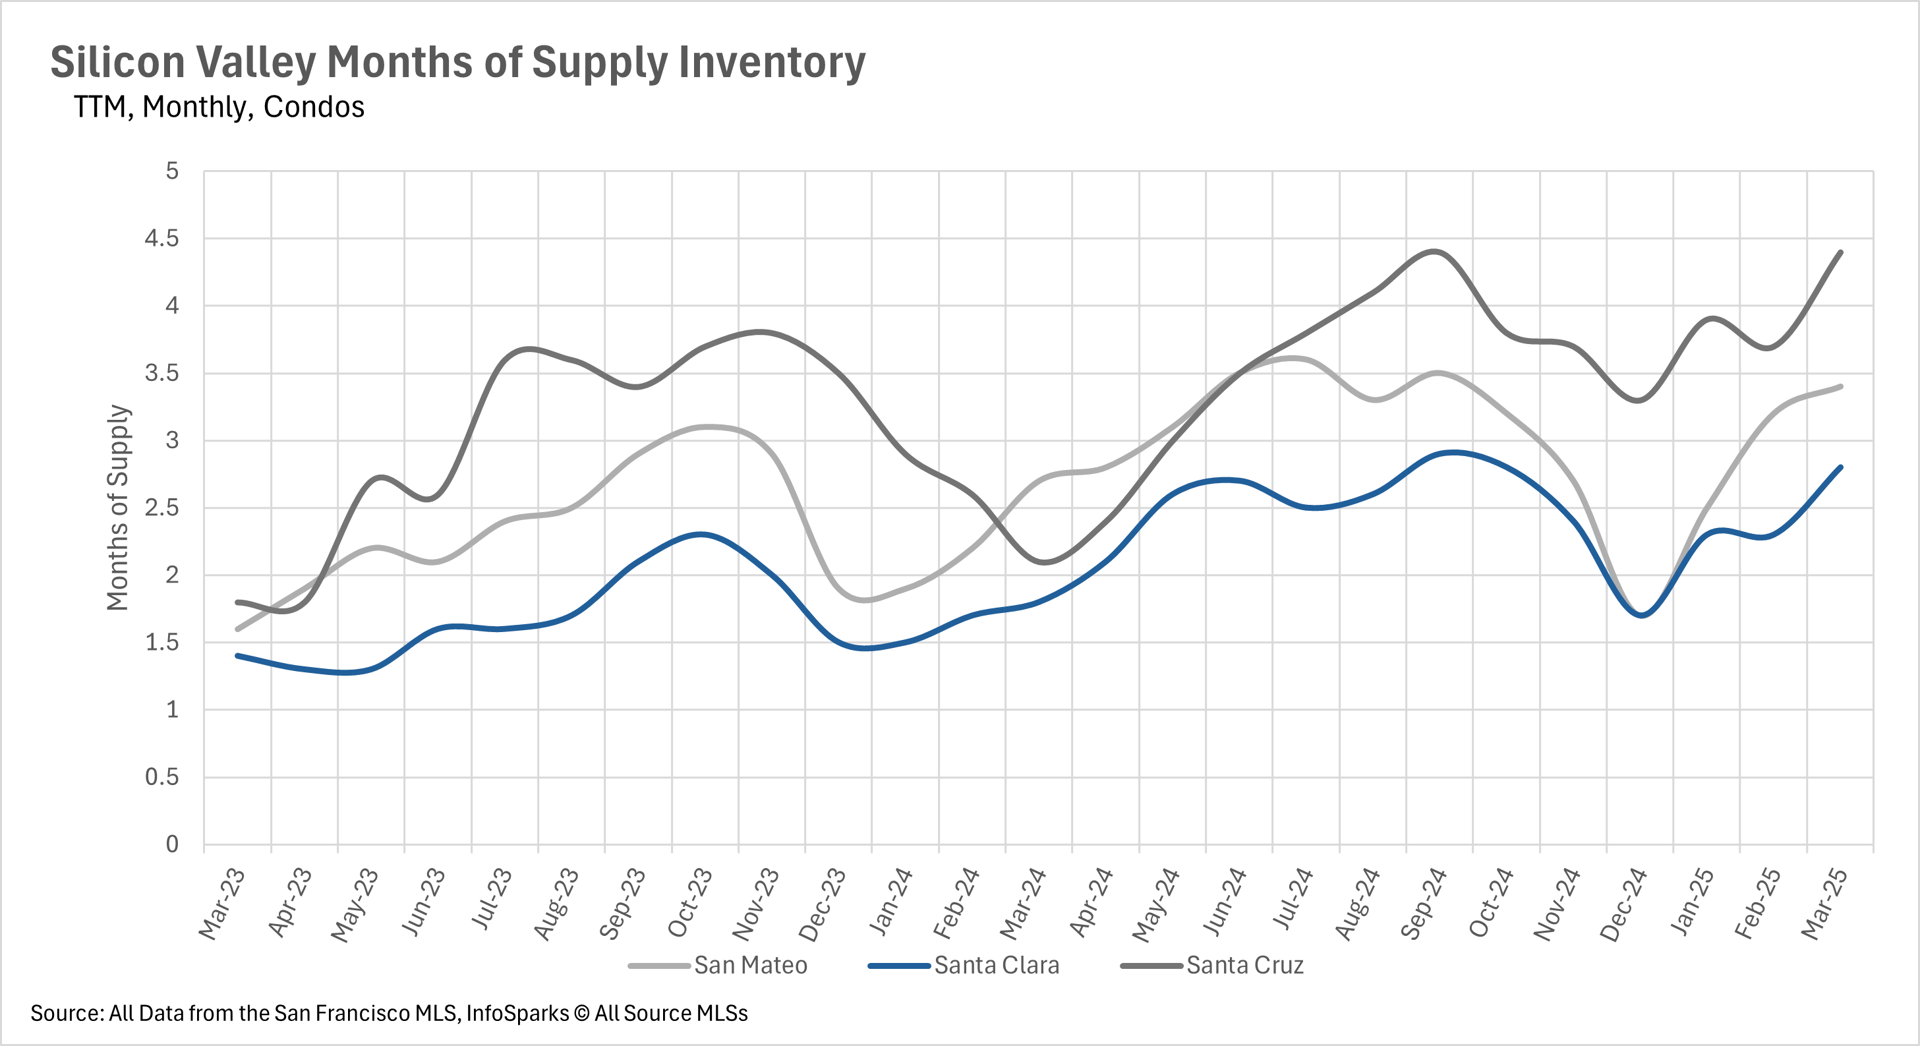
In contrast, the condo market offers more opportunities for buyers. Santa Cruz County, for example, has 4.4 months of condo supply, while Santa Clara and San Mateo counties have 2.8 and 3.4 months, respectively. This balanced or buyer-friendly dynamic in the condo market makes it an attractive option for those looking to enter the Silicon Valley housing market at a lower price point or with less competition.
Tips for Navigating the Market
For buyers, success in Silicon Valley’s competitive market often requires quick decision-making and financial preparedness. Securing mortgage pre-approval can provide an edge when making offers. For sellers, the current market conditions offer an excellent opportunity to capitalize on high demand. Properly pricing and staging a home can attract multiple offers, often leading to a quicker sale at a favorable price.
The Bottom Line: Why Silicon Valley Stands Out
Silicon Valley’s real estate market remains a beacon of opportunity, offering both stability and growth. Whether you’re looking to buy, sell, or invest, the region’s unique combination of economic strength, quality of life, and historical appreciation make it a standout choice.
If you’re ready to explore the possibilities in Silicon Valley, Kinoko Real Estate is here to help. Our team of local experts understands the nuances of this dynamic market and can guide you every step of the way. Visit Kinoko Real Estate to learn more and start your journey in Silicon Valley today.