If you prefer to bypass The Big Story and jump straight to the Local Market Report, click here.
The Big Story
Quick Take:
- Affordability remains a concern across the country despite lower interest rates compared to this time last year.
- New homes are being added to the market, with the US seeing a 4.21% year-over-year increase in the number of new listings in February.
- Inventory is getting back to healthier levels as we see backlogs begin to build across the country.
Note: You can find the charts & graphs for the Big Story at the end of the following section.
*National Association of REALTORS® data is released two months behind, so we estimate the most recent month's data when possible and appropriate.
Affordability continues to be an issue nationwide
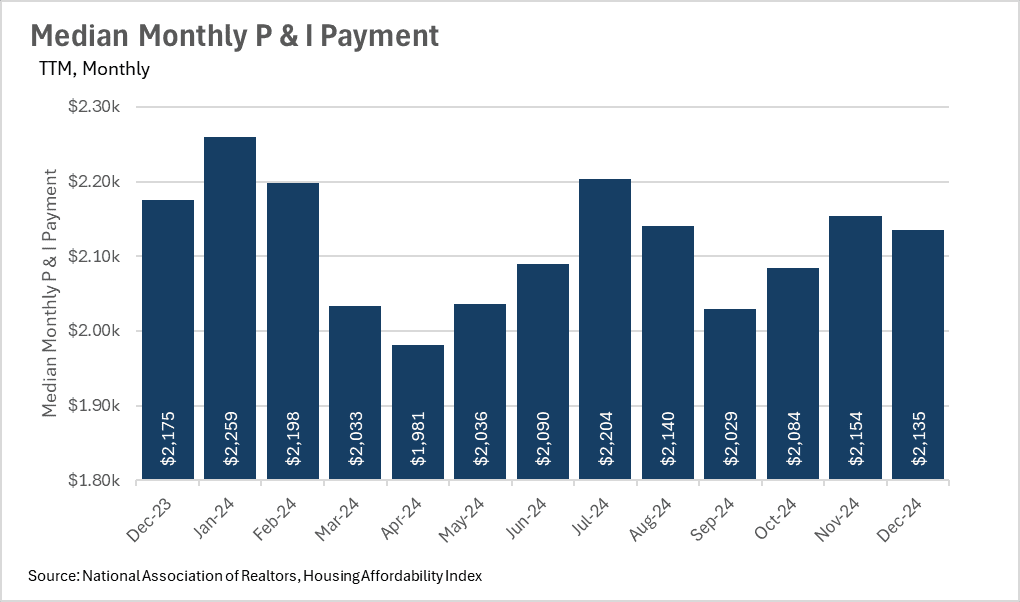
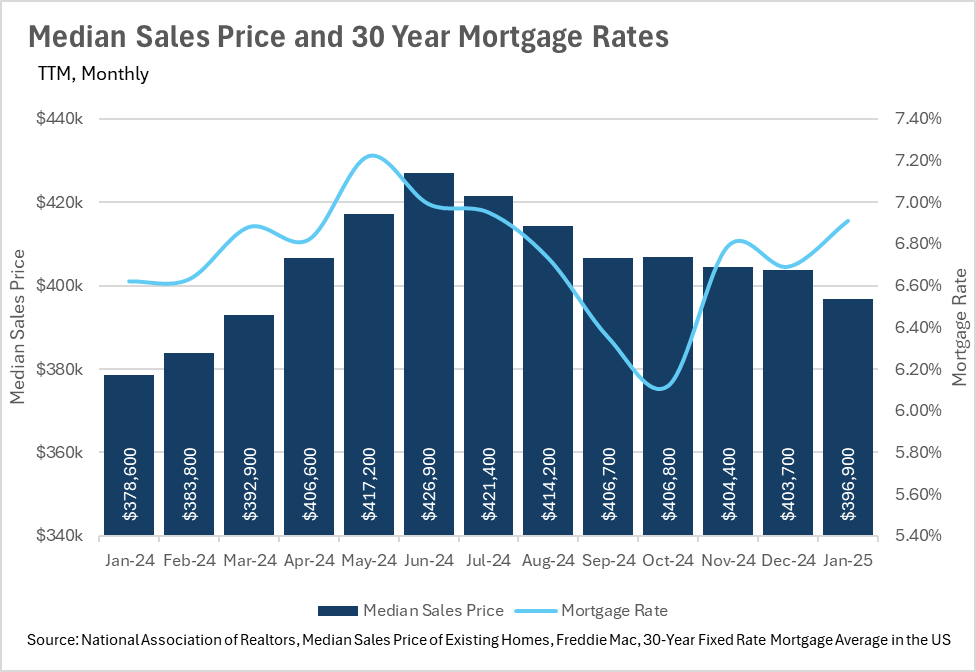
One of the headline issues in the real estate industry over the past few years has been, of course, the affordability (or rather the unaffordability) of homes. Unfortunately for new buyers, and more specifically first time home-buyers, this issue looks like it will persist throughout 2025. Mortgage rates remain comparatively high, and home prices largely have not given back their pandemic-era gains.
This has, of course, made the dreams of homeownership difficult to achieve for countless people around the country. With the median monthly principal and interest payment exceeding $2,100 per month on a nationwide level, people are struggling to afford the purchase of a new home!
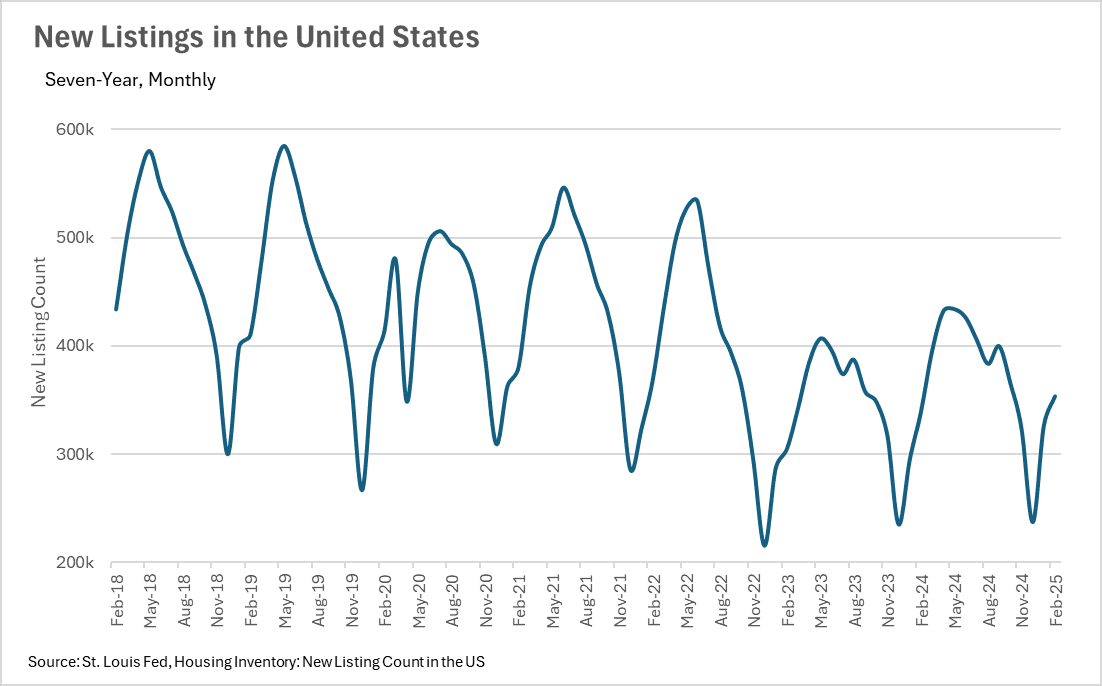
New homes are starting to hit the market again
Fortunately for the market, there are plenty of new homes hitting the market though. While there are countless people sitting on the sidelines, waiting for lower interest rates to sell their current home and buy a new one, some of these holdouts are giving up and listing their homes. The writing seems to be on the wall, meaning more and more people are giving up on the thought that we will see lower interest rates in the short term, causing them to list their homes.
This has resulted in a pleasant jump in new home listings, despite us being at the tail end of the slow season. In the month of february, we saw more than 353,000 homes hit the market nationwide. This represents a 4.21% increase on a year-over-year basis, and an 8.15% increase on a month-over-month basis!
Inventories are beginning to build, offering more options for buyers
Since we are seeing new inventory hit the market and a steady level of demand, this is causing inventories to build, which is a great sign for those looking to enter the market! In the month of January, there were 1,180,000 homes listed on the market, representing a 16.83% increase on a year-over-year basis and a 3.51% increase on a month-over-month basis. At the same time, we’re seeing demand stagnate a bit, with 4,080,000 homes sold in January, representing a 2% increase when compared to last year and a 4.9% decrease when compared to last month!
Although a top-tier property will likely end up in a bidding war, no matter if it’s in Kansas City or Calabasas, this increase in inventory could mean that there are some deals to be had on listings that sit on the market for a few weeks.
While there are areas that deviate from the national trends, this is generally what's happening nationwide. Below, you'll find a local lowdown that provides you with the in-depth coverage of your area that you need. We will continue to monitor the housing market and overall economy to help guide you in buying or selling your home.
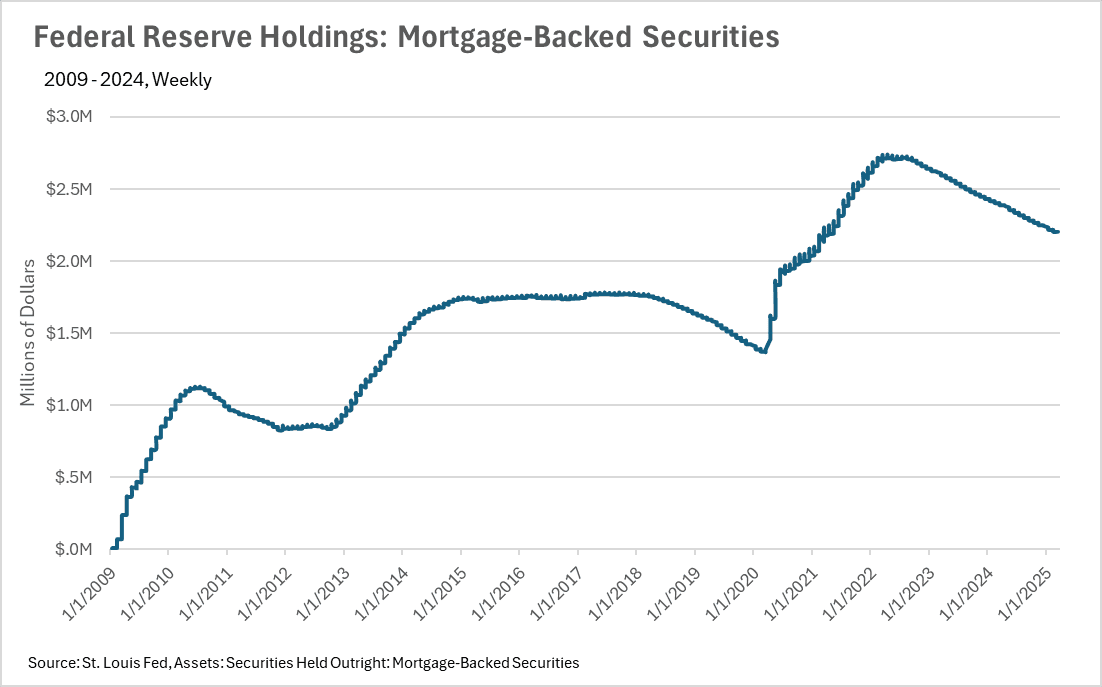
Big Story Data

The Local Lowdown
Quick Take:
- Silicon Valley continues to experience strong price growth, while East Bay home prices have stagnated due to rising inventory.
- Inventory shortages persist in the North Bay, while San Francisco faces declining listings, particularly in the single-family home market.
- Single-family homes remain in high demand across the region, but condos in many areas are seeing weaker competition.
- Sellers maintain an advantage in most markets, though buyers have opportunities in Napa and San Francisco’s condo market.
Note: You can find the charts/graphs for the Local Lowdown at the end of this section.
Silicon Valley and North Bay See Price Growth, While East Bay Stalls
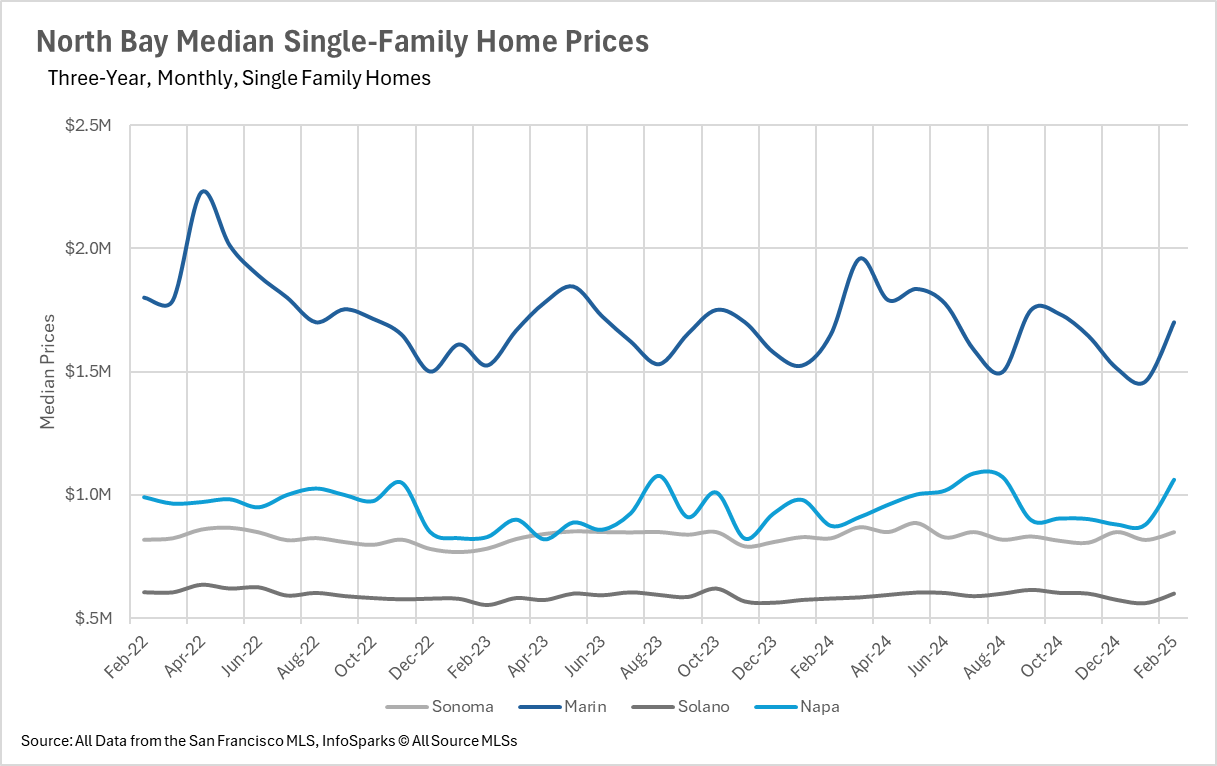
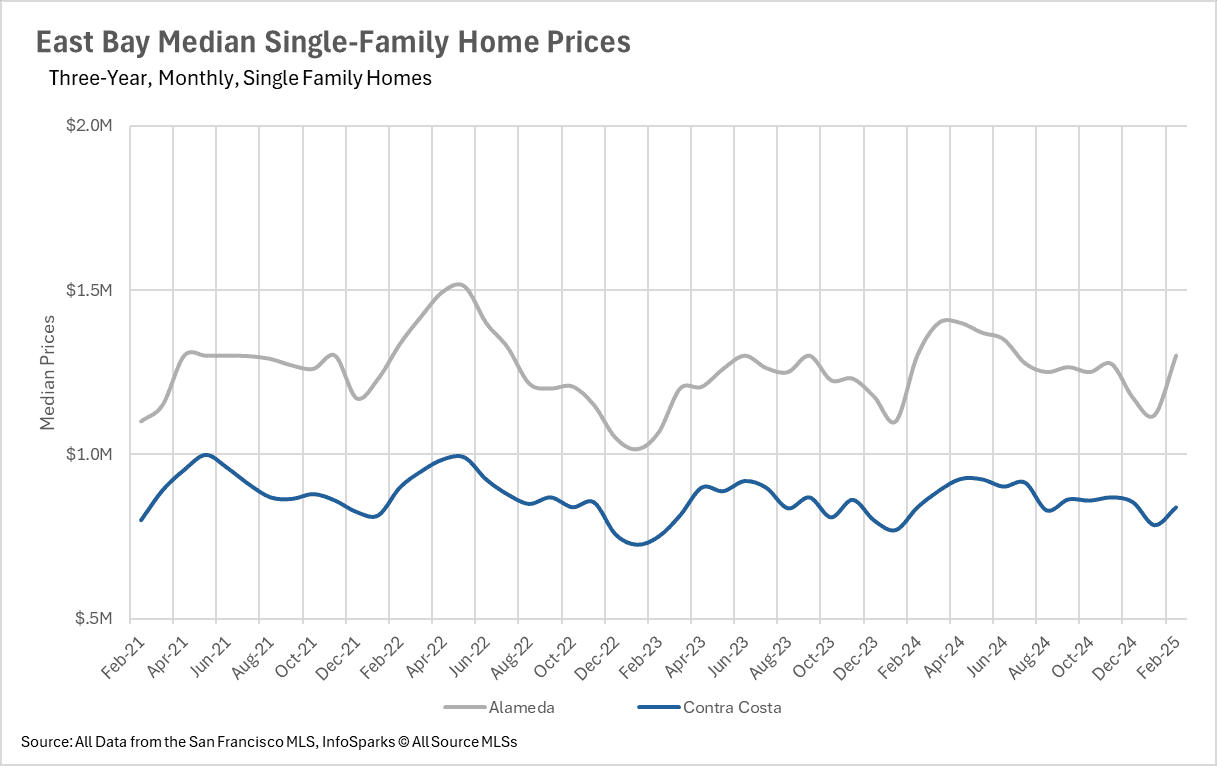
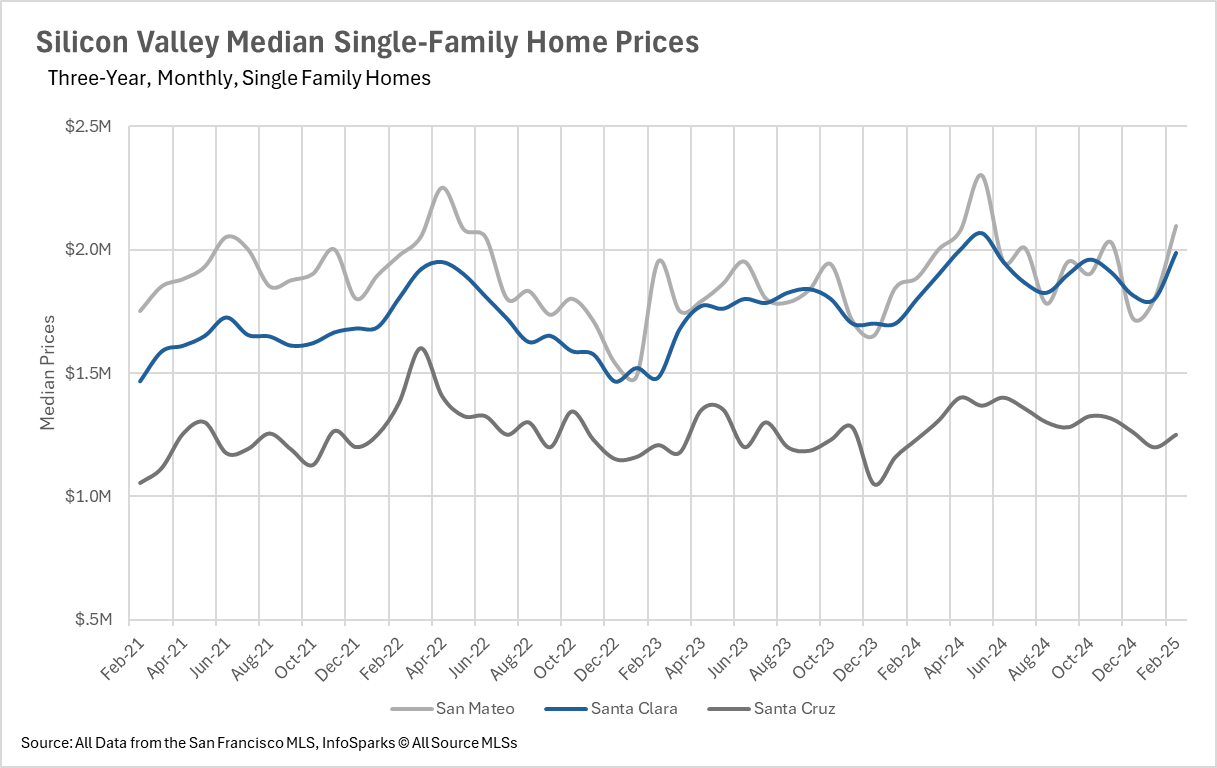
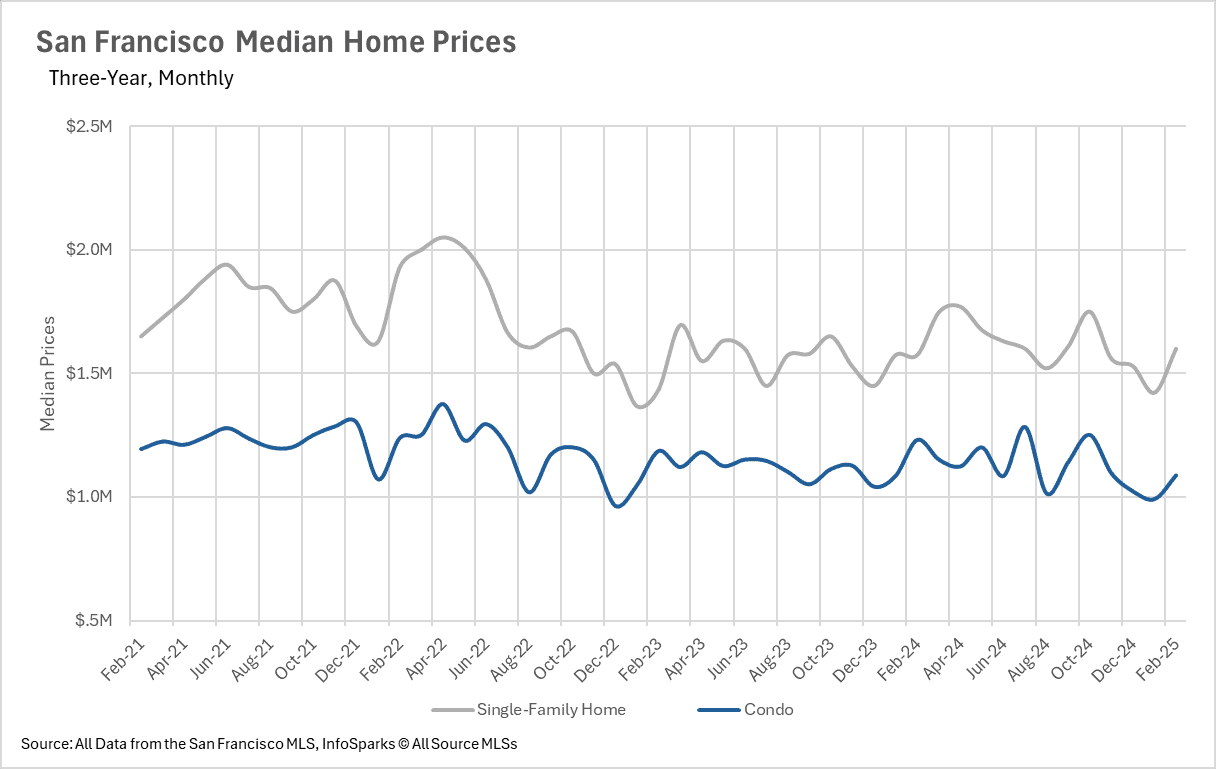
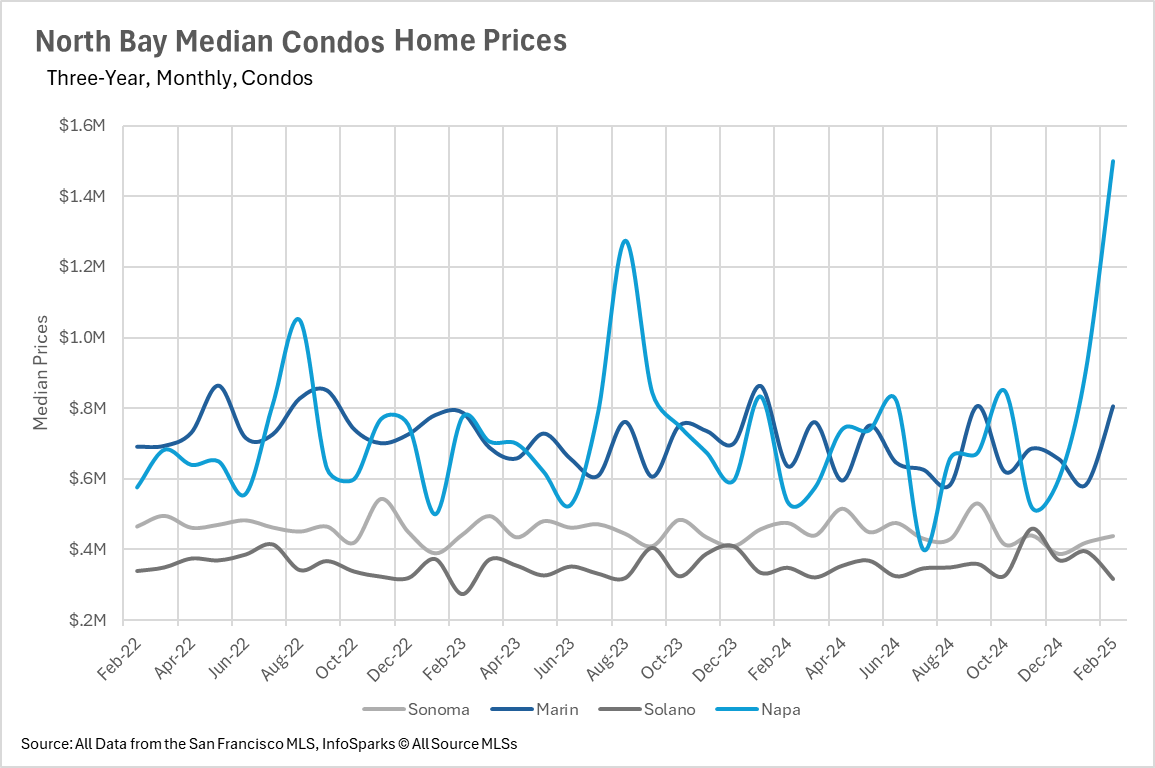
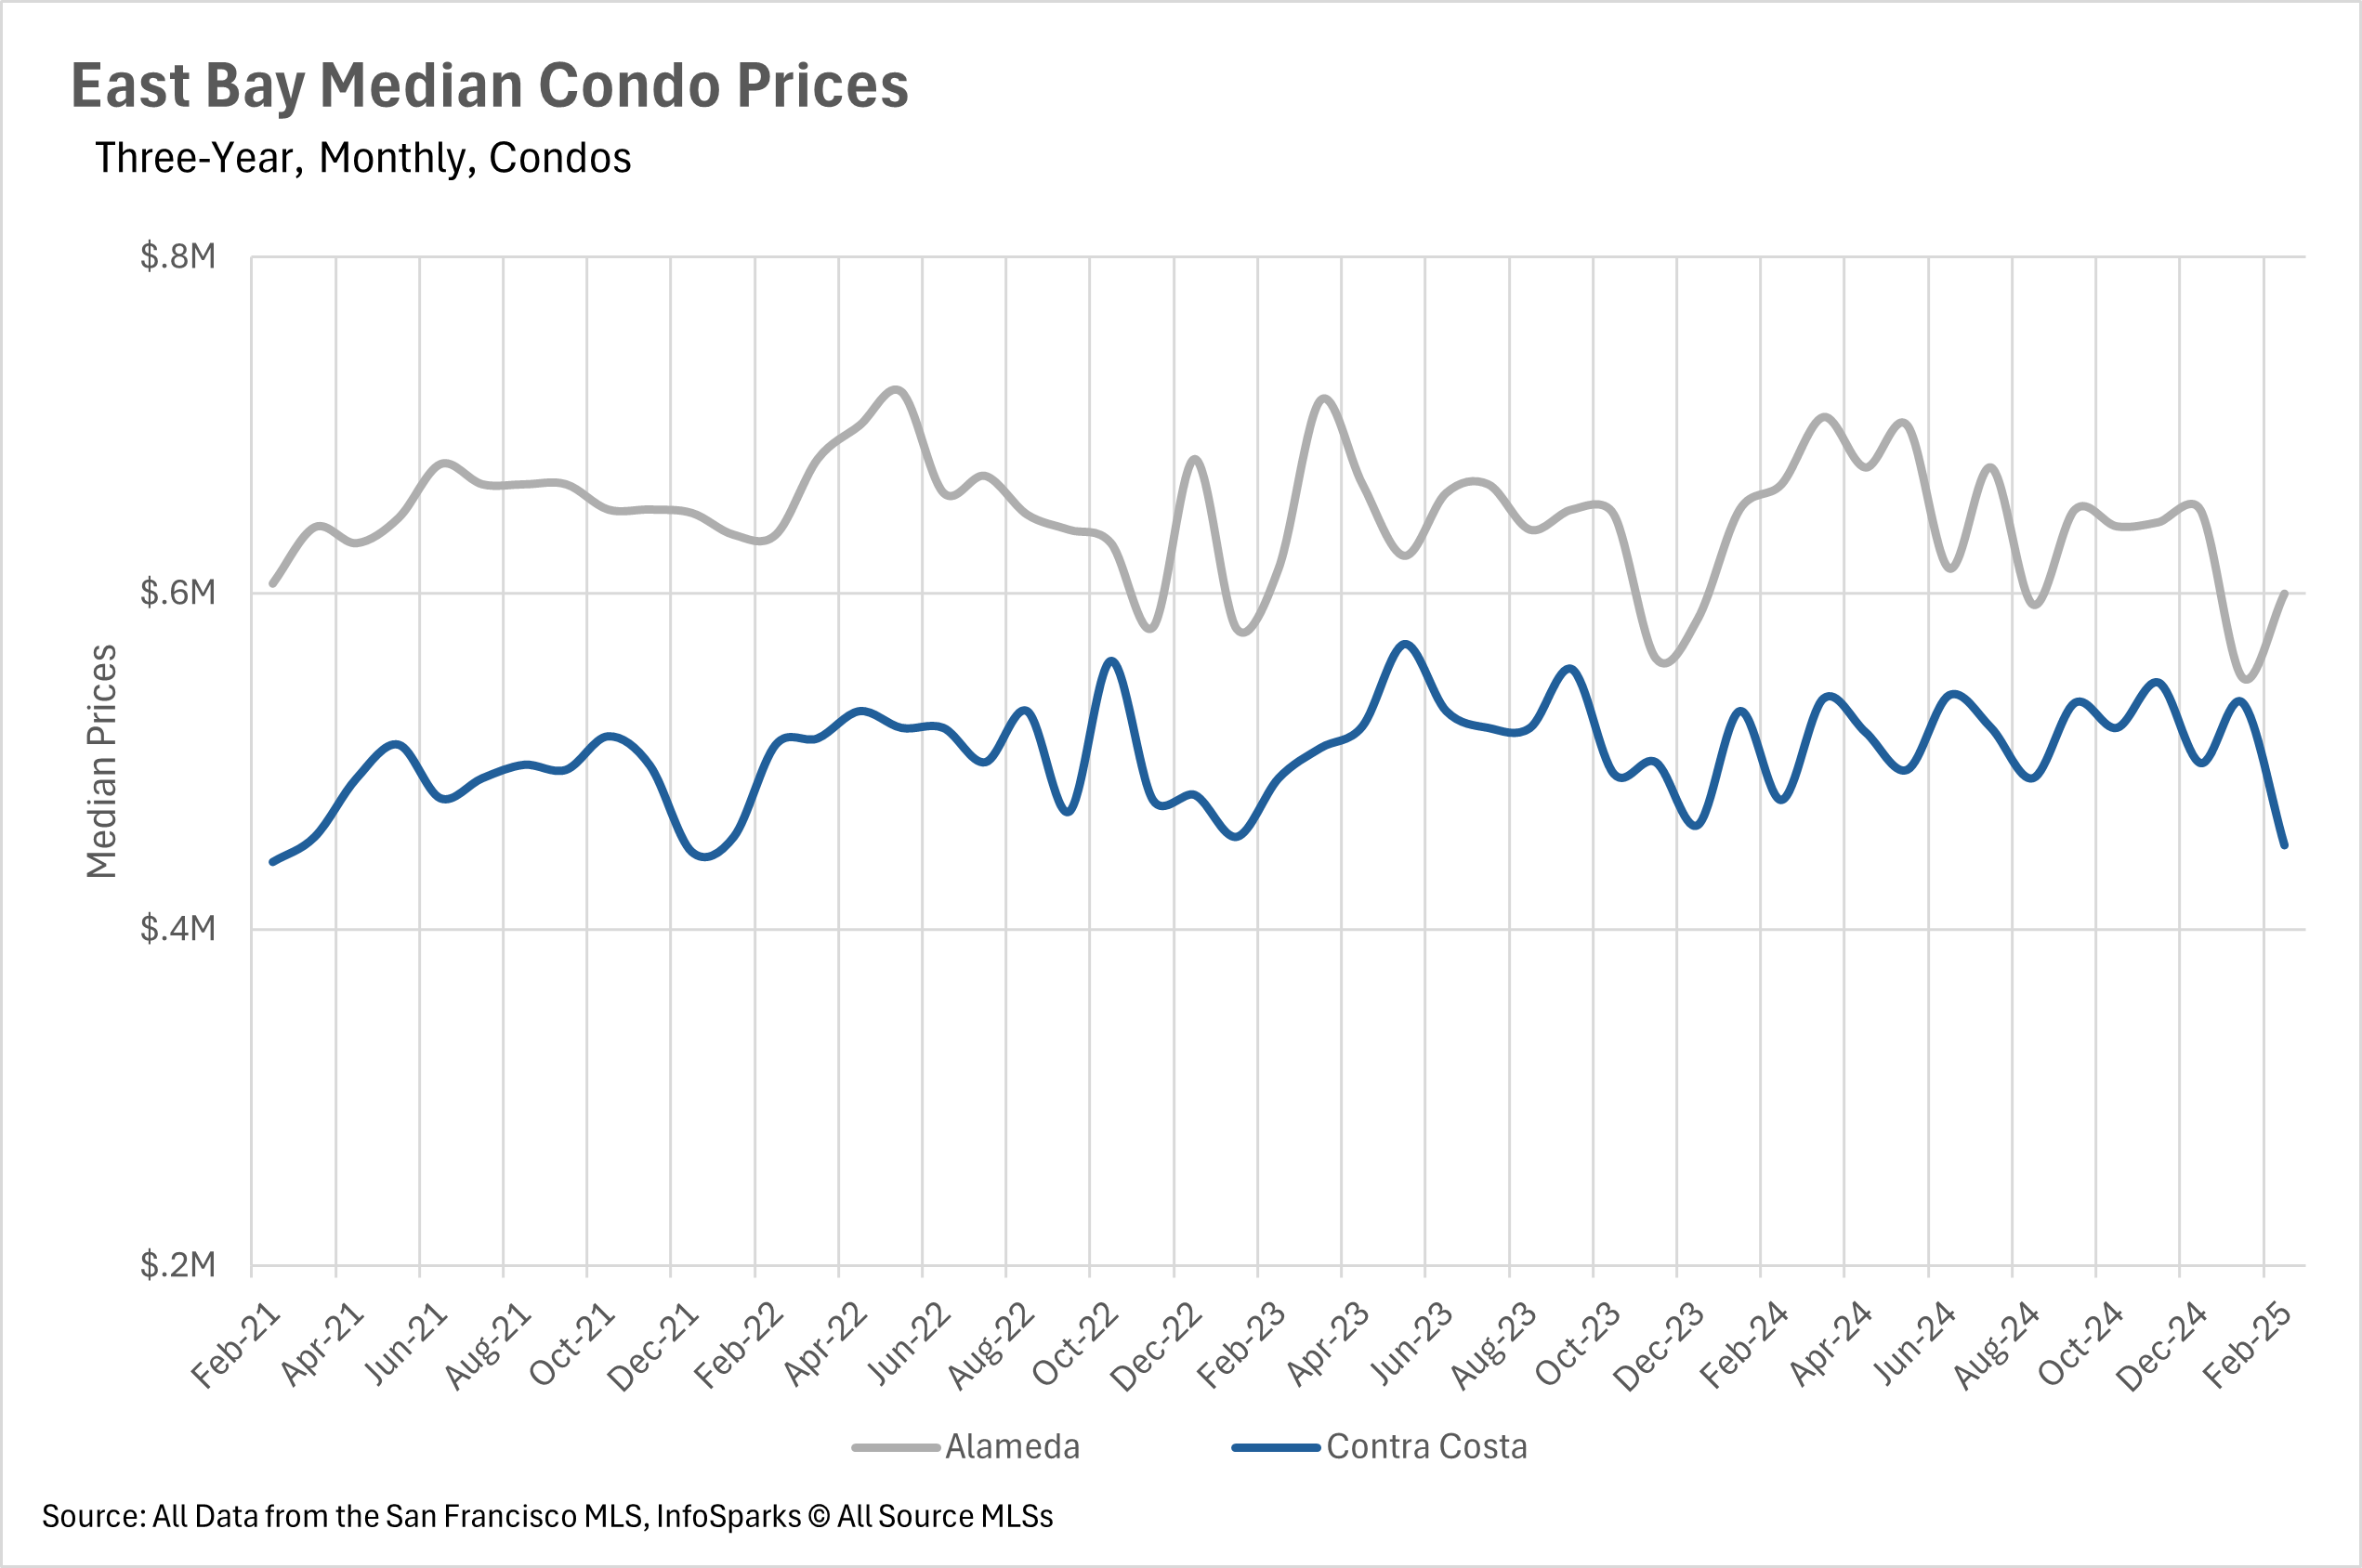
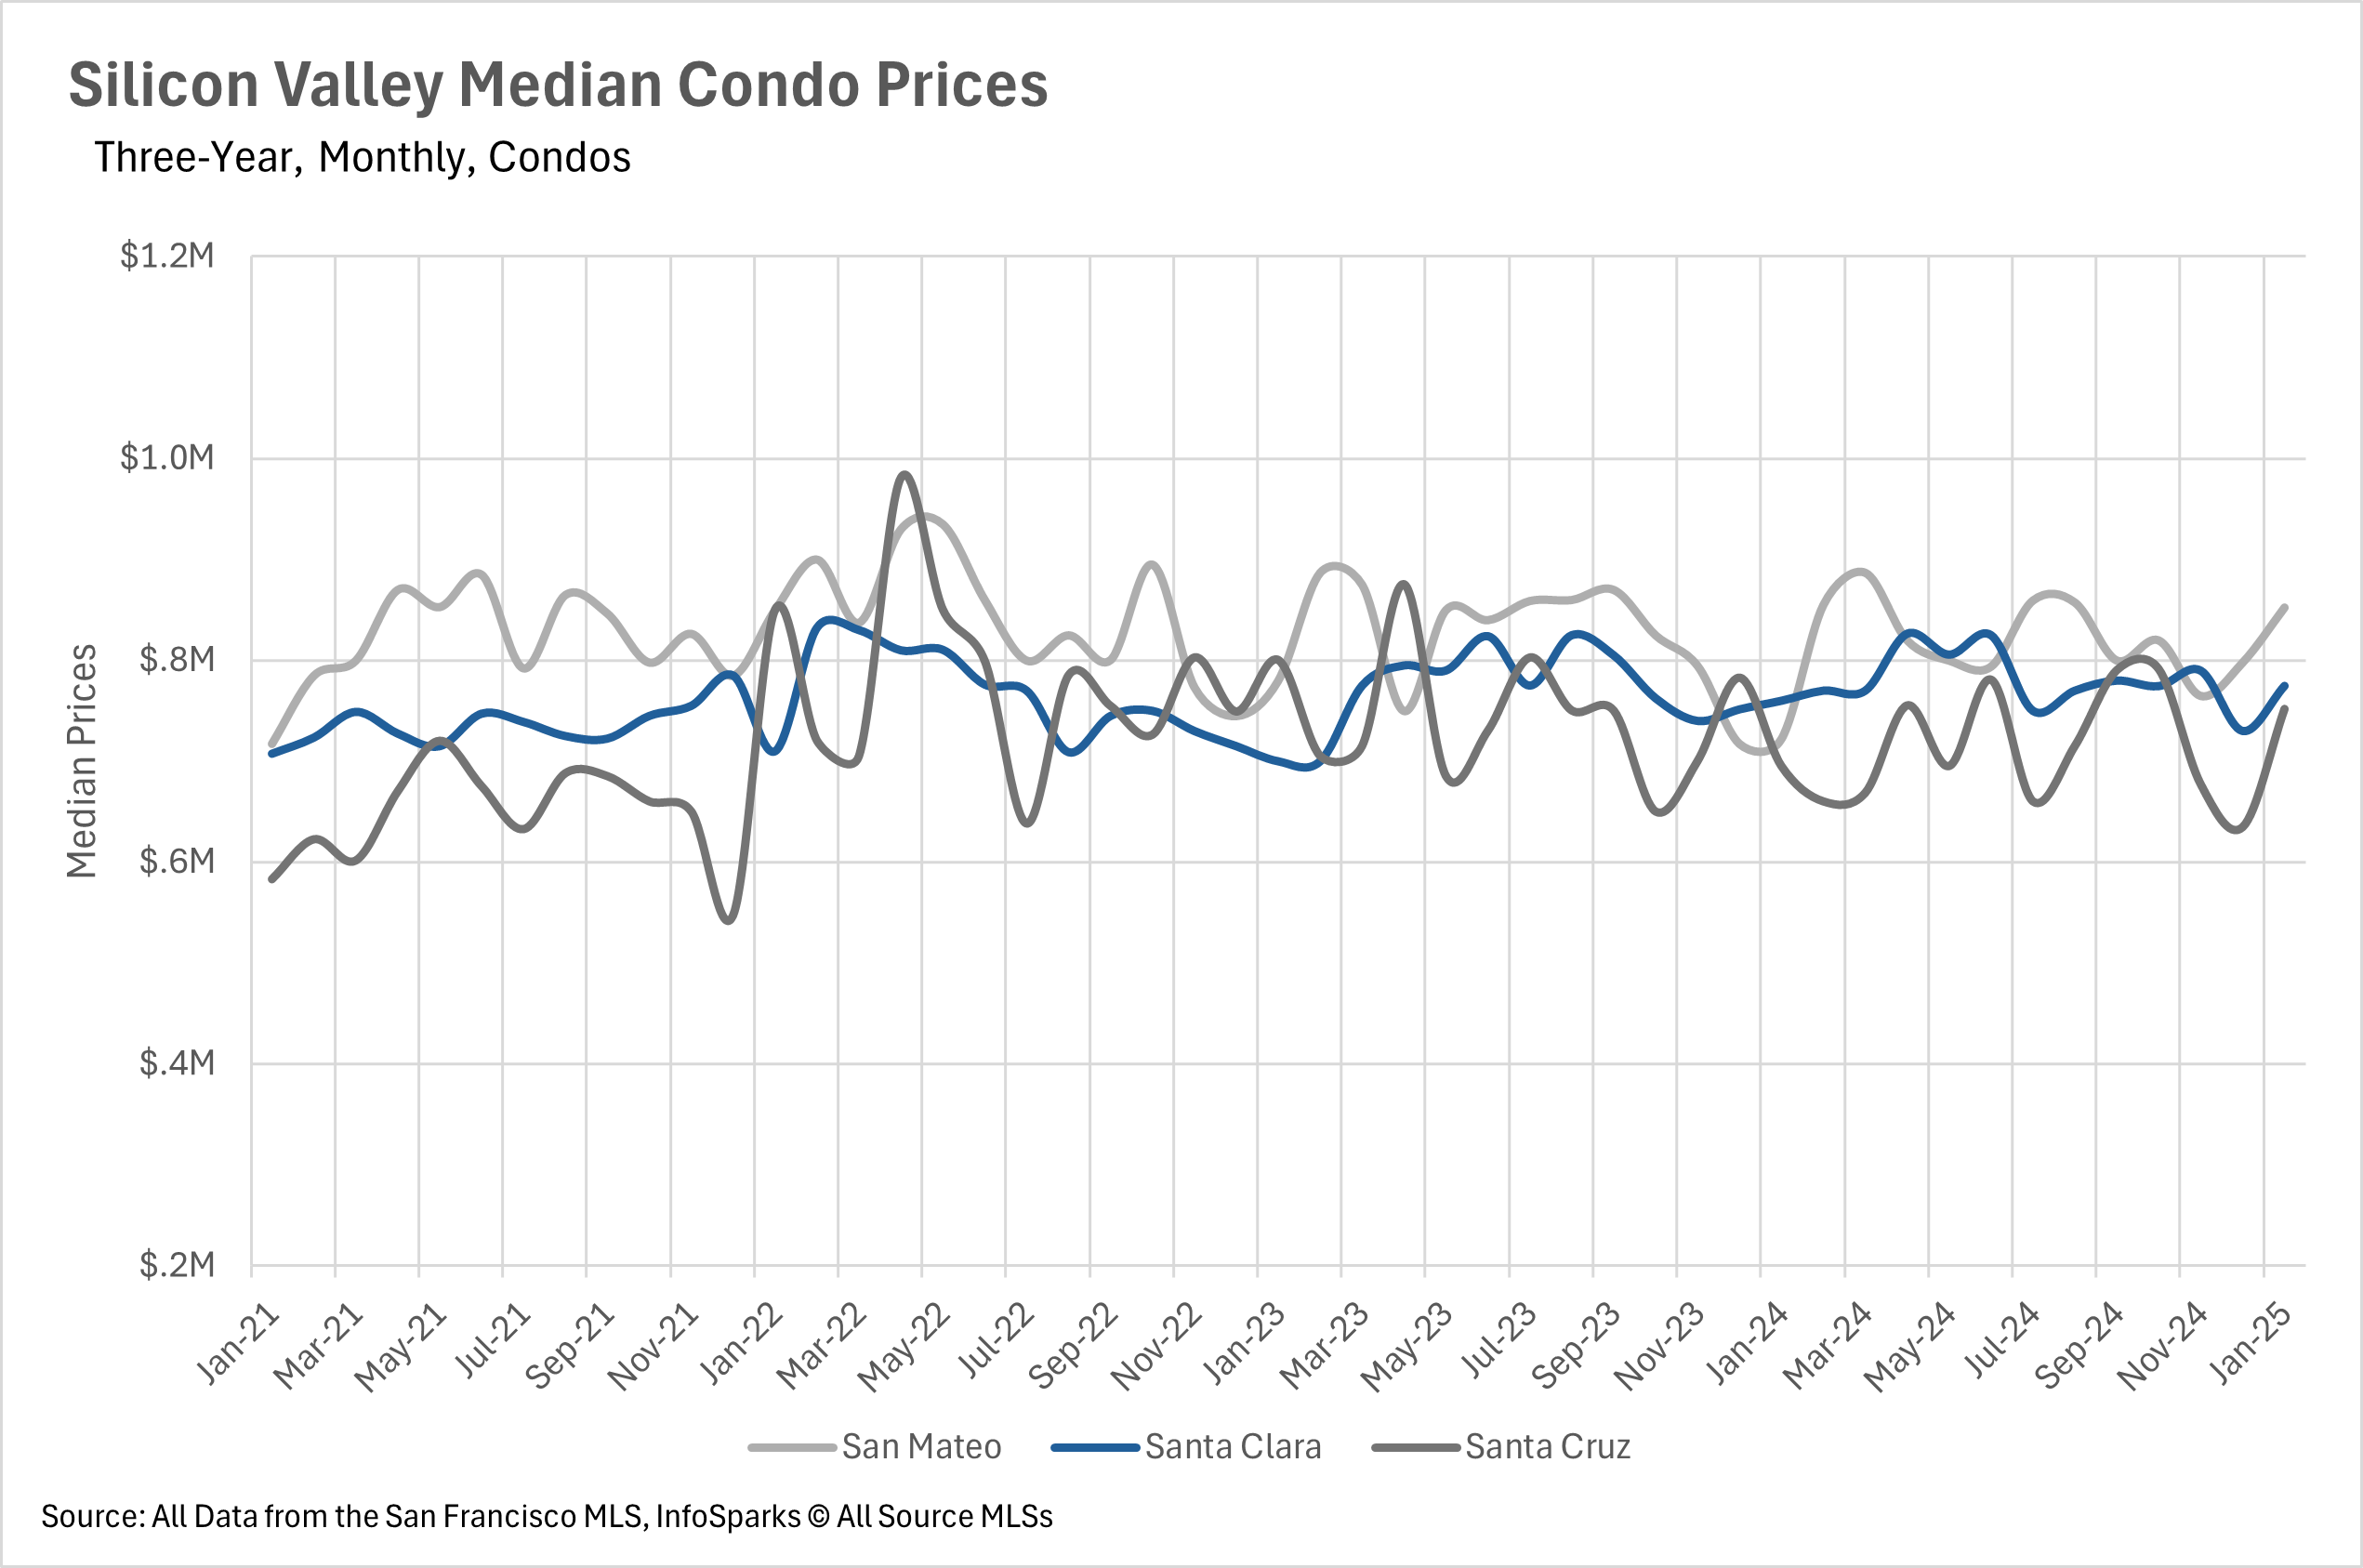
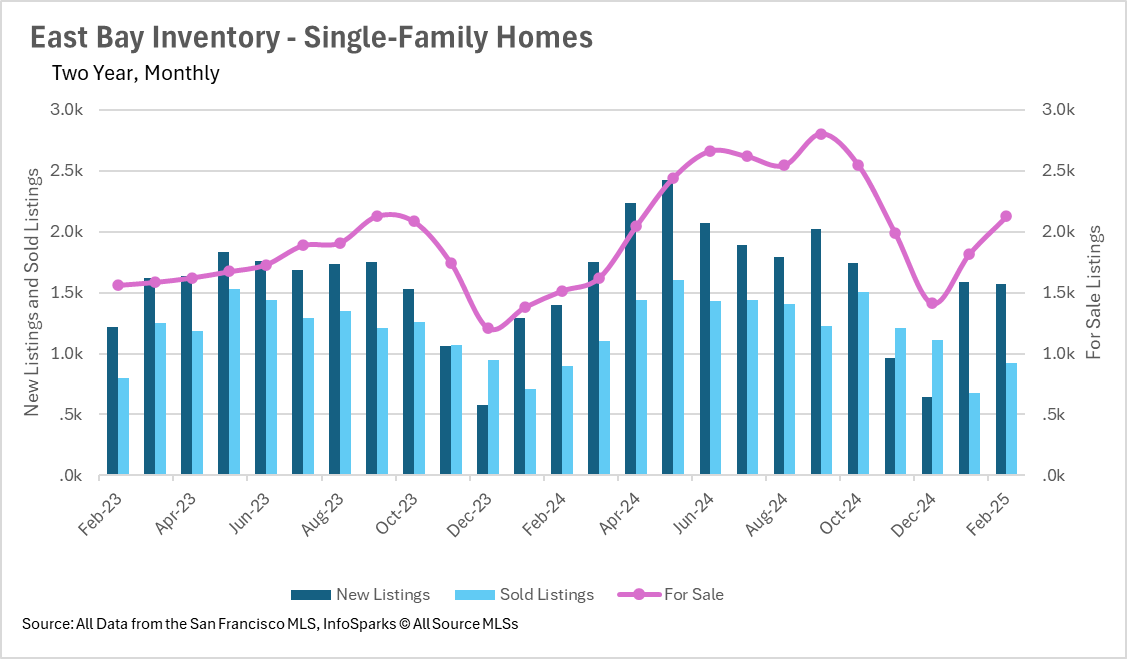
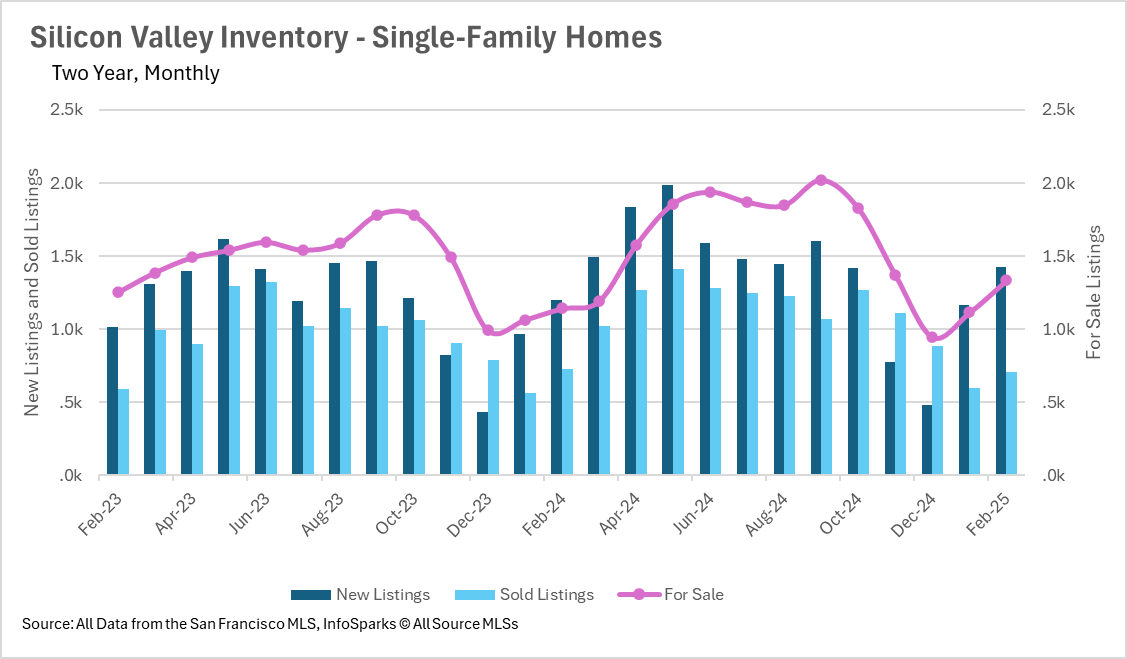
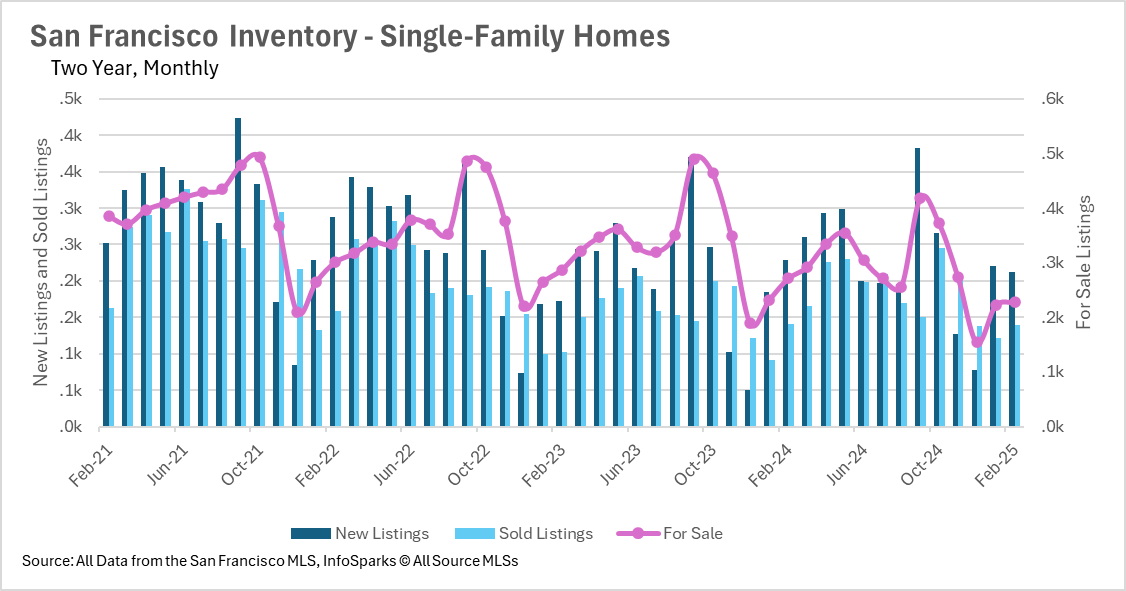
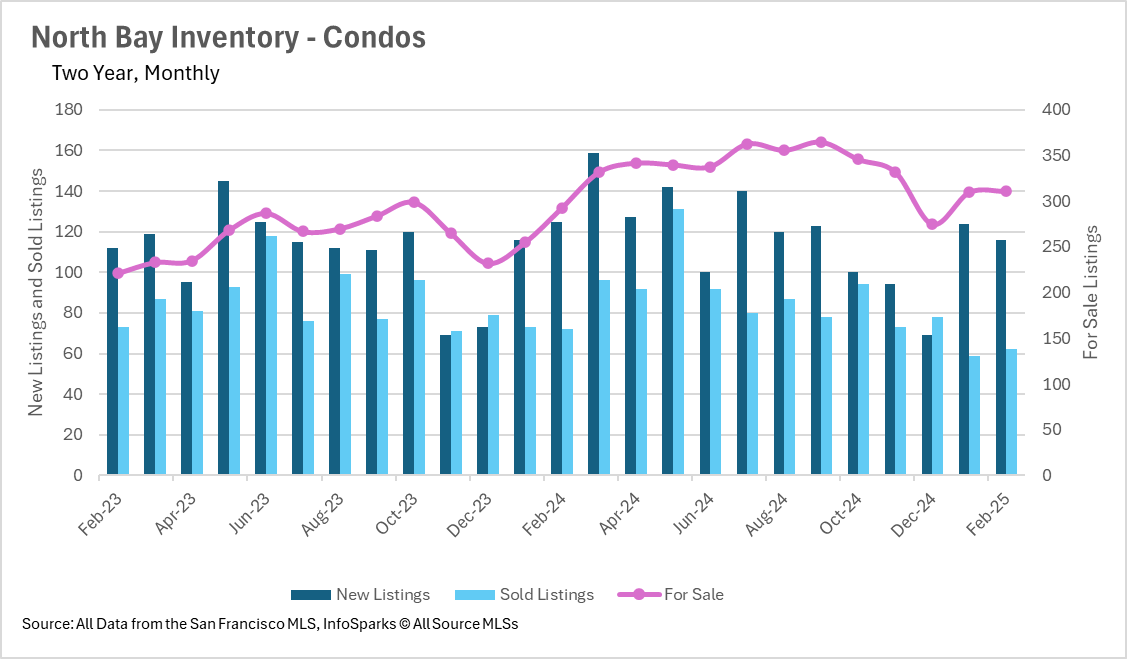
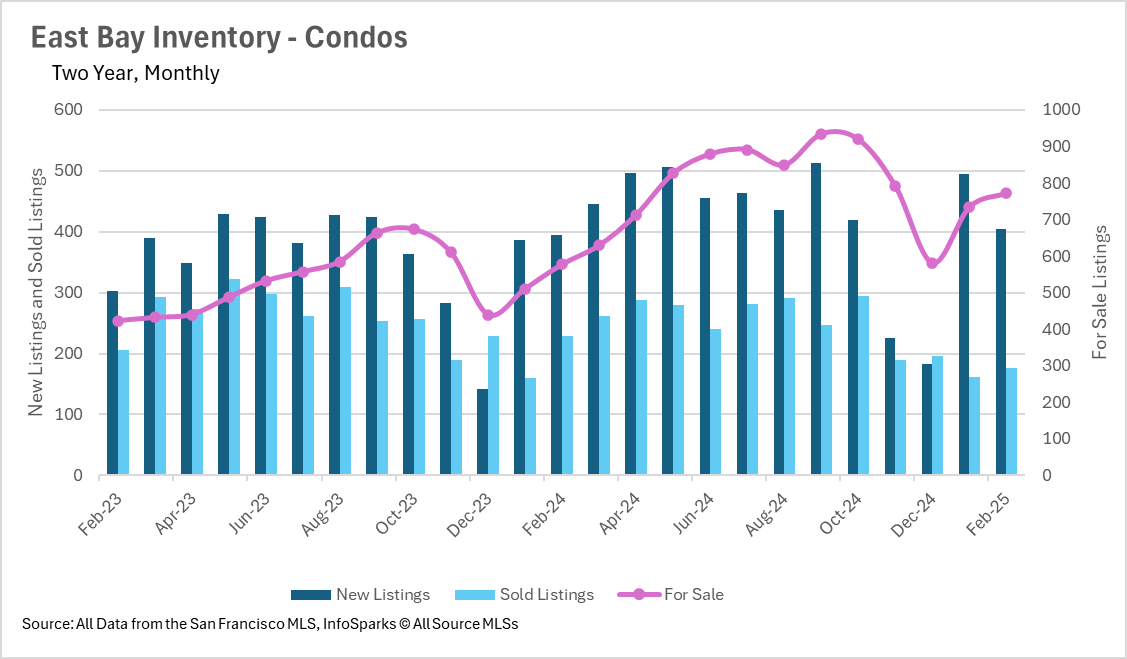
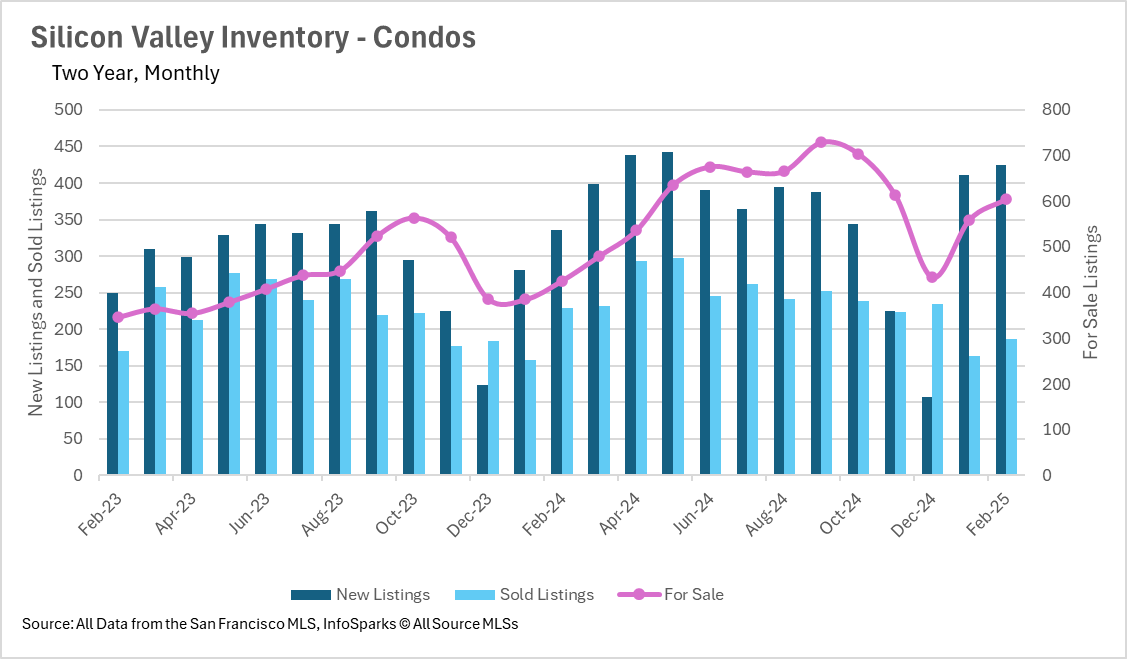
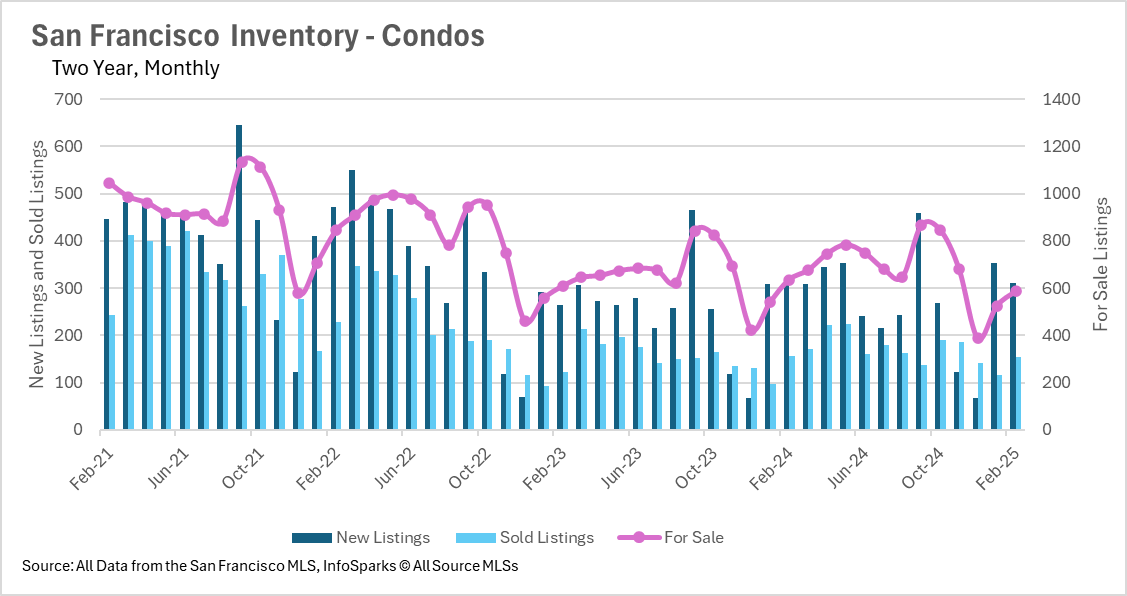
The Bay Area real estate market is showing clear contrasts between its regions. Silicon Valley remains one of the strongest markets, with median sale prices in San Mateo and Santa Clara counties rising over 10% year-over-year. North Bay also experienced price appreciation, with Napa County standing out at over 21% growth. However, the East Bay market is leveling off due to a surge in inventory, and while single-family home prices have held steady, condos have taken a notable dip. Meanwhile, San Francisco’s home prices continue to fluctuate around their two-year average, as inventory levels and demand move in sync.
Inventory Trends Vary Across the Bay Area
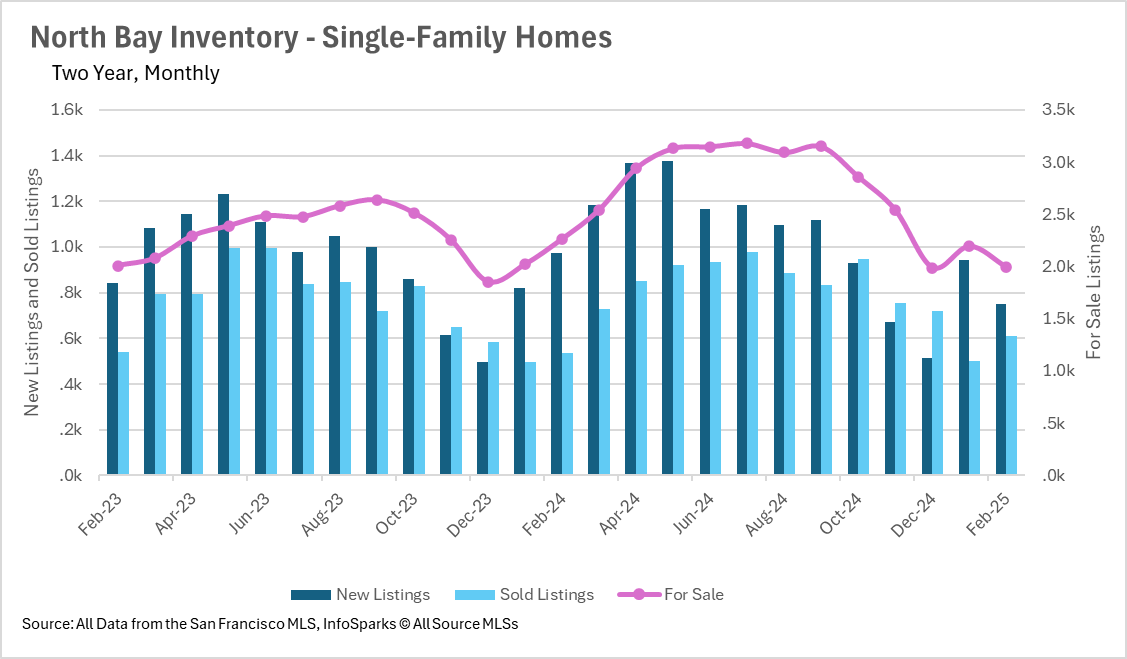
Inventory trends across the Bay Area are mixed. Silicon Valley saw a significant increase in available listings, with active inventory rising more than 16% compared to last year. The East Bay experienced an even more dramatic shift, with inventory up 40% year-over-year. In contrast, the North Bay is facing a supply shortage, with single-family home listings down over 12% annually, leading to continued competition among buyers. San Francisco presents a unique challenge, as its inventory continues to shrink, particularly in the single-family home market, where listings declined nearly 16% over the past year.
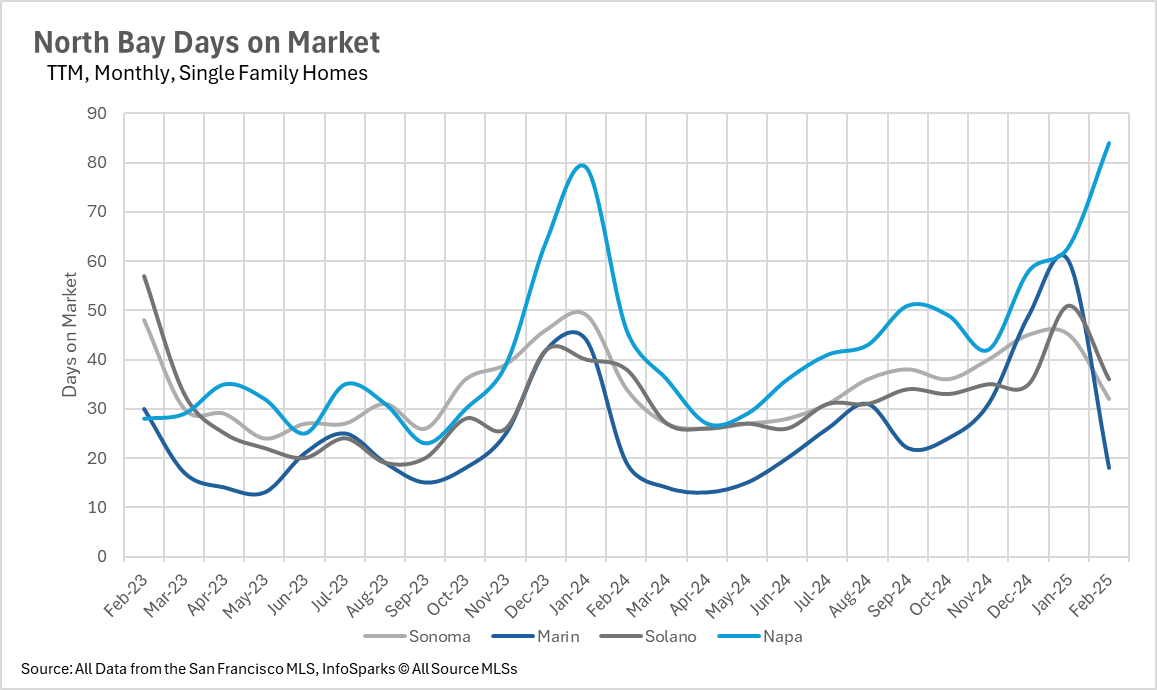
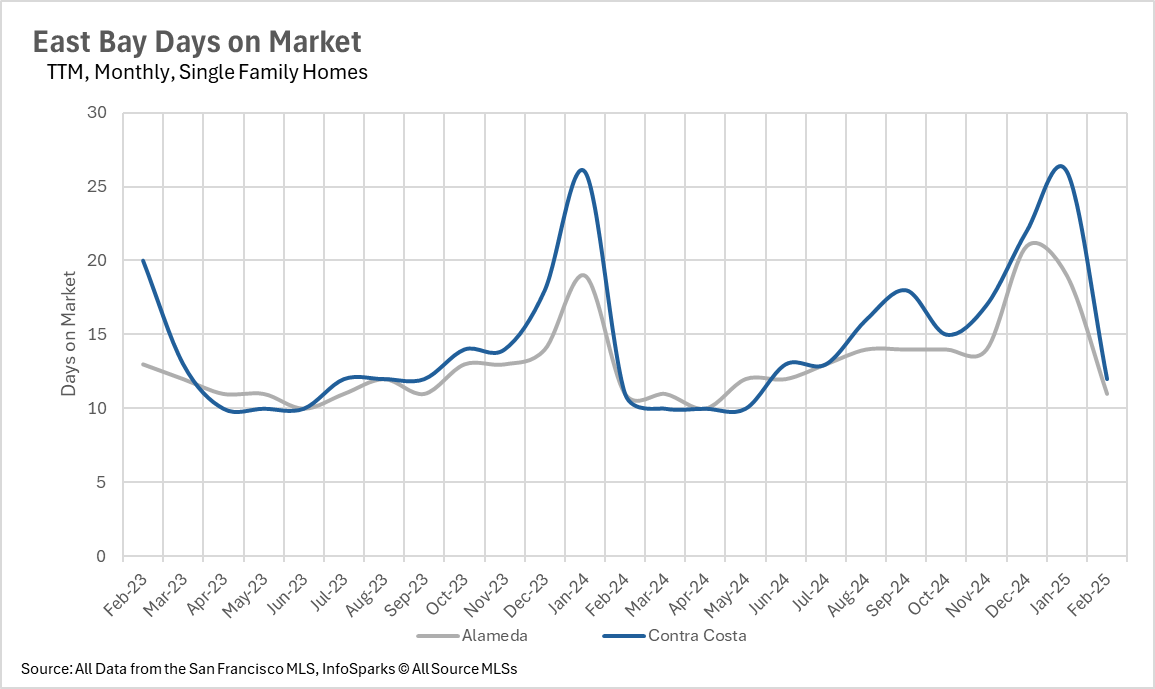
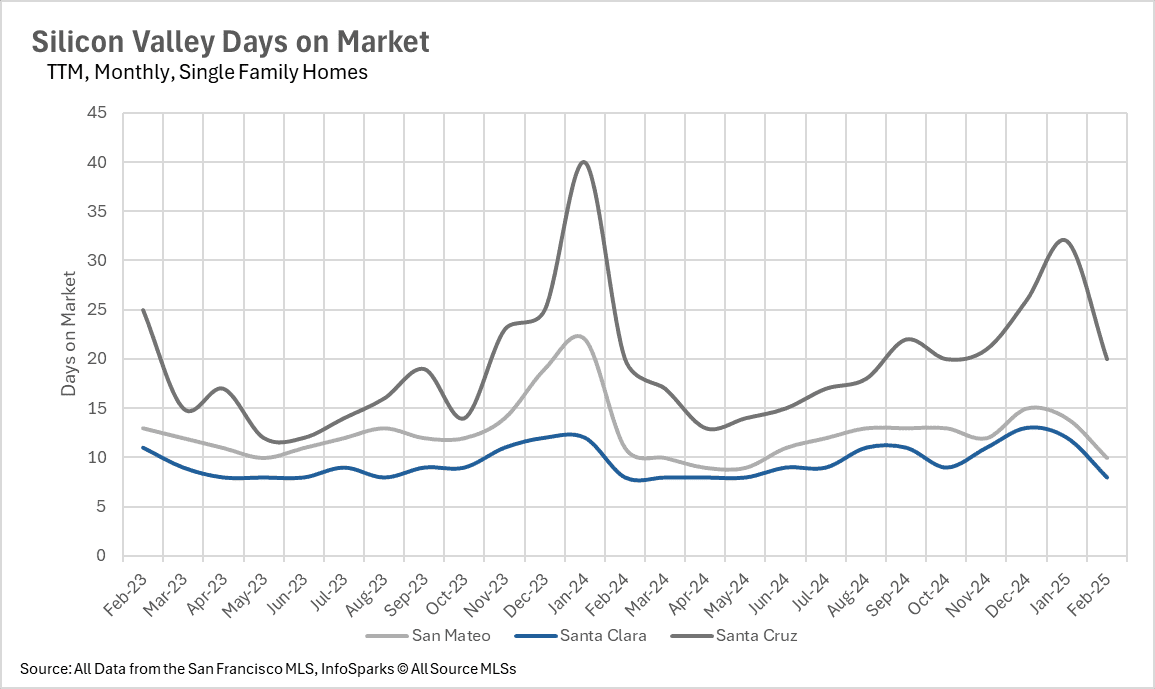
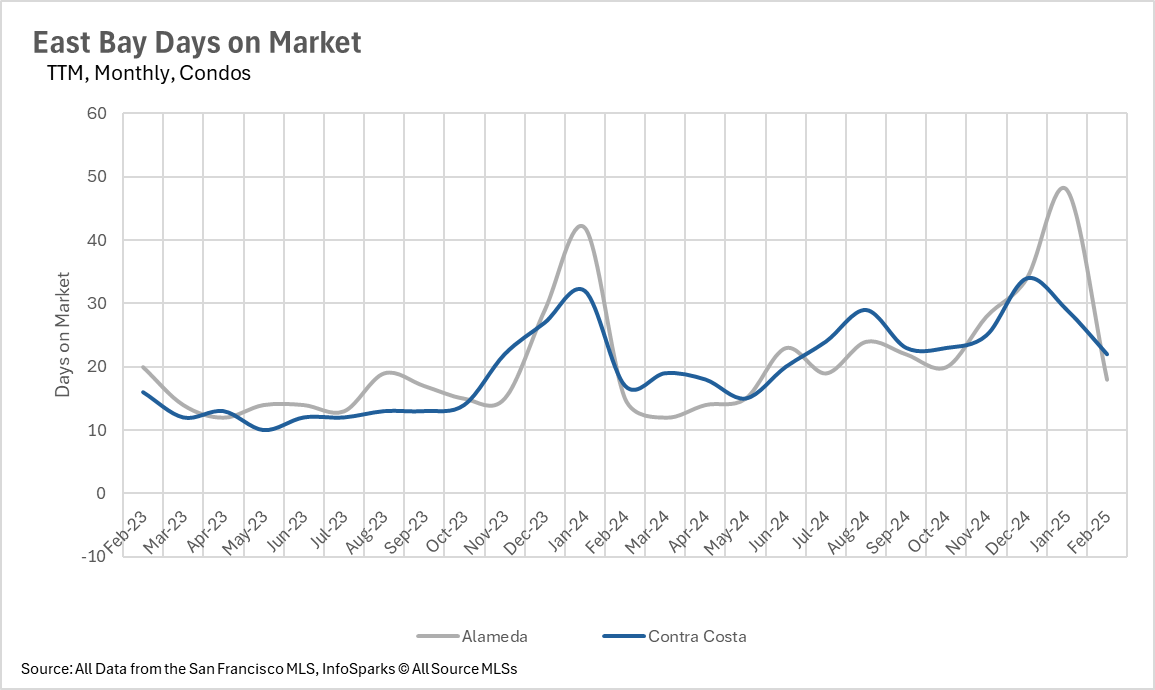
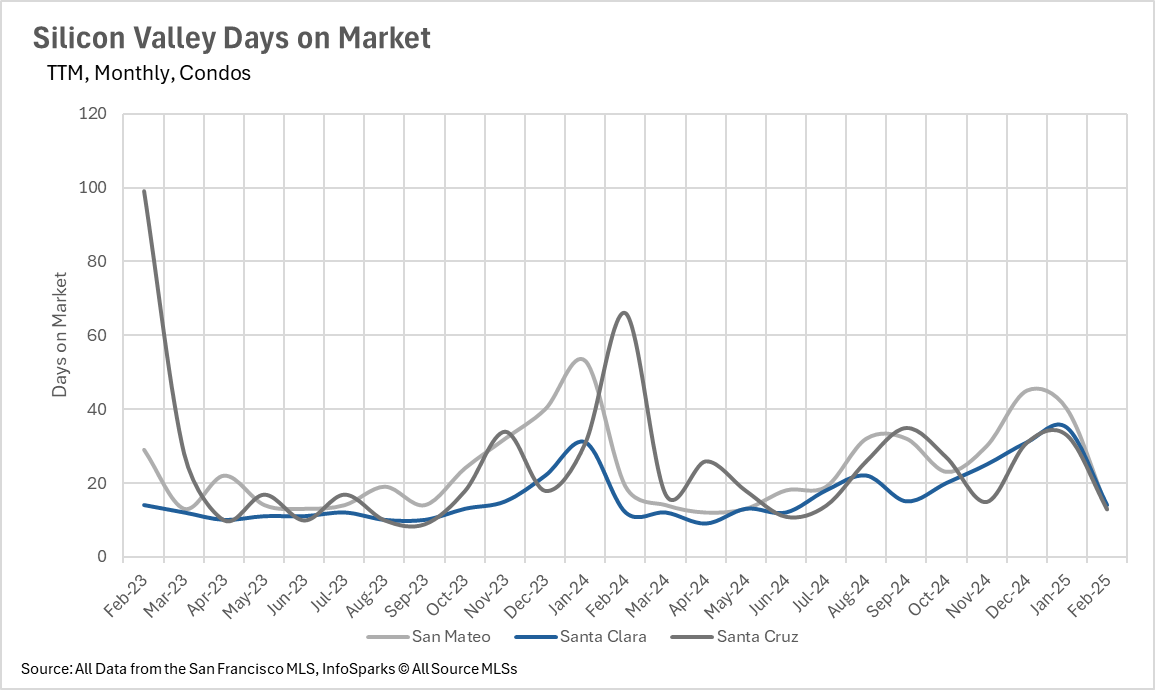
Homes Are Selling Quickly—But Not Everywhere
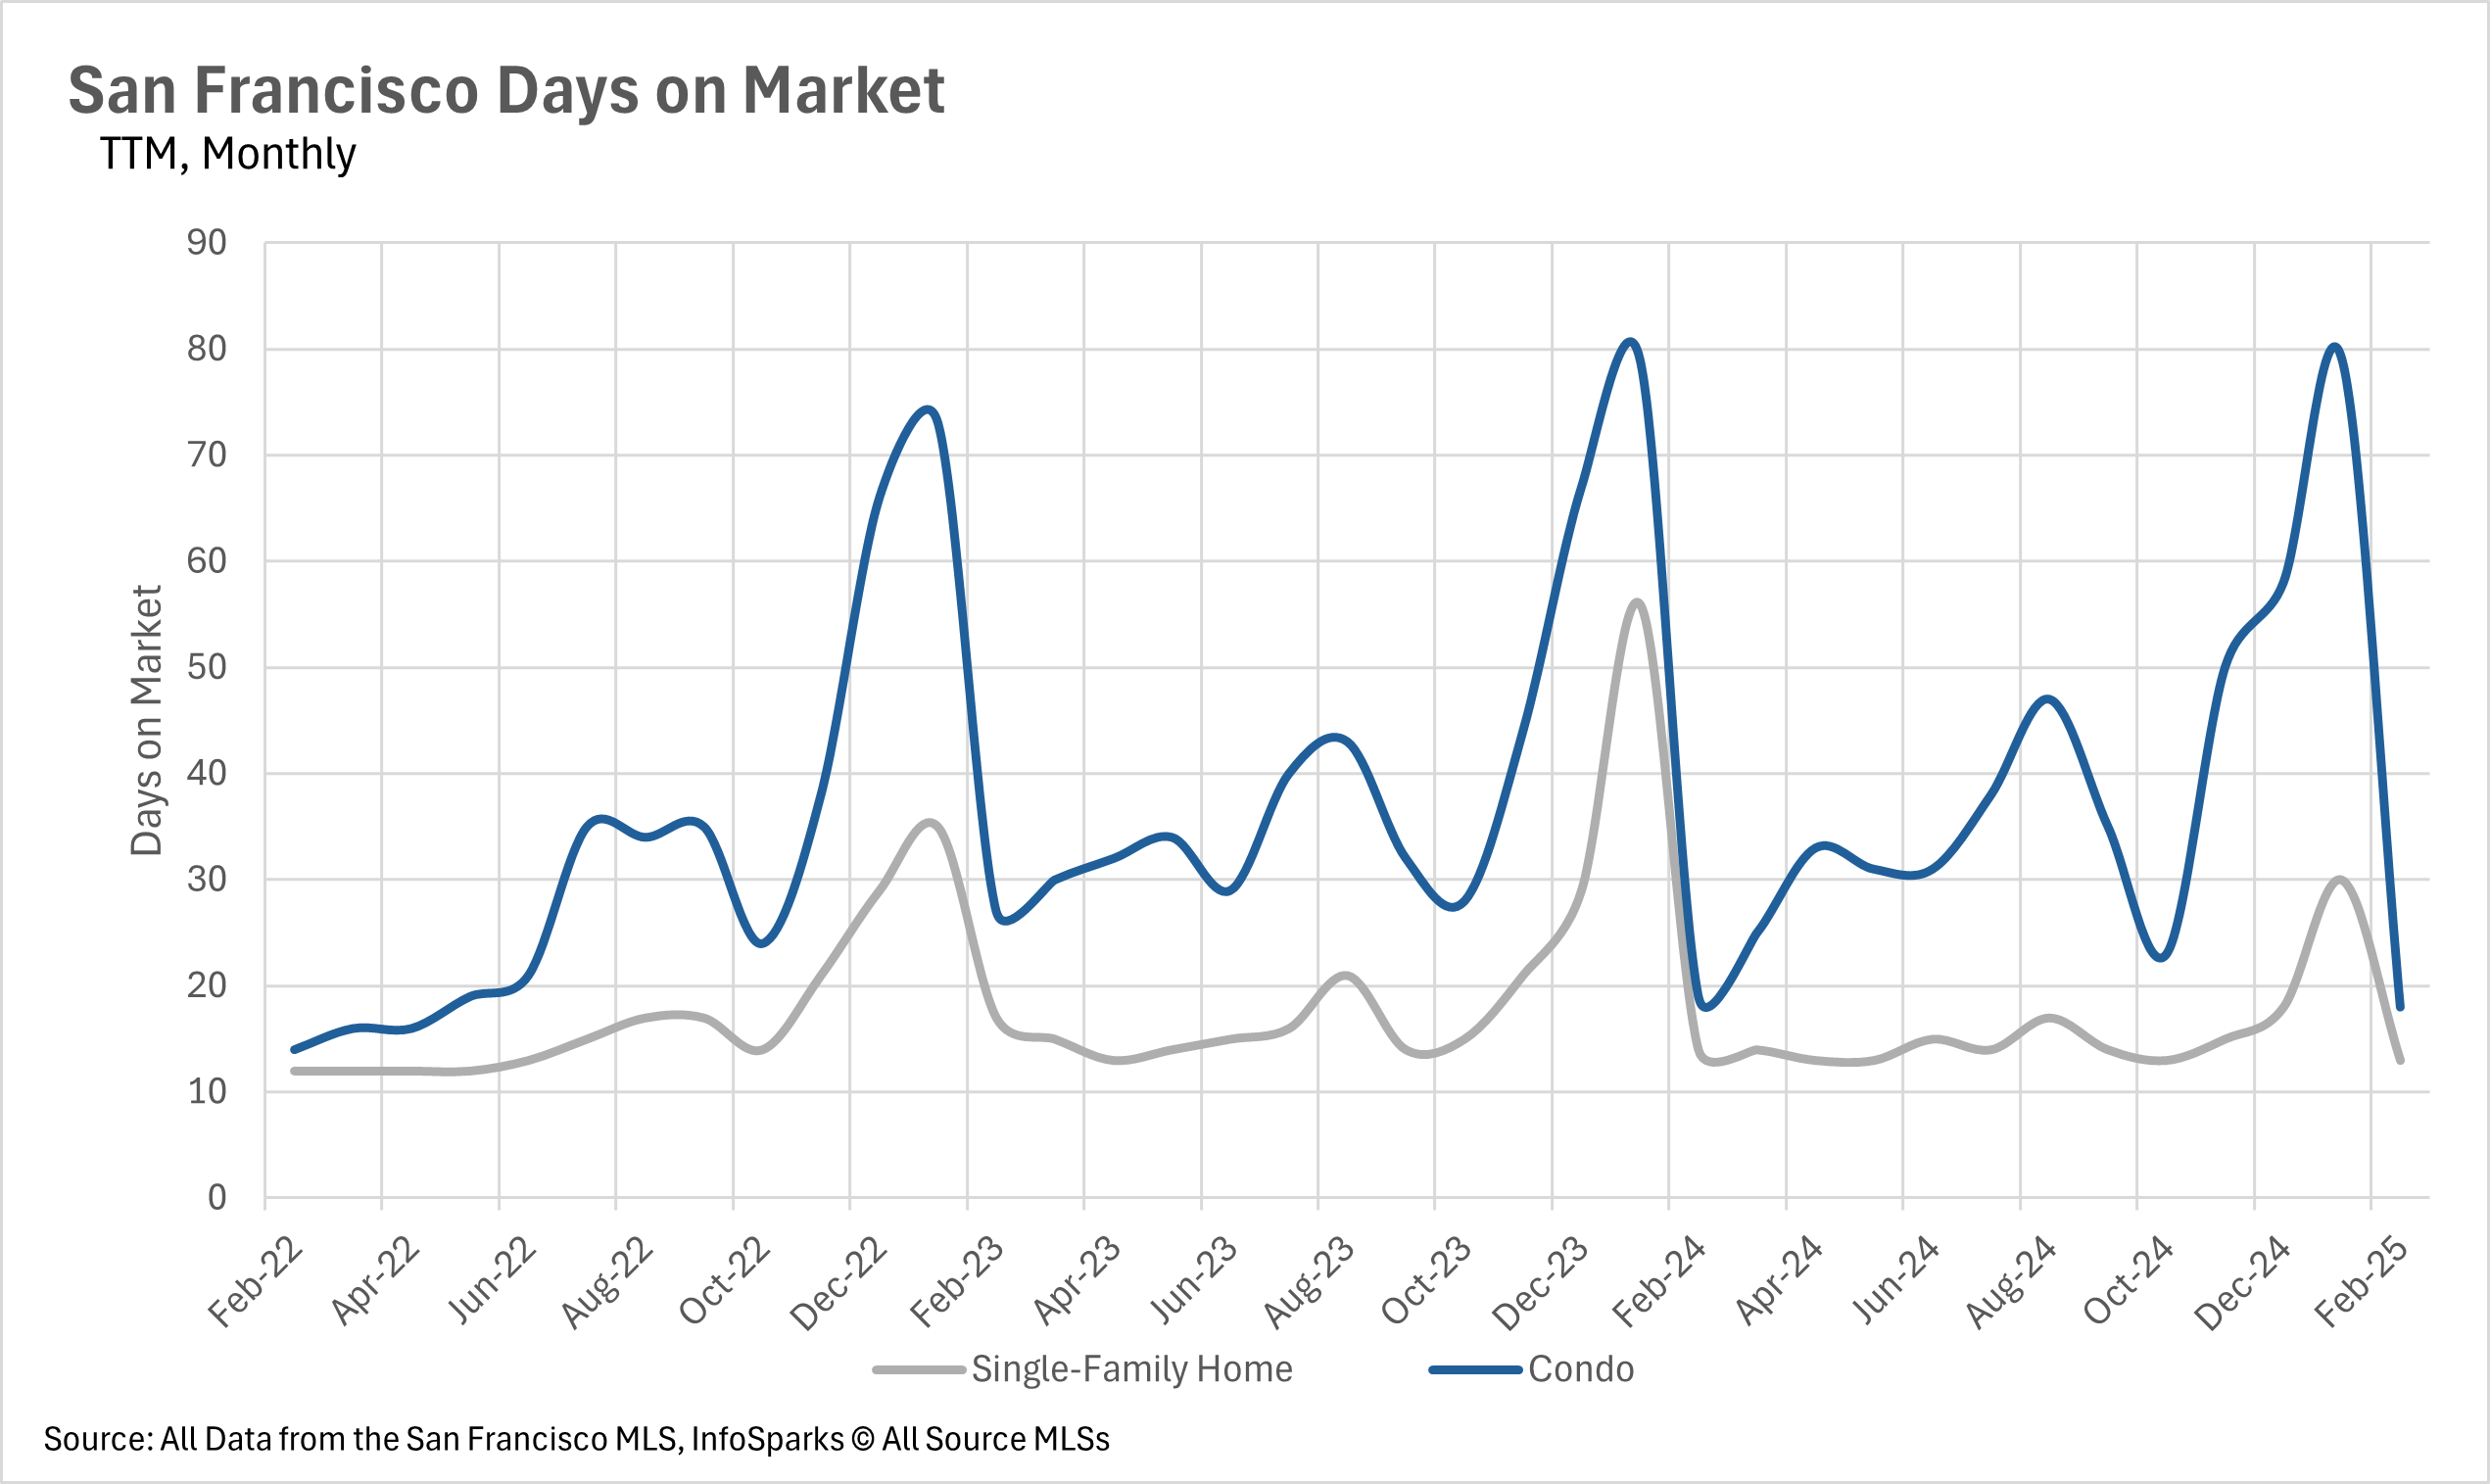
Despite varying inventory trends, homes in many parts of the Bay Area continue to sell quickly. In Silicon Valley, the average listing in Santa Clara County lasts just 8 days on the market, showing intense demand. Even in the East Bay, where inventory has surged, homes are still moving at a steady pace. The North Bay also remains highly competitive, with listings spending fewer days on the market in most counties—except for Napa, where homes are taking nearly twice as long to sell compared to last year. San Francisco remains split, as single-family homes sell at a premium, while condos linger longer on the market.
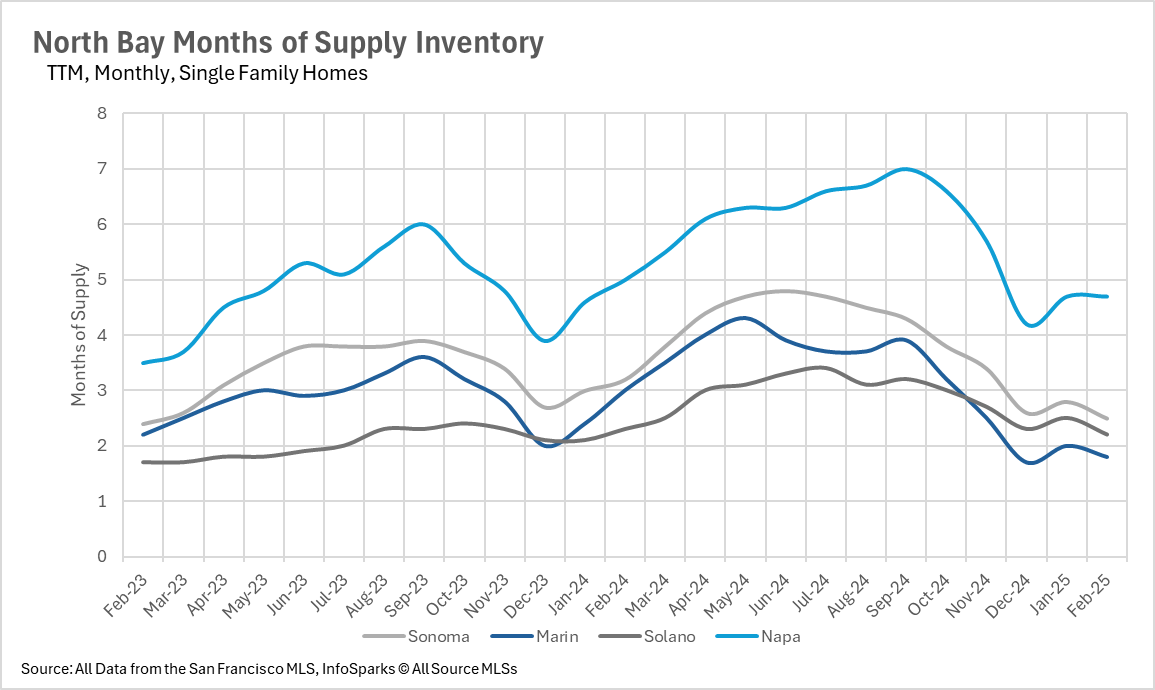
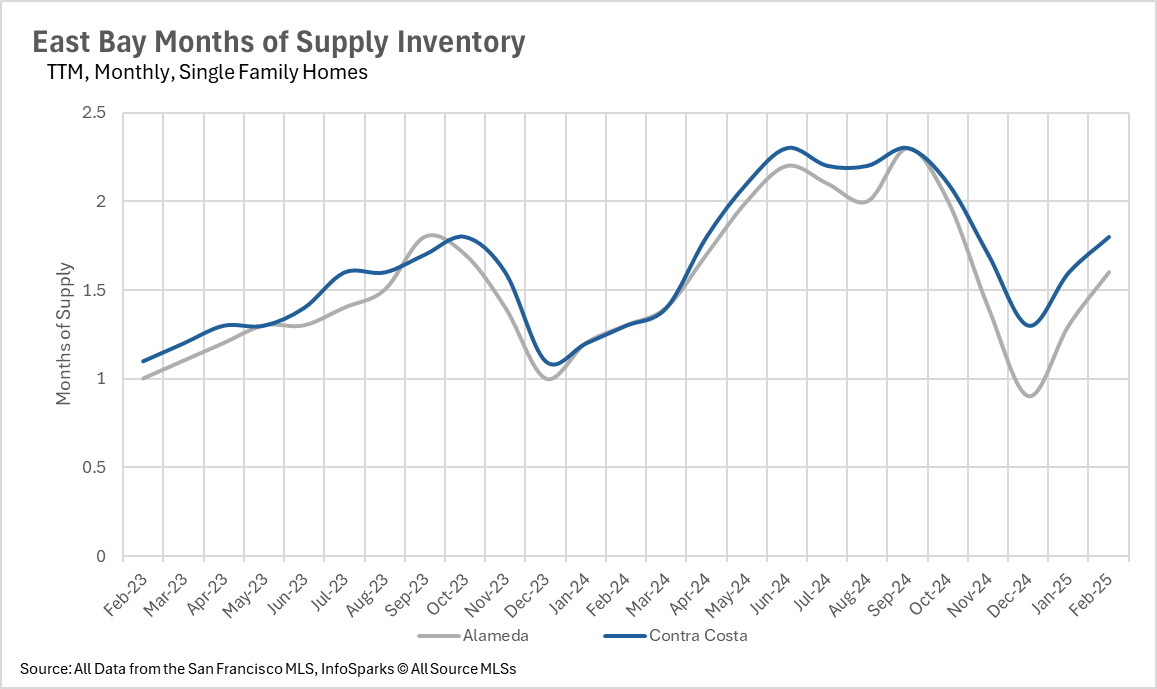
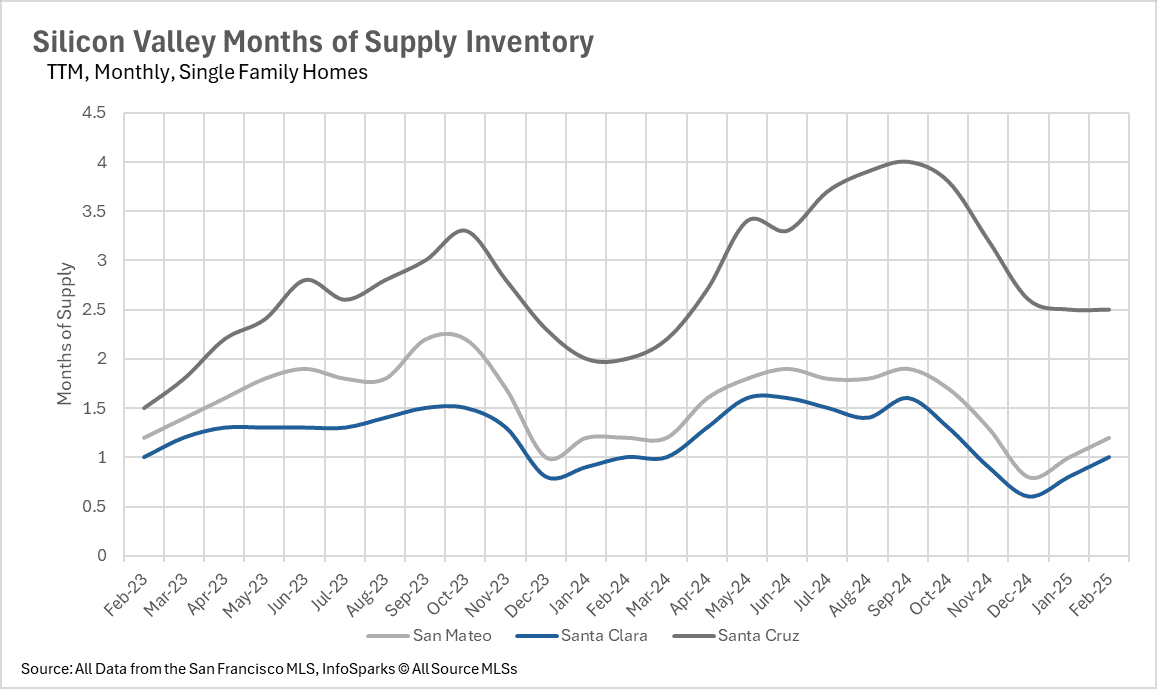
Seller’s Market Holds Firm, Except in Select Areas
Most of the Bay Area remains a strong seller’s market, particularly in Silicon Valley, where months of supply inventory (MSI) remains well below the three-month threshold that defines a balanced market. The East Bay also continues to favor sellers, though its rapidly growing inventory could shift that dynamic. In the North Bay, Napa is the only county that leans toward a buyer’s market, with nearly five months of supply available. San Francisco remains divided—sellers hold the upper hand in the single-family home market, where inventory is tight, but condo buyers have more negotiating power with over three months of supply available.
Local Lowdown Data