If you prefer to bypass The Big Story and jump straight to the Local Market Report, click here.
The Big Story
Elevated rates are here to stay
Quick Take:
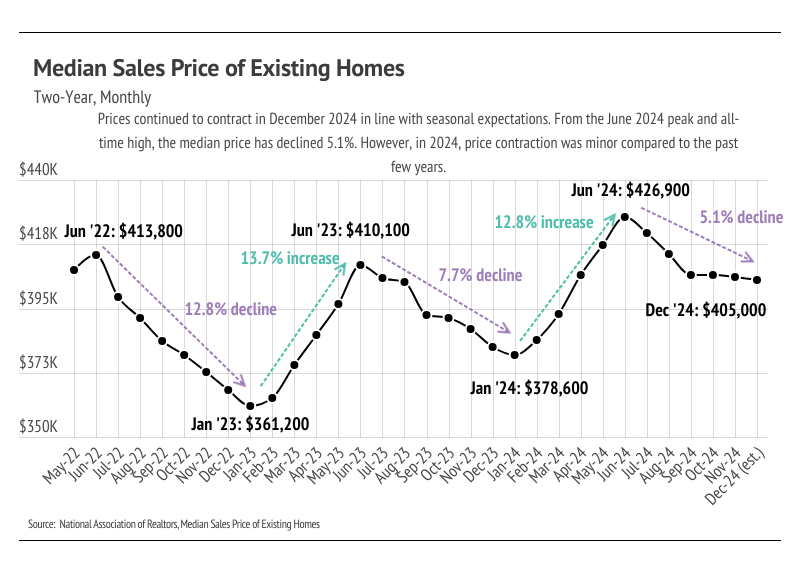
- Home prices declined modestly in Q4 2024, showing atypical price stability in the second half of the year. Because prices didn’t contract significantly in the second half of 2024, they will easily rise to new highs in 2025.
- Since September 2024, the Fed has cut rates by 1%, bringing the interest rate that banks charge each other for short-term loans to a range of 4.25% to 4.5%. In 2025, we only expect the federal funds rate to decline by another 25 to 50 bps.
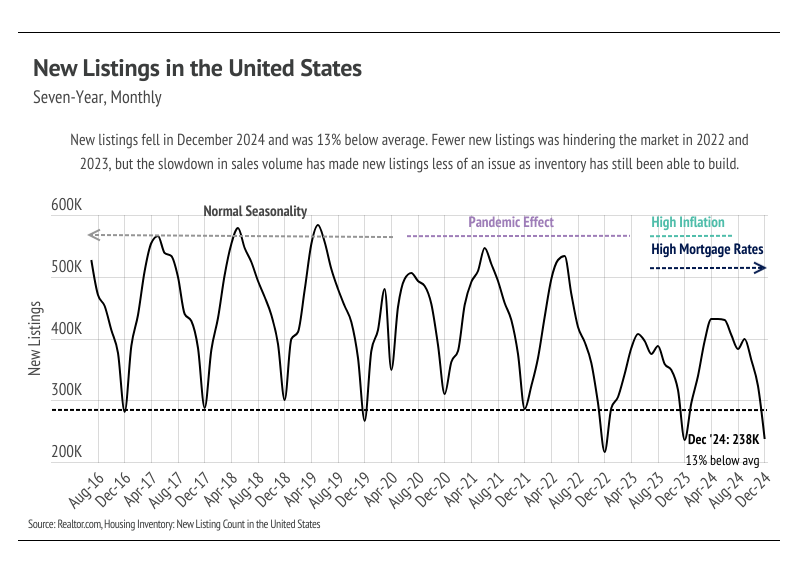
- Sales rose 4.8% month over month, the swiftest pace since March. Sales accelerated 6.1% from one year ago, the largest year-over-year gain since June 2021. At the same time, inventory fell 2.9% but is still near its highest level in the past four years. Higher inventory levels created more opportunity for sales.
Note: You can find the charts & graphs for the Big Story at the end of the following section.
*National Association of REALTORS® data is released two months behind, so we estimate the most recent month’s data when possible and appropriate.
Economic (policy) uncertainty elevated mortgage rates
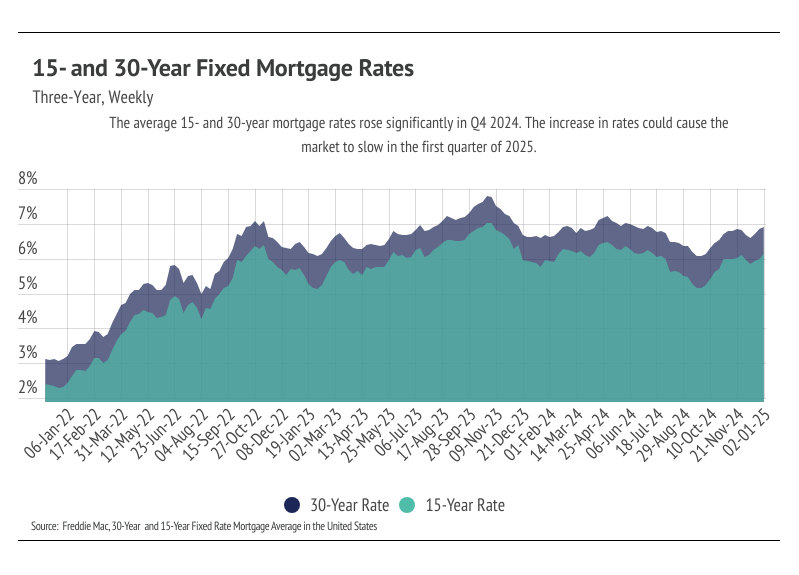
The Federal Reserve’s interest rate cuts in 2024 provided some relief to some borrowers, but mortgage rates have remained stubbornly high. As of January 2, 2025, the average 30-year fixed-rate mortgage climbed to 6.91%, its highest level in nearly six months, according to Freddie Mac. Even with the Fed lowering the federal funds rate by a full percentage point over the past four months, mortgage rates have not fallen proportionally, remaining about 0.3 percentage points higher than their 6.6% average in January 2024.
This disconnect is largely due to factors beyond the Fed's control, such as economic growth, inflation concerns, and fluctuations in the 10-year Treasury bond yield, which heavily influence mortgage rates. Economists predict that meaningful relief for homebuyers is unlikely in 2025, with rates expected to remain elevated between 6% and 7%. Lawrence Yun, chief economist at the National Association of Realtors, forecasts the average 30-year fixed mortgage rate will hover around 6.5% throughout the year.
Adding to the uncertainty, President-elect Donald Trump's proposed economic policies — potentially including sweeping tariffs on foreign goods and additional tax cuts — could reignite inflation. If inflation accelerates, the Fed will almost certainly curtail rate cuts. However, some analysts suggest Trump's tariff threats may be strategic bargaining tools in trade negotiations rather than definitive actions. If inflation continues to ease, the Fed could maintain its trajectory of lowering rates in 2025. At its December meeting, the central bank projected two additional rate cuts for the year, down from its earlier expectation of four. Inflation increased over the past two months, so we are inclined to side with the Fed’s assumption that two rate cuts are prudent in 2025.
Despite economic policy uncertainty and increasing mortgage rates, home sales have increased substantially over the past two months. We attribute this rise to two main factors: much more inventory and the market’s acceptance of higher mortgage rates. Higher inventory has allowed potential buyers to more easily find the home that’s right for them with less competition, creating a better all-around buying experience. Additionally, buyers and sellers have broadly accepted that rates will be higher than they might like for some time, and waiting for rate drops isn’t worth the time anymore. There is also a potential third factor around economic sentiment; roughly half the country thinks more highly of the economy due to the incoming administration. For better or worse, vibes are important, and buying a home is often as much or more of an emotional choice as it is a financial one.
Different regions and individual houses vary from the broad national trends, so we’ve included a Local Lowdown below to provide you with in-depth coverage for your area. As always, we will continue to monitor the housing and economic markets to best guide you in buying or selling your home.
Big Story Data

The Local Lowdown
Quick Take:
- Month over month, median prices fell across most of the Bay Area in December. We expect prices to contract in January 2025 before rising in the spring and summer months.
- Total inventory in the Bay Area declined significantly, as sales far outpaced new listings. We expect inventory to decline and the overall market to slow in the first quarter of 2025.
- Months of Supply Inventory declined in Q4 and currently indicates a sellers’ market, with the exception of Napa, which is more balanced.
Note: You can find the charts/graphs for the Local Lowdown at the end of this section.
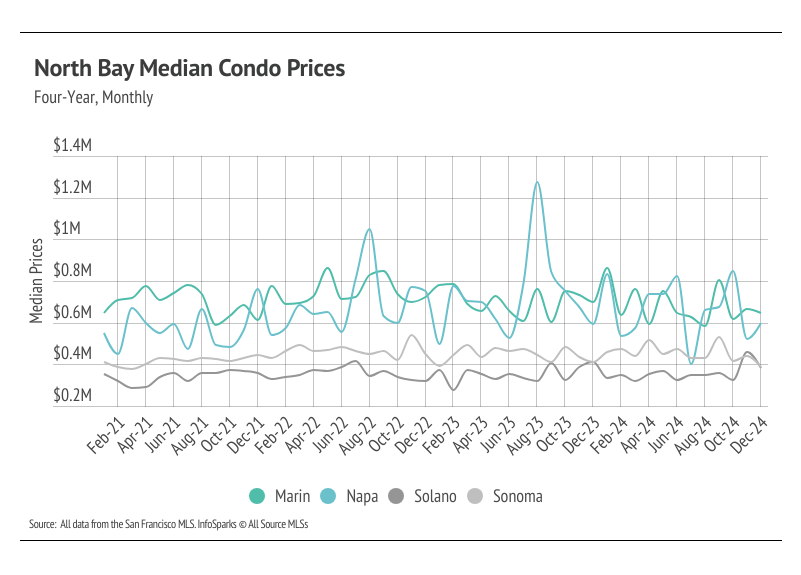
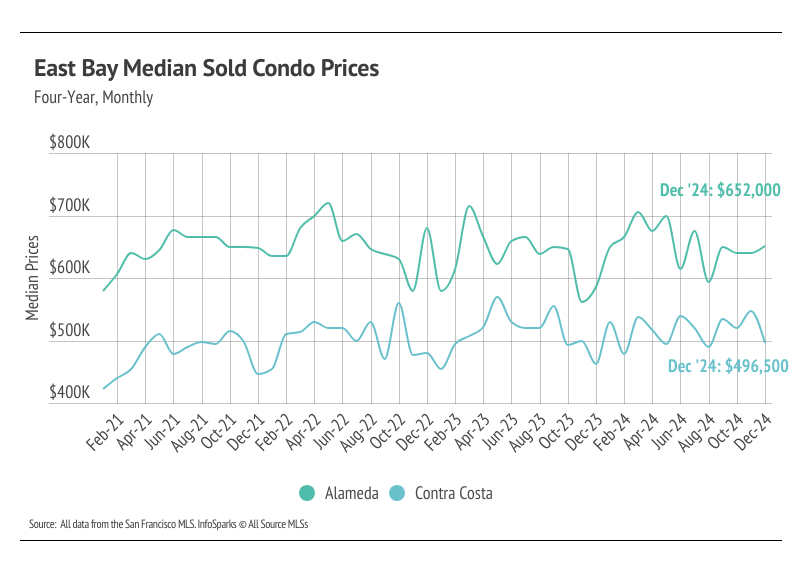
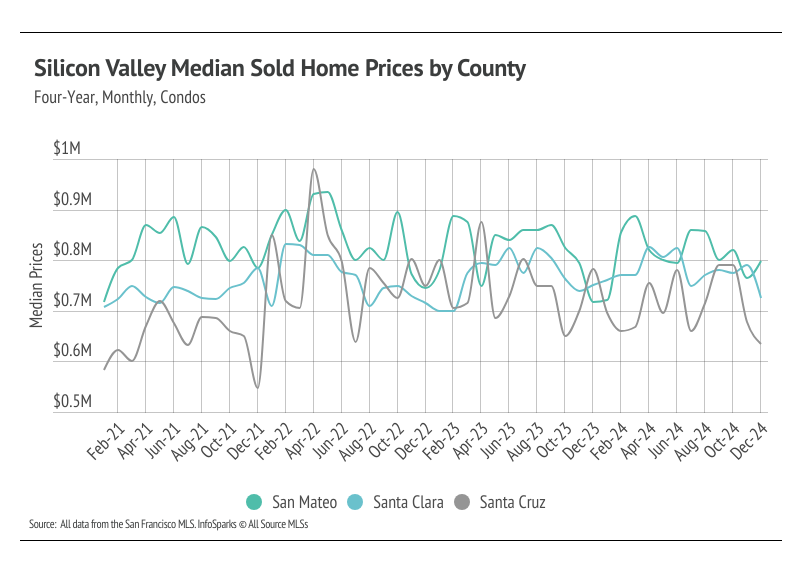
Median prices rose in 2024 across most of the Bay Area
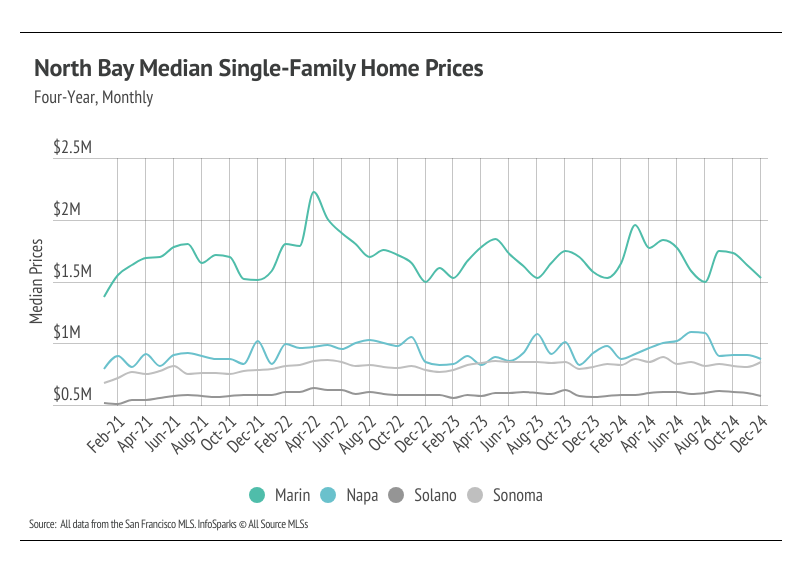
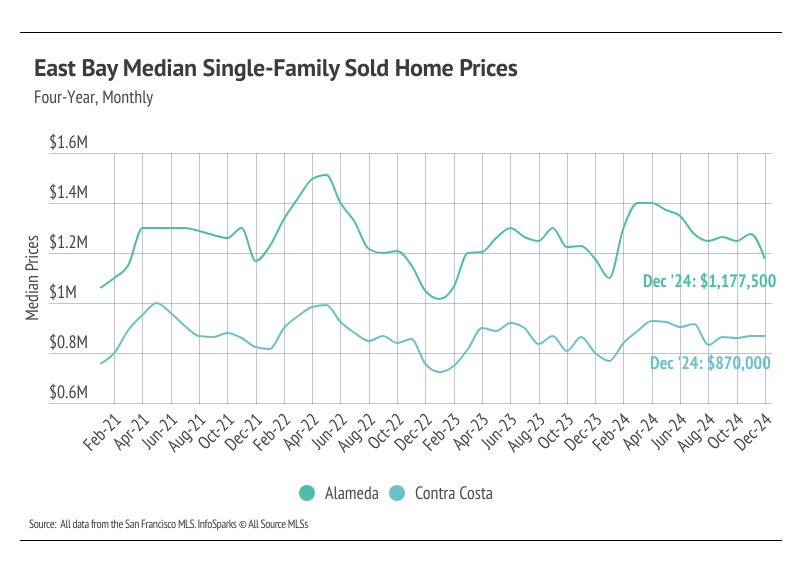
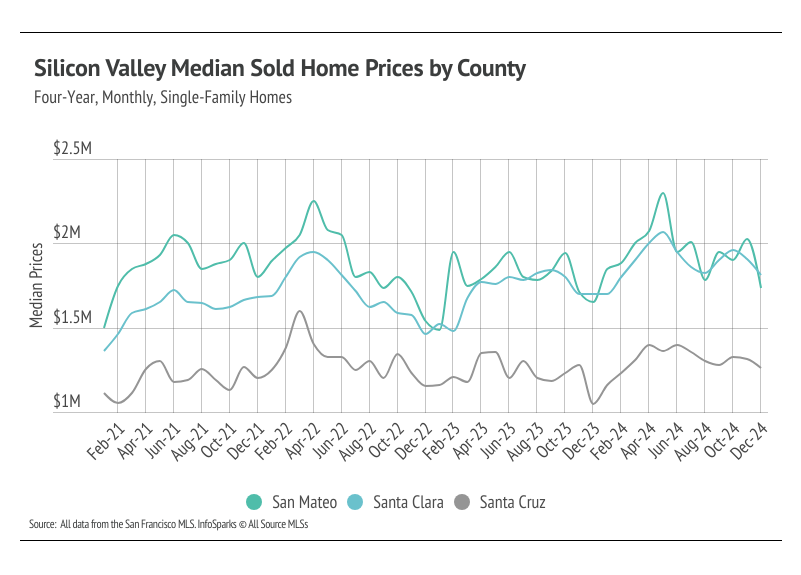
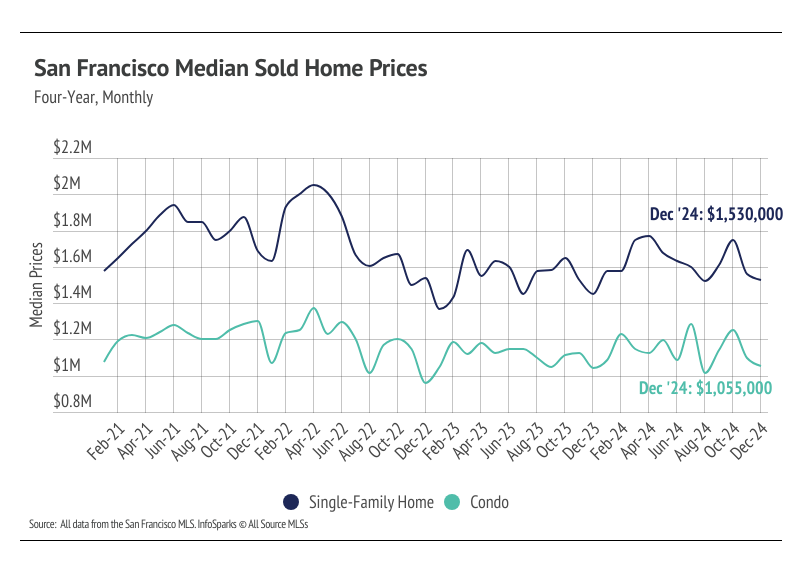
In the Bay Area, home prices haven’t been largely affected by rising mortgage rates after the initial period of price correction from April 2022 to January 2023. Low, but growing inventory and high demand have more than offset the downward price pressure from higher mortgage rates. Year over year, prices increased most significantly for single-family homes in the East Bay, Silicon Valley, and San Francisco. We expect some minor price contraction in January 2025 before rising into the spring and summer months.
High mortgage rates soften both supply and demand, but homebuyers and sellers seemed to tolerate rates near 6% much more than around 7%. Mortgage rates fell significantly from May through September, but rose significantly in the fourth quarter of 2024. Now, rates are far closer to 7% than 6%, so we expect sales to slow further.
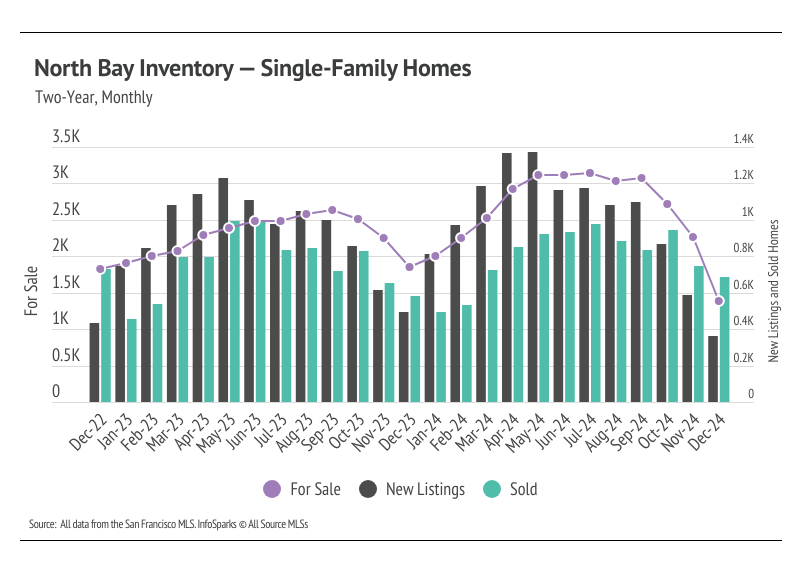
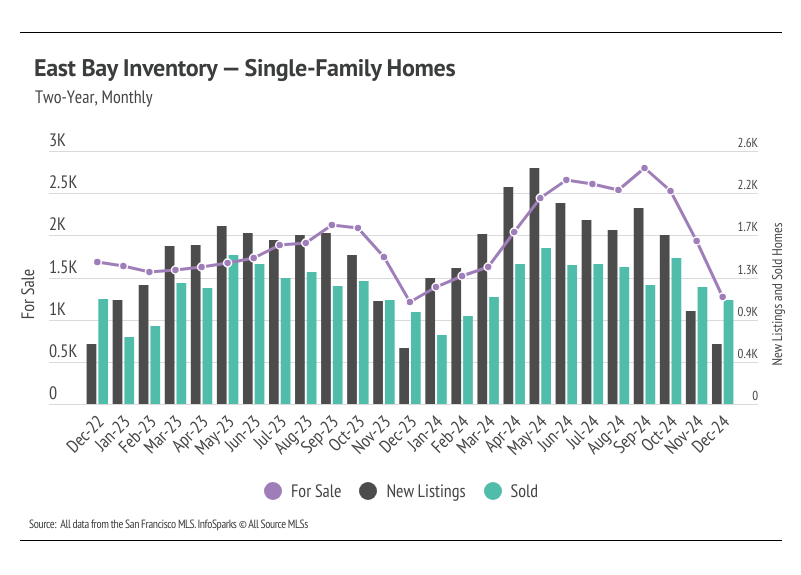
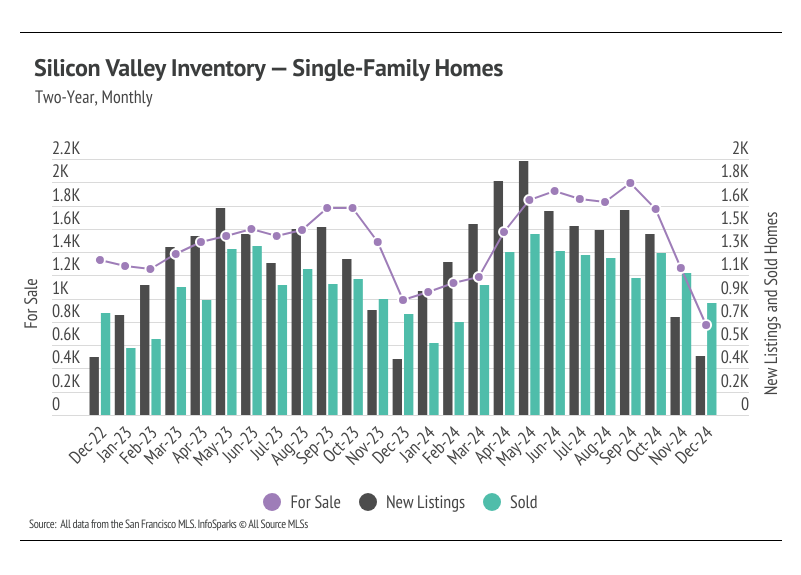
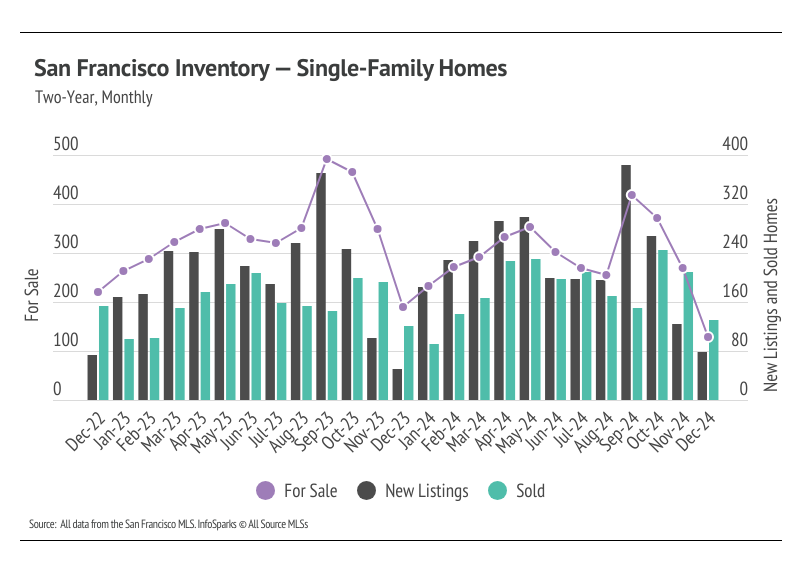
Sales far outpaced new listings in December, causing inventory to drop
In most of the Bay Area, the housing market looked progressively healthier with each passing month of 2024. Then Q4 happened and new listings dropped significantly. Sales declined, but at a much lower rate than new listings, and inventory declined precipitously. Inventory in Silicon Valley and San Francisco fell to historic lows in December 2024.
Typically, inventory begins to increase in January or February, peaking in July or August before declining once again from the summer months to the winter. It’s looking like 2024 inventory, sales, and new listings resembled historically seasonal patterns. Mortgage rates will likely slow the Bay Area markets due to the relatively high absolute dollar cost of financing a home. For many buyers and sellers, a $1 million mortgage at 7% simply isn’t feasible.
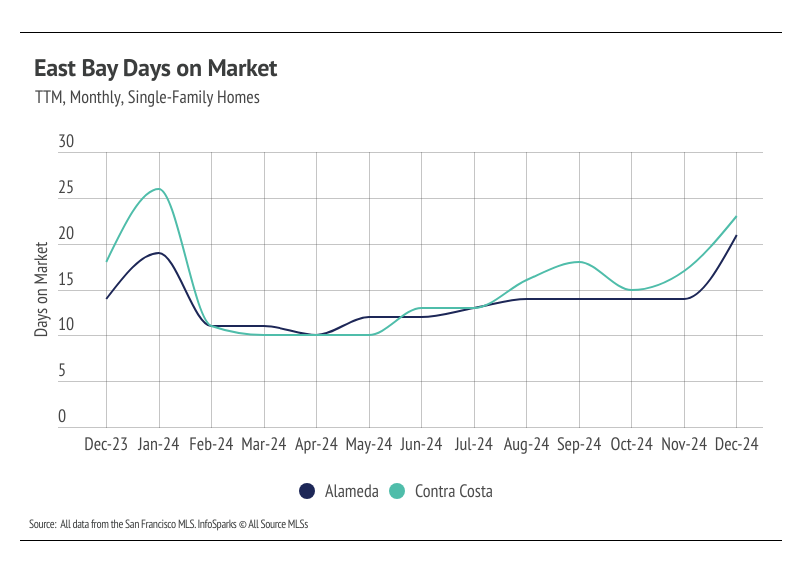
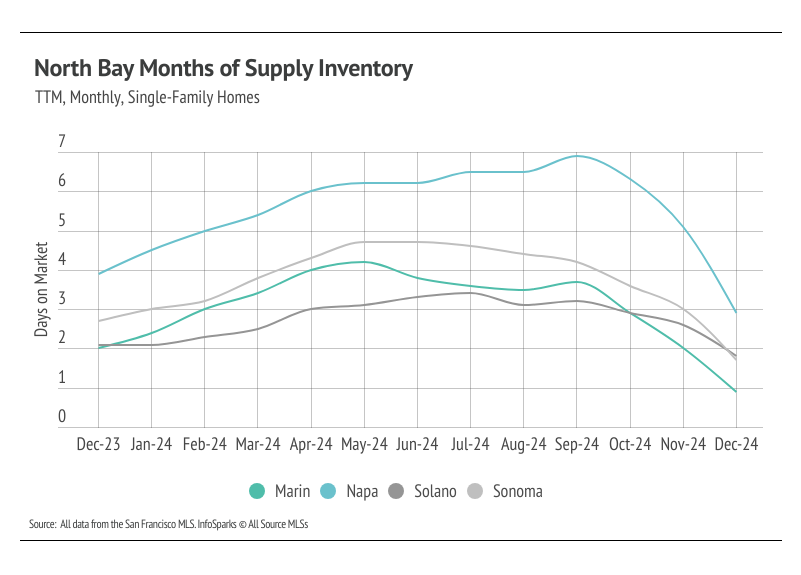
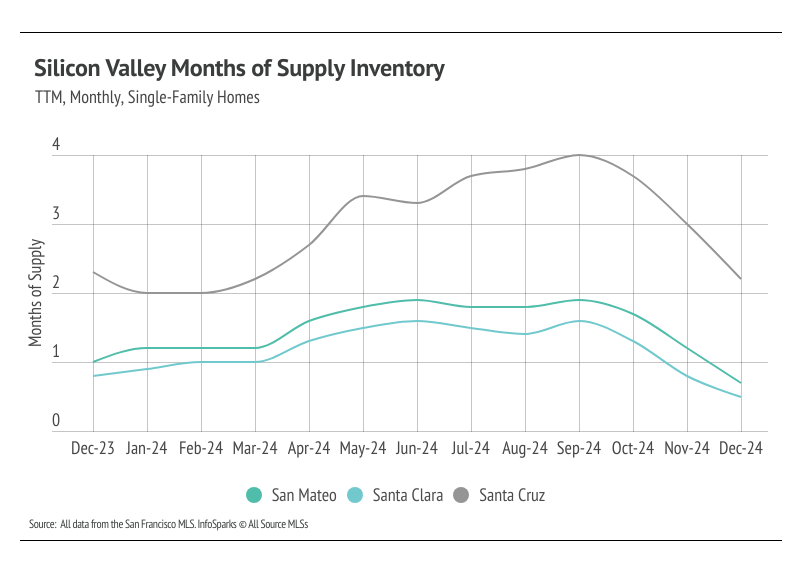
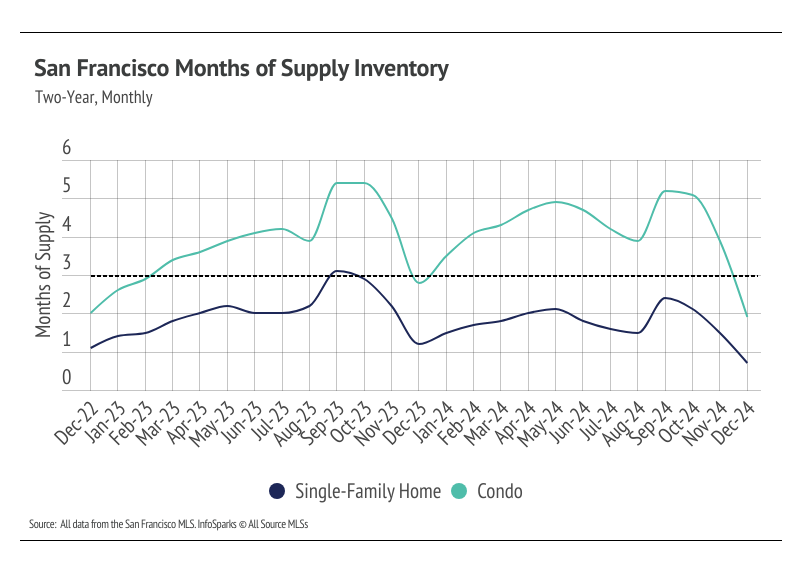
Months of Supply Inventory indicate a sellers’ market in most of the Bay Area
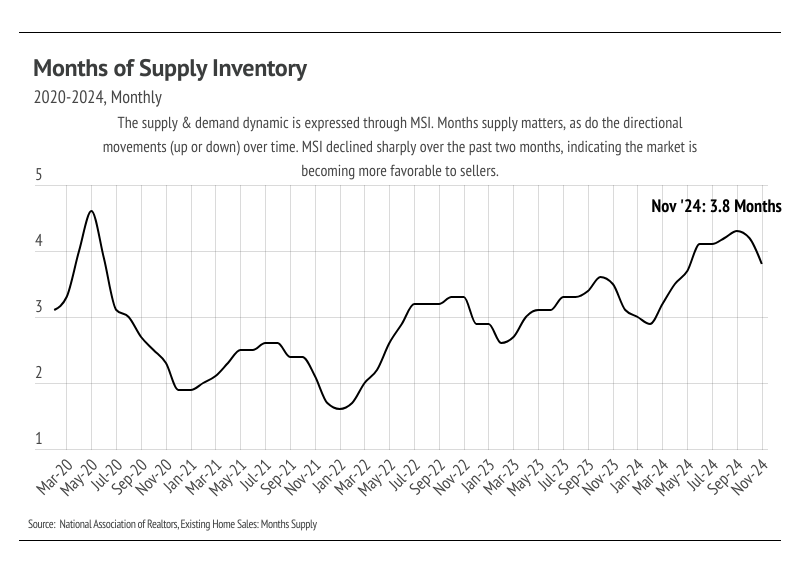
Months of Supply Inventory (MSI) quantifies the supply/demand relationship by measuring how many months it would take for all current homes listed on the market to sell at the current rate of sales. The long-term average MSI is around three months in California, which indicates a balanced market. An MSI lower than three indicates that there are more buyers than sellers on the market (meaning it’s a sellers’ market), while a higher MSI indicates there are more sellers than buyers (meaning it’s a buyers’ market). The Bay Area markets tend to favor sellers, which is reflected in their low MSIs. Currently, MSI is below three months of supply (a sellers’ market) in every Bay Area county except for single-family homes in Napa, which favor buyers.