If you prefer to bypass The Big Story and jump straight to the Local Market Report, click here.
The Big Story
Quick Take:
- Mortgage rates have ticked back up to roughly the same levels, as they were at prior to the Fed issuing its first rate cut in September.
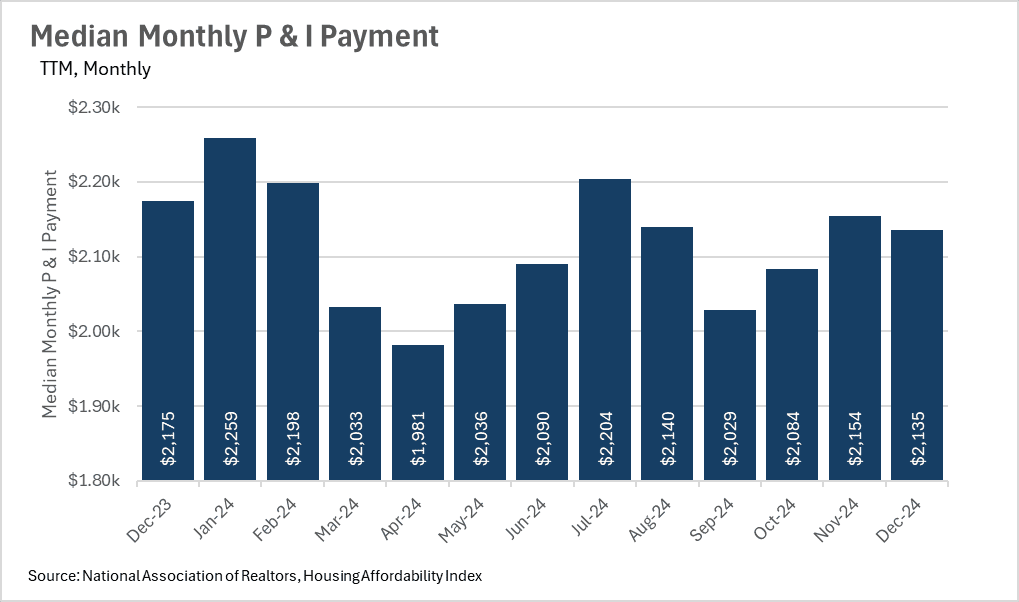
- Although housing affordability remains a concern, things have gotten slightly better year-over-year, with median monthly P&I payment decreasing by 1.84%.
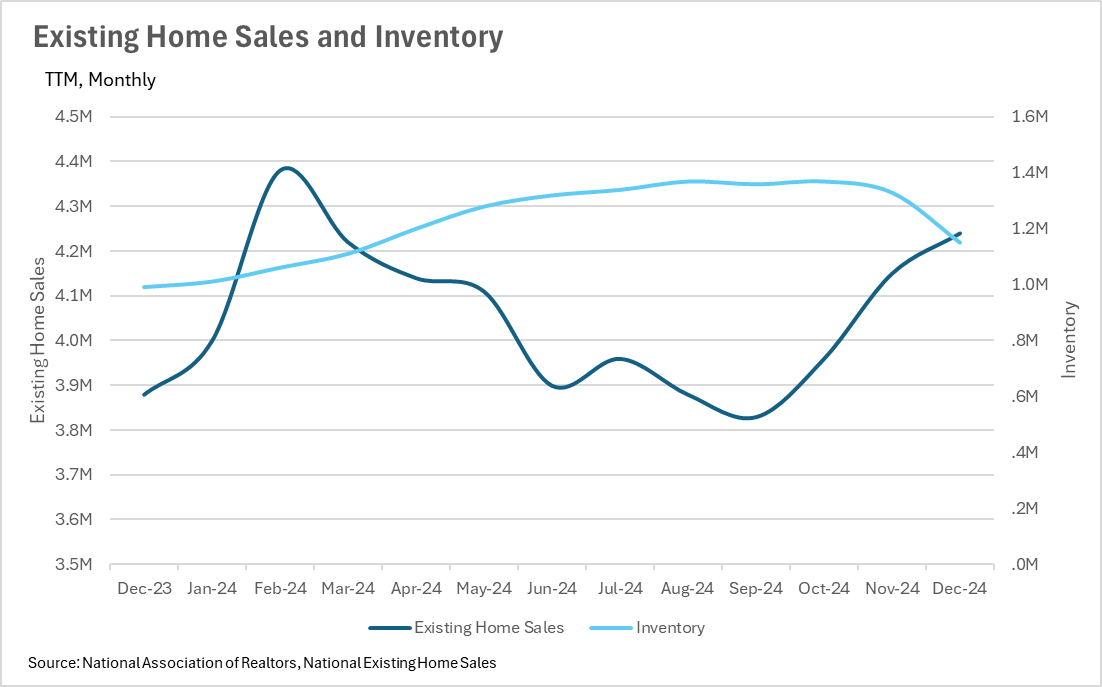
- Year-over-year growth in inventory is outpacing existing home sales by roughly 7%, meaning we could see affordability begin to increase over the coming months.
Note: You can find the charts & graphs for the Big Story at the end of the following section.
*National Association of REALTORS® data is released two months behind, so we estimate the most recent month's data when possible and appropriate.
Mortgage rates have returned to pre-rate cut levels
One very interesting phenomenon that we’ve seen play out over the past few months is that interest rates have largely returned to the levels that we saw prior to the Fed’s first rate cut in September. Unfortunately this is not what the market at large was expecting to see, since mortgage rates typically move in tandem with the Federal Funds rate. However, this suggests that the lending market expects the rate cuts that we have seen recently to be short lived, meaning that the lending market is expecting the Fed to begin increasing rates again within the coming years. This could be due to a variety of reasons, but inflation is the most likely culprit for rate hikes, as it has remained rather stubborn since it first became an issue in 2022.
Inventory is finally starting to build throughout the US
As we all know, inventory levels have been an issue Post-COVID, across the entire country, with many areas not having nearly enough inventory to support buying demand. This, in turn, helped to push up the values of homes nationwide.
It’s important to note though, that we’re beginning to see inventory growth outstrip existing home sale growth, as in December, inventory grew by 16.16% on a year-over-year basis, whereas existing home sales grew by 9.28% year-over-year.
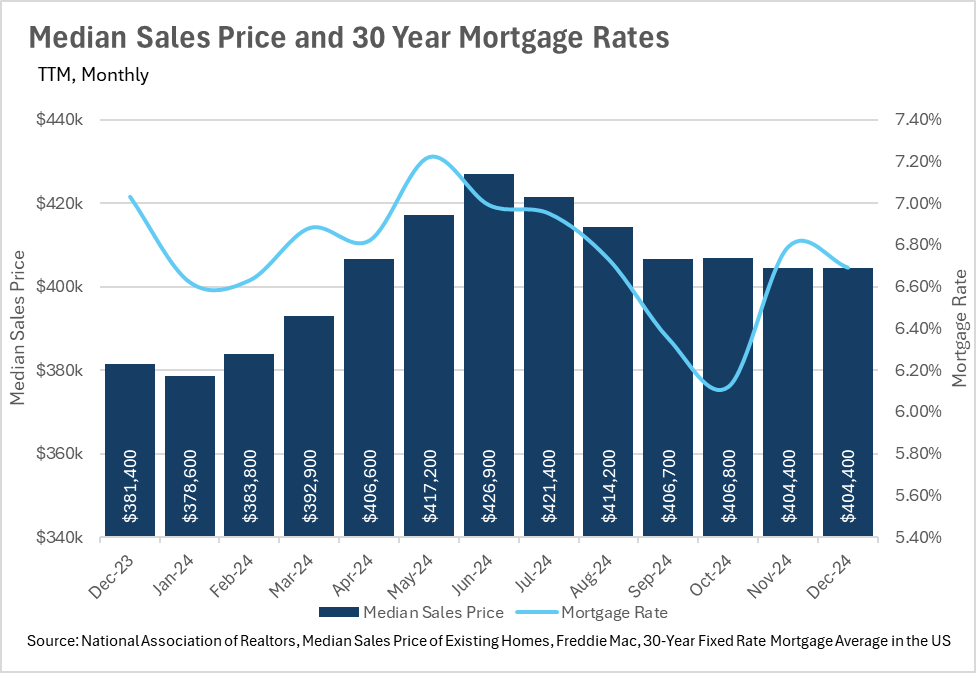
Median sale prices continue to rise, despite interest rate headwinds
Many buyers still have the mortgage rates that they saw in 2021 and 2022 at the top of their mind, making it difficult for them to justify locking in a mortgage in the 6%-7% ranges that we’ve been seeing over the past couple of years. Despite many buyers sitting on the sidelines, and waiting for lower rates, we’re still seeing the median sale price of homes increase.
In both the months of November and December, the median sale price of a home in the United States was $404,400. This represents an increase in value of 6.03%, when compared to the December 2023 median sale price of $381,400. This is slightly concerning, given that the growth in median sales price continues to outstrip the growth in inflation, with December’s year-over-year CPI figures coming in at 2.9%.
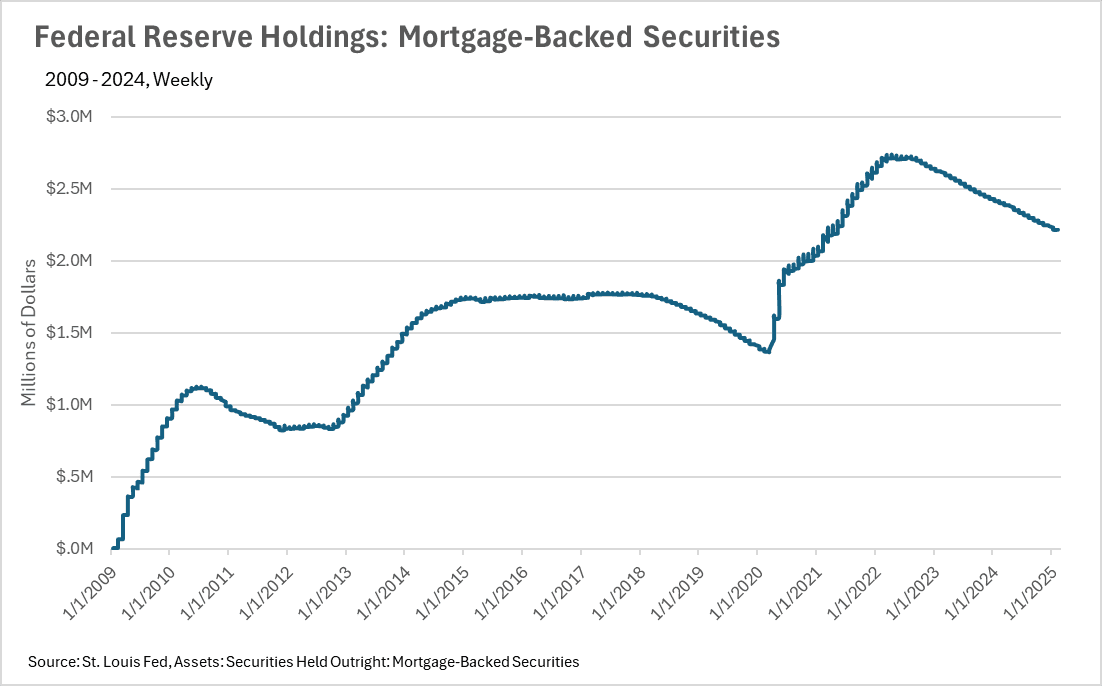
The Fed continues to unwind its mortgage backed securities
As many of us know, in addition to the Federal Funds Rate, the Fed also has control over its own balance sheet. Throughout the COVID crisis, the Fed ramped up its purchase of mortgage backed securities at a rate we haven’t seen since the Great Financial Crisis. However, the Fed has since been unwinding its holdings of MBS’s at a steady rate, since late 2022, which it continues to this day.
How does all of this affect my local market
Although it’s great to know what’s happening at a national level, real estate is an incredibly localized industry. There are areas throughout the country that are doing considerably better or worse than the nation at large. To ensure you’re informed on the happenings at both a national level and a local level, we’ve included our local lowdown below. In our local lowdown, you’ll find the in-depth coverage you need to stay in tune with your area. As always, we’ll be monitoring the housing market and the economy from both a macro and micro level, and report back to ensure you’ve got the data you need to make the best decisions possible!
Big Story Data
The Local Lowdown
Quick Take:
- The Bay Area market remains incredibly strong overall, despite some fluctuations across different regions.
- Inventory trends are diverging, with some areas experiencing increasing supply while others continue to struggle with low active listings.
- Market conditions heavily favor sellers in most counties, but select condo markets are seeing opportunities for buyers.
- Pricing remains relatively resilient, though some regions have seen slight declines as interest rates influence affordability.
Note: You can find the charts/graphs for the Local Lowdown at the end of this section.
Resilience in the Bay Area Housing Market
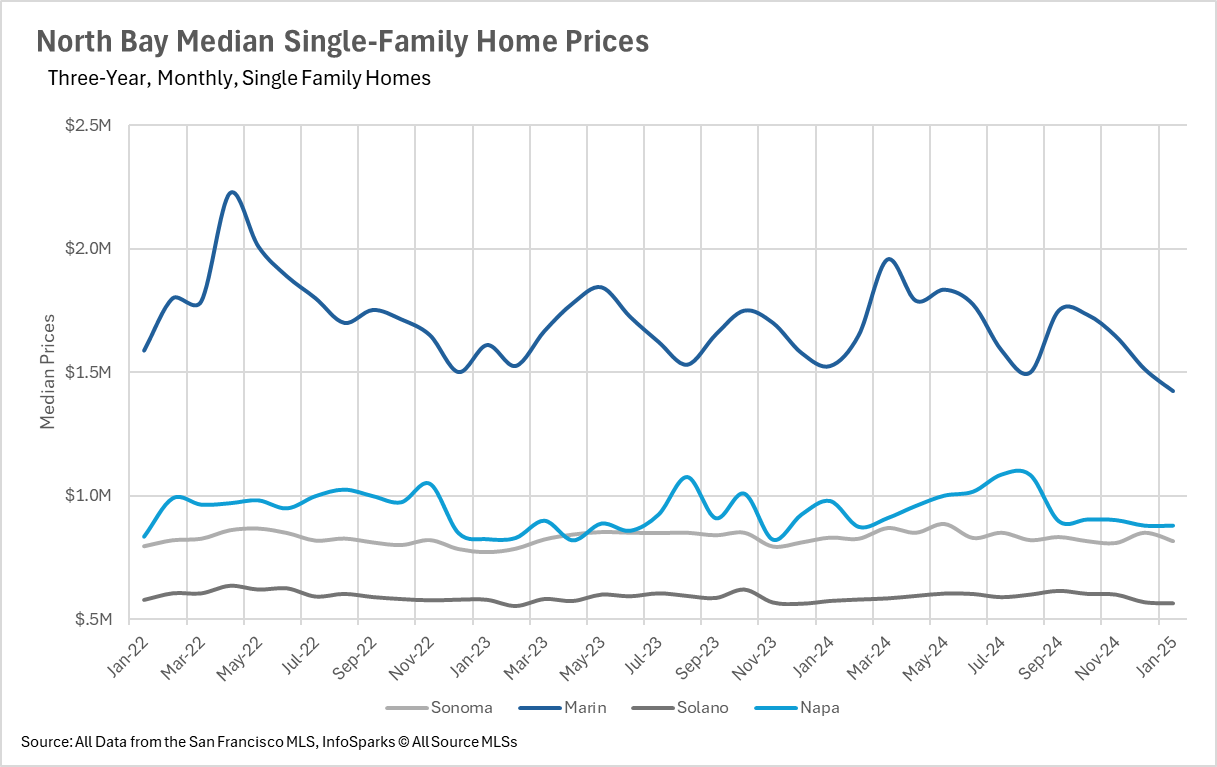
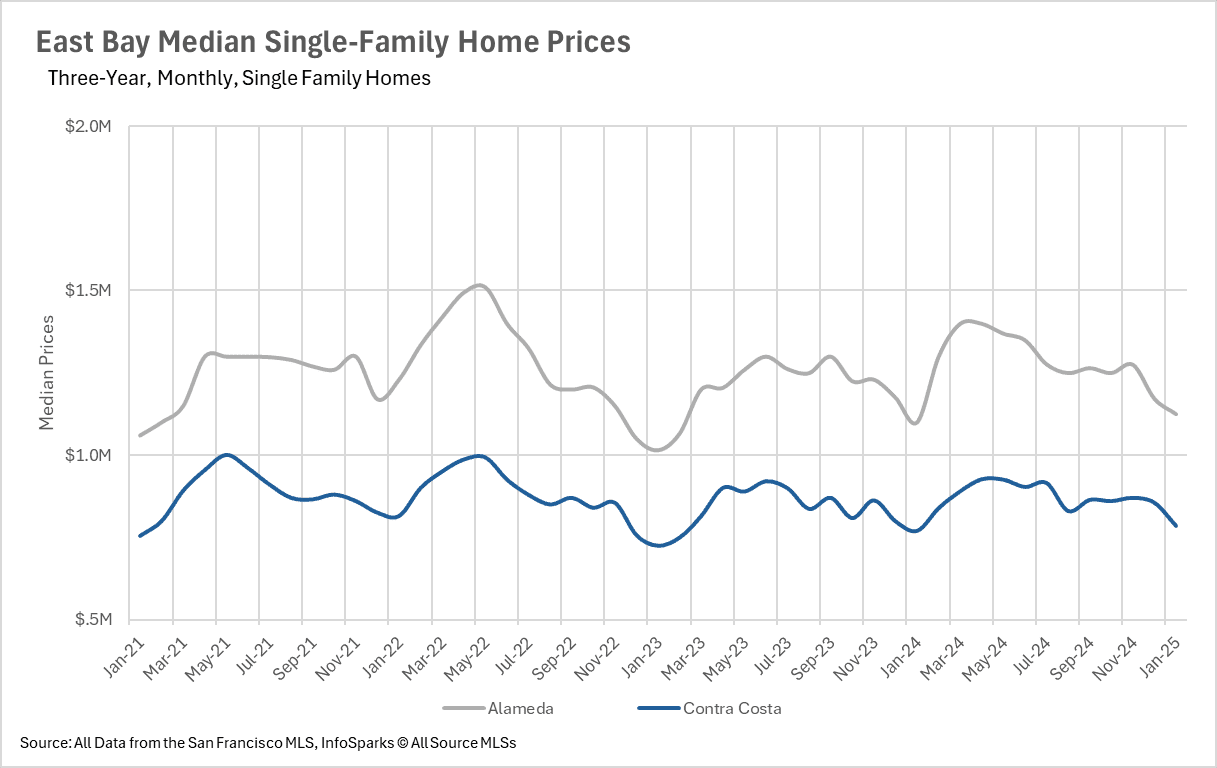
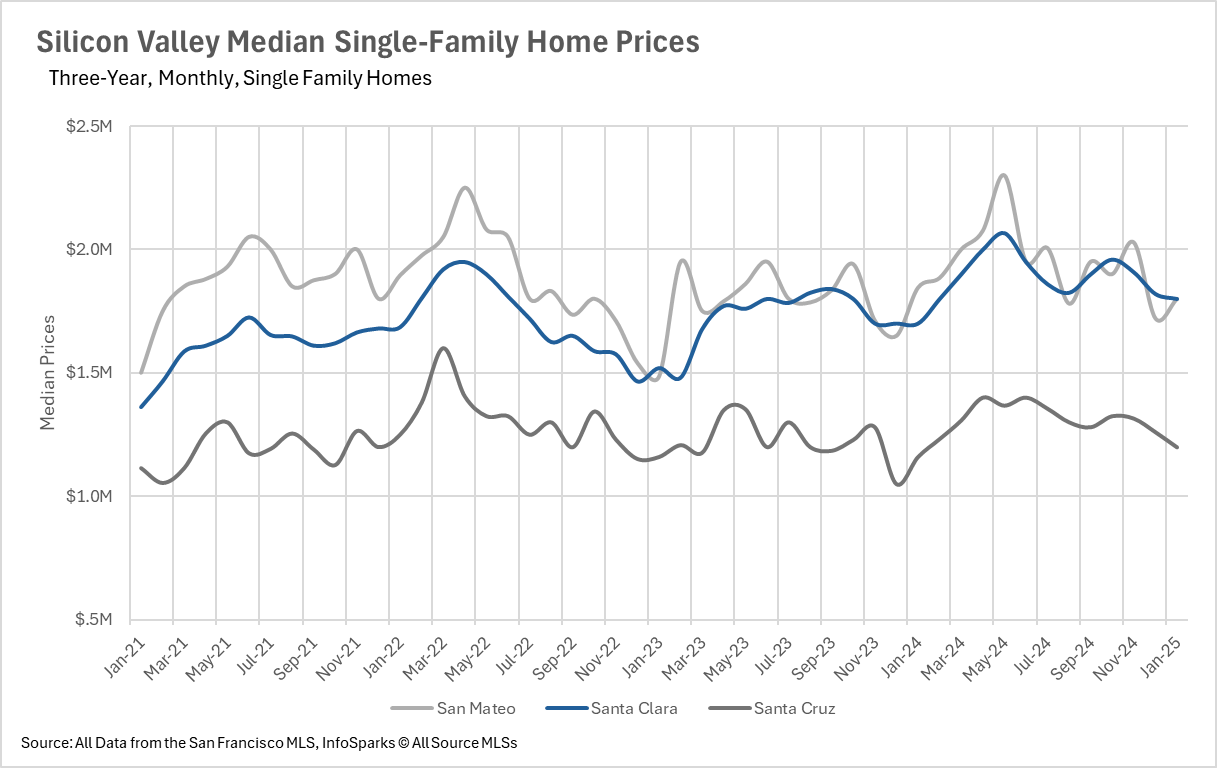
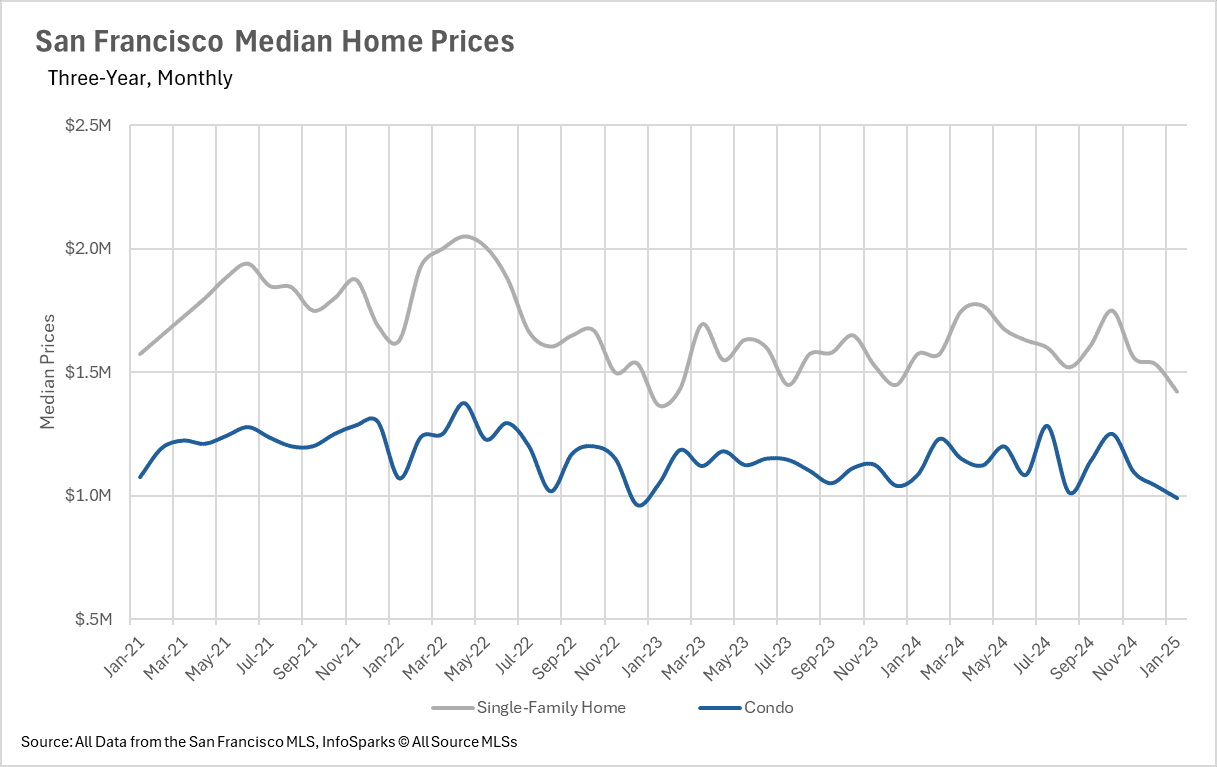
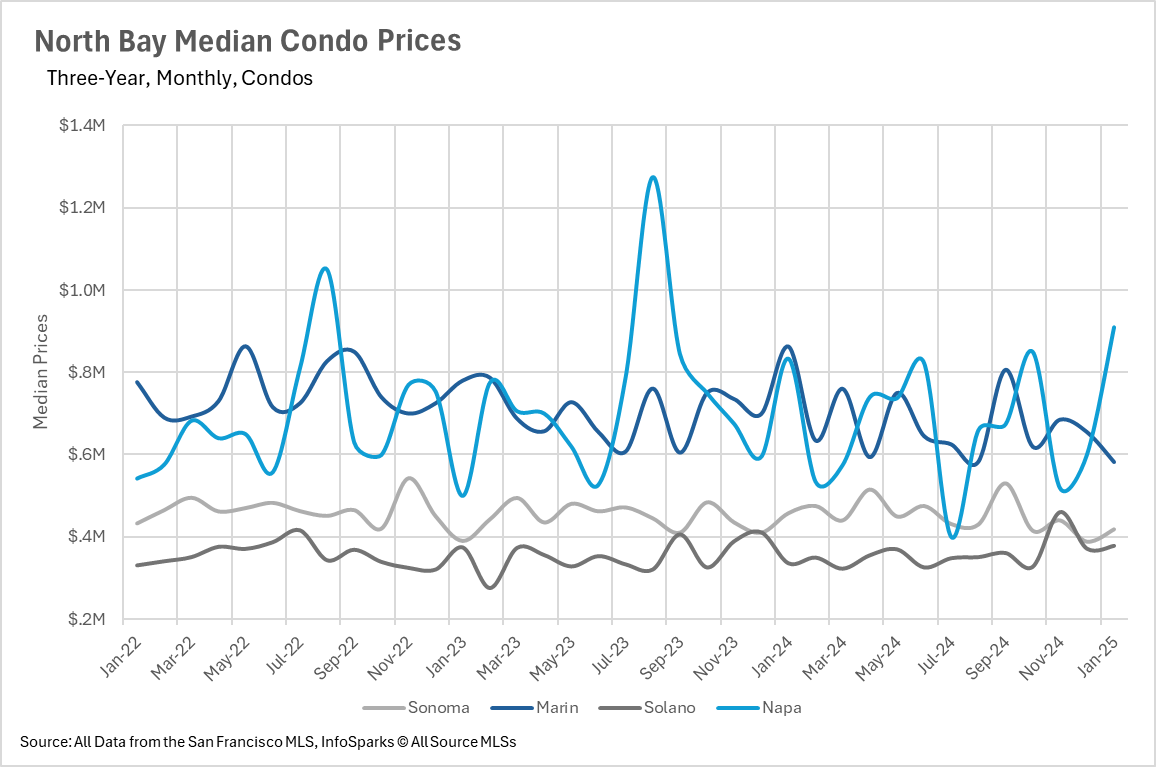
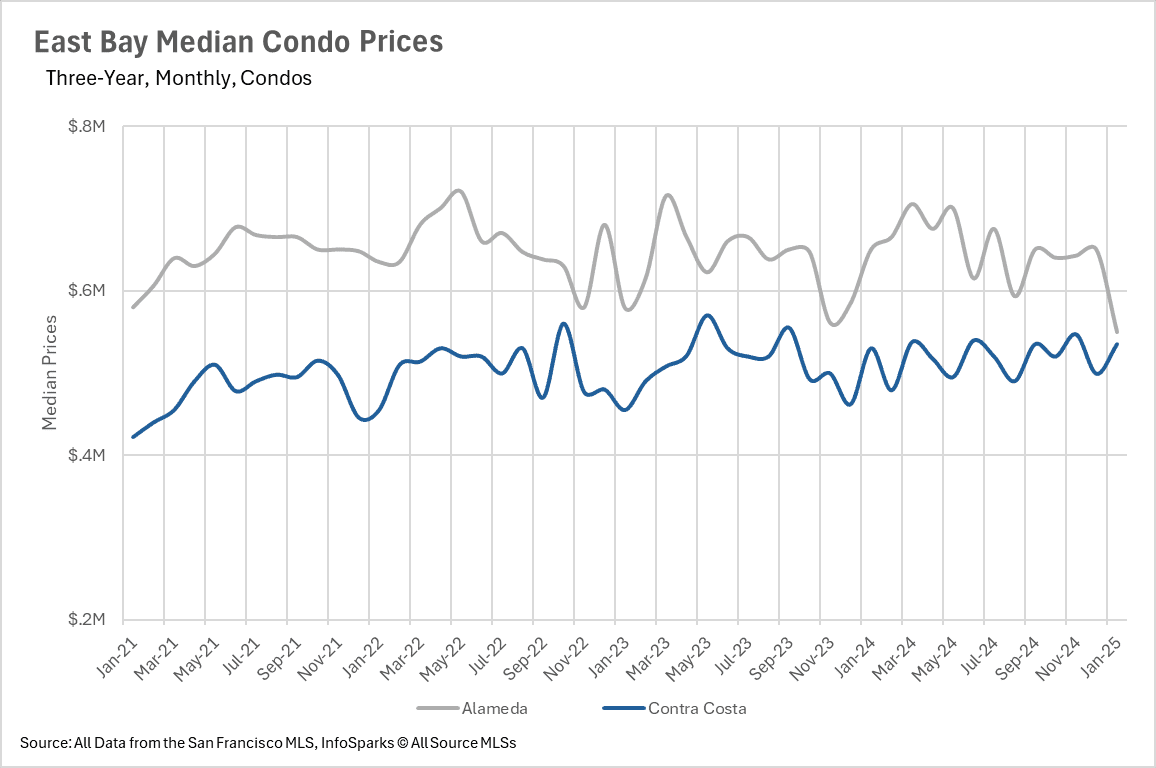
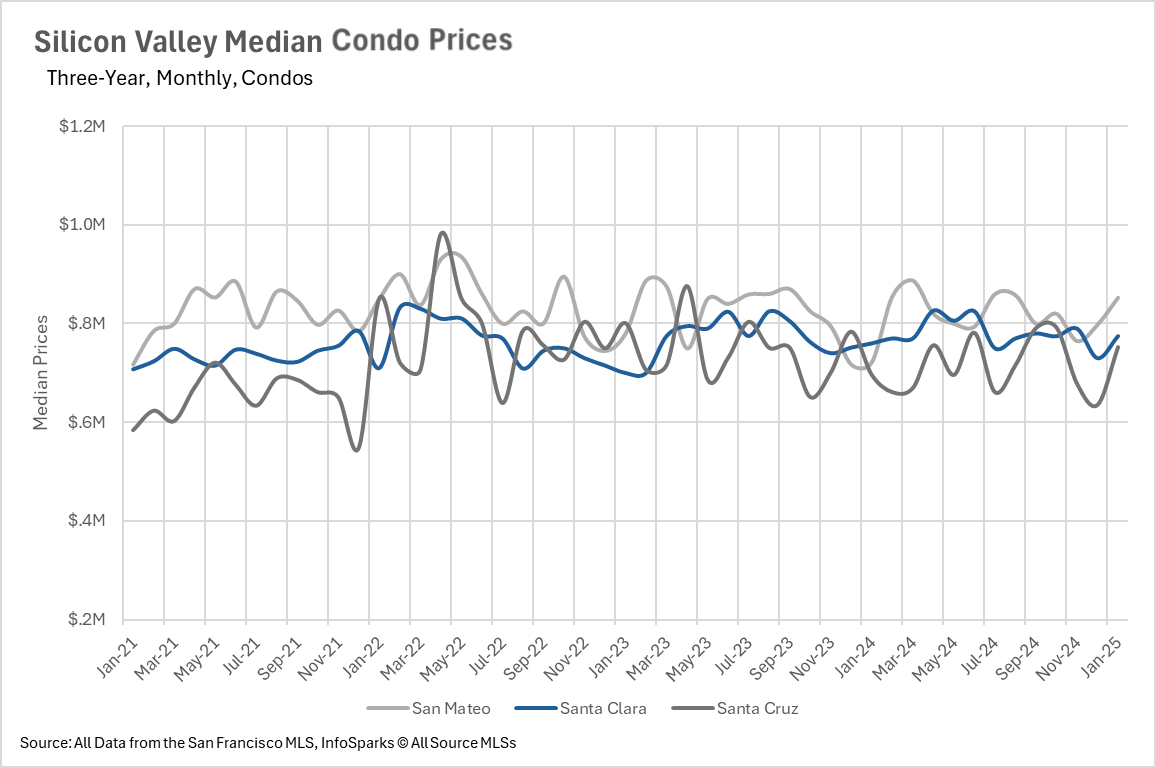
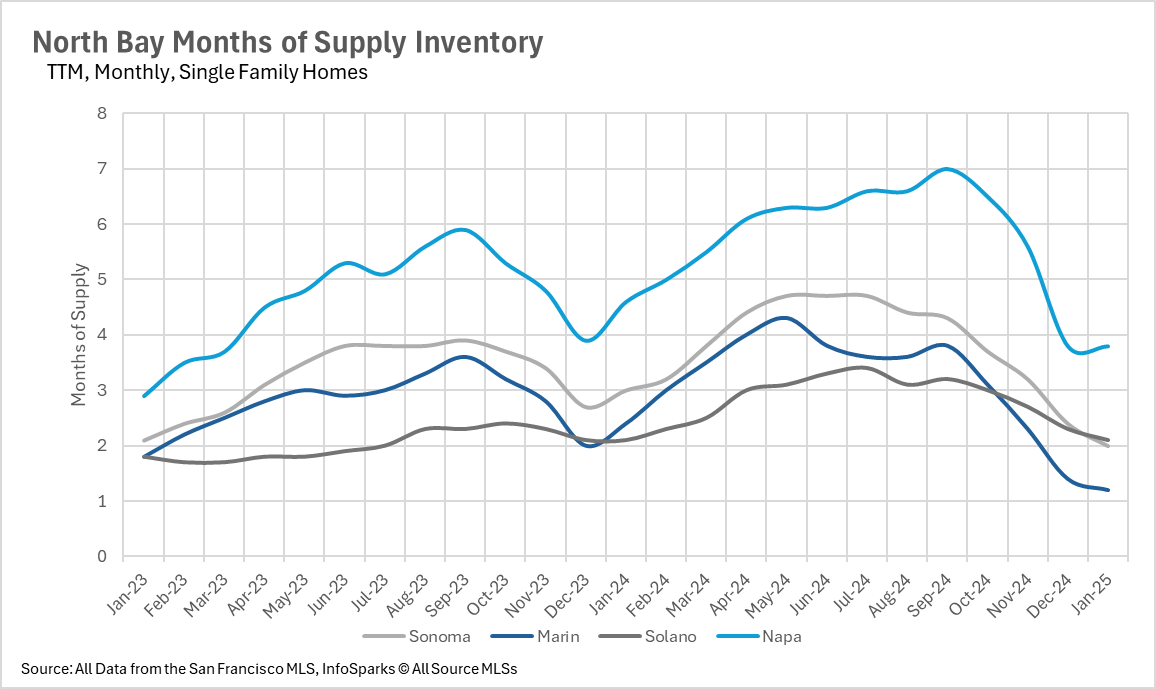
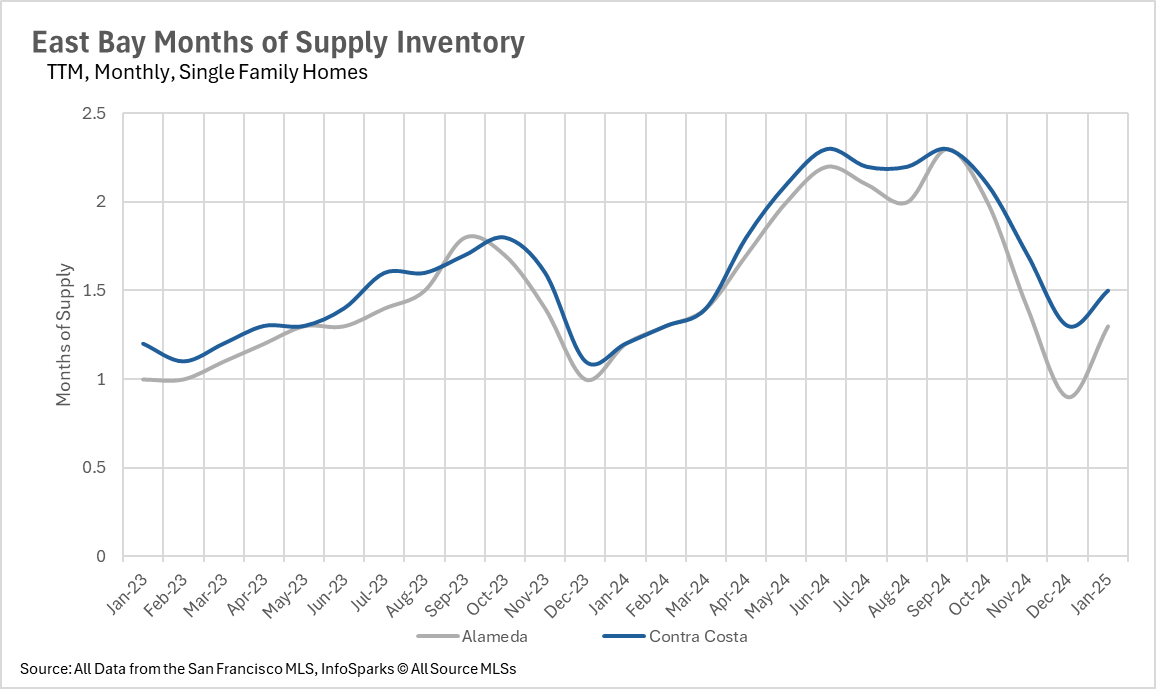
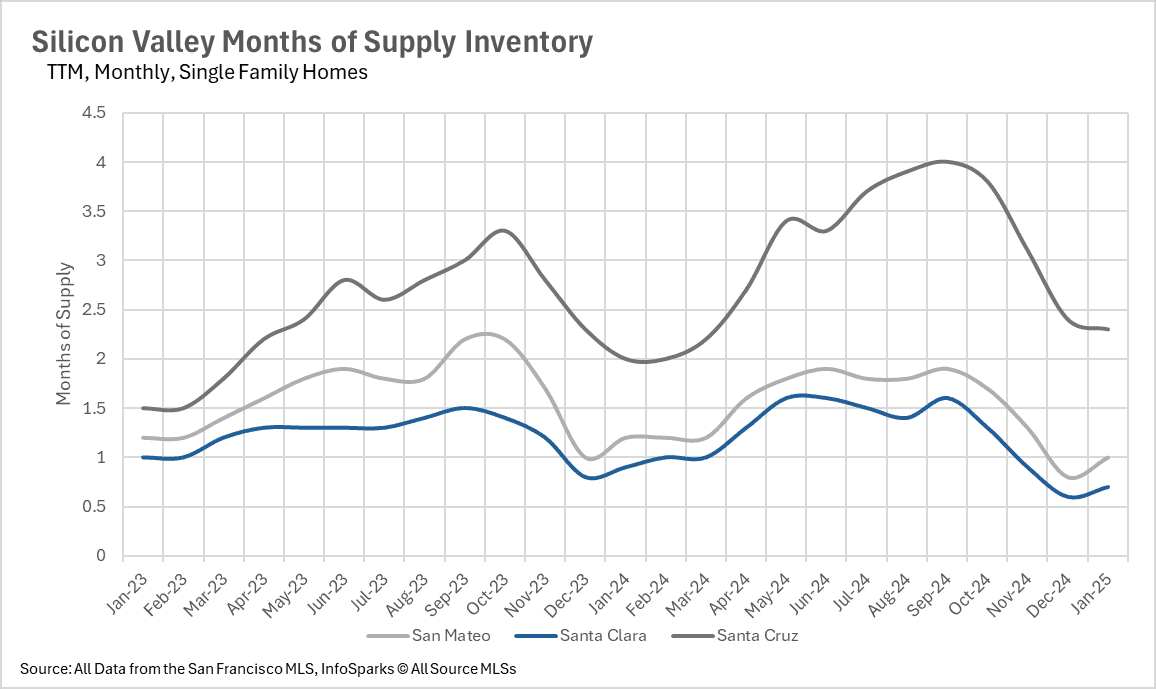
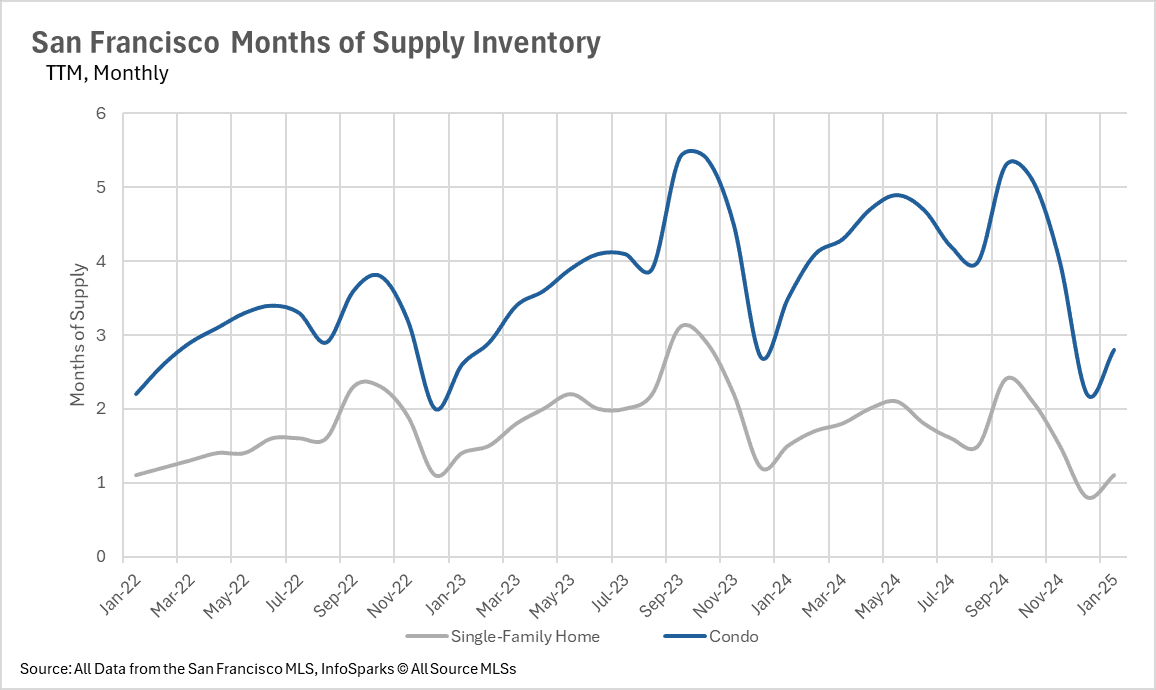
Despite economic uncertainty and fluctuating interest rates, the Bay Area housing market remains strong. While some regions saw modest price declines, others, like Alameda and Contra Costa, experienced year-over-year increases of 2.27% and 1.95%, respectively, in median single-family home prices. Silicon Valley continued its growth trajectory, with Santa Clara and Santa Cruz Counties posting 5.88% and 3.36% increases, respectively, while San Mateo saw a slight 2.44% dip. Meanwhile, San Francisco experienced declines, with single-family home prices dropping 9.68% to a median of $1,422,500 and condos falling 8.76% to $990,000. The North Bay showed stability, though Marin and Napa Counties gave back some of last year’s gains, with median price declines of 6.69% and 10.20%.
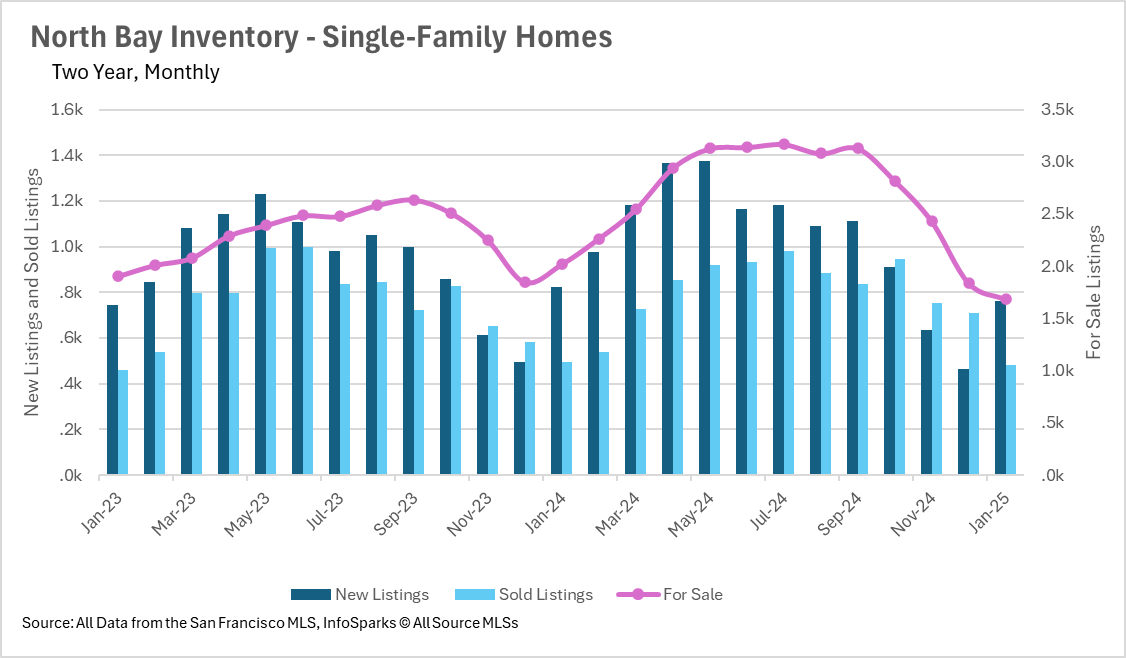
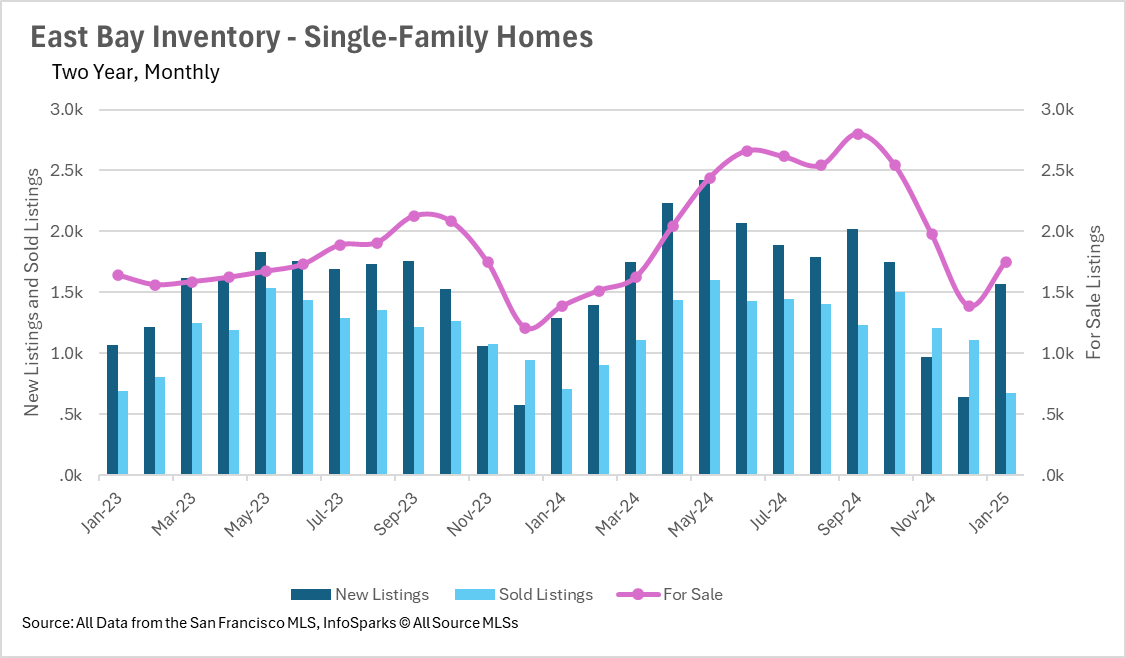
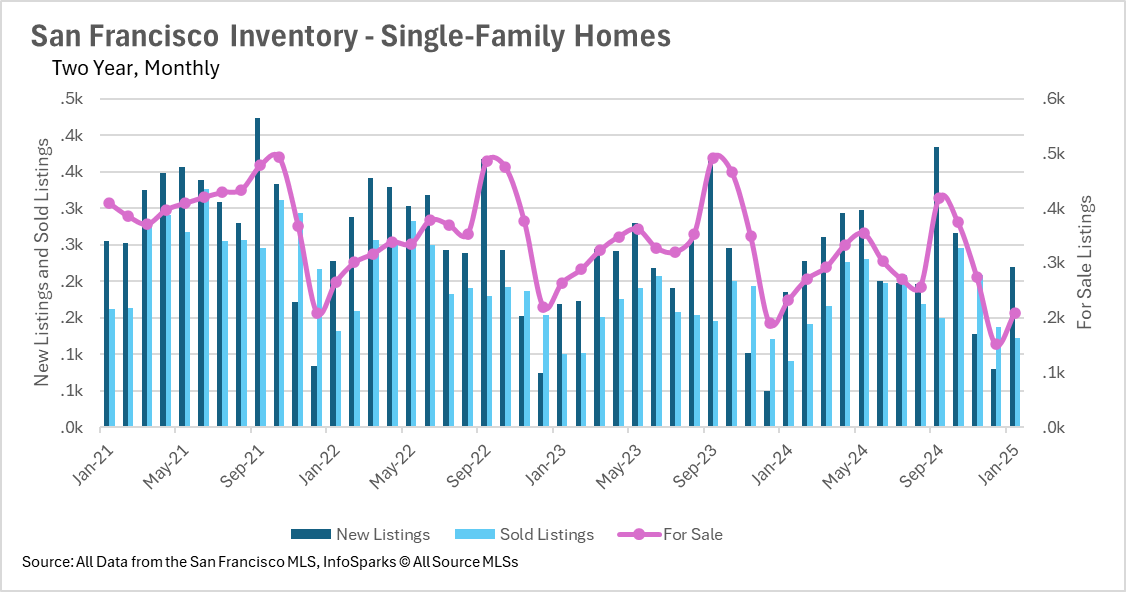
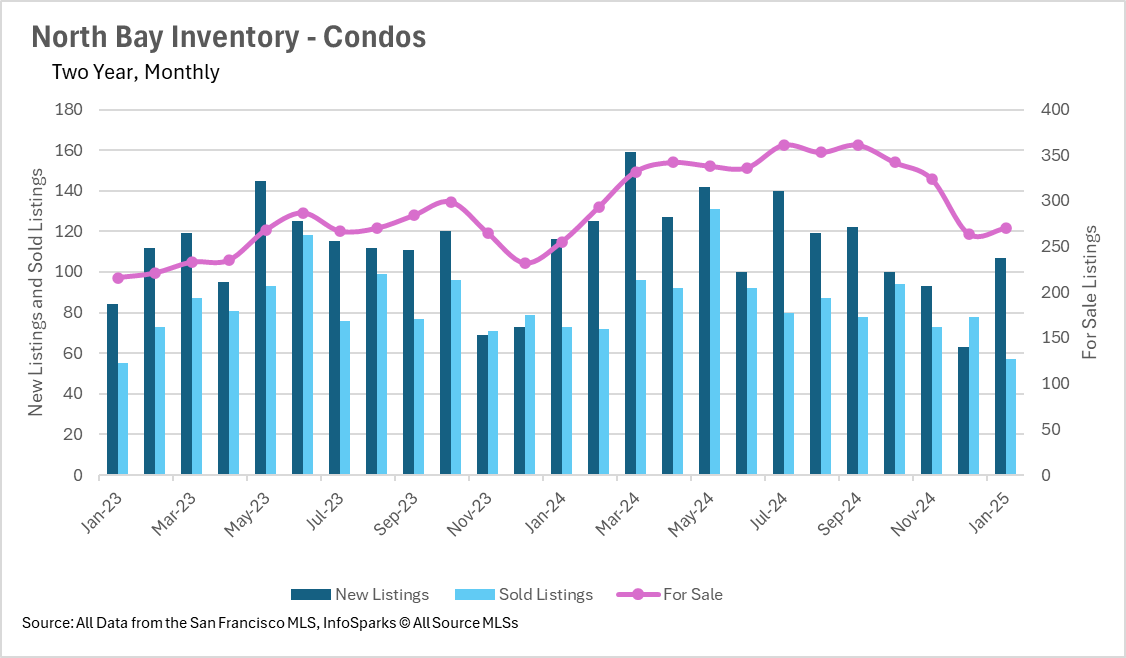
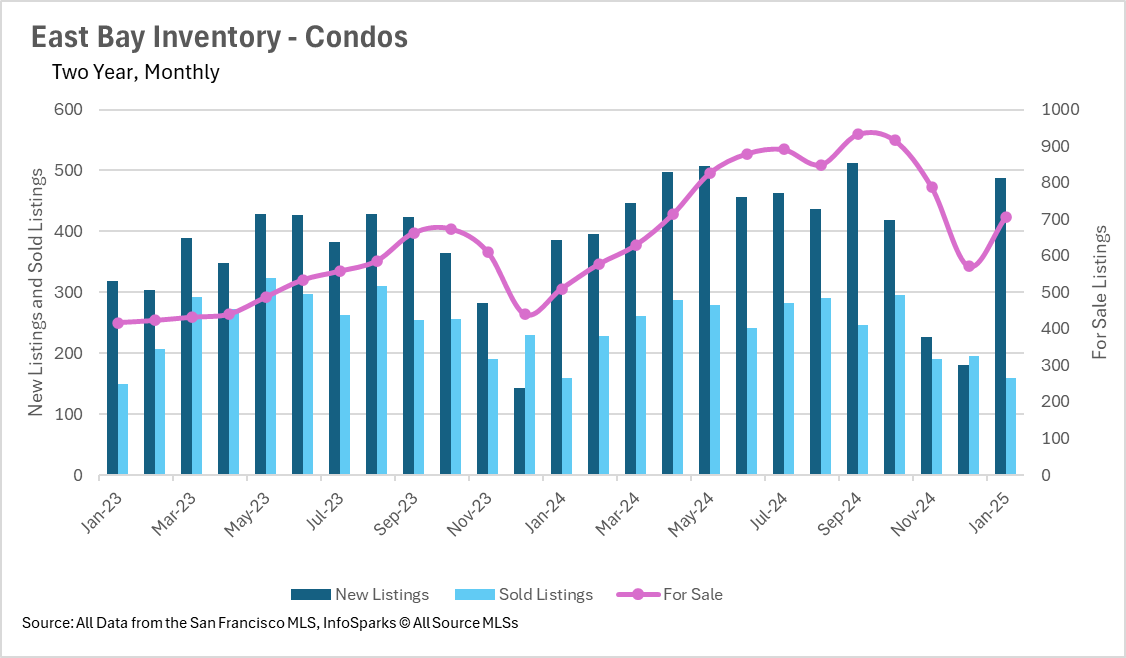
Inventory Trends Are Mixed Across the Bay
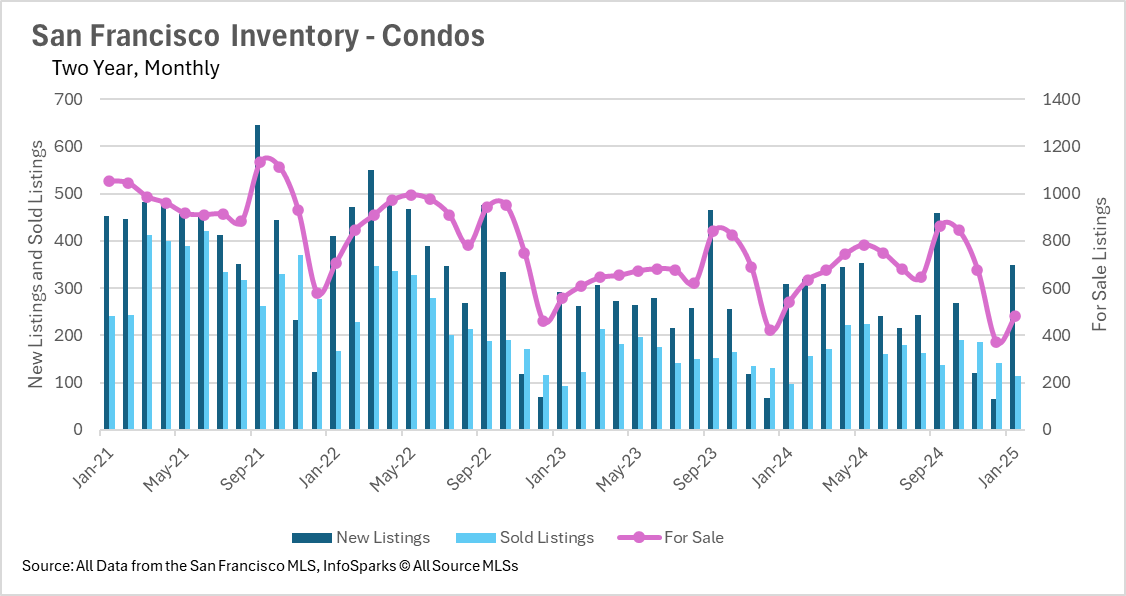
Inventory levels are diverging across regions. The East Bay saw a 21.59% increase in new single-family home listings and a 26.39% rise in active listings, while Contra Costa condo listings increased by 26.42% and active inventory surged 38.24%. In contrast, the North Bay faced a 16.55% drop in active single-family home listings, contributing to a tighter market. San Francisco remains constrained, with a 10.34% decline in single-family home inventory and a 10.91% drop in active condo listings. Silicon Valley’s condo market is an outlier, seeing a 36.62% rise in active listings and a 45.2% jump in new condo listings, signaling possible buying opportunities.
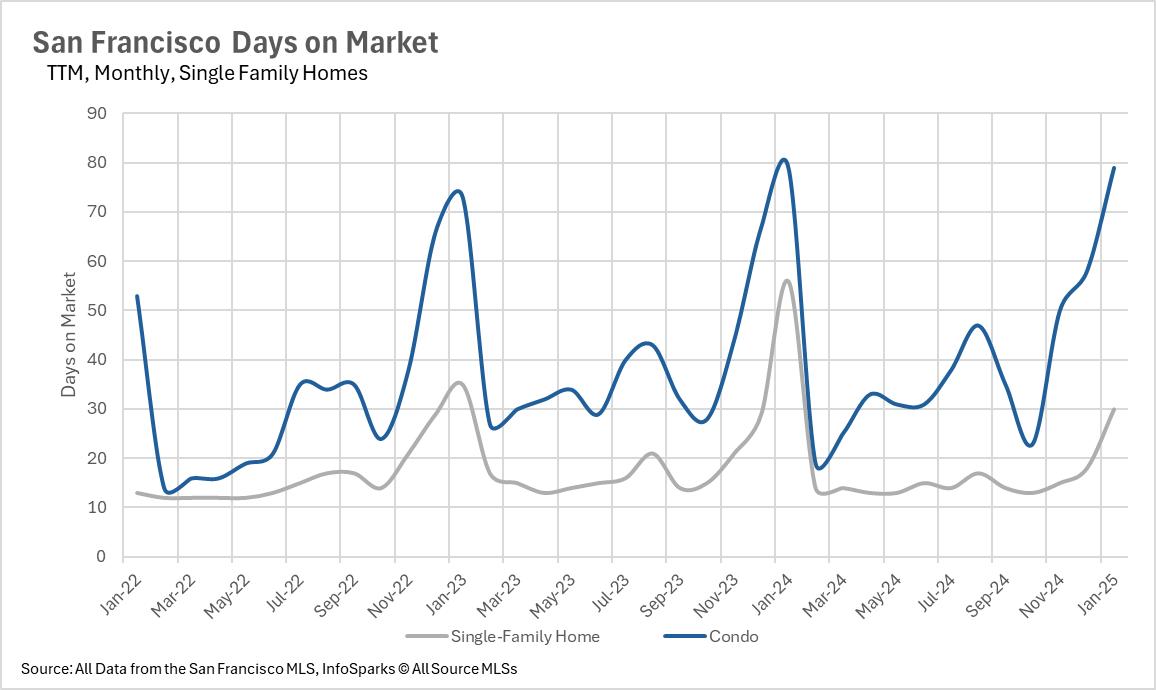
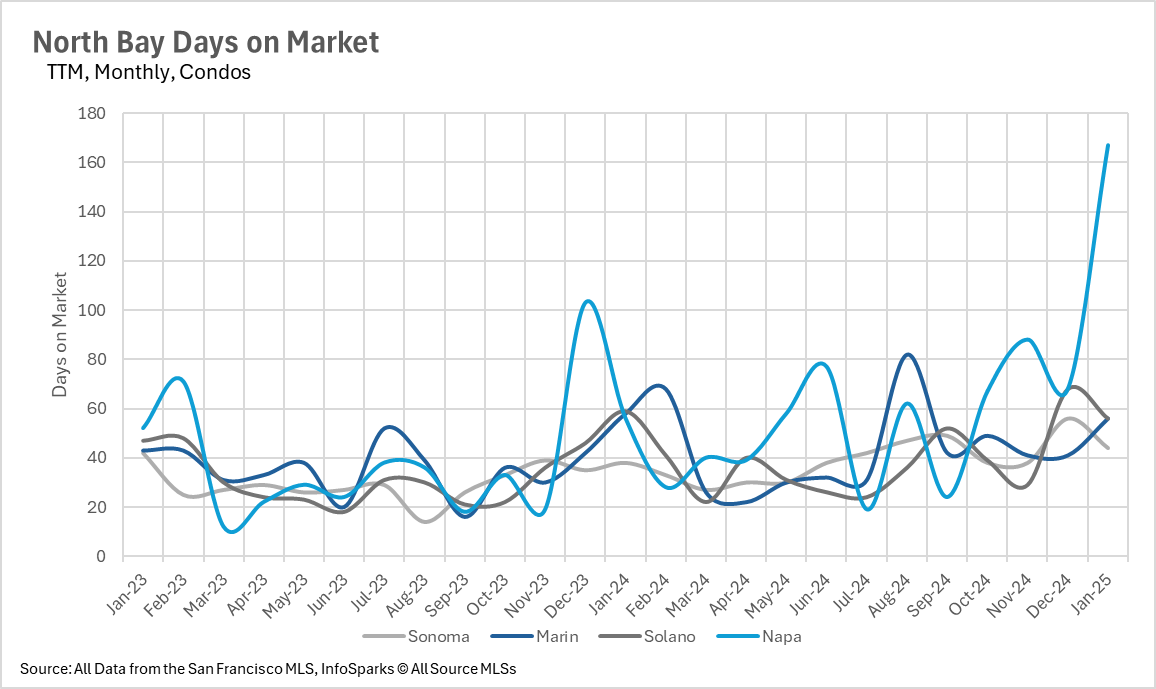
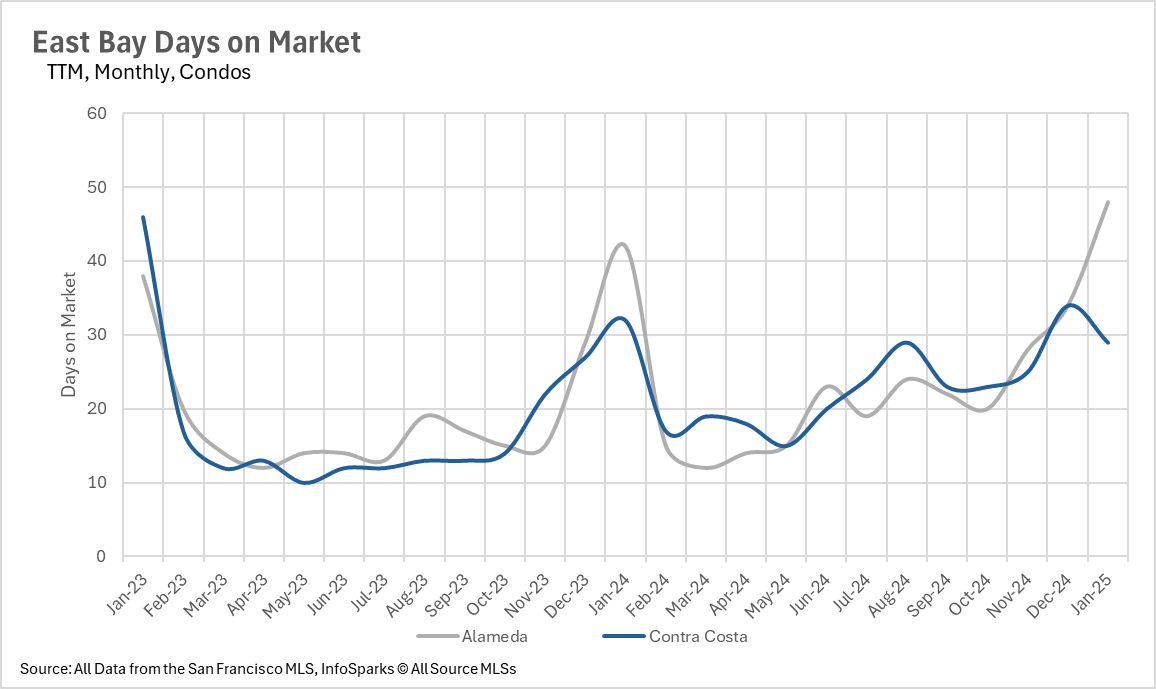
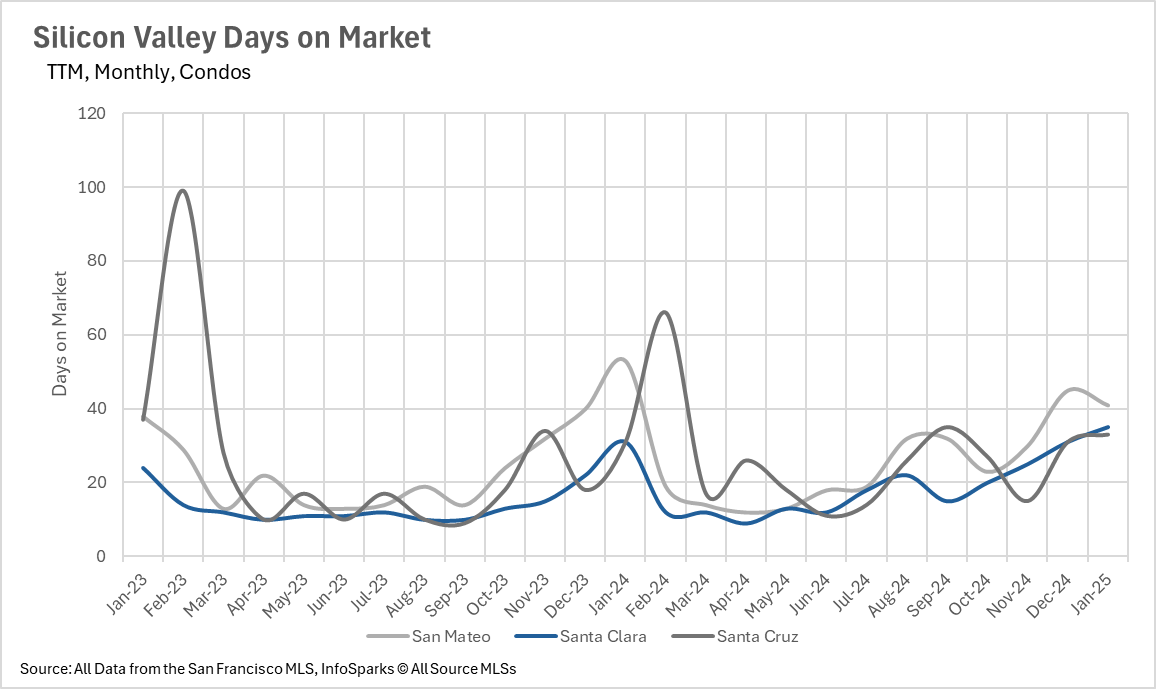
Days on Market & Buyer/Seller Power Balance
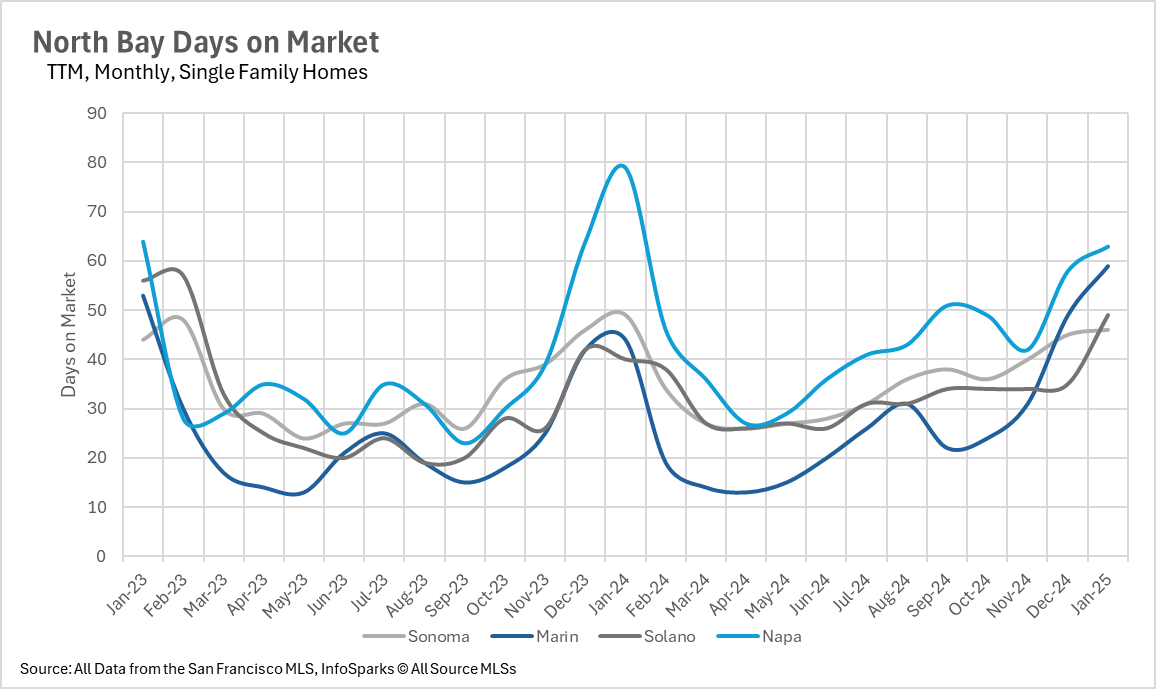
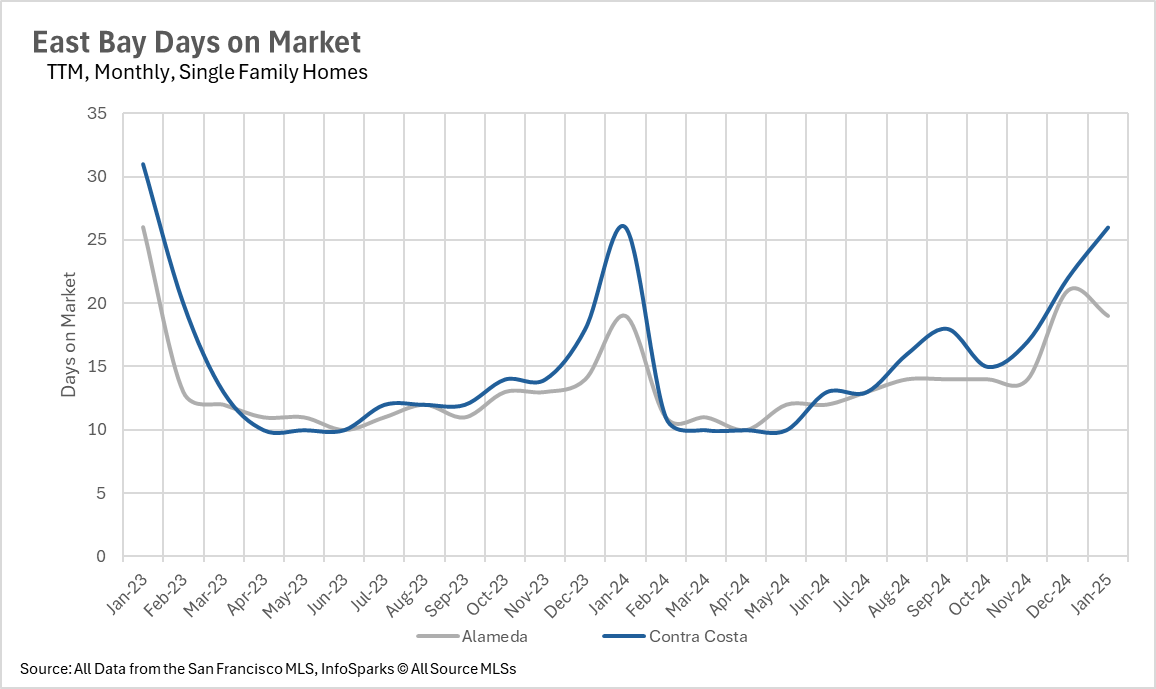
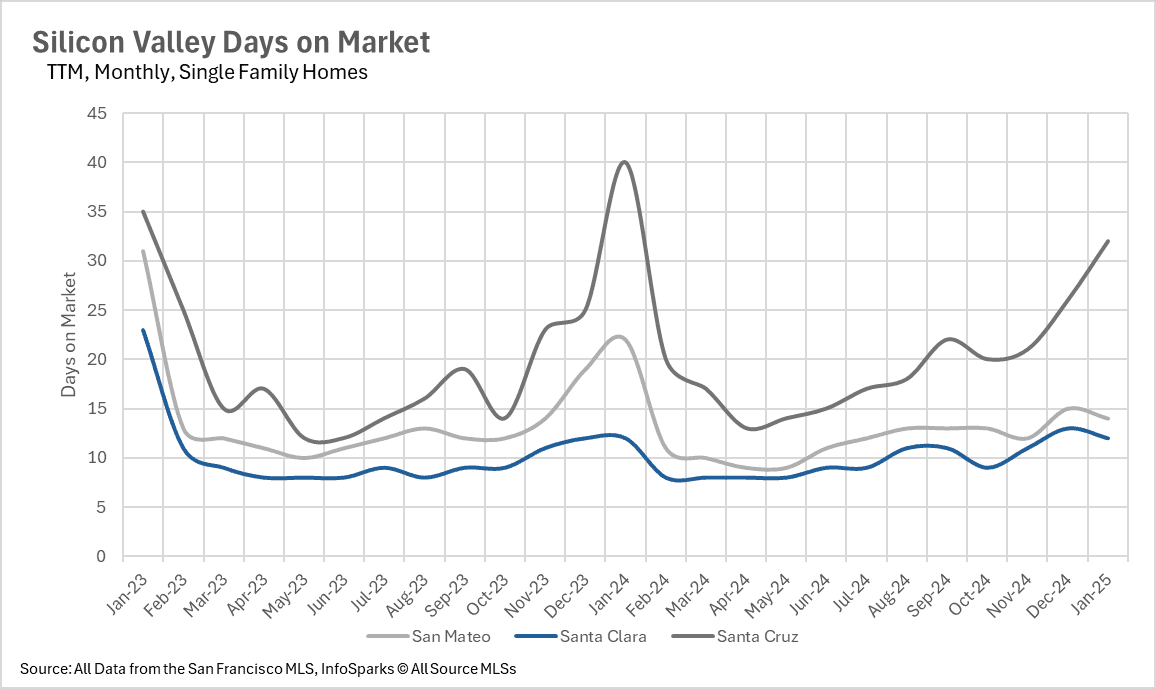
Homes are staying on the market longer in some regions while others continue to move quickly. Contra Costa single-family homes are sitting 26% longer than those in Alameda, while Alameda condos are lingering 65% longer than Contra Costa condos. In Marin, single-family homes are taking 34% longer to sell, and Napa condos saw a 198% spike in days on market. Meanwhile, Silicon Valley’s single-family home market remains highly competitive, with listings spending just 12 to 32 days on the market, while condos are taking 12.9% and 6.45% longer to sell in Santa Clara and Santa Cruz.
The Bay Area Remains a Sellers’ Market (With a Few Buyer-Friendly Spots)
Most of the Bay Area continues to favor sellers, with low months of supply inventory. East Bay single-family homes remain in strong seller territory, with 1.3 and 1.5 months of inventory in Alameda and Contra Costa Counties, respectively, while condos hover near balance. Napa is a buyer’s market with 3.8 months of supply, while Sonoma (2.0), Marin (1.2), and Solano (2.1) remain seller-dominated. San Francisco also leans heavily in favor of sellers, with only 1.1 months of single-family home inventory and 2.8 months for condos. In Silicon Valley, single-family homes are firmly in a sellers’ market, with as little as 0.7 months of inventory in Santa Clara, while Santa Cruz condos, with 3.7 months of supply, favor buyers.
Looking Ahead
With demand staying strong and inventory constrained in many areas, competition is likely to persist. However, growing condo inventory in some markets may provide rare buying opportunities, particularly in Napa and Santa Cruz. As the spring season approaches, inventory trends and interest rate changes will shape the market’s next phase, making it crucial for buyers and sellers to stay informed.