Updated October 19, 2026. Data through September 30, 2026.
Are South of Market condo prices recovering?
Yes, modestly, and supply has tightened into a seller's market. In the 12 months through September 2026, the median South of Market (SoMa) condo sold for $793 per square foot, up about 7% from $743 the year before. At the end of September, 34 condos were on the market, down from 71 a year earlier, and months of supply fell from 8.5 to 2.8.
Here's what we're seeing: listings have thinned out faster than sales, but buyers still have room to negotiate. The typical condo sold at its list price, not above it, and SoMa prices remain below where they were a decade ago. This update uses San Francisco Association of REALTORS (SFAR) MLS condo sales in South of Market through September 30, 2026.
What do the latest South of Market condo numbers show?
More condos sold, with slightly less negotiation, at a higher price per square foot. For comparison with the wider city, see our San Francisco market update: the citywide condo median was $1.26 million in August 2026, with 1.6 months of supply and 19 days on market, so SoMa condos sell well below the citywide median and at a slower pace.
South of Market condos, trailing 12 months through September 2026, compared with the 12 months before. | ||
Measure | Now (Oct 2025 to Sep 2026) | A year ago (Oct 2024 to Sep 2025) |
|---|---|---|
Closed sales | 137 | 116 |
Median price per sq ft | $793 | $743 |
Median sale price | $795,000 | $734,500 |
Median days to contract | 35 | 40 |
Sold above asking | 27% (37 of 137) | 22% (26 of 116) |
Sales that needed a price cut | 24% (33 of 137) | 27% (31 of 116) |
Median sale-to-list price | 100% | 99% |
July through September 2026 versus the same months of 2025:
- Closed sales: 37, up from 25
- Sold above asking: 41% (15 of 37), up from 28% (7 of 25)
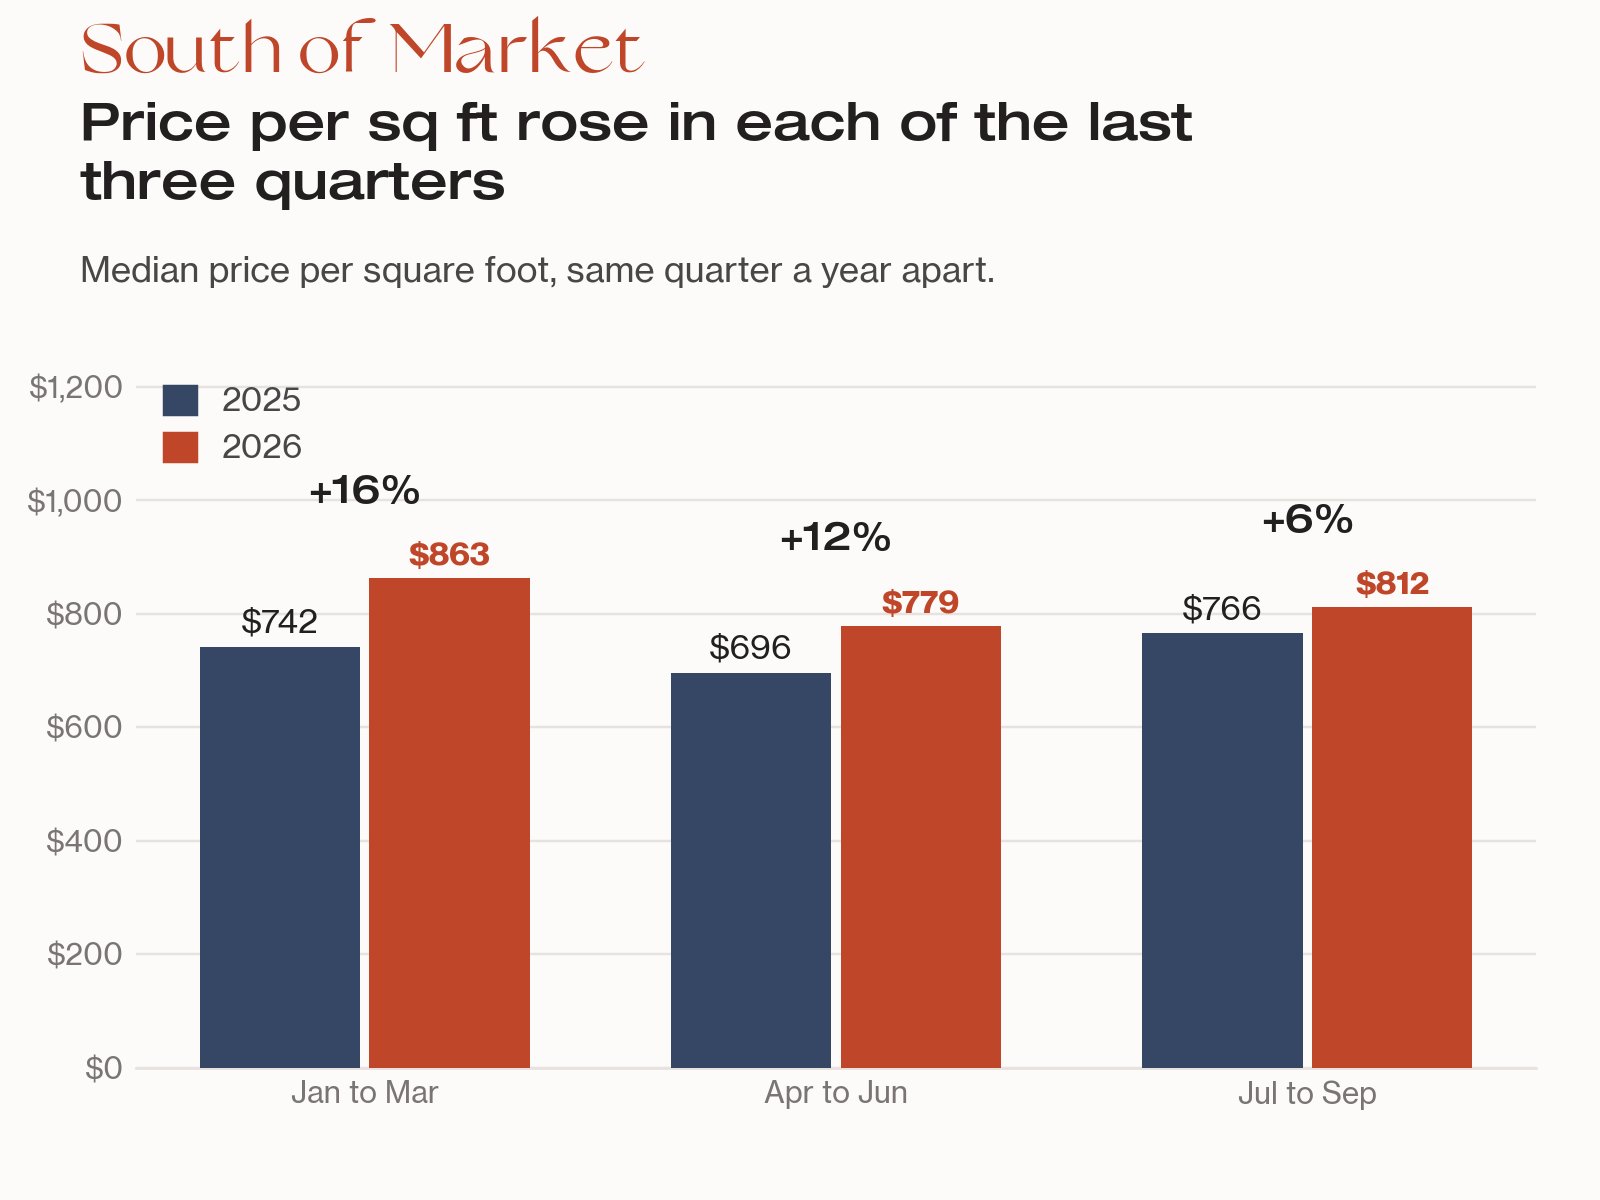
- Price per sq ft: $812, up from $766
- New listings and contracts: 59 new listings (76 a year earlier) and 40 condos under contract (38)
September on its own: 11 condos sold, with a median price of $775,000 and 29 days to contract. That's a small number of sales, so we lean on the 12-month and 6-month views.
What changed in the South of Market condo market?
Price per square foot is the change the numbers support. It rose about 7% over 12 months ($743 to $793), and our statistical check puts the gain between roughly 1% and 15%. Over the last six months it rose about 13% ($707 to $802), with a range of about 1% to 21%. It was higher than a year earlier in each of the last three quarters.
The 12-month median sale price rose about 8%, from $734,500 to $795,000, but it could plausibly sit anywhere from about 3% lower to 19% higher, so we don't lead with it. The same goes for speed and competition: median days to contract went from 40 to 35, and the share sold above asking from 22% to 27%, but with about 120 to 140 sales a year, those changes are too small to call.
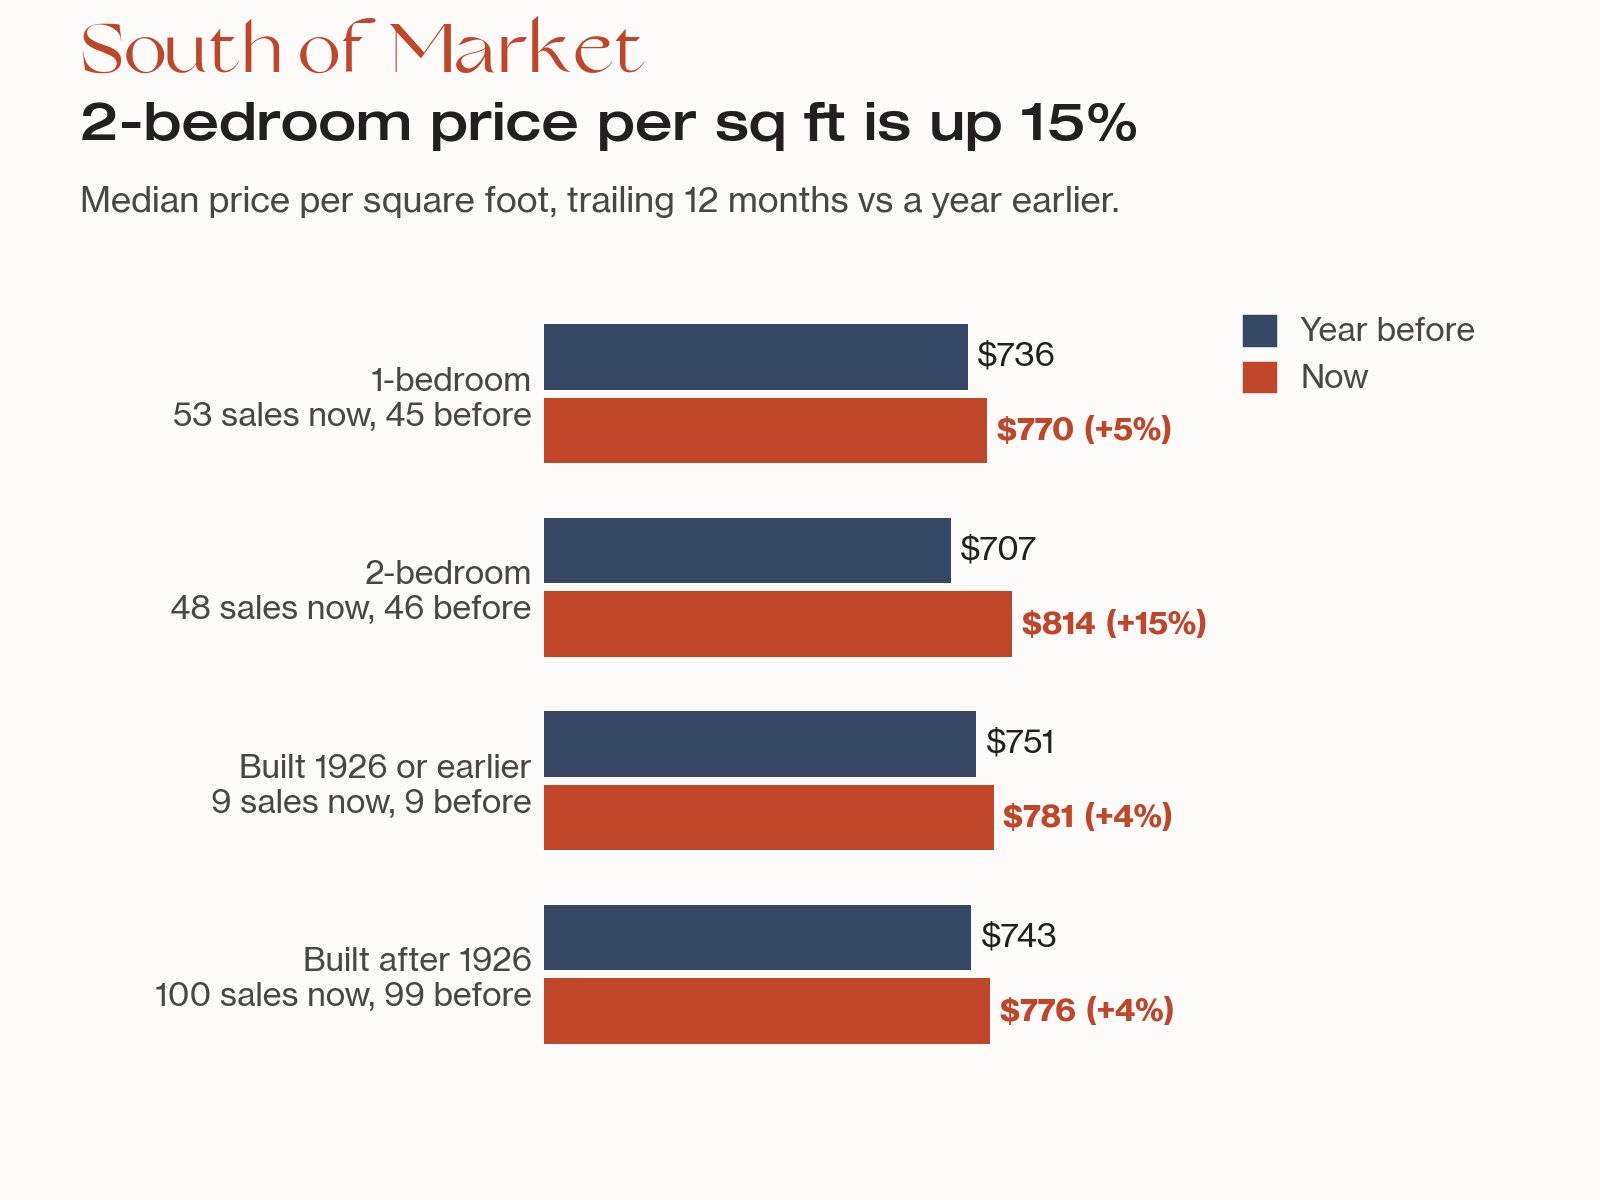
Two-bedroom condos led the gain. Their median price per square foot rose about 15%, from $707 to $814, across 48 sales with square footage, and the range of roughly 5% to 41% stays above zero. They also went under contract faster (25 days, down from 44), and 34% sold above asking, up from 19%. One-bedroom condos rose about 5% per square foot ($736 to $770) and took a median of 47 days to contract, with 30% selling after a price cut.
The entry level is the softest tier. Condos that sold under $600,000 (36 sales, median $510,000) sold above asking only 14% of the time and took a median of 49 days to contract. Between $600,000 and $800,000 (34 sales), 35% sold above asking, up from 28%, and days to contract fell from 54.5 to 34.5. From $800,000 to $1 million (34 sales) and above $1 million (33 sales), about 29% to 30% did, in 25 to 28 days.
Is South of Market a buyer's or seller's market?
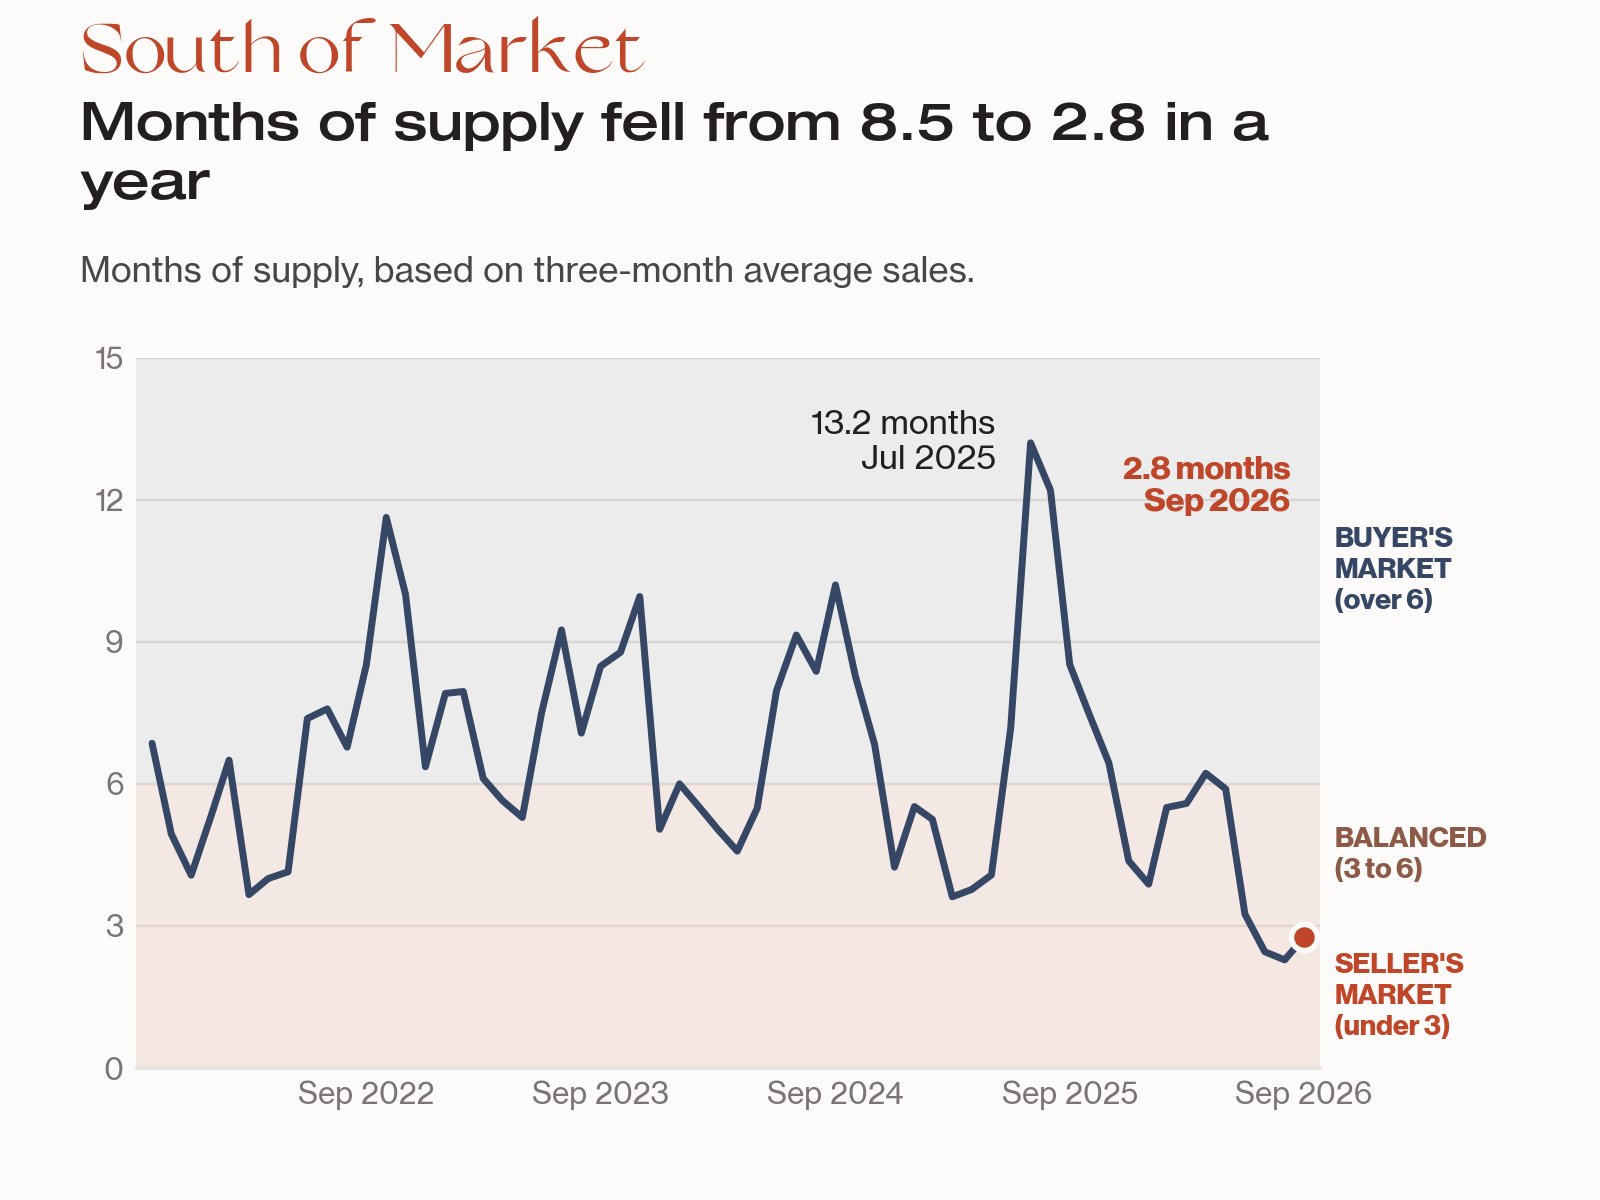
By supply, it's a seller's market for the third month in a row. Months of supply, meaning how long current listings would last at the recent sales pace, was 2.8 in September 2026 (based on the average of the last three months of sales), down from 8.5 a year earlier. We count active and contingent listings, where an offer is accepted but conditions haven't cleared. Under 3 months favors sellers, 3 to 6 is balanced, and over 6 favors buyers.
That's new for SoMa. Over the last 60 months, its condo market was a buyer's market in 31 months, balanced in 26 and a seller's market in only 3: July, August and September 2026. Supply peaked at 13.2 months in July 2025. Since then, new listings have slowed (59 from July through September, against 76 a year earlier) while sales picked up. Prices haven't caught up with the tighter supply: the typical condo still sold at 100% of its list price.
How do SoMa condo prices compare with 10 years ago?
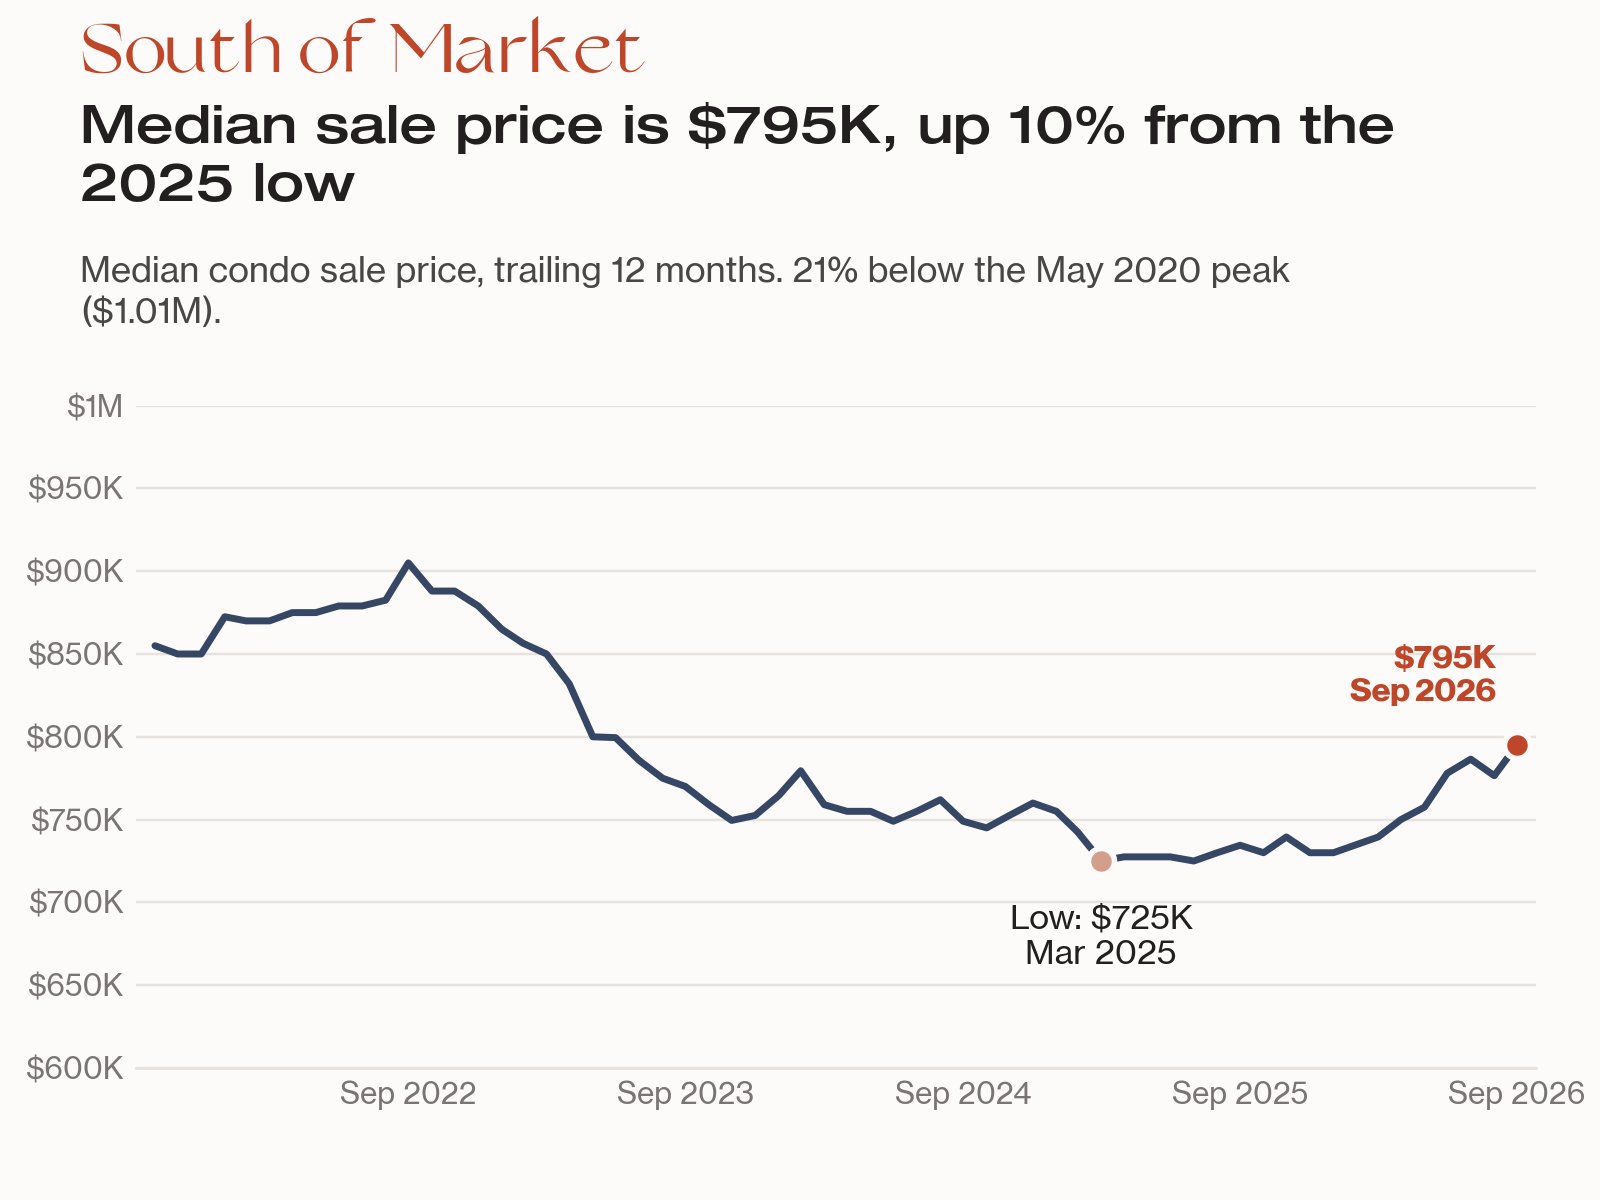
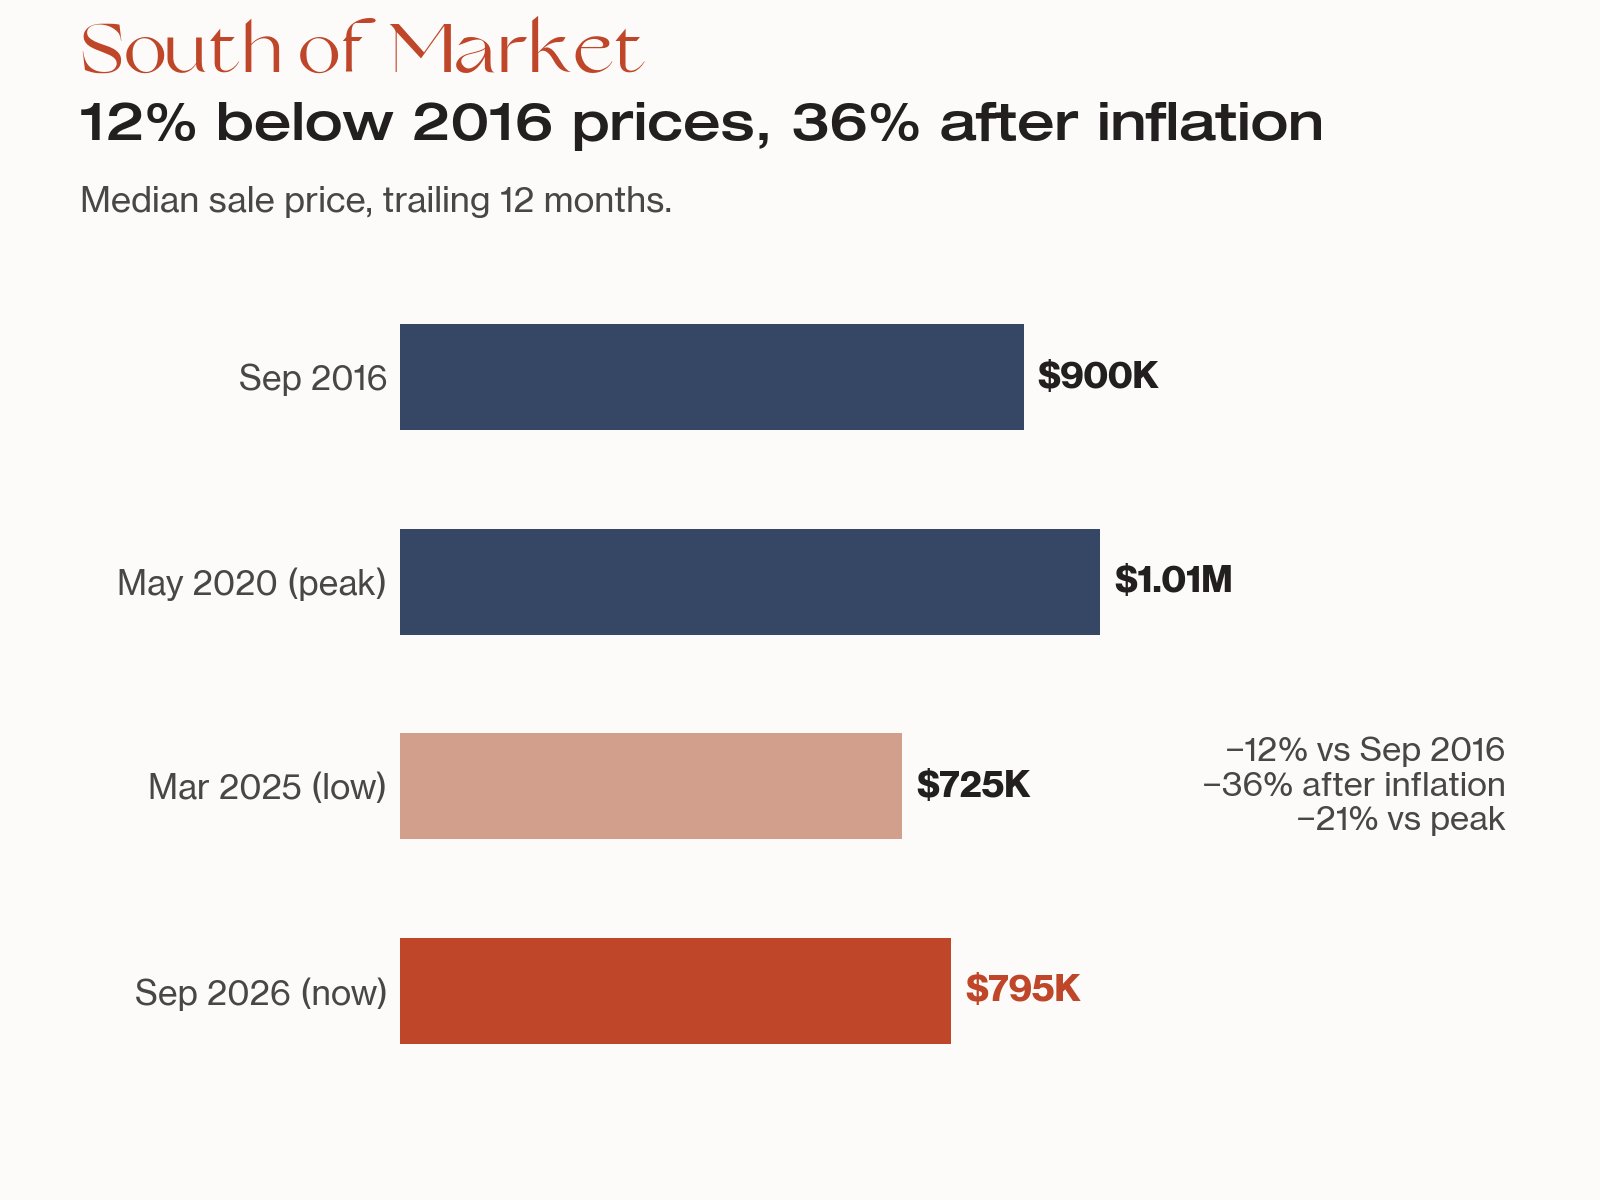
They're still lower, and much lower after inflation. The 12-month median of $795,000 is 12% below September 2016 ($900,000). After inflation it's about 36% lower: Bay Area consumer prices rose about 39% over the same period, according to the Bureau of Labor Statistics. The median is also 7% below the 10-year average of $858,000 and 21% below the May 2020 peak of $1.01 million. Price per square foot is about 14% below 2016 ($925 then, $793 now), or about 38% lower after inflation. The median bottomed at $725,000 in March 2025 and has risen 10% since.
Repeat sales tell the same story. Of the condos that sold in the last 12 months, 37 had sold before (each held at least a year). The median change between the two sales was a loss of about 8%, over a median of 5.5 years. That's a look back, not a forecast, but it's worth knowing before you price a sale or plan a purchase.
What does this mean for South of Market buyers and sellers?
If you're buying a SoMa condo
Our recommendation is to move decisively on well-priced condos and negotiate on the ones that have sat, because supply is tight but the typical SoMa condo still sold at its list price. Our buying process walks through each step.
- Look for listings that have sat. Of the 35 condos on the market in mid-October, 12 had been listed 60 days or more and 11 had cut their price. The median list price was $849,000.
- Expect the most room under $600,000. Only 14% of those condos sold above asking, and they took a median of 49 days to contract.
- Move faster on two-bedrooms. They went under contract in a median of 25 days, and 34% sold above asking.
- Widen the search if it helps. Nearby Mission Bay and East Cut are worth comparing on price per square foot.
- Talk to a lender about rate locks now. Freddie Mac's 30-year fixed average was 7.40% on October 15, 2026, up from 6.27% a year earlier.
If you're selling a SoMa condo
The goal is to price from current sales in your building and unit type, not from what you paid or from citywide headlines. Our selling process covers preparation and timing, and you can start with a free home valuation.
- Price on price per square foot. Condos that sold from July through September 2026 had a median of $812 per square foot, up from $766 a year earlier. The median sale price swings with the mix of one- and two-bedroom units sold.
- Price right the first time. Tight supply helps, but 24% of sales over the last 12 months still needed a price cut, and 12 of today's 35 listings have been on the market 60 days or more.
- Mind the calendar. Over the last 10 years, March had the most SoMa condo sales (13%) and January the fewest (6%), and January closings took a median of 76 days to go under contract. Our recommendation is to list in the next few weeks if you want to close this year, or prepare now for a late-winter launch, because condos listed into the holidays have historically sat much longer. For the citywide picture, see our guide to the best time to sell a home in San Francisco.
What should you watch in the SoMa condo market this fall?
Here's the line between what we've measured and what we haven't. The rise in price per square foot, overall and for two-bedroom condos, is statistically reliable, and the drop in listings is a straight count. The changes in median price, days to contract and above-asking share could simply reflect which condos happened to sell, so we don't lead with them.
What we haven't measured is how 7.40% mortgage rates will affect buyers. Sales close weeks after a contract is signed, so September's closings mostly reflect offers made before the latest rate readings. We're watching three things:
- Condos going under contract (the leading indicator). 40 went under contract from July through September, against 38 a year earlier. A drop here would show up before it reaches closed sales.
- New listings versus inventory. 59 new listings came on from July through September, against 76 a year earlier, and 34 condos were on the market at the end of September. A rebound in listings would push months of supply back above 3, into balanced territory.
- Sale-to-list ratio. The typical condo sold for 100% of its list price over 12 months, up from 99%. A move above 100% would show the tighter supply reaching prices.
Thinking about a move this fall? Let's look at the data for your building, not the neighborhood headline. Contact our team and we'll send you a short read on your unit. You can also browse all of our Bay Area market updates, or visit Kinoko Real Estate.
South of Market condo market FAQ
How much does a condo cost in South of Market?
In the 12 months through September 2026, the median South of Market (SoMa) condo sold for $795,000, or $793 per square foot, across 137 sales. One-bedroom condos had a median of $632,500 and two-bedroom condos $899,500. Source: Kinoko analysis of SFAR MLS data.
How long does it take to sell a condo in SoMa?
The typical South of Market condo went under contract 35 days after listing in the 12 months through September 2026, compared with 40 a year earlier. Two-bedroom condos were faster, at a median of 25 days, while one-bedroom condos took 47. In mid-October 2026, 12 of 35 listings had been on the market 60 days or more.
Do SoMa condos sell above asking price?
Some do, but most don't. From October 2025 through September 2026, 27% of South of Market condos (37 of 137) sold above asking, up from 22%, and 24% sold after a price cut. The typical condo sold at 100% of its list price. In July through September 2026, 41% sold above asking.
Is South of Market a buyer's or seller's market?
By supply, it's a seller's market. In September 2026, SoMa condos had 2.8 months of supply, down from 8.5 a year earlier, and 34 condos were on the market, down from 71. Over the last 60 months, SoMa was a buyer's market in 31 months and a seller's market in only three: July, August and September 2026.
Sources
- Kinoko Real Estate analysis of San Francisco Association of Realtors (SFAR) MLS data, South of Market condominiums, through September 30, 2026. Retrieved October 19, 2026.
- U.S. Bureau of Labor Statistics, "Consumer Price Index for All Urban Consumers: All items in San Francisco-Oakland-Hayward, CA" (series CUURS49BSA0), data.bls.gov. Retrieved October 19, 2026.
- Freddie Mac, "Mortgage Rates" (Primary Mortgage Market Survey, 30-year fixed average of 7.40% on October 15, 2026 and 6.27% a year earlier), freddiemac.com/pmms. Retrieved October 19, 2026.
- Kinoko Real Estate, "San Francisco Real Estate Market Update - September 2026" (August 2026 data), kinokorealestate.com. Retrieved October 19, 2026.
Kevin Gueco | CA DRE #01461677