View of San Francisco From Treasure Island

When Is the Best Time to Sell a Home in San Francisco?

Most San Francisco sellers list their home in September. It's the single busiest month of the year to hit the market, more listings than any other month by a wide margin. Based on eleven years of closed sales, it's also one of the more competitive months to do it in.

But that doesn't mean fall or winter are off the table. Homes sell in this city every single month of the year, and sometimes life doesn't wait for spring: a job relocation, a growing family, a sale that has to close before year-end. What actually changes by season isn't whether your home sells. It's what strategy gets you the best outcome for the month you're actually in, and that's exactly where the right agent earns their keep.

Key Takeaways

  • March through May give San Francisco sellers the strongest tailwinds overall: the fastest sales, the highest prices relative to asking, and the fewest price cuts, based on 53,157 closed sales since 2015.
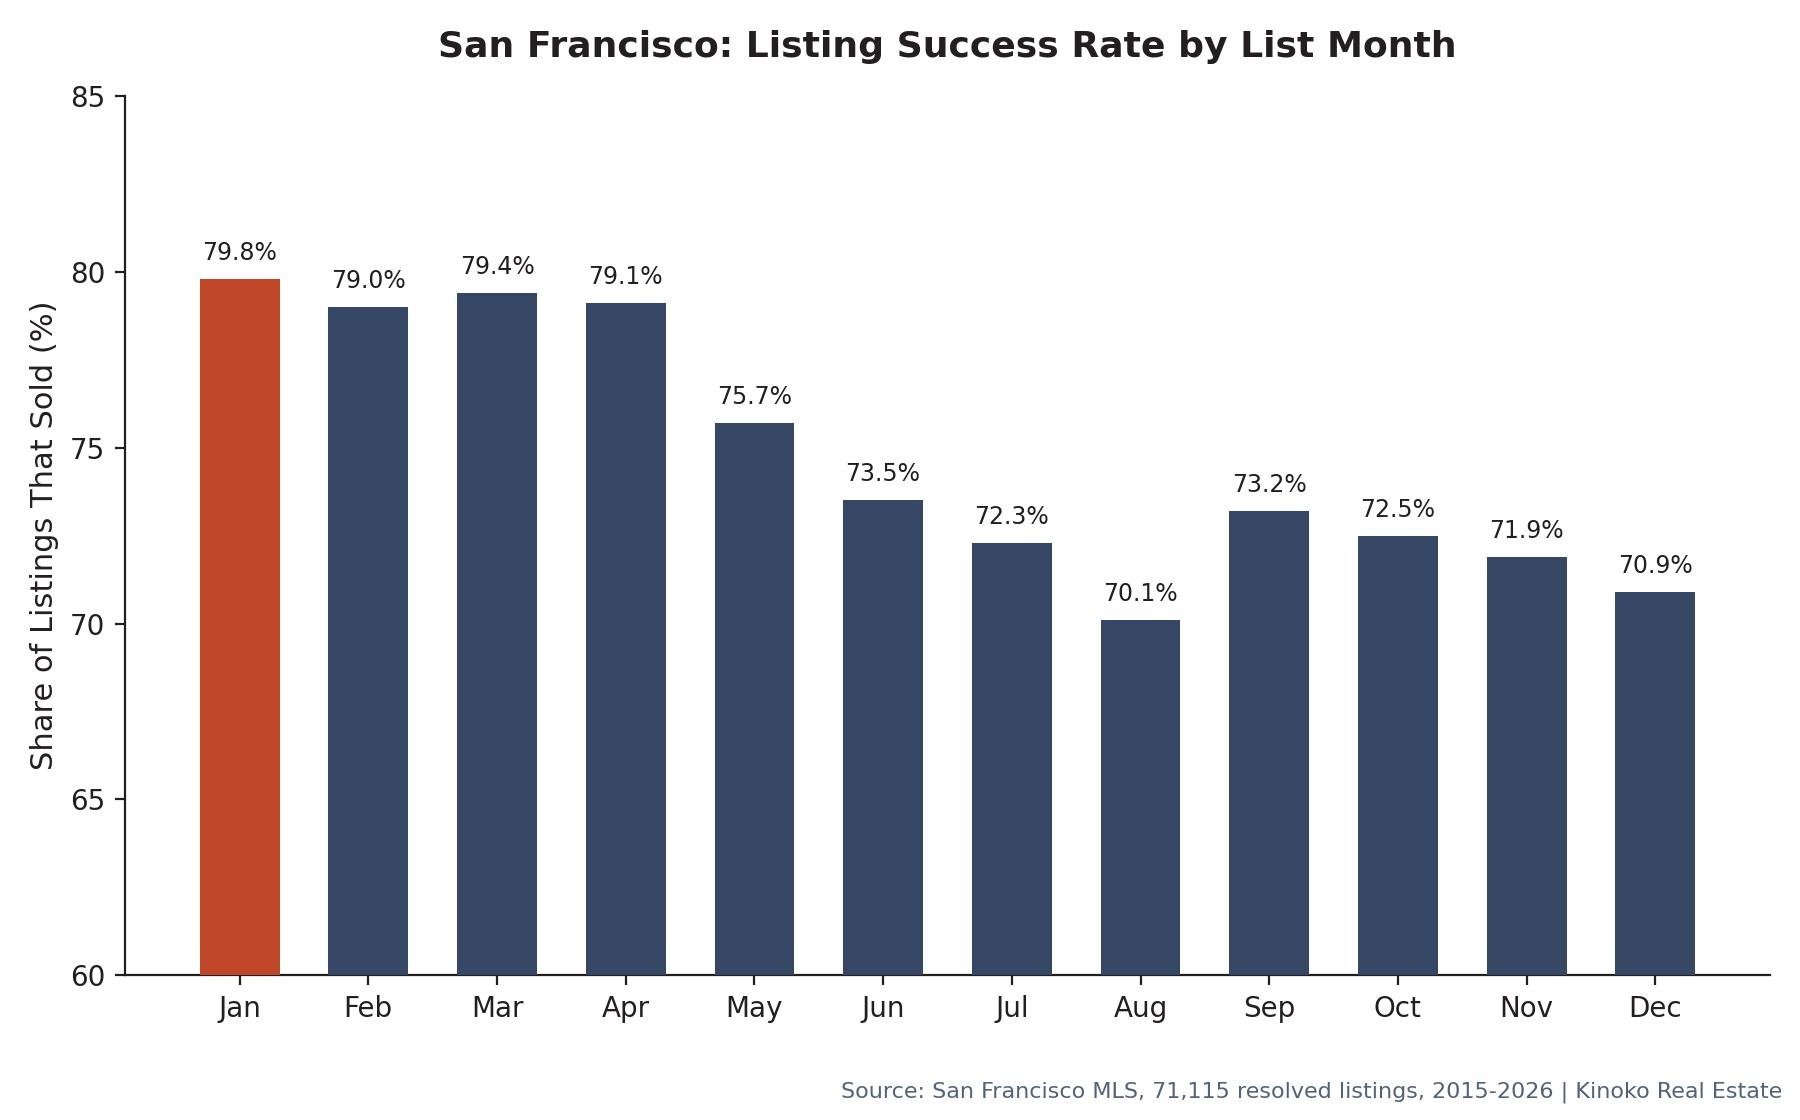
  • That said, homes sell in every month of the year. The odds your home eventually sells stay above 70% no matter when you list, and January, not a spring month, has the single highest success rate of any month at 79.8%.
  • The pros of timing look different depending on what you're selling. Condo prices barely move by season, so condo sellers have real freedom to pick a month around their life. House prices swing a lot more, except in December, when houses that do list sell almost as fast as in spring with nearly as few price cuts.
  • Price point matters too: entry-level homes see almost no seasonal price swing, while homes above $1.68M see the widest gap between spring and fall, and December is a genuinely tough month at that tier specifically.
  • September draws the most new listings of any month (6,971) but that volume works against sellers as much as for them, more competition for buyer attention, more price cuts.
  • Checked neighborhood by neighborhood: the seasonal pattern holds in all 22 of San Francisco's highest-volume neighborhoods, but every one of those neighborhoods still sees real sales close in every season.

Which Month Actually Gets San Francisco Sellers the Best Price?

We pulled every closed San Francisco sale on record, 53,157 transactions from 2015 through this July, sourced from San Francisco MLS, and grouped them by the month each home first hit the market. Three numbers tell the story: median days to an accepted offer (DOM), median sale-to-list price ratio (a clean read on how much leverage sellers had), and how often the final sale price came in below the original list price.

We're using sale-to-list ratio and price-cut rate instead of raw median sale price by month on purpose. Median price by month blends together which homes happened to close that month with how much leverage sellers actually had; a run of high-end closings in one month can make it look strong when it's really just a different mix of homes selling. Ratio-based metrics measure leverage directly, no matter what's selling.

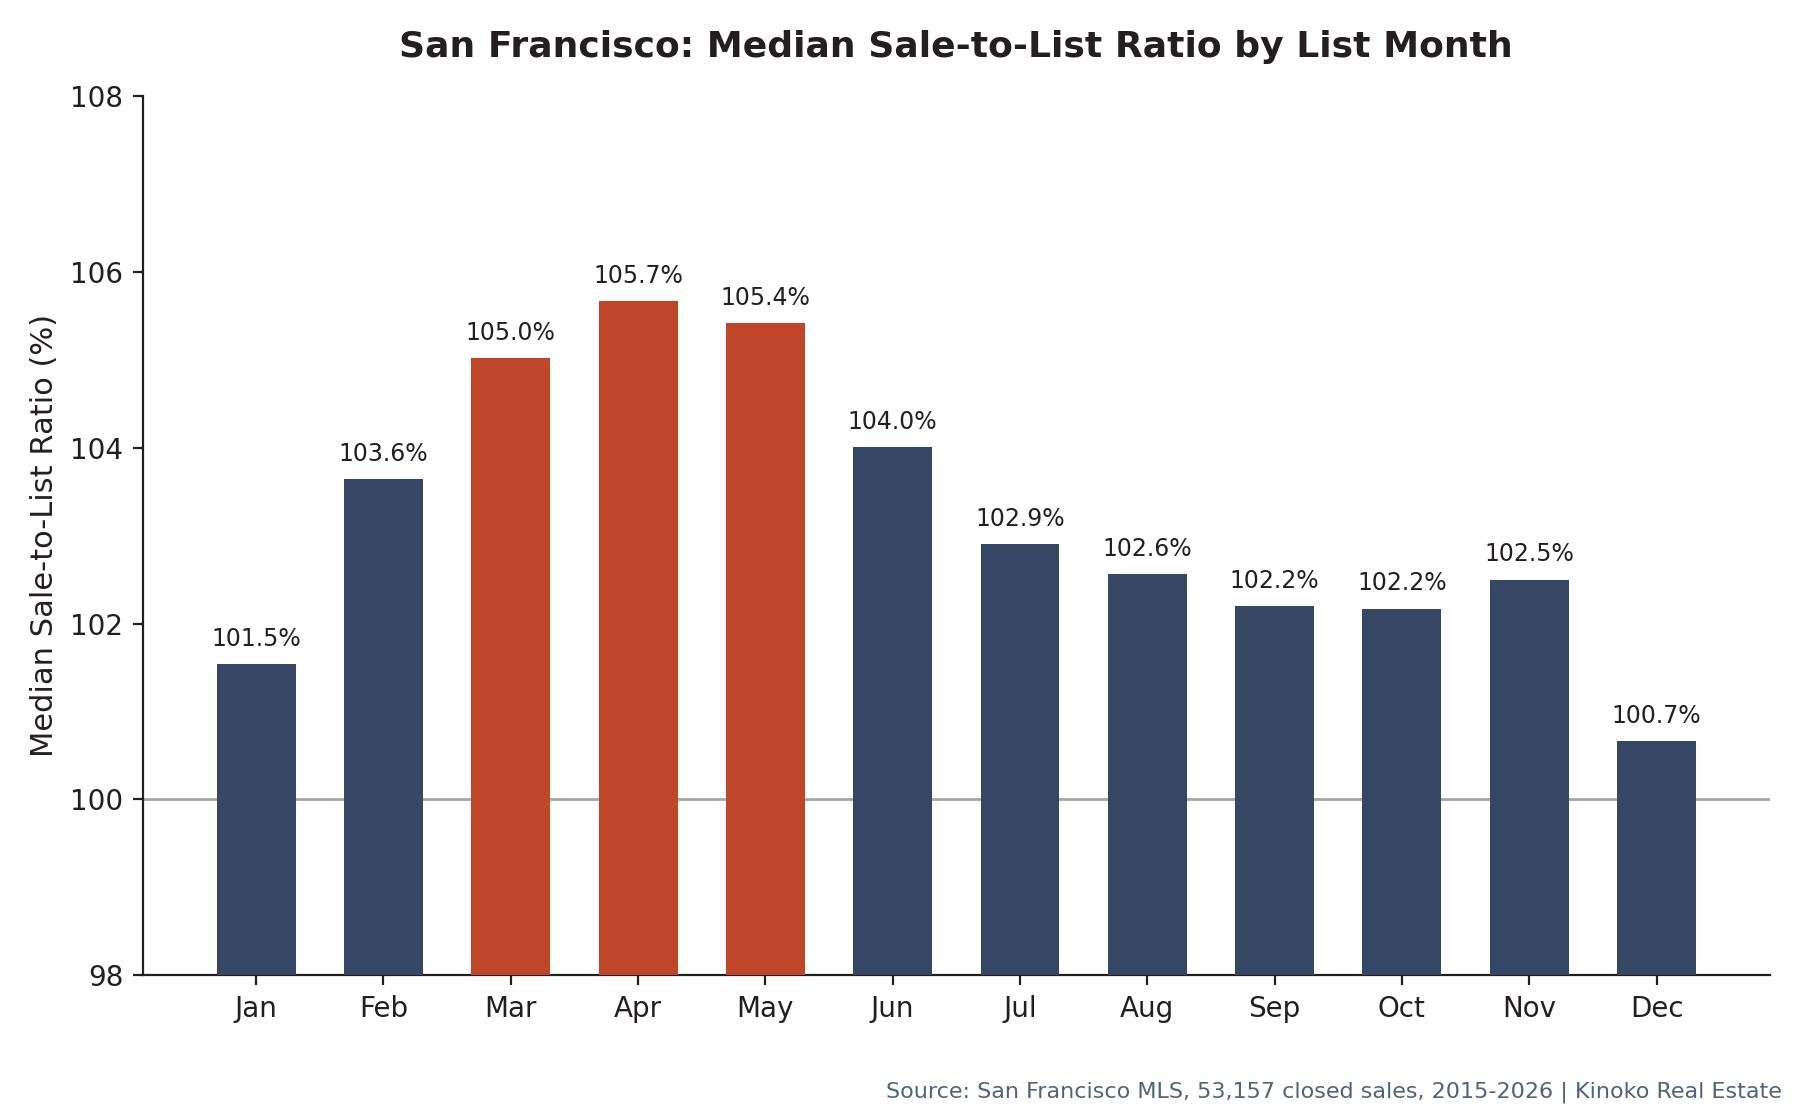
April comes out on top. Homes listed in April sold in a median 15 days at 105.7% of asking, and needed a price cut only 26.9% of the time. May and March aren't far behind, both landing sales at 105%+ of asking in 15 to 16 days.

September, by contrast, took a median 23 days to get an accepted offer, sold closer to list price (102.2%), and needed a price cut 36.6% of the time, the highest rate of any month.

List Month

Sale-to-List Ratio

Days to Offer

Price-Cut Rate

Listings

April

105.7%

15

26.9%

5,410

May

105.4%

16

28.1%

5,468

March

105.0%

15

26.6%

5,451

June

104.0%

18

29.0%

4,666

February

103.6%

16

28.6%

4,807

July

102.9%

19

32.1%

3,897

August

102.6%

20

33.7%

3,535

November

102.5%

22

31.0%

2,366

September

102.2%

23

36.6%

6,971

October

102.2%

23

33.9%

4,873

January

101.5%

19

33.6%

4,635

December

100.7%

20

31.6%

1,078

Bar chart showing San Francisco's median sale-to-list price ratio by list month, with April, May, and March highlighted as the three highest months at 105 to 106 percent of asking price.

Median Sale-to-List Ratio by List Month, San Francisco, 2015-2026.

One quick note on methodology: "list month" is when a home first goes on the market, the one thing a seller actually controls, not the month it eventually closes. Days-on-market here (commonly shortened to DOM) measures time to an accepted offer, not time to close. These are median figures pooled across eleven years, a far steadier read than picking a single "best month" out of any one year. We also tested the April-versus-September gap statistically (Mann-Whitney U), and it's not close: with 5,410 and 6,971 sales in each group, the odds of that gap being random noise are essentially zero.

What Every Season Actually Offers a San Francisco Seller

Spring gets the headline numbers, but every season has something real going for it. Here's what the eleven-year record actually shows for each one, not just the season that wins on paper.

Spring (March-May): the strongest tailwind, if your timing is flexible. The fastest sales, the highest prices relative to asking, and the fewest price cuts of any stretch of the year. If you have full control over when you list, this is where the numbers point hardest.

Summer (June-August): still a strong market, with room to breathe. June in particular holds up close to spring levels (104.0% of asking, 18 days). Longer daylight hours mean more showing windows, and families relocating ahead of the school year keep real buyer demand in the market. It's a good landing spot if spring isn't realistic but you still have some flexibility.

Fall (September-October): the most competition, but also the most total activity. September's 6,971 listings is more raw buyer traffic in the market than any other month, it's just split across more competing homes. The upside: fall buyers who are still house-hunting after the spring rush tend to be closer to a decision, and homes here still sell, they typically just need sharper pricing from the start rather than room to negotiate up.

Winter (November-January): the least competition from other sellers, and some real advantages buried in the numbers. Listing volume drops to its lowest point of the year (November and December combined see barely a third of September's listings), which means less noise for your home to stand out from. And the record shows something worth knowing: January actually has the highest success rate of any month in the entire dataset, 79.8% of January listings go on to close, edging out every spring month. Even December, the softest month on price, still saw 53% of sales close at or above asking.

Bar chart showing the share of San Francisco listings that eventually sold by list month, with January highlighted as the highest at 79.8 percent, ahead of every spring month.

Listing Success Rate by List Month, San Francisco, 2015-2026.

The throughline: your home has the potential to sell no matter what time of year you list it. Our numbers put the floor at 70%+ in every single month. What changes is the strategy that gets you there. That's a conversation for an agent who knows how to price and market for the season you're actually in, not a reason to wait for one that might not fit your timeline.

What September's Crowd Means for Your Strategy

Nearly 7,000 San Francisco homes came on the market in September over the past eleven years, easily the highest count of any month. It makes intuitive sense: summer vacations wind down, families settle back into routines, and a lot of agents advise clients to wait until "after Labor Day."

The trade-off is that everyone gets the same advice. A flood of new listings in September means more competition for buyer attention, and buyers who've been house-hunting since spring have already absorbed most of what's on the market. That shows up in the numbers: longer time to an offer, thinner pricing leverage, and the highest rate of sellers having to come down from their original price. It doesn't mean September or October are bad months to sell, most homes still do, it means the pricing and marketing strategy has to work harder to cut through the extra noise.

Bar chart showing San Francisco's median days on market to an accepted offer by list month, with April, May, and March highlighted as the three fastest months at 15 to 16 days.

Median Days on Market by List Month, San Francisco, 2015-2026.

Worth calling out: April's edge shows up at every point in the distribution, not just the median. Even the softer April outcomes hold up. Its 10th-percentile sale-to-list ratio (96.4%) still edges out September's (95.2%), and the gap widens the higher you look, up to a 90th-percentile result of 131.3% of asking in April versus 123.5% in September. Spring's extra spread comes almost entirely from bigger upside, the odd bidding war, not from a higher chance of a bad outcome.

What Timing Means If You're Selling a Condo vs. a House

The pros of timing look different depending on what you're selling, because condos and houses respond to the season in almost opposite ways.

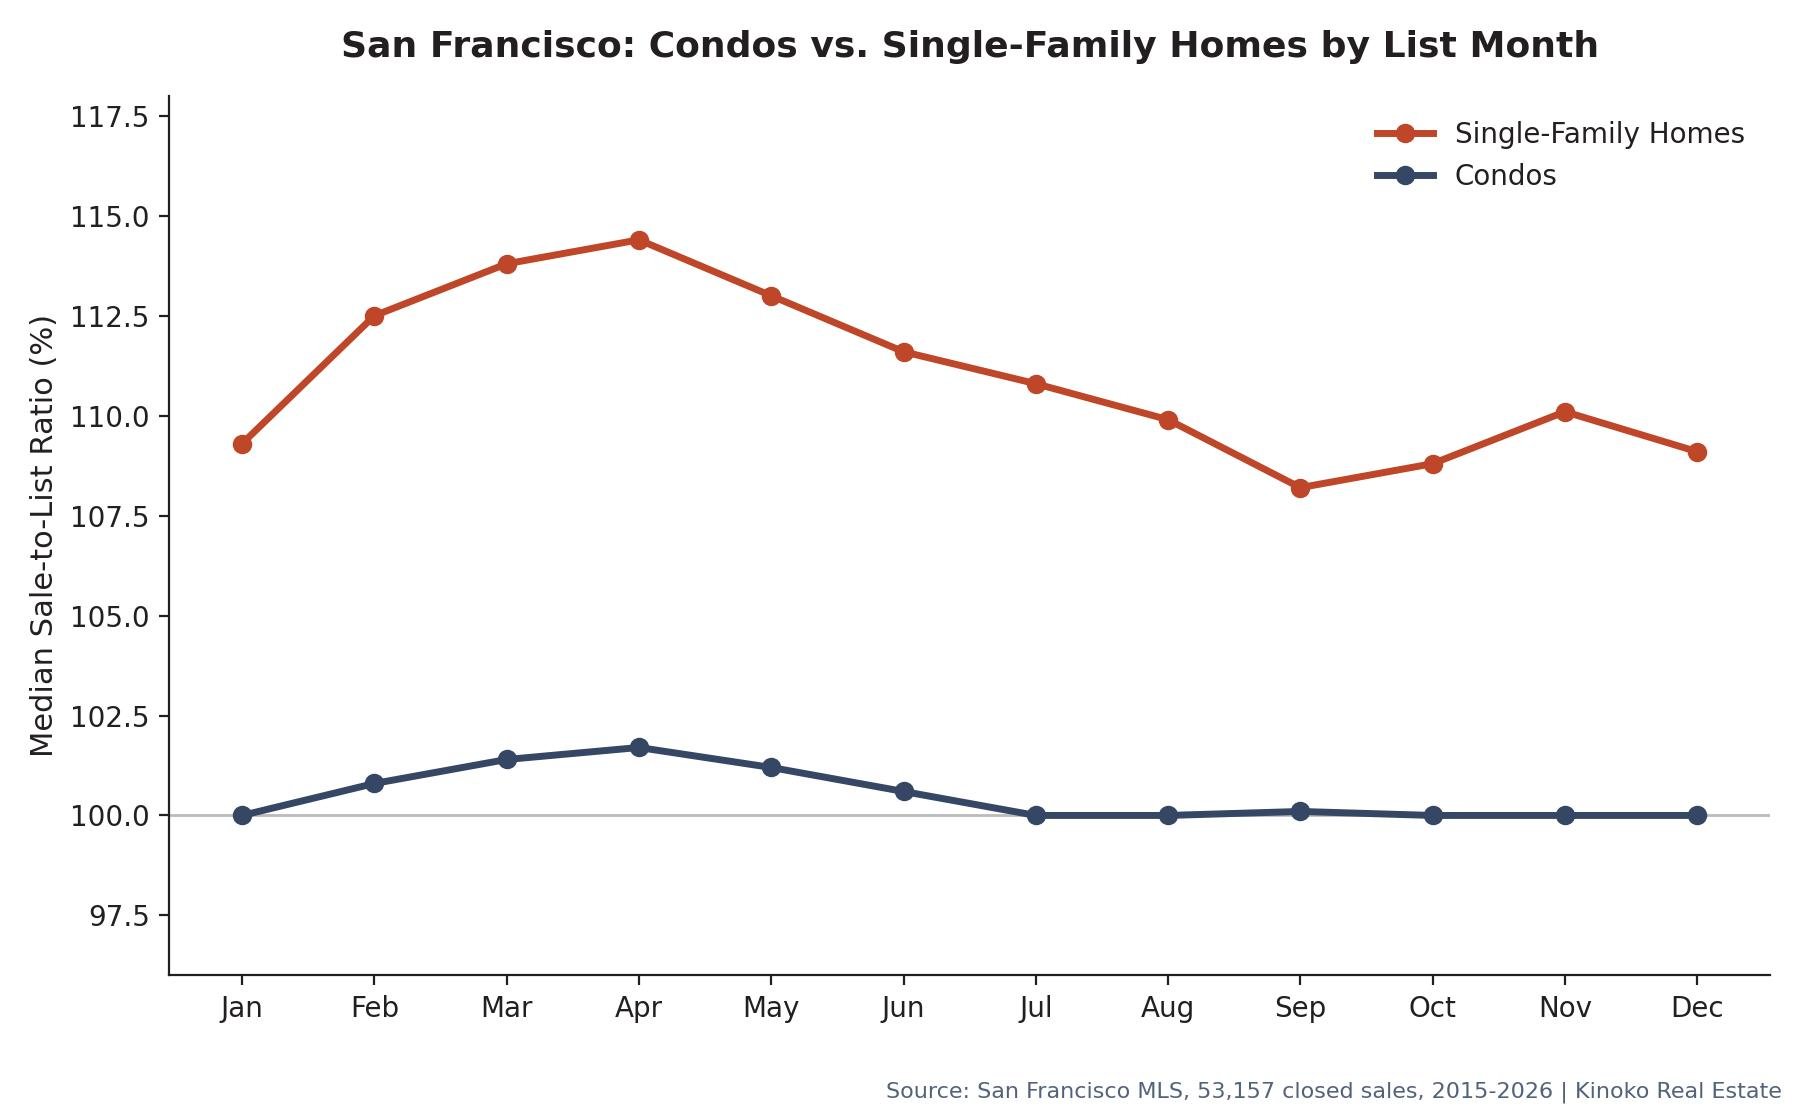
For condos, the season barely moves your price, but it moves everything else. Sale-to-list ratio for condos stays remarkably flat all year, 100.0% to 101.7%, spring included. What actually swings by season is speed and how much back-and-forth you'll face: condos listed in March or April sold in a median 19 to 20 days with a 32.6% to 33.7% price-cut rate, while condos listed in September or October took 28 to 31 days with a 42.7% to 42.9% price-cut rate. The upside: since price isn't really on the table seasonally for condo sellers, you have real freedom to pick a month that works for your life without leaving much money behind. And if speed and odds of success matter most to you, January is worth knowing about: it's the single best month of the year for a condo actually closing, a 77.2% success rate, even better than April's 75.4%.

Line chart comparing median sale-to-list ratio by list month for condos and single-family homes, showing condo pricing staying nearly flat around 100 percent year-round while single-family home pricing swings from 108 to 114 percent.

Condos vs. Single-Family Homes by List Month, San Francisco, 2015-2026.

For houses, spring's price advantage is real and substantial. Single-family homes listed in April closed at a median 114.4% of asking versus 108.2% in September, a gap more than six times wider than what condos see. But there's a genuine exception worth knowing: December. Despite being one of the slowest months for new listings (just 449 houses came on the market that month across eleven years), the houses that did list in December sold in a median 13 days, tied with spring for the fastest pace of the year, and needed a price cut only 18.0% of the time, the second-best rate of any month behind April's 17.1%. Fewer houses on the market in December seems to mean sharper competition among the serious buyers still looking, not a weaker outcome for sellers.

What Timing Means at Different Price Points

Price point changes the pros-and-cons picture as much as property type does. We split sales into three roughly even tiers: under $1.14M, $1.14M to $1.68M, and above $1.68M.

Entry-level homes see almost no seasonal price swing, staying within a single point of 100% of asking all year (101.1% in April, 100.1% in September). Like condos, the lever here is speed and negotiating room, not price: 26 to 28 days and a 35% to 37% price-cut rate in spring versus 34 to 37 days and 42% to 43% in fall. Sellers at this price point have the most freedom of anyone to choose a listing month around their own schedule rather than the calendar's preferences.

Mid-tier homes ($1.14M to $1.68M) show a real spring premium, 108.3% to 108.9% of asking in March through May, but also a pocket worth knowing about: November. At 106.8% of asking with a 26.3% price-cut rate, November actually outperforms September, October, and January at this price point, a legitimate secondary window if spring doesn't fit your timeline.

Line chart comparing median sale-to-list ratio by list month across three San Francisco price tiers, showing entry-level homes staying flat near 100 percent, mid-tier and top-tier homes peaking in spring, and the top tier dropping sharply in December.

Sale-to-List Ratio by Price Tier and List Month, San Francisco, 2015-2026.

At the top of the market (above $1.68M), homes move fast almost regardless of season, 11 to 16 days year-round, so the calendar mostly affects price, not speed. Spring still commands the clearest premium (108.2% to 108.9%). One honest exception worth flagging: December is a genuinely tough month at this tier, both on price (100.8% of asking) and on the odds of the sale even closing (a 59.9% success rate, the softest combination we found anywhere in this data). If a high-value sale has to happen in December, that's exactly the situation where a strategist who knows how to price and position a luxury listing matters most.

Does This Pattern Hold Up Neighborhood by Neighborhood?

We checked, since citywide numbers can hide a lot. We ran the same spring-versus-fall comparison across the 22 San Francisco neighborhoods with enough sold volume since 2015 to trust a seasonal read, from South Beach and Noe Valley down to Glen Park and the Outer Richmond.

Two of the three measures were unanimous. Every one of those 22 neighborhoods sold faster in spring than in fall. Every one had a lower price-cut rate in spring. Sale-to-list ratio favored spring in 18 of the 22; the other 4 (Mission Bay, Nob Hill, Van Ness/Civic Center, and Lower Pacific Heights) came in essentially flat between seasons rather than reversed, and they're exactly the dense, high-rise, condo-heavy pockets where the citywide condo numbers already showed a compressed premium year-round.

The widest spring premiums showed up in family-oriented neighborhoods on the west and south sides. Central Sunset listings closed at a median 124.2% of asking in spring versus 115.5% in fall. Outer Parkside and Outer Richmond showed similarly wide gaps. That lines up with the earlier finding that single-family homes swing more seasonally than condos, since those neighborhoods lean heavily toward houses. The pattern holds either way: if you're in a condo-dense pocket, timing matters less for your price, giving you more freedom to choose a season around your life. If you're in a house-heavy, family-oriented neighborhood, spring's advantage is real and worth prioritizing if your timeline allows it.

Has This Pattern Held Up in Today's Market?

It has, and it's actually gotten more pronounced. Looking only at the past 12 months, April listings closed at a median 111.6% of asking, May at 118.0%, and June at 120.1% (June's sample is smaller, so we'd treat that top number with a little caution). Meanwhile, September listings over the same period closed at 102.5%, essentially unchanged from the eleven-year average.

In other words, the spring premium isn't a relic of a different market cycle. In the current environment, it's wider than the historical baseline.

Bottom Line

The numbers are clear that spring gives San Francisco sellers the strongest tailwind, and if your timing is flexible, it's worth planning around. But most sellers don't have that luxury, and they don't need it. Every season in this dataset, including the softest ones, still closes real sales, most of them above asking. What actually determines a great outcome isn't the calendar, it's a pricing and marketing strategy built for the specific market you're in: your property type, your price point, your neighborhood, and the month your life actually calls for.

That's the real value an agent brings to timing. It's not picking the calendar's favorite month, it's knowing how to position your home to win in whichever one you're in.

Thinking about listing, whatever the timeline looks like for you? Get in touch.

Frequently Asked Questions

What month should I list my San Francisco home?

Based on eleven years and over 53,000 closed sales, April is the strongest single month on price and speed, with March and May close behind. Homes listed in April sold at a median 105.7% of asking price in 15 days.

Do I have to wait for spring to sell my home in San Francisco?

No. Homes sell in every month of the year, the odds your home eventually sells stay above 70% no matter when you list, and January actually has the highest success rate of any month at 79.8%. Spring gives sellers the strongest pricing leverage, but the right strategy can still get a strong result in any season.

Is fall a bad time to sell in San Francisco?

Not a bad time, a more competitive one. September draws more new listings (6,971) than any other month, which means more competition for buyer attention and a higher rate of price cuts (36.6%). Most fall listings still sell, and most still close near or above asking; they typically need sharper pricing from the start rather than room to negotiate up.

Does the best month to sell change for condos versus houses?

Yes, and in a specific way: condo prices barely move by season (100.0% to 101.7% of asking all year), so timing mostly affects speed and negotiating room for condo sellers, not price. House prices swing much more by season (114.4% in April vs. 108.2% in September), except in December, when houses that do list sell almost as fast as in spring (13 days) with nearly as few price cuts (18.0%).

Does timing matter more for higher-priced homes?

Yes. Entry-level homes under $1.14M see almost no seasonal price swing. Mid-tier homes ($1.14M-$1.68M) see a real spring premium, with November as a solid secondary option. Above $1.68M, the spring-to-fall gap is widest, and December specifically is a tough month on both price and odds of closing at that tier.

How much faster do spring listings sell than fall ones?

Citywide, April listings took a median 15 days to an accepted offer, compared to 23 days for September listings, eight days faster.

How long does it take to sell a house in San Francisco overall?

Across all 53,157 closed sales and every month combined, the median time from listing to an accepted offer is 18 days, and the median time from listing to closing is 41 days, which accounts for a typical escrow period of around three weeks once an offer is accepted.

Does this hold up in specific San Francisco neighborhoods, or just citywide?

We tested it in the 22 neighborhoods with enough sold volume to trust a seasonal read, and spring listings sold faster and needed fewer price cuts in all 22. Sale-to-list ratio favored spring in 18 of the 22; the remaining 4 were flat between seasons, not reversed, and were concentrated in condo-heavy, high-rise submarkets.


Data is current as of July 22, 2026, and reflects closed San Francisco sales reported to San Francisco MLS spanning 2015 through July 2026. Statistics may shift as pending sales close and additional listings are reported.

Kevin Gueco, CA DRE# 01461677 | Nini Gueco, CA DRE# 01908351

Let’s Talk

You’ve got questions and we can’t wait to answer them.

Follow Us on Instagram