
Updated November 20, 2026.
What’s Driving Silicon Valley’s Housing Market Right Now
Silicon Valley Market at a Glance:
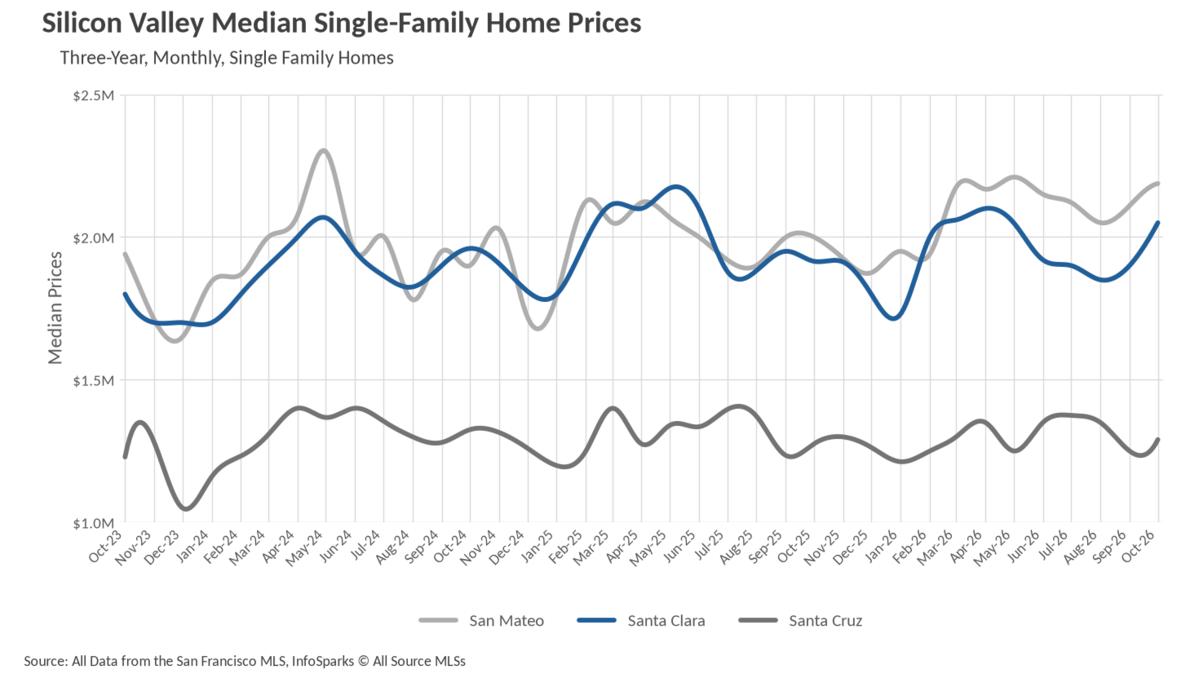
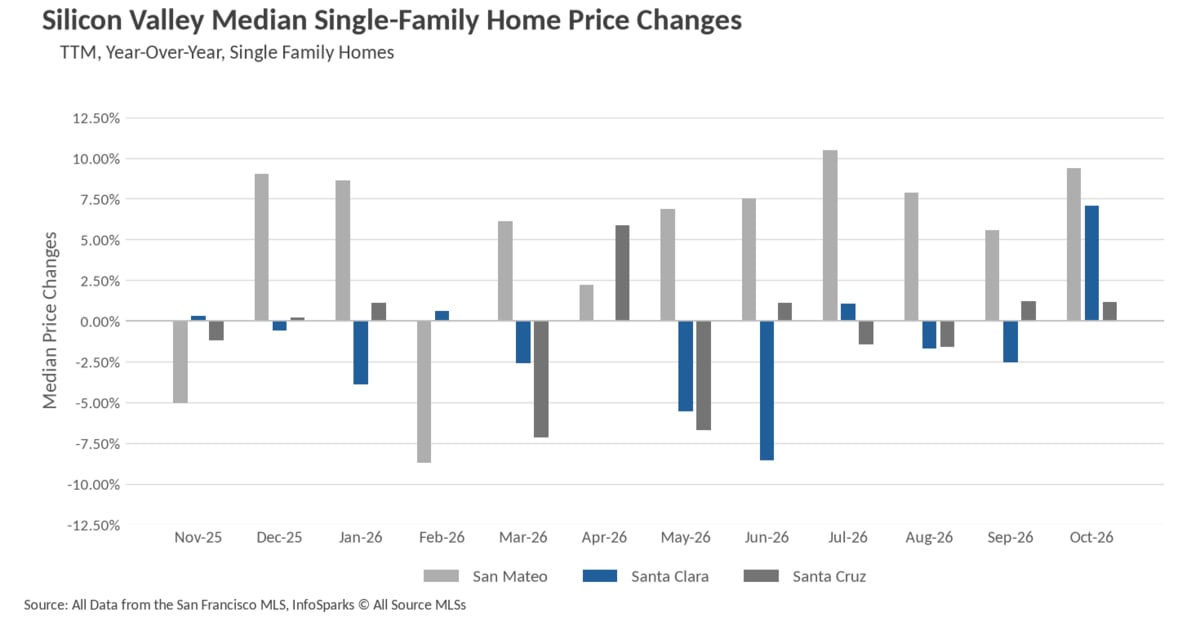
- Single-family median sale prices finished October on a strong note across all three counties, with San Mateo up 9.38% year over year to $2,187,500 and Santa Clara rebounding 7.05% to $2,050,000.
- Inventory is essentially flat year over year on the single-family side at 2,032 homes for sale, while condo supply has tightened 7.52% from last October.
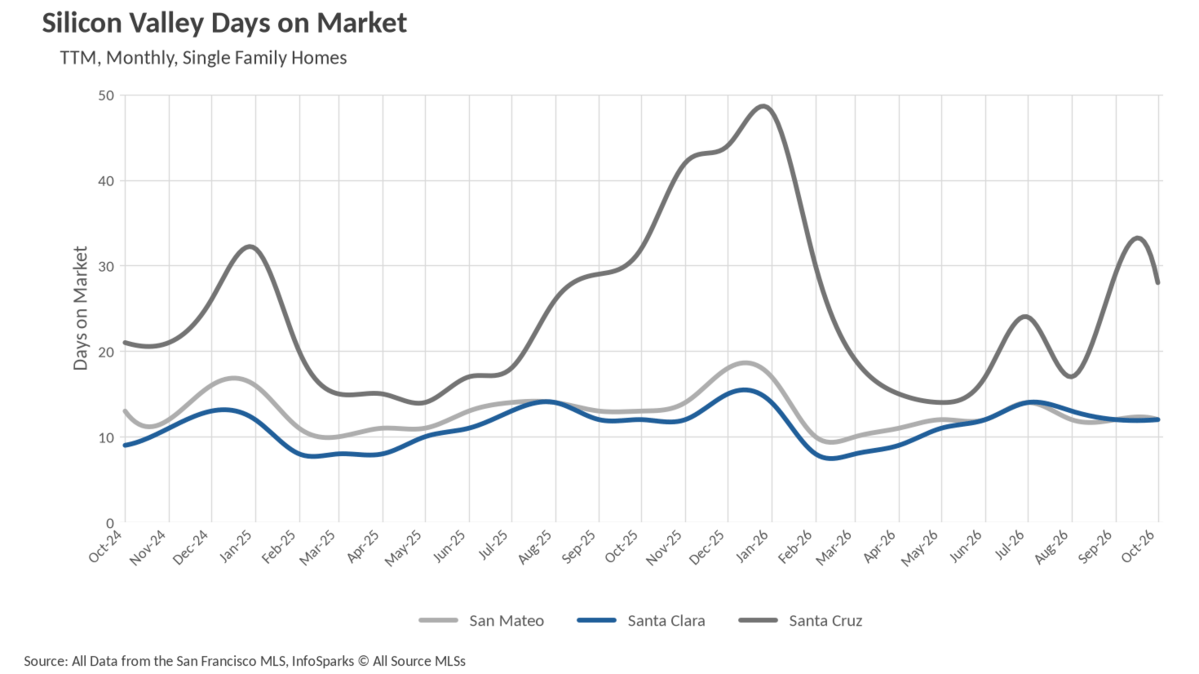
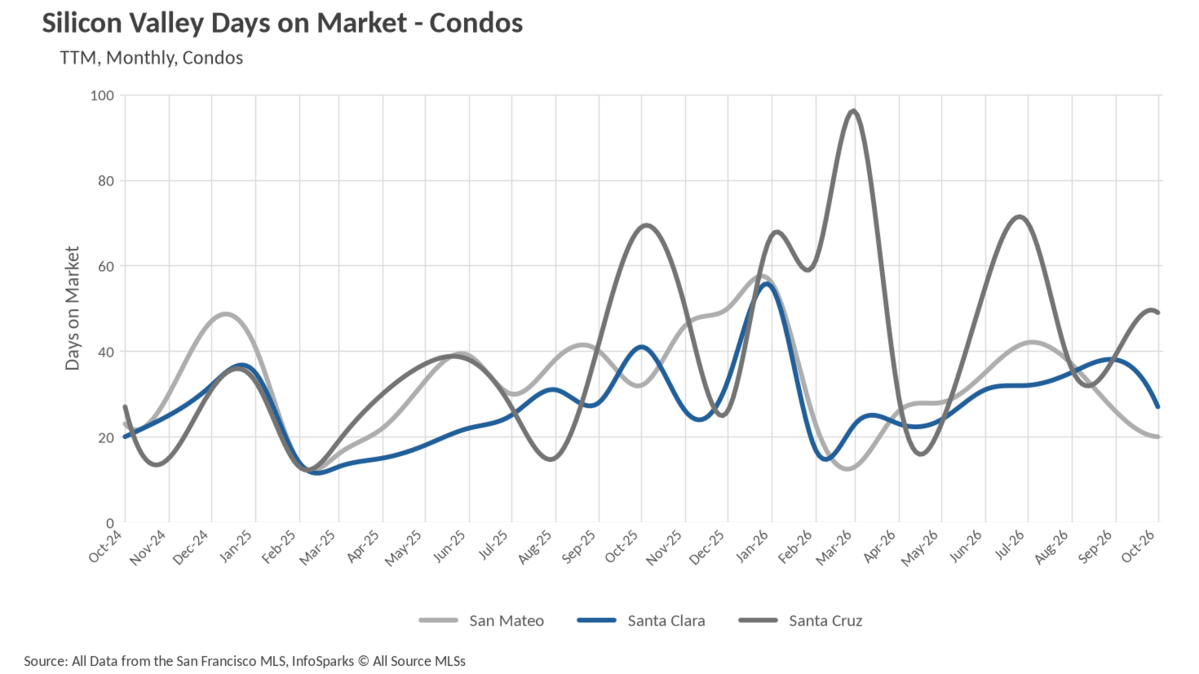
- Homes continue to move quickly, and the condo segment has seen the most dramatic improvement, with days on market down roughly a third in all three counties.
Silicon Valley Housing Market Snapshot
Metric | Single-Family Homes | Condos |
|---|---|---|
Homes for sale | 2,032 | 775 |
Homes for sale vs. last year | Virtually unchanged | 7.52% lower |
New listings | 1,366 | 292 |
Homes sold | 1,106 | 230 |
Single-Family Homes by County
Metric | San Mateo | Santa Clara | Santa Cruz |
|---|---|---|---|
Median sale price | $2,187,500 | $2,050,000 | $1,290,000 |
Price change vs. last year | +9.38% | +7.05% | +1.18% |
Days on market | 12 | 12 | 28 |
Months of supply | 1.5 | 1.8 | 3.4 |
Condos by County
Metric | San Mateo | Santa Clara | Santa Cruz |
|---|---|---|---|
Median sale price | $810,500 | $685,000 | $800,000 |
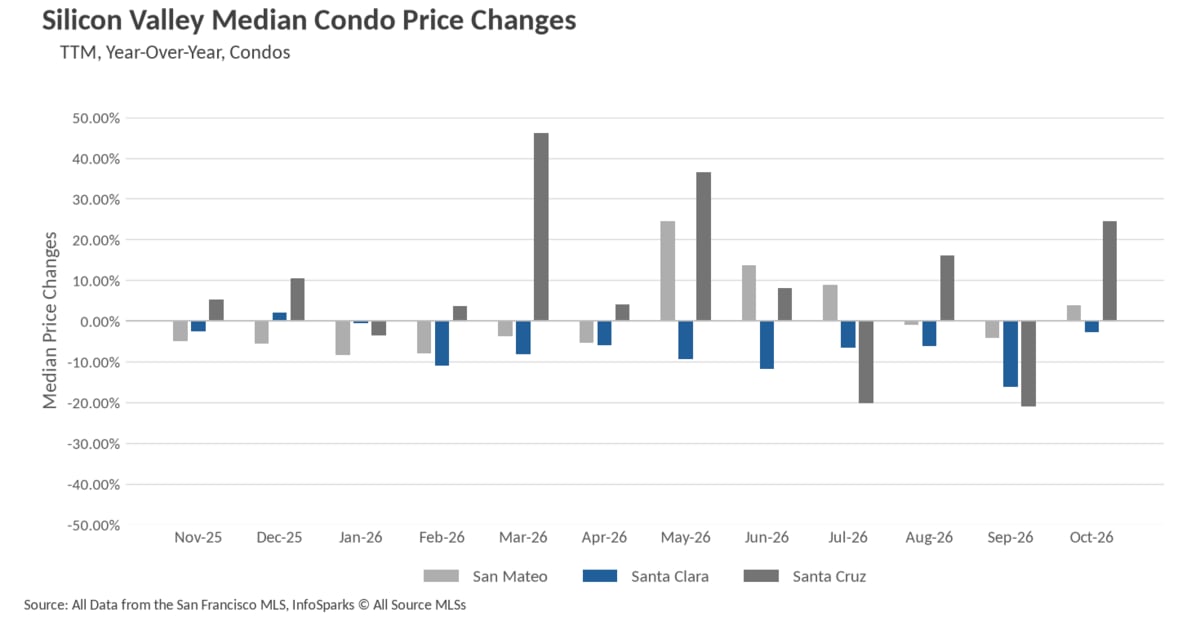
Price change vs. last year | +3.91% | -2.84% | +24.51% |
Days on market | 20 | 27 | 49 |
Months of supply | 2.9 | 3.7 | 4.9 |
*National Association of REALTORS® data is released two months behind, so we estimate the most recent month's data when possible and appropriate.
Home Prices in Silicon Valley: Median Sale Prices by County
After a softer late summer, Silicon Valley's single-family market closed October with broad-based gains. San Mateo County led the way, with the median home selling for $2,187,500, a 9.38% increase over last October and a 3.67% jump from September's $2,110,000. Santa Clara County staged the sharper monthly turnaround, climbing 7.89% from September to a median of $2,050,000, which also represents a 7.05% year-over-year gain and marks the county's best reading since April. Santa Cruz County rounded out the picture at $1,290,000, up 3.20% from September and 1.18% above last October.
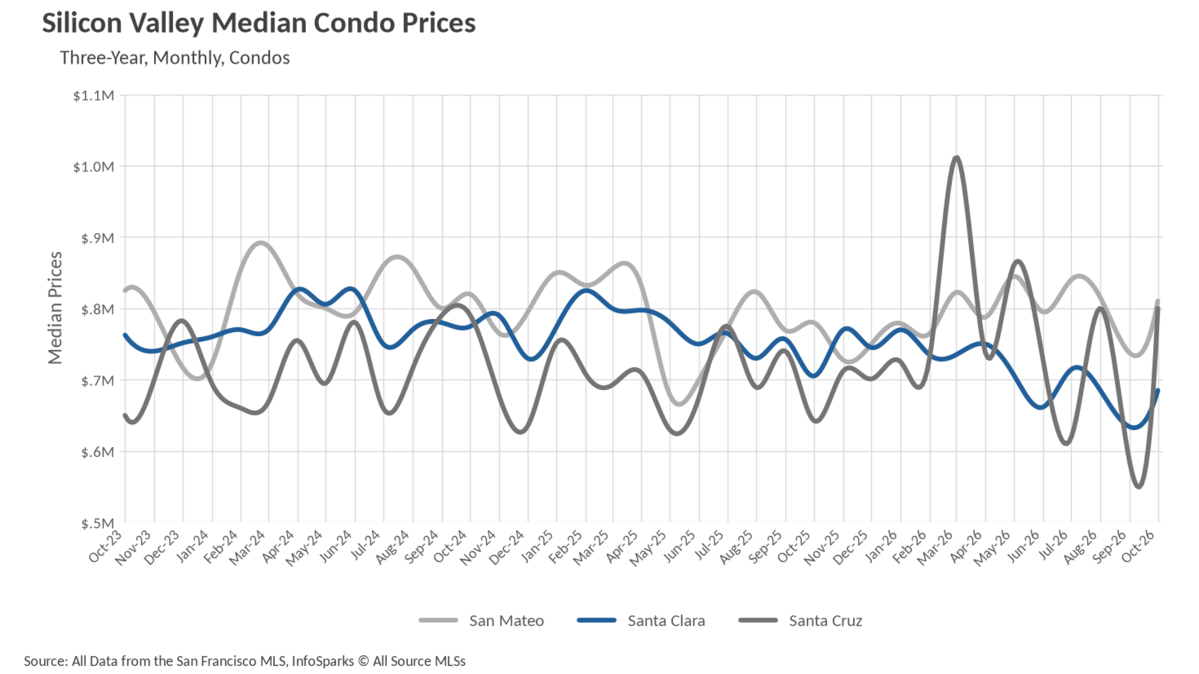
The condo market was more uneven. San Mateo County condos recovered from a soft September to finish at $810,500, up 9.90% for the month and 3.91% year over year, while Santa Clara County condos rebounded 8.04% from September to $685,000 but remain 2.84% below last October. Santa Cruz County's small condo segment swung sharply higher to $800,000, a 24.51% year-over-year gain that reflects the thin transaction volume behind that number as much as any underlying trend.
Silicon Valley Housing Inventory and New Listings
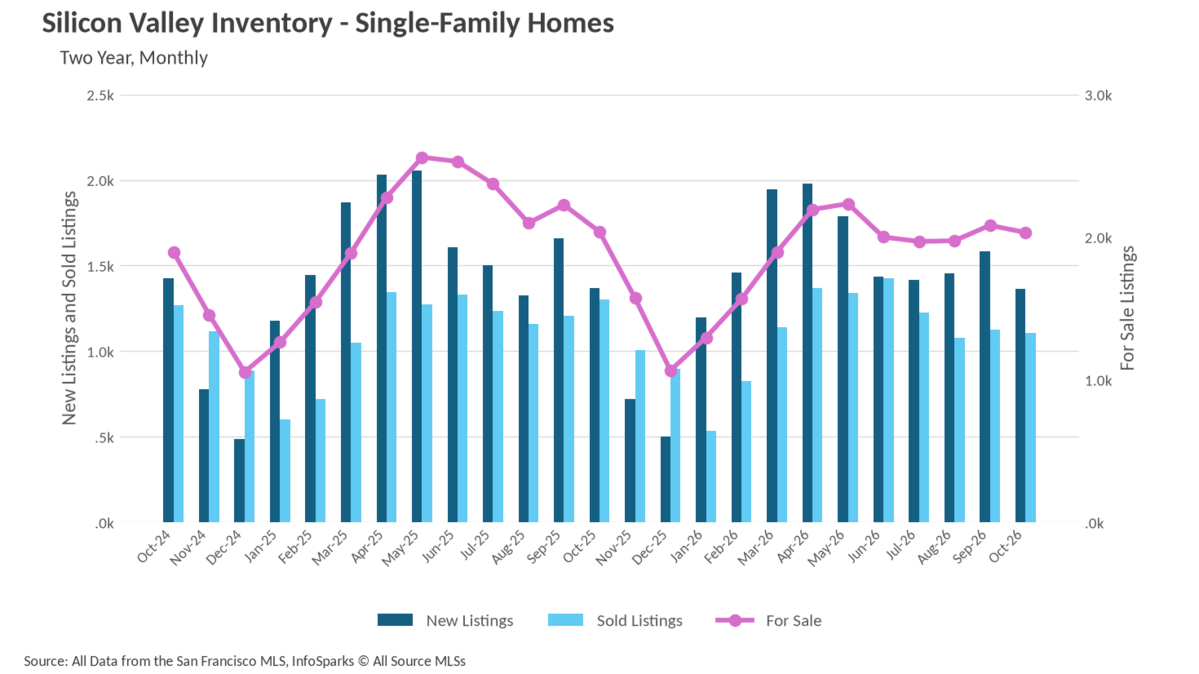
The single-family inventory story in Silicon Valley is one of remarkable stability this fall. There are currently 2,032 single-family homes for sale across the region, virtually unchanged from the 2,037 available last October and down 2.40% from September's 2,082. New listings told the same story, with 1,366 homes coming to market compared with 1,368 a year ago. The notable shift is on the demand side, where 1,106 single-family homes sold in October, a 15.18% decline from last year's 1,304 closings.
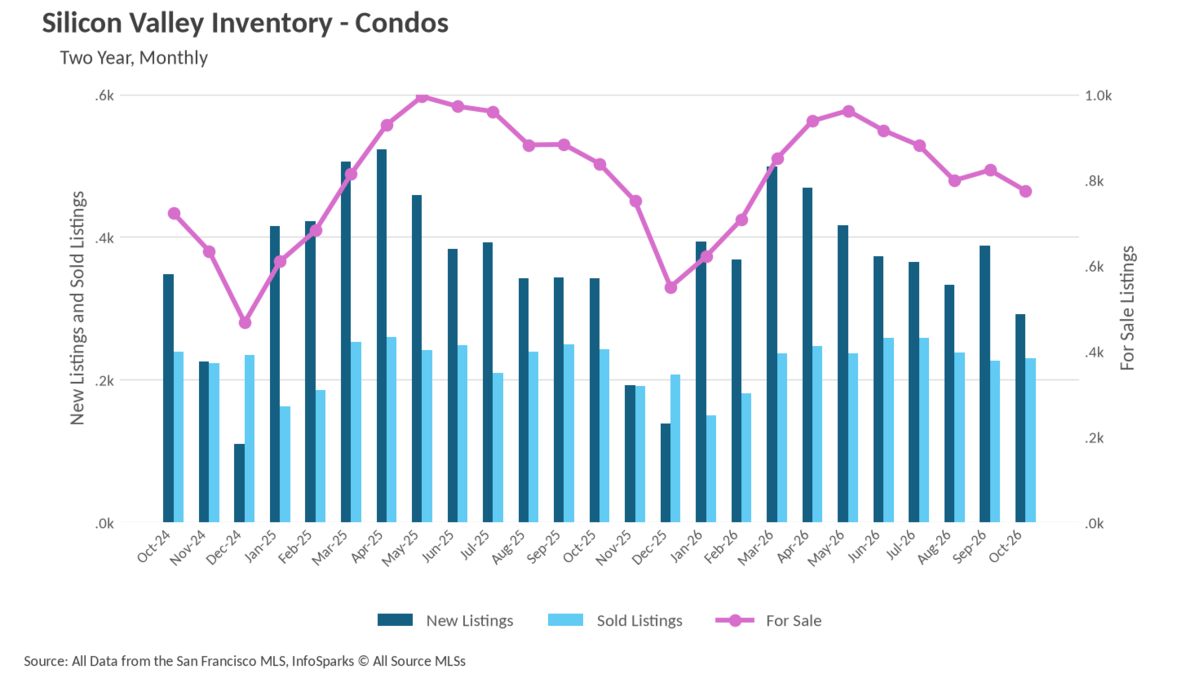
Condos are moving in a different direction, with 775 units currently for sale, down 7.52% year over year, as sellers pulled back meaningfully and brought just 292 new condo listings to market, a 14.62% drop from last October. Condo sales held up comparatively well at 230 closings, off 5.35% from a year ago.
How Fast Homes Sell in Silicon Valley: Days on Market
Pace remains one of the defining features of this market. In San Mateo County, the average single-family home sold in just 12 days, a 7.69% improvement over last October, and Santa Clara County matched that 12-day figure, unchanged from a year ago. Santa Cruz County continues to run slower at 28 days, though that is a 12.50% improvement over last October's 32 days and a step down from September's 29.
The most striking changes came from the condo segment, which has reversed last year's sluggishness. San Mateo County condos sold in an average of 20 days, down 37.50% from 32 days last October and the fastest reading in the past year. Santa Clara County condos averaged 27 days, a 34.15% improvement, while Santa Cruz County condos came in at 49 days, down 28.99% from last year's 69 days.
Is Silicon Valley a Buyer’s or Seller’s Market?
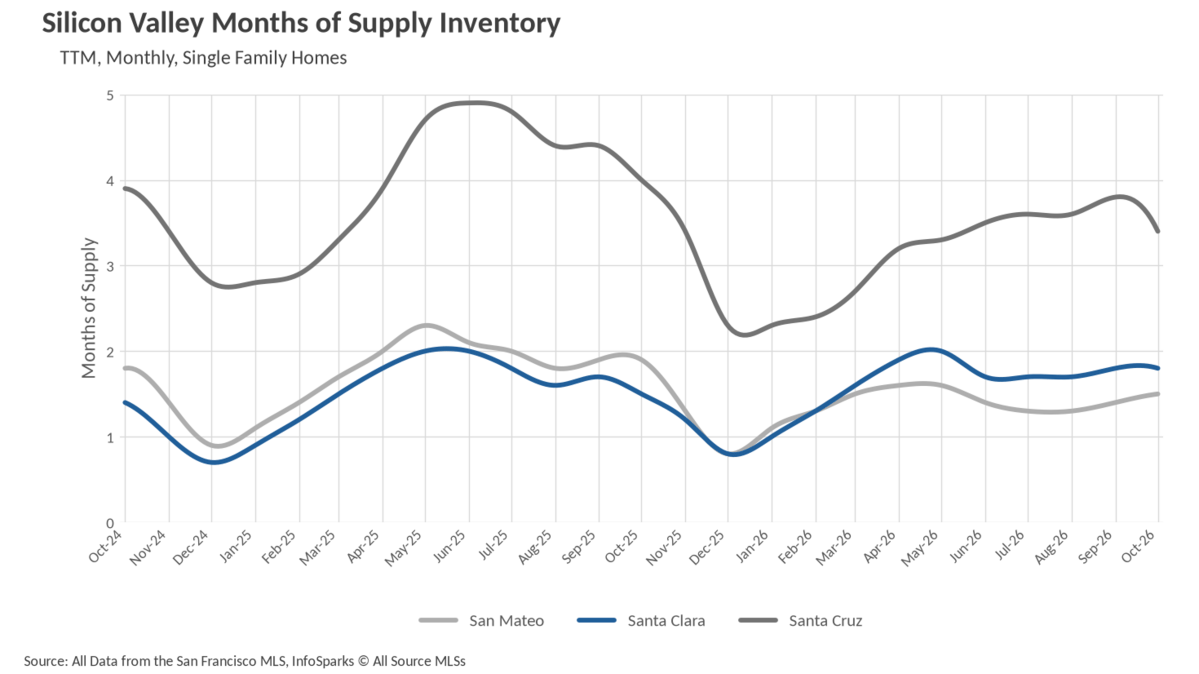
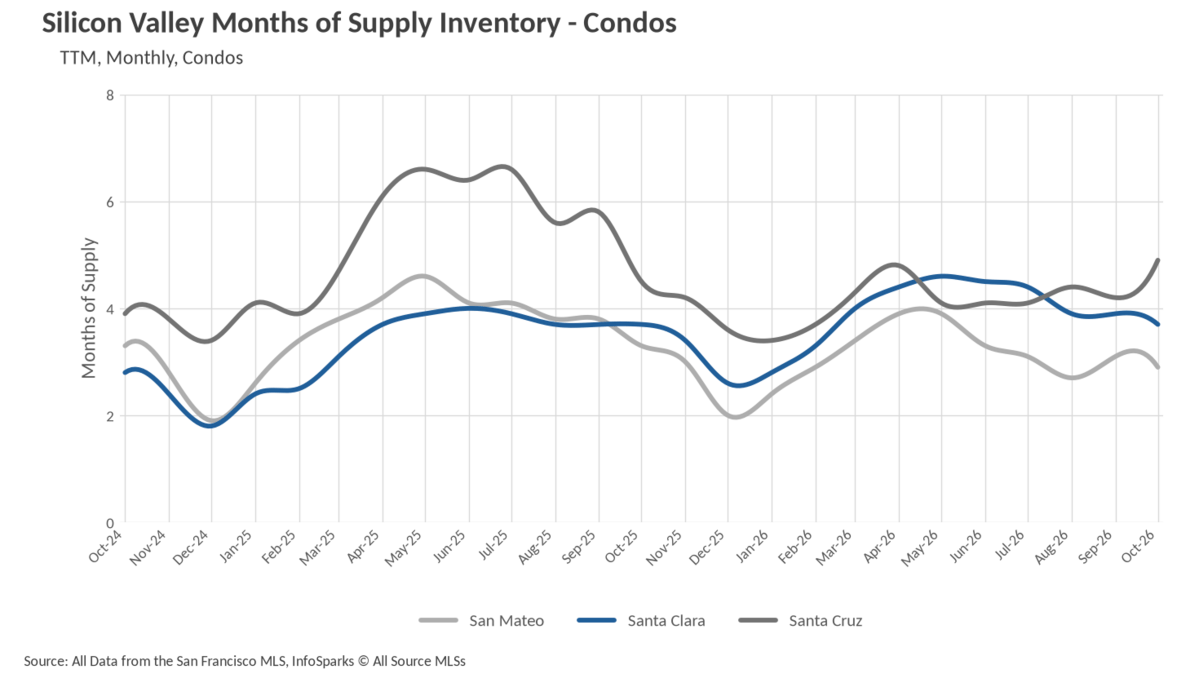
When determining whether a market is a buyers’ market or a sellers’ market, we look to the Months of Supply Inventory (MSI) metric. The state of California has historically averaged around three months of MSI, so any area with at or around three months of MSI is considered a balanced market. Any market that has lower than three months of MSI is considered a seller’s market, whereas markets with more than three months of MSI are considered buyers’ markets.
The single-family market across Silicon Valley sits well inside sellers' territory. San Mateo County has just 1.5 months of supply, down 21.05% from 1.9 months last October, while Santa Clara County carries 1.8 months, a 20% increase from 1.5 months a year ago but still far below balance. Santa Cruz County, long the loosest of the three, has tightened to 3.4 months from 4.0 months last October, a 15% decline that puts it just above balanced territory.
The condo picture is more mixed and generally friendlier to buyers. San Mateo County condos are at 2.9 months of supply, down 12.12% year over year and now a hair into sellers' territory, while Santa Clara County holds steady at 3.7 months, identical to last October and squarely balanced to slightly buyer-leaning. Santa Cruz County condos remain the clearest buyers' market in the region at 4.9 months, up 8.89% from 4.5 months a year ago. For buyers hunting a single-family home this fall, expect to compete; for those open to a condo, this is the most negotiating leverage the region has offered in some time.
Thinking about selling? Find out what your home is worth with a free home valuation or read our guide for sellers. Planning to buy? Start with our buyer resources and explore our Bay Area neighborhood and city guides, including San Mateo County and Santa Clara County, to see how conditions differ town by town. For a broader look at the region, see our Bay Area and San Francisco market updates.
Silicon Valley Housing Market Data: 12-Month Trends
Frequently Asked Questions About the Silicon Valley Housing Market
What is the median home price in Silicon Valley?
Based on the latest data, the median single-family sale price is $2,187,500 in San Mateo County, $2,050,000 in Santa Clara County and $1,290,000 in Santa Cruz County. Median condo prices are $810,500 in San Mateo, $685,000 in Santa Clara and $800,000 in Santa Cruz. Single-family prices are up from a year earlier in all three counties, while condo prices are up in San Mateo and Santa Cruz and down slightly in Santa Clara.
Is Silicon Valley a buyer's or seller's market?
For single-family homes, San Mateo County (1.5 months of supply) and Santa Clara County (1.8 months) are seller's markets. A market with about three months of supply is considered balanced, and fewer months favors sellers. Santa Cruz County, at 3.4 months, sits just above balanced territory. For condos, San Mateo (2.9 months) is slightly in sellers' territory, Santa Clara (3.7 months) is balanced to slightly buyer-leaning, and Santa Cruz (4.9 months) is the clearest buyers' market in the region.
How long does it take to sell a home in Silicon Valley?
Single-family homes average about 12 days in San Mateo and Santa Clara counties and 28 days in Santa Cruz County. Condos average 20 days in San Mateo, 27 days in Santa Clara and 49 days in Santa Cruz, with condo days on market down roughly a third from a year earlier in all three counties.
Are fewer homes being listed for sale in Silicon Valley?
Not on the single-family side, where 1,366 homes came to market in October compared with 1,368 a year ago. Condo sellers pulled back, bringing 292 new condo listings to market, about 15% fewer than last October.
How many homes are for sale in Silicon Valley?
There are about 2,032 single-family homes and 775 condos for sale across Silicon Valley. Single-family inventory is virtually unchanged from a year earlier, while there are roughly 8% fewer condos for sale.
Is now a good time to sell a home in Silicon Valley?
Single-family homes remain well inside sellers' territory, so buyers should expect to compete. Condo buyers have the most negotiating leverage the region has offered in some time. Pricing a home correctly for your specific area matters most, so ask Kinoko for a custom valuation based on recent sales near you.
Kevin Gueco | CA DRE #01461677