Silicon Valley - Aerial Views on Mountain View and Sunnyvale

Silicon Valley Real Estate Market Report - June 2025

The Local Lowdown

Quick Take:

  • Silicon Valley seems to have broken its growth streak that we’ve seen for nearly two years.
  • Inventories continue to build, as they reach new two-year highs.
  • Although inventories are building, single-family homes are not staying on the market for very long.

Note: You can find the charts/graphs for the Local Lowdown at the end of this section.

The growth streak has officially been broken

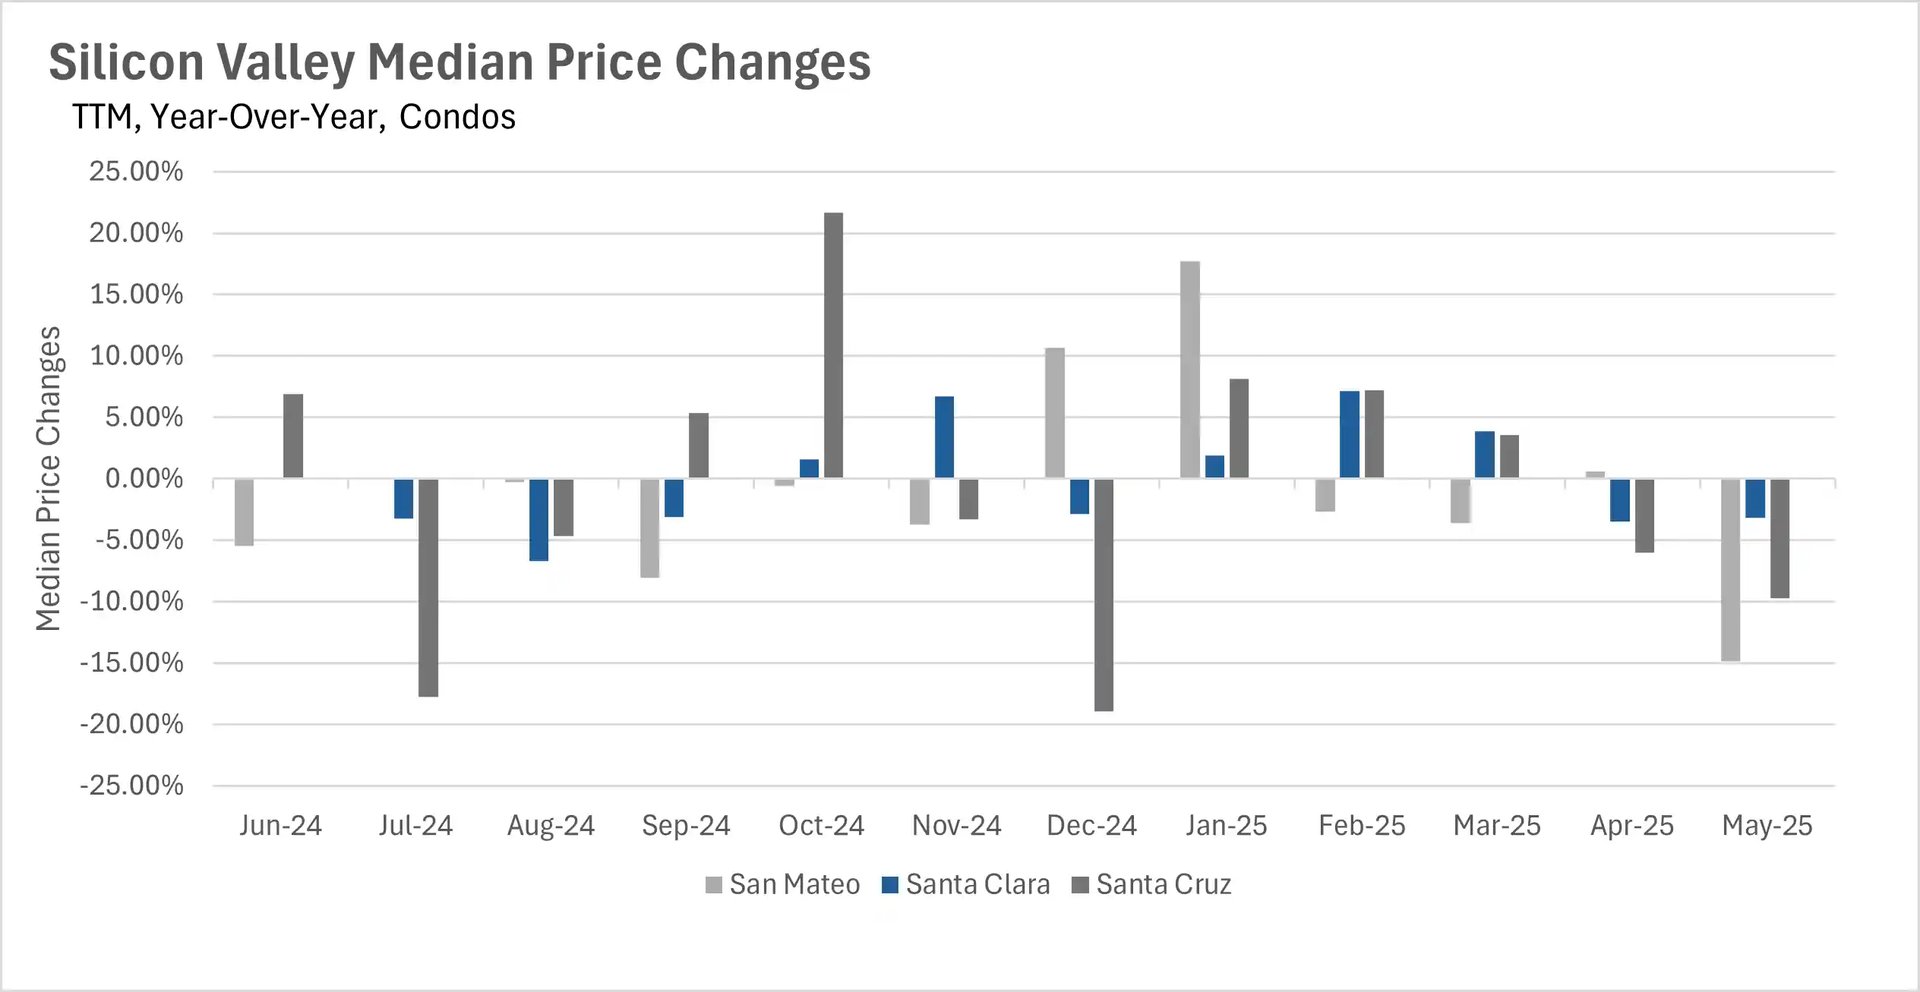
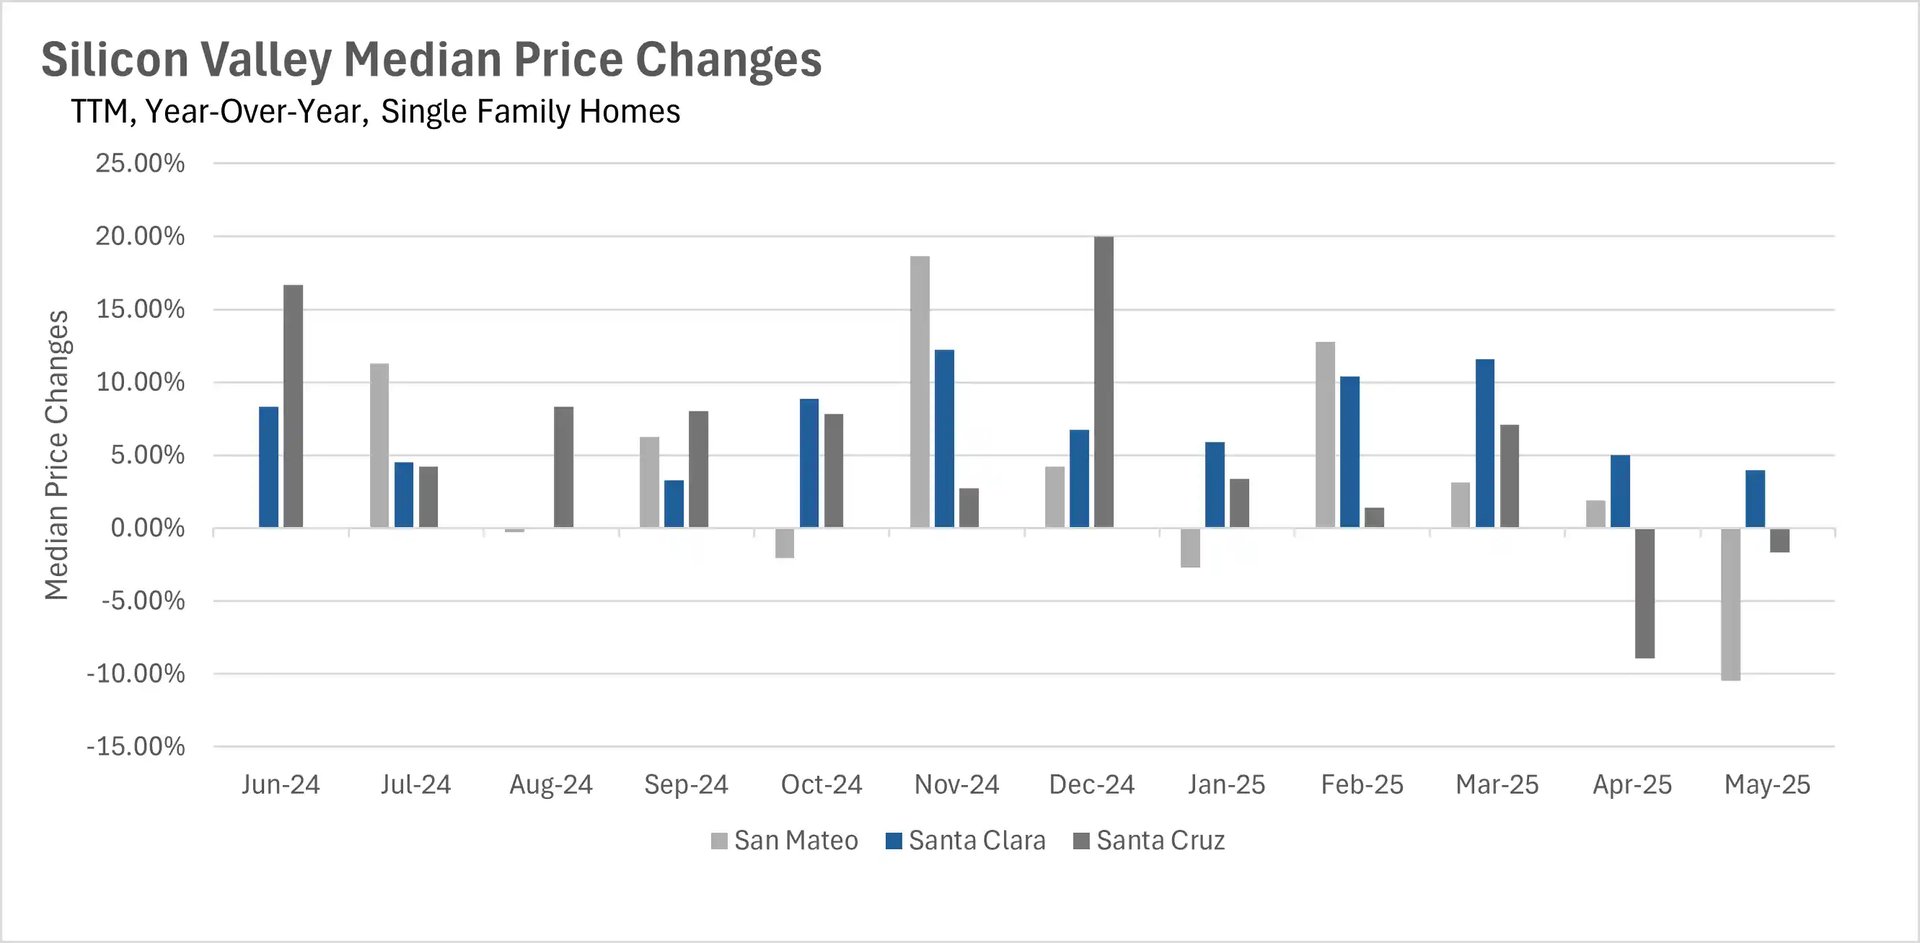
We’ve mentioned it quite a few times over the past few months, but for nearly two years, median sale prices for single-family homes in Silicon Valley seemed to only increase. However, this month, we saw some softness in the market, as median sale prices decreased by 1.65% on a year-over-year basis in Santa Cruz County, and 10.46% in San Mateo County. However, it’s worth noting that homes have not given back any of their value in Santa Clara County, which saw median sale prices increase by 3.99% on a year-over-year basis. In the condo market, we saw even more drastic declines, as median sale prices decreased on a year-over-year basis by 14.88% in San Mateo County, 3.19% in Santa Clara County, and 9.71% in Santa Cruz County.

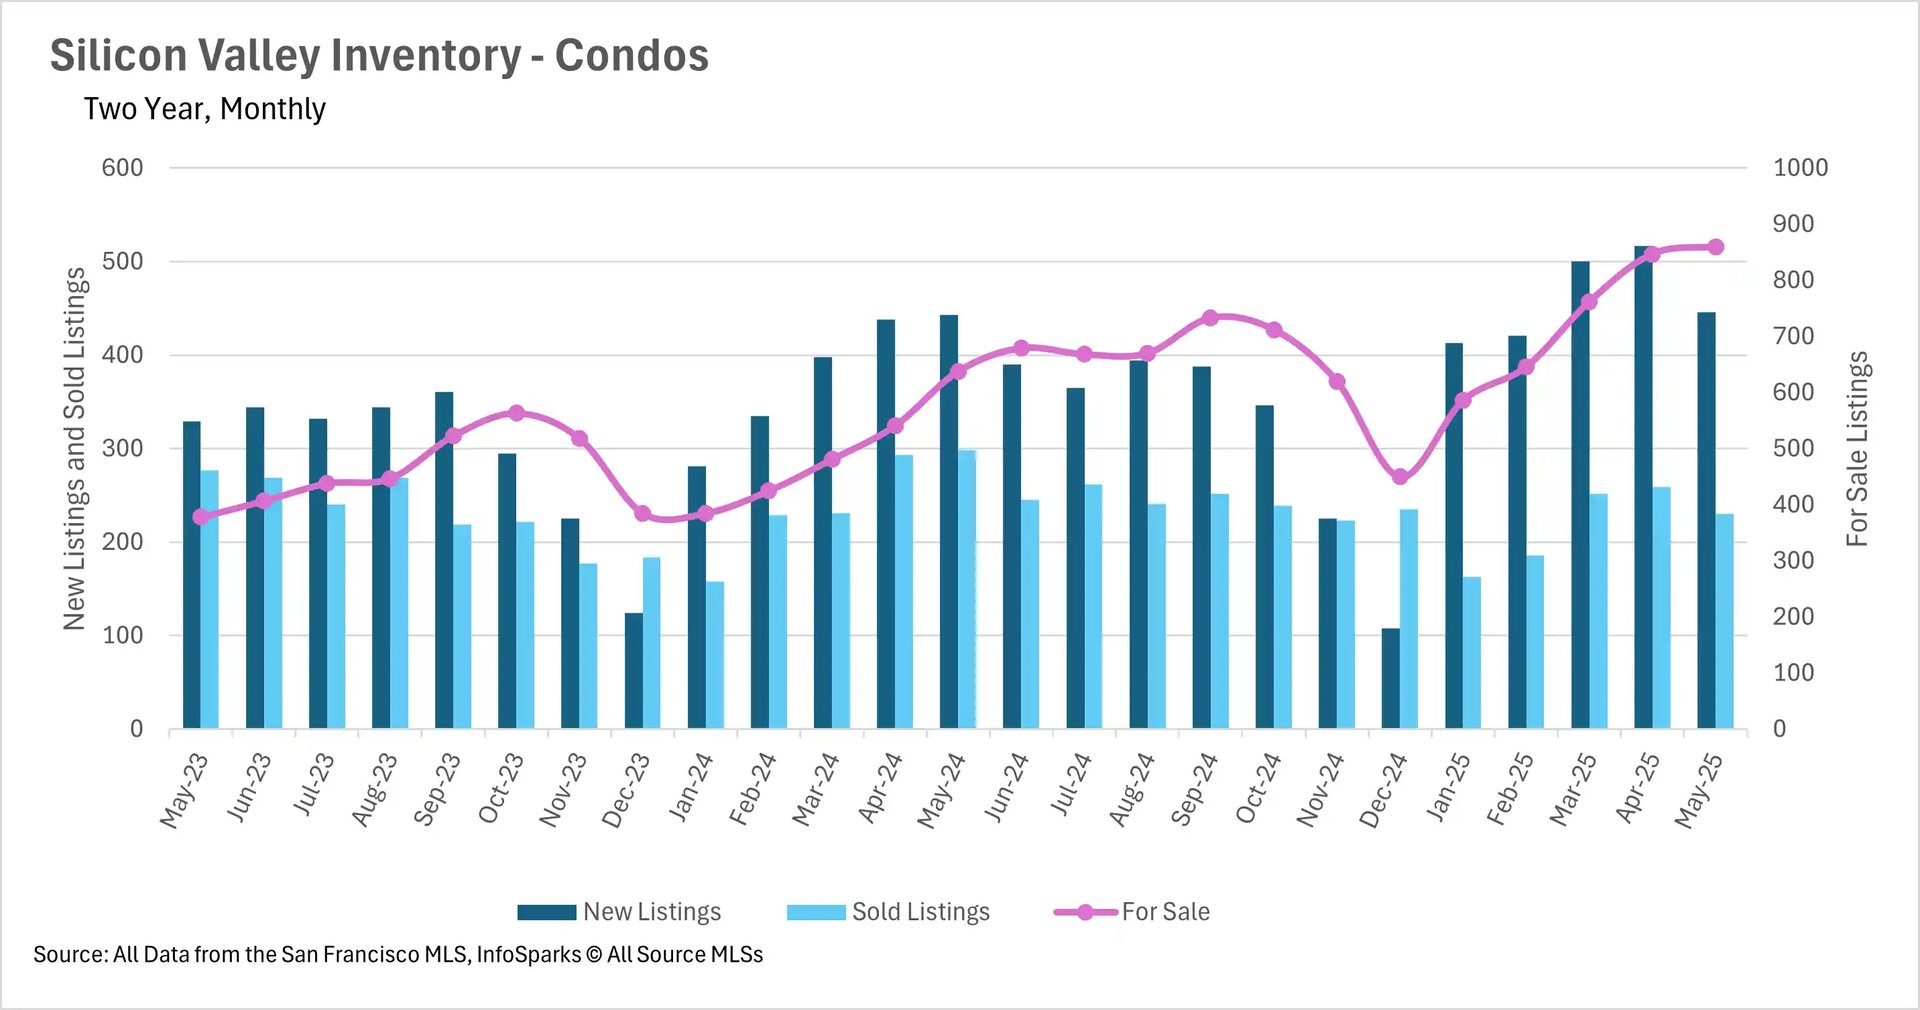
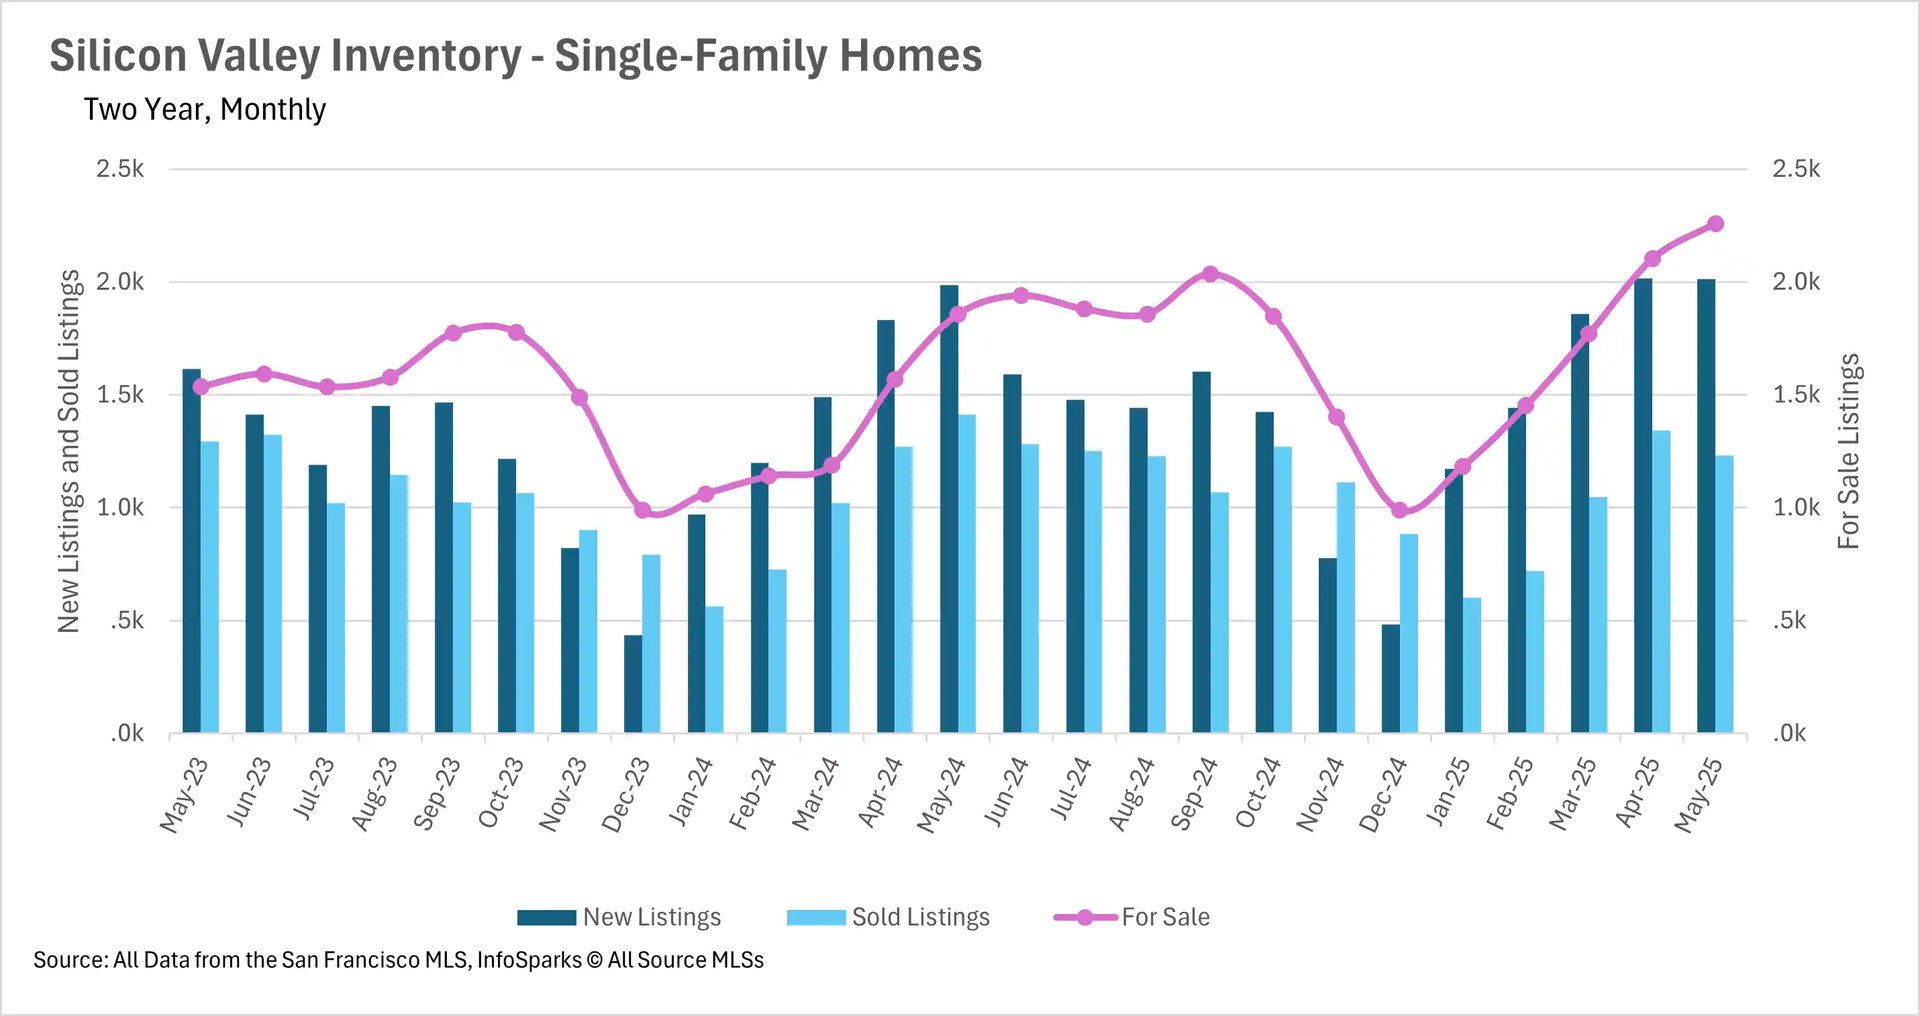
Inventory buildup shows no sign of stopping

In the month of May, we saw both the single-family and condo markets set new two-year records in terms of the number of active listings on the market. Single-family home inventories jumped by 21.65% on a year-over-year basis, and condo inventories jumped by 34.80%. Although slightly more new listings were added when compared to last year, there were drastically fewer sold listings. In fact, the condo market saw 22.82% fewer listings sell than this time last year, while the single-family market saw 13.01% fewer listings sell. This very well may be due to the uncertainty surrounding the trade war in April, due to the fact that it takes a few weeks for a listing to formally “sell”.

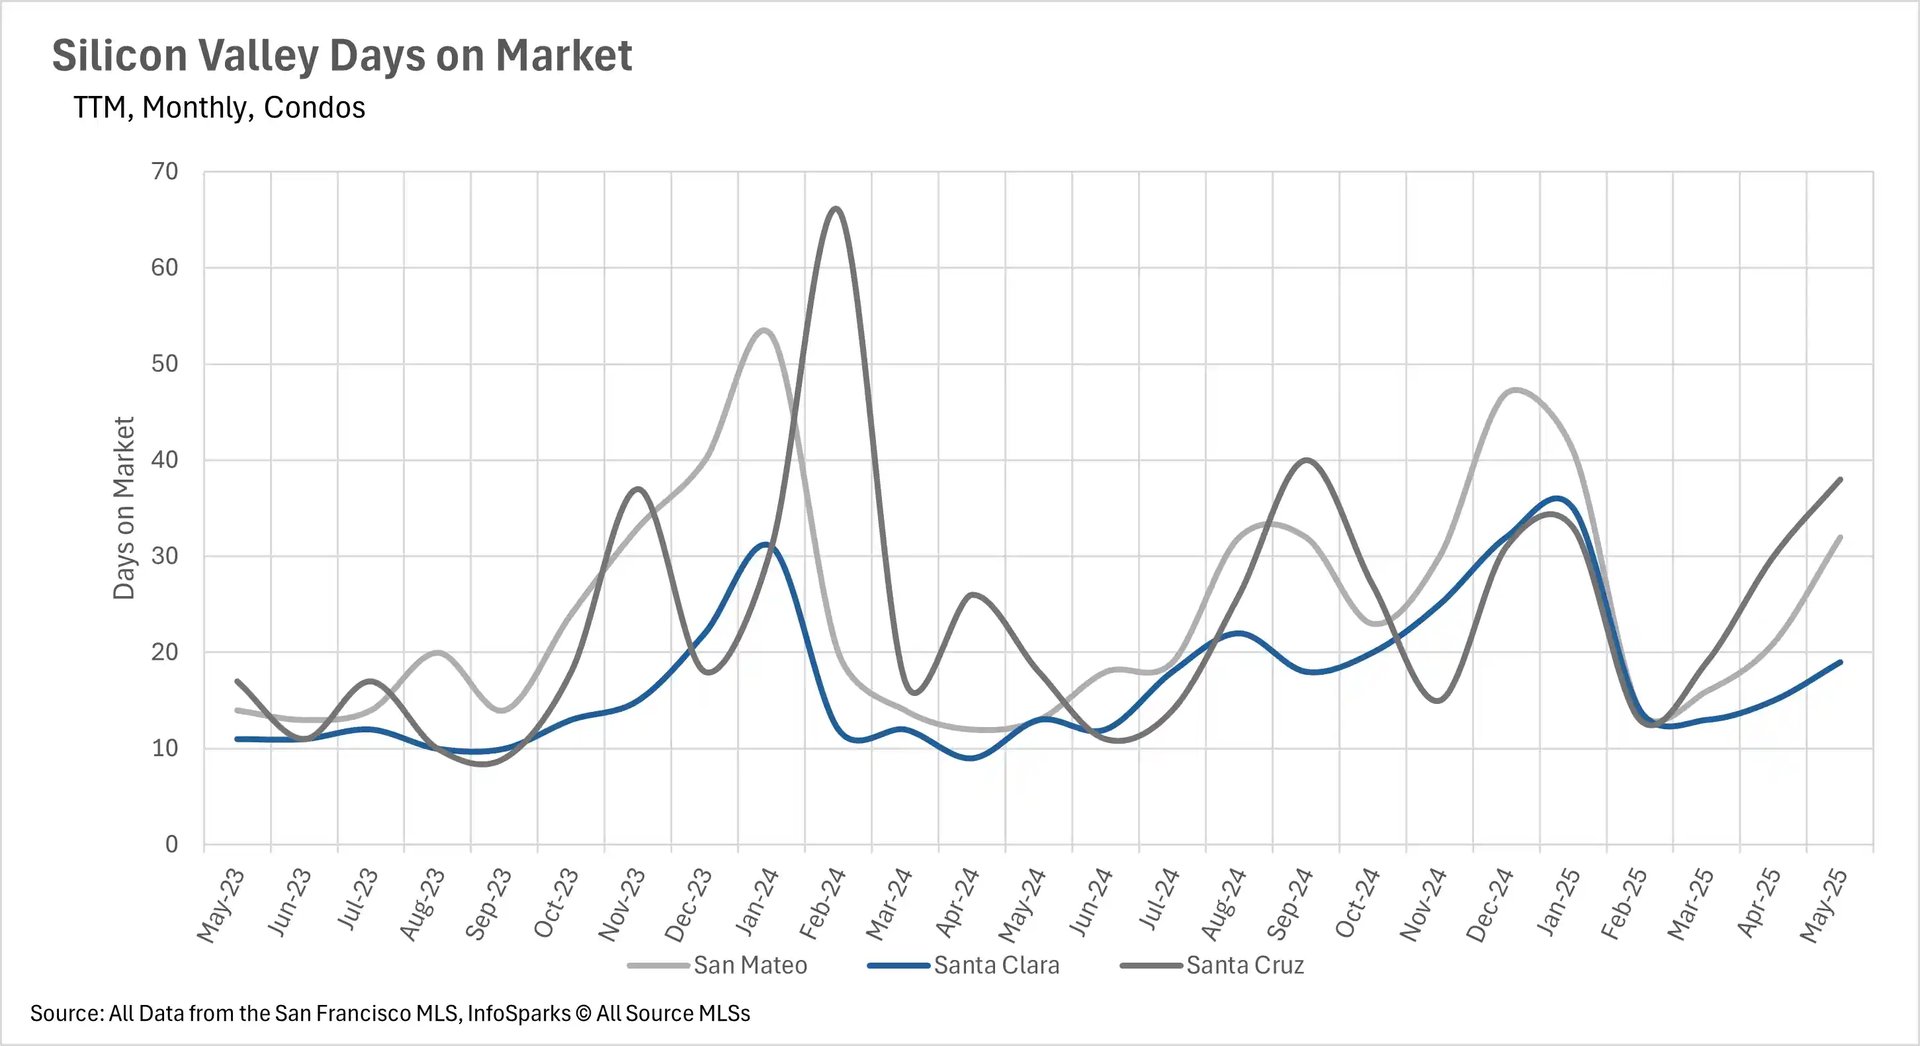
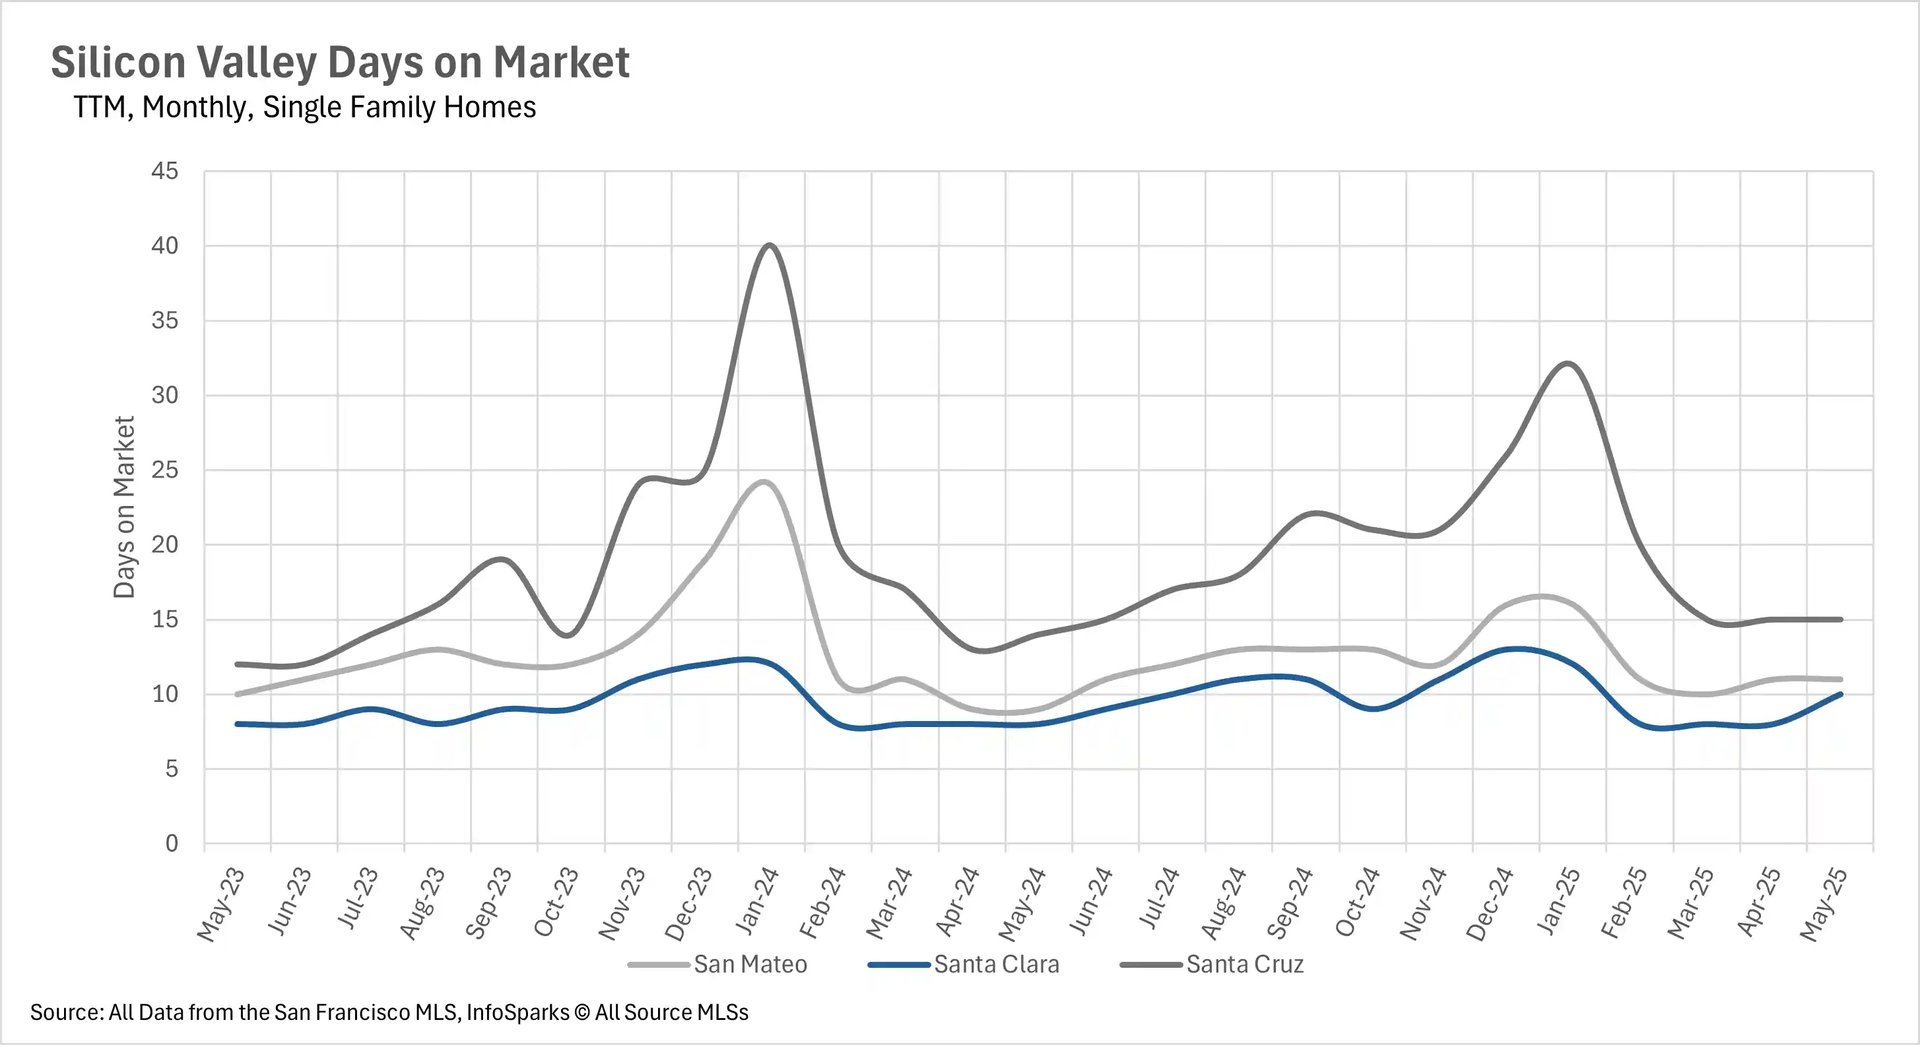
A huge opportunity in the condo market

Although single-family homes are within their long-term average in terms of the amount of time they are spending on the market, the average condo is spending a tremendous amount of time on the market, with condos spending 46.15%, 111.11%, and 146.15% more days on the market on a year-over-year basis in Santa Clara, Santa Cruz, and San Mateo Counties, respectively. When you combine this with increased levels of inventory, buyers might be able to find some incredibly motivated sellers, and purchase a great property for an even better price!

Silicon Valley is slowly becoming a buyers’ market

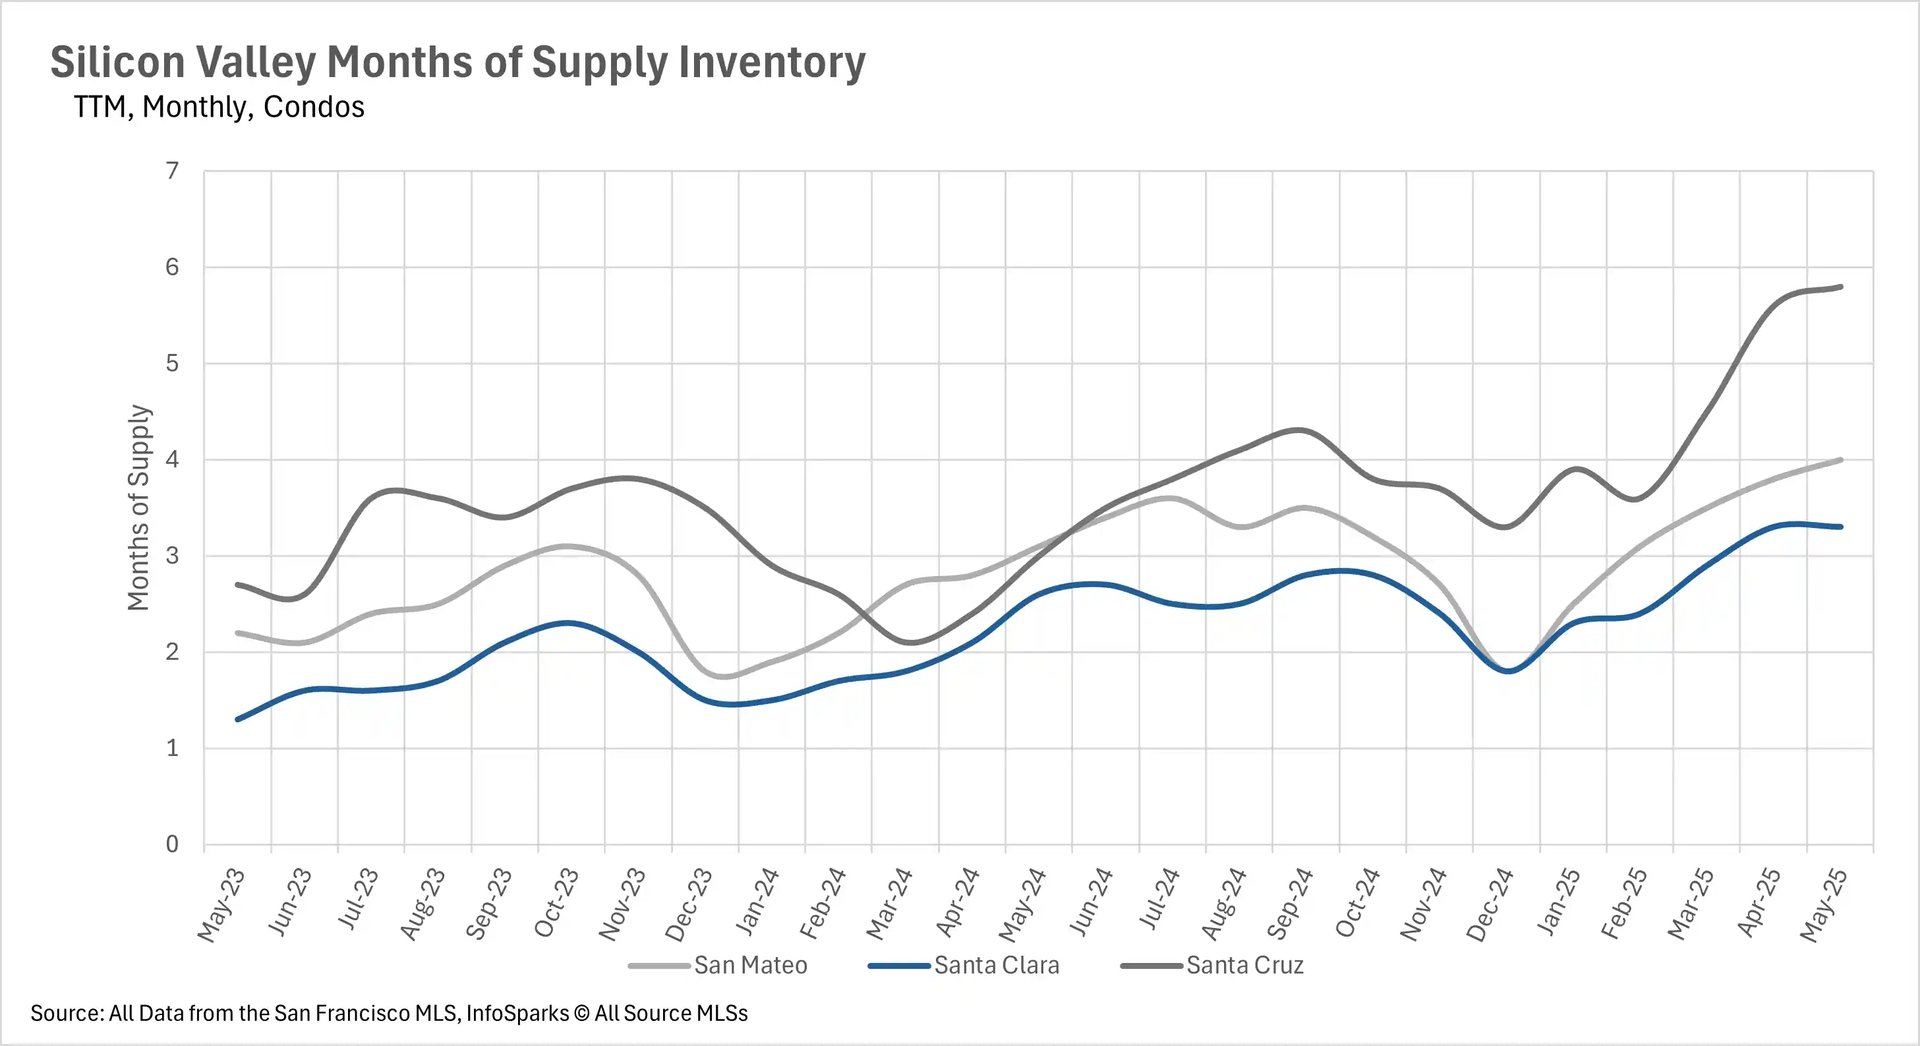
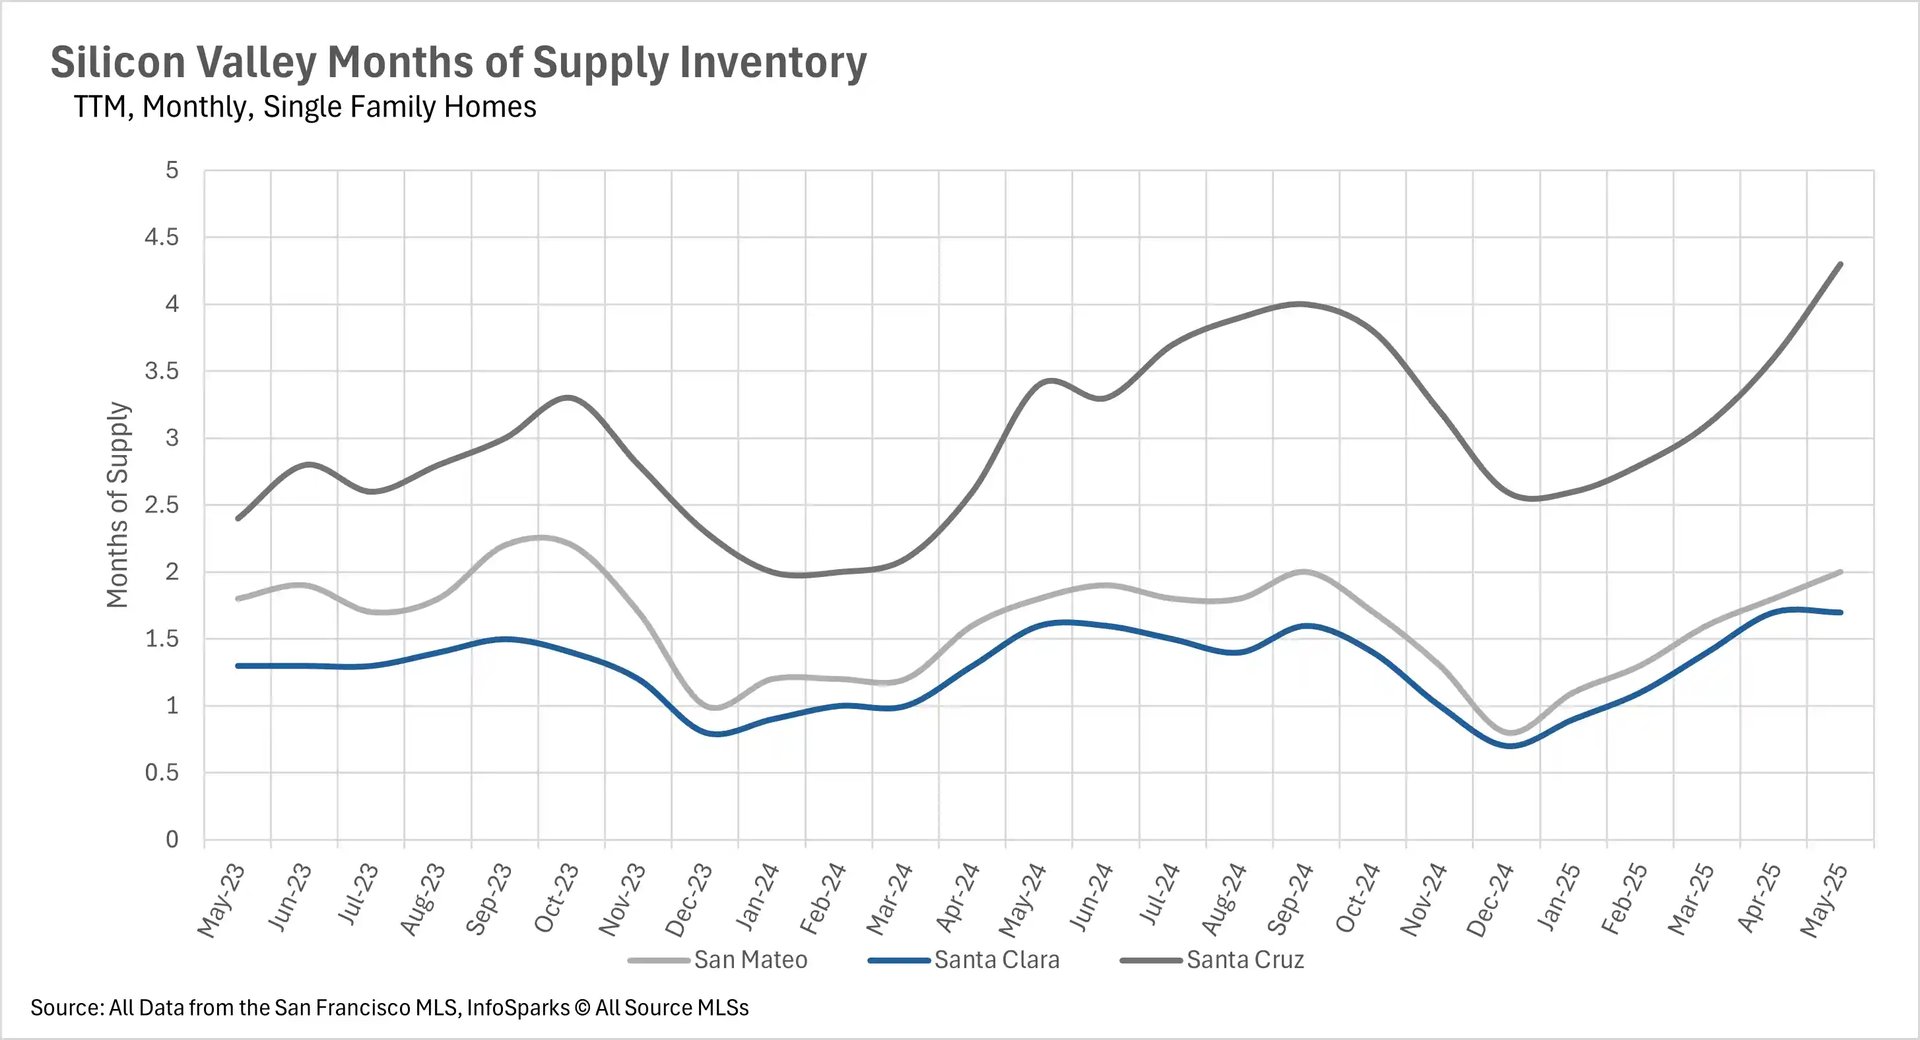
When determining whether a market is a buyers’ market or a sellers’ market, we look to the Months of Supply Inventory (MSI) metric. The state of California has historically averaged around three months of MSI, so any area with at or around three months of MSI is considered a balanced market. Any market that has lower than three months of MSI is considered a sellers’ market, whereas markets with more than three months of MSI are considered buyers’ markets.

Silicon Valley has largely become a buyers’ market at this point in time. When we look at the condo market, there are 4 months’ worth of supply on the market in San Mateo County, 3.3 months in Santa Clara County, and 5.8 months in Santa Cruz County, making them all buyers’ markets. However, turning to the single-family home market, only Santa Cruz County is a sellers’ market, with 4.3 months worth of supply available. San Mateo and Santa Clara Counties are both sellers’ markets, with 2 and 1.7 months’ worth of supply on the market, respectively.

Local Lowdown Data

Line chart showing Silicon Valley condo days on market from May 2023 to May 2025 for San Mateo, Santa Clara, and Santa Cruz counties. Santa Cruz shows highest volatility with peaks around 65 days in February 2024 and 47 days in December 2024. Santa Clara remains most stable, generally between 10-35 days. All counties show seasonal patterns with higher days on market in winter months.

Line chart displaying Silicon Valley single-family home days on market from May 2023 to May 2025. Santa Cruz shows highest values, peaking at 40 days in January 2024 and 32 days in February 2025. Santa Clara maintains lowest and most stable values between 7-13 days throughout the period. San Mateo shows moderate values with some seasonal variation.

Combination bar and line chart showing Silicon Valley condo inventory over two years. Dark blue bars represent new listings, light blue bars show sold listings, and pink line tracks total for-sale inventory. Inventory peaks around 850 units in May 2025, with notable increases from late 2024 onwards. New listings generally range from 100-500 units monthly.

Combination bar and line chart depicting Silicon Valley single-family home inventory. Shows new listings (dark blue bars), sold listings (light blue bars), and for-sale inventory (pink line). For-sale inventory reaches highest levels around 2,200-2,300 units in early 2025. New listings typically range from 500-2,000 units monthly with seasonal variations.

Bar chart showing year-over-year median price changes for Silicon Valley condos from June 2024 to May 2025. Santa Cruz shows most volatility with changes ranging from -20% to +22%. Santa Clara generally shows positive growth between 0-7%. San Mateo displays mixed results with both positive and negative changes throughout the period.

Line chart tracking Silicon Valley median condo prices over three years from May 2022 to May 2025. San Mateo shows highest prices around $850K-$950K with significant volatility. Santa Clara maintains more stable prices around $650K-$850K. Santa Cruz shows lowest prices around $600K-$700K with moderate fluctuations.

Bar chart displaying year-over-year median price changes for Silicon Valley single-family homes from June 2024 to May 2025. Santa Cruz shows highest volatility with peaks of 20% growth in December 2024 and negative growth in recent months. Santa Clara shows consistent positive growth mostly between 5-12%. San Mateo shows mixed results with recent negative trends.

Line chart showing Silicon Valley median single-family home prices over three years. San Mateo commands highest prices, reaching peaks around $2.2-2.3M in recent months. Santa Clara follows with prices around $1.5-2.1M, showing strong recent growth. Santa Cruz maintains lowest prices around $1.0-1.4M with gradual appreciation.

Line chart depicting months of supply inventory for Silicon Valley condos from May 2023 to May 2025. Santa Cruz shows highest supply levels, reaching nearly 6 months by May 2025. San Mateo reaches around 4 months of supply. Santa Clara maintains lowest supply levels around 3.3 months, indicating tightest market conditions.

Line chart showing months of supply for Silicon Valley single-family homes. Santa Cruz reaches highest supply levels around 4.3 months by May 2025. San Mateo shows moderate supply around 2 months. Santa Clara maintains lowest supply at approximately 1.7 months, indicating strongest seller's market conditions among the three counties.

Let’s Talk

You’ve got questions and we can’t wait to answer them.

Follow Us on Instagram