The Local Lowdown
Quick Take:
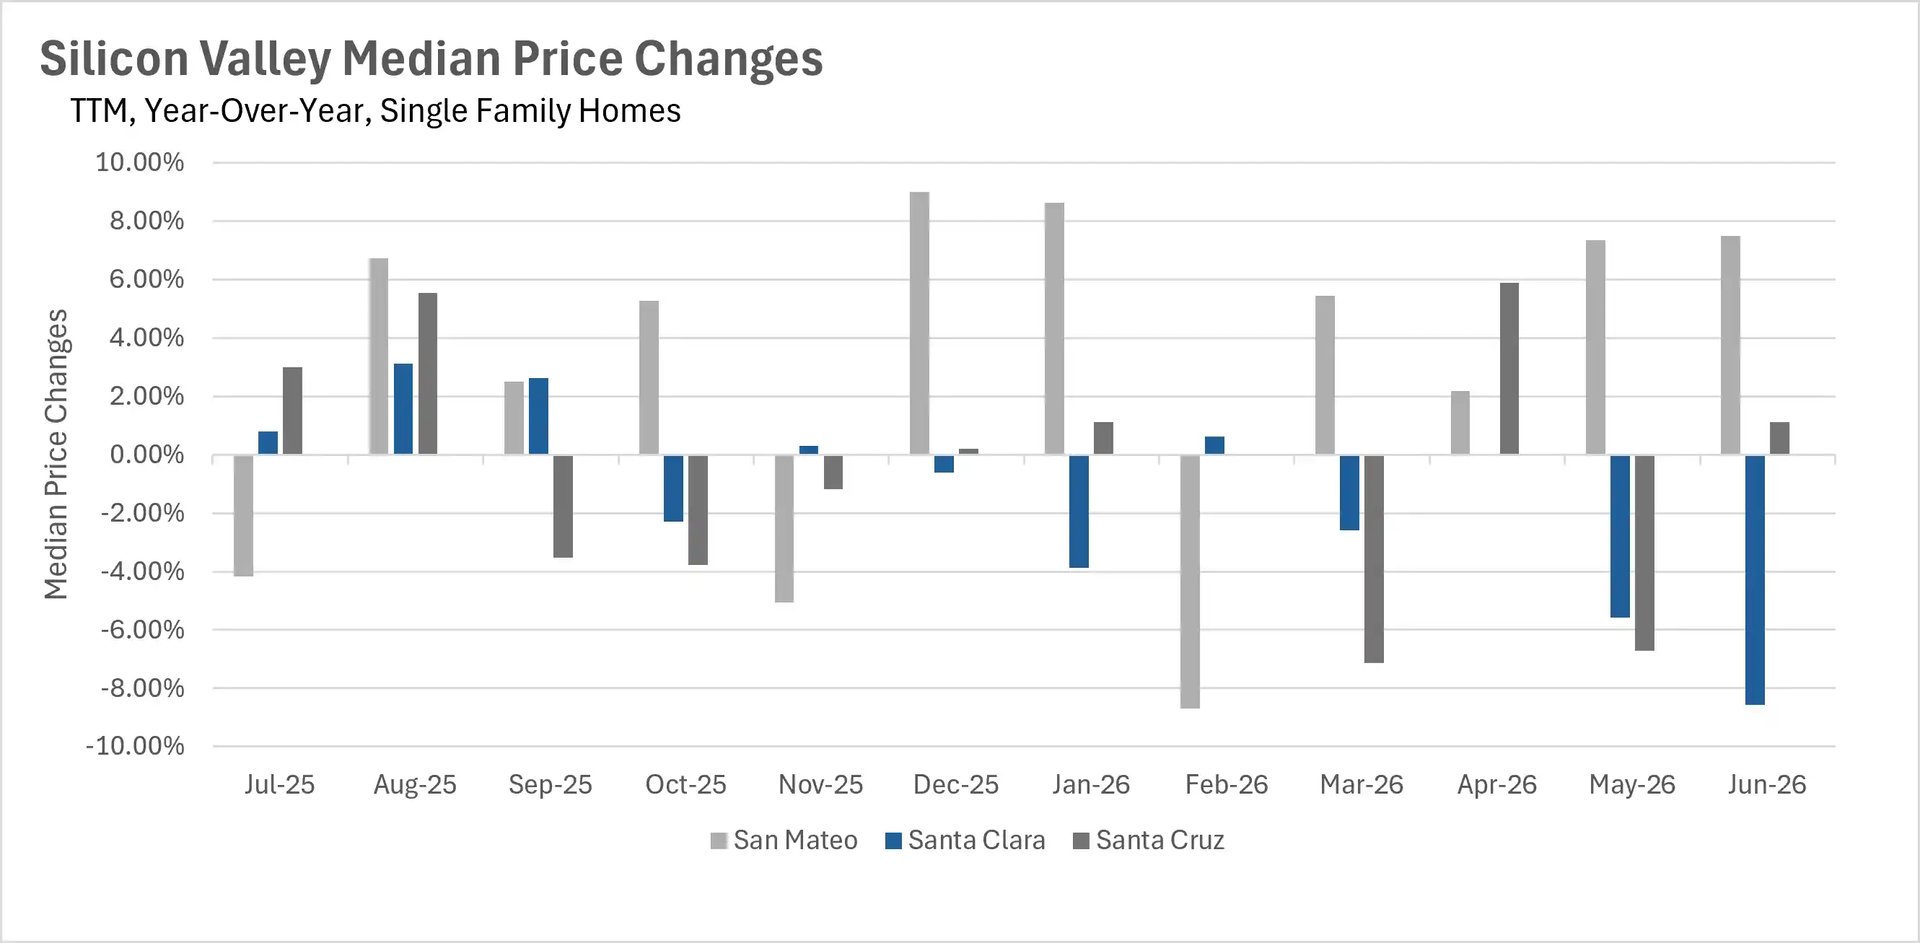
Single-family median sale prices showed a split picture in June, with San Mateo County posting strong gains while Santa Clara County experienced a notable year-over-year decline.
Inventory levels have dropped dramatically, with single-family home inventory down more than 26% year-over-year as buyer demand continues to outstrip supply.
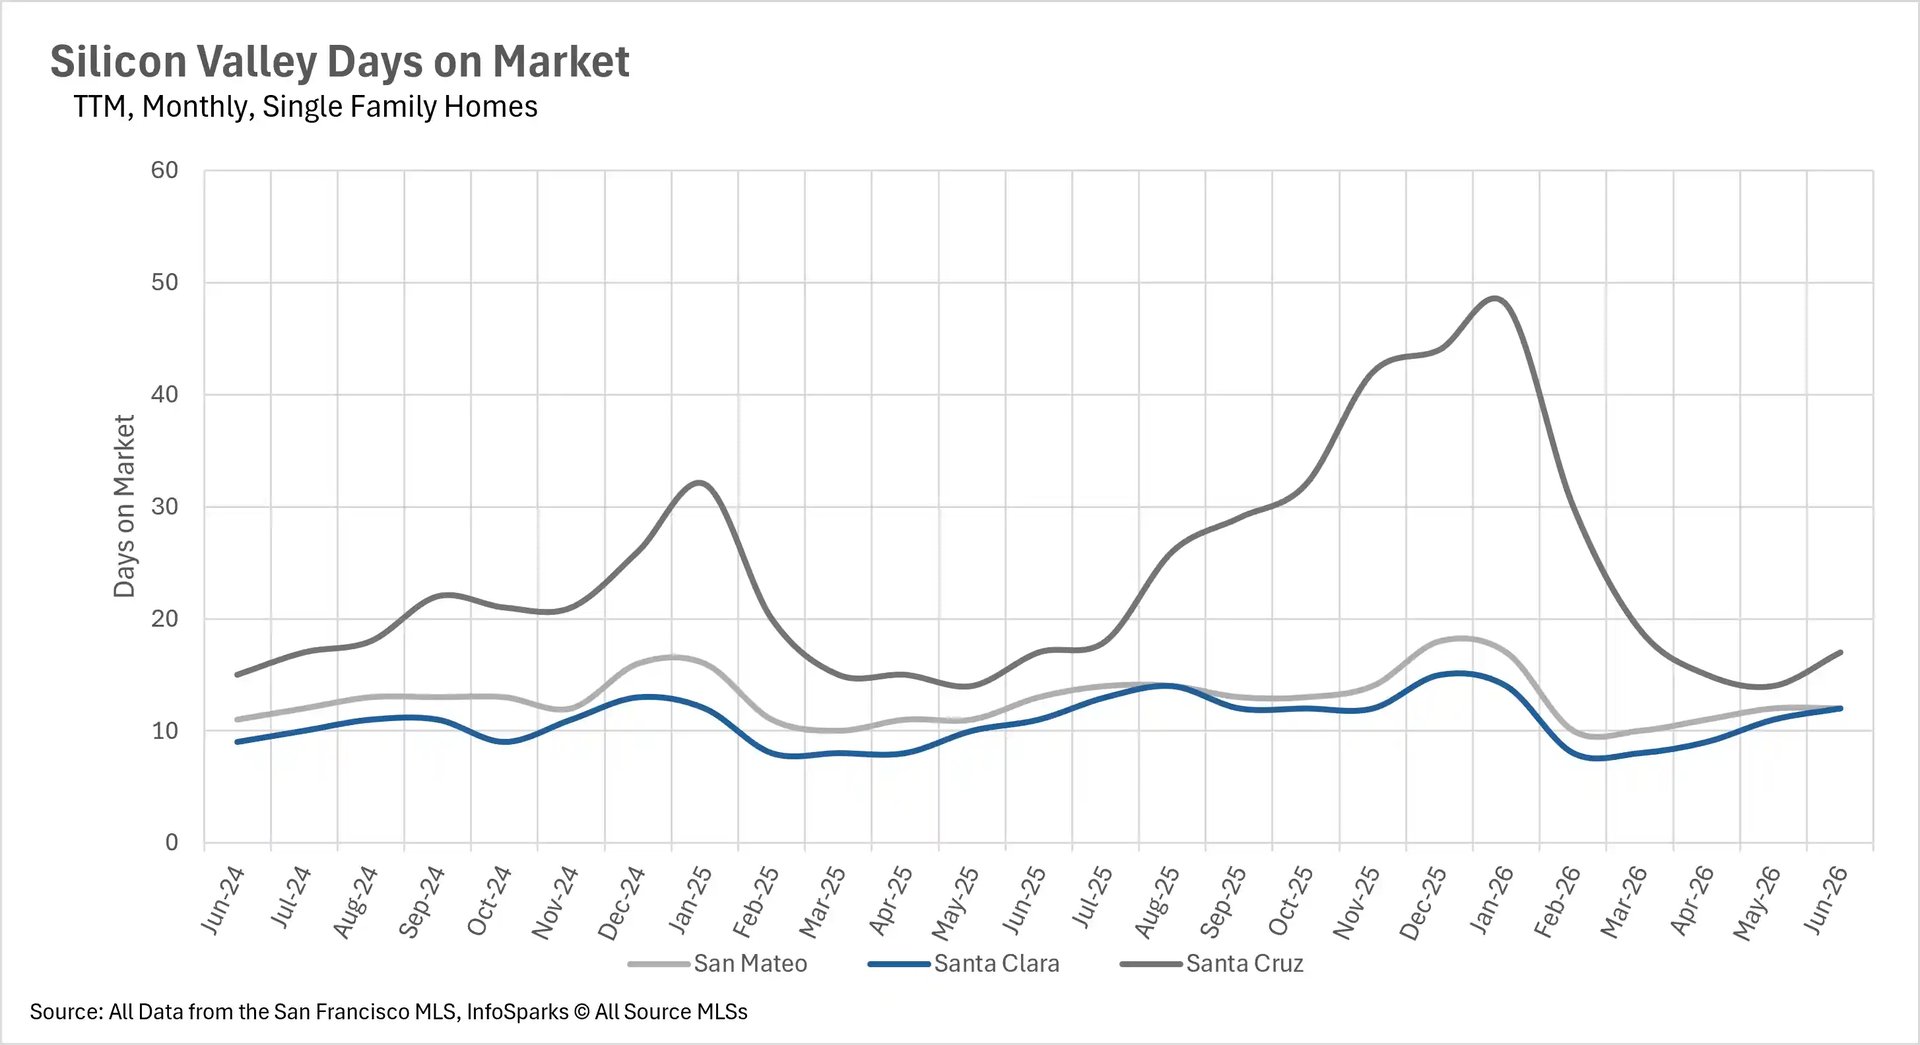
Single-family homes are selling in under two weeks across the region, with buyers acting quickly in this competitive market.
Note: You can find the charts/graphs for the Local Lowdown at the end of this section.
San Mateo County shines while Santa Clara stumbles
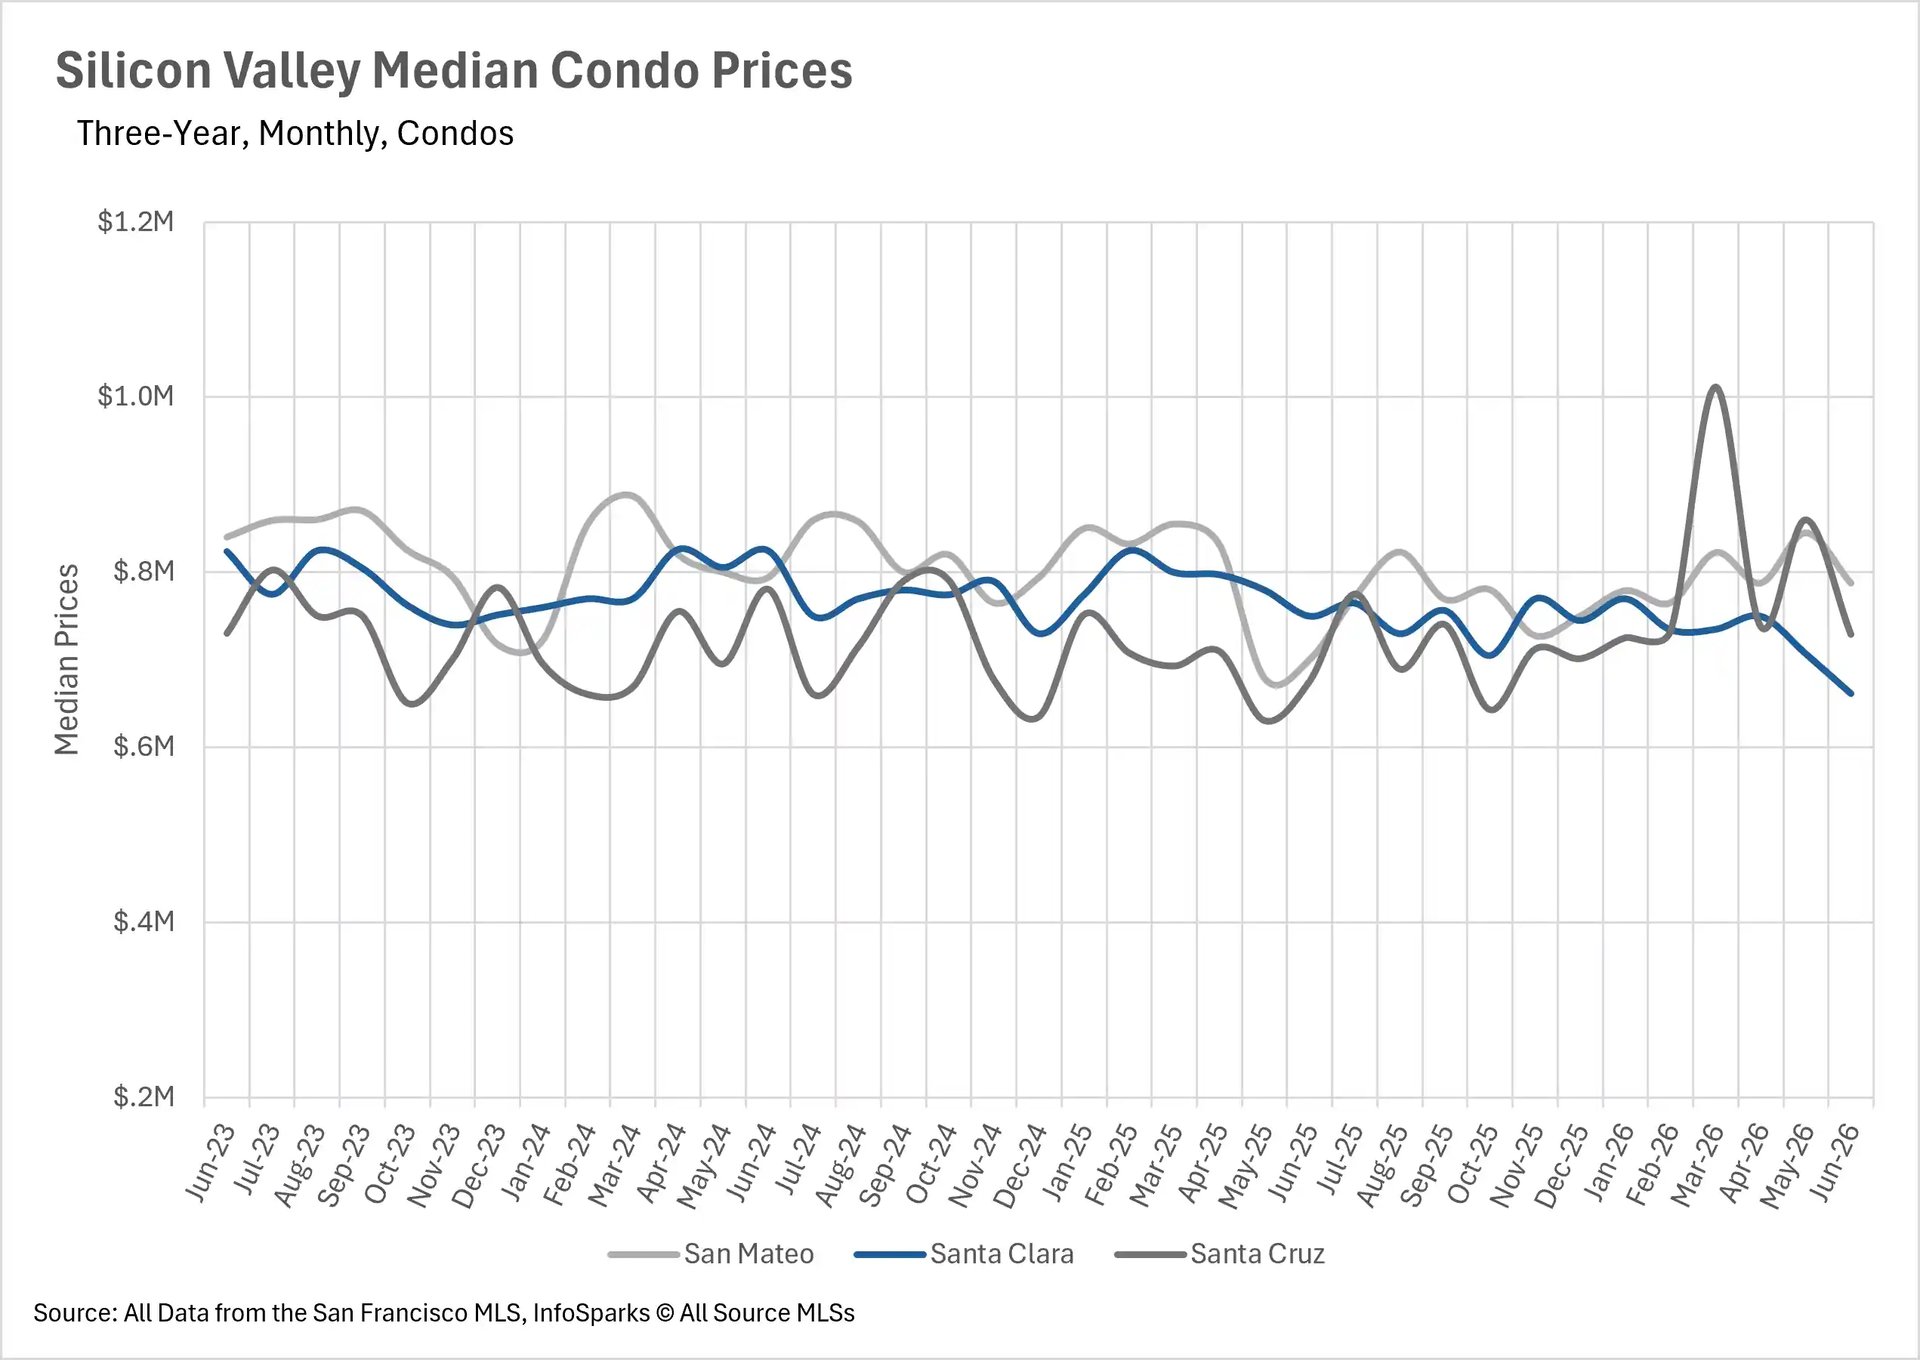
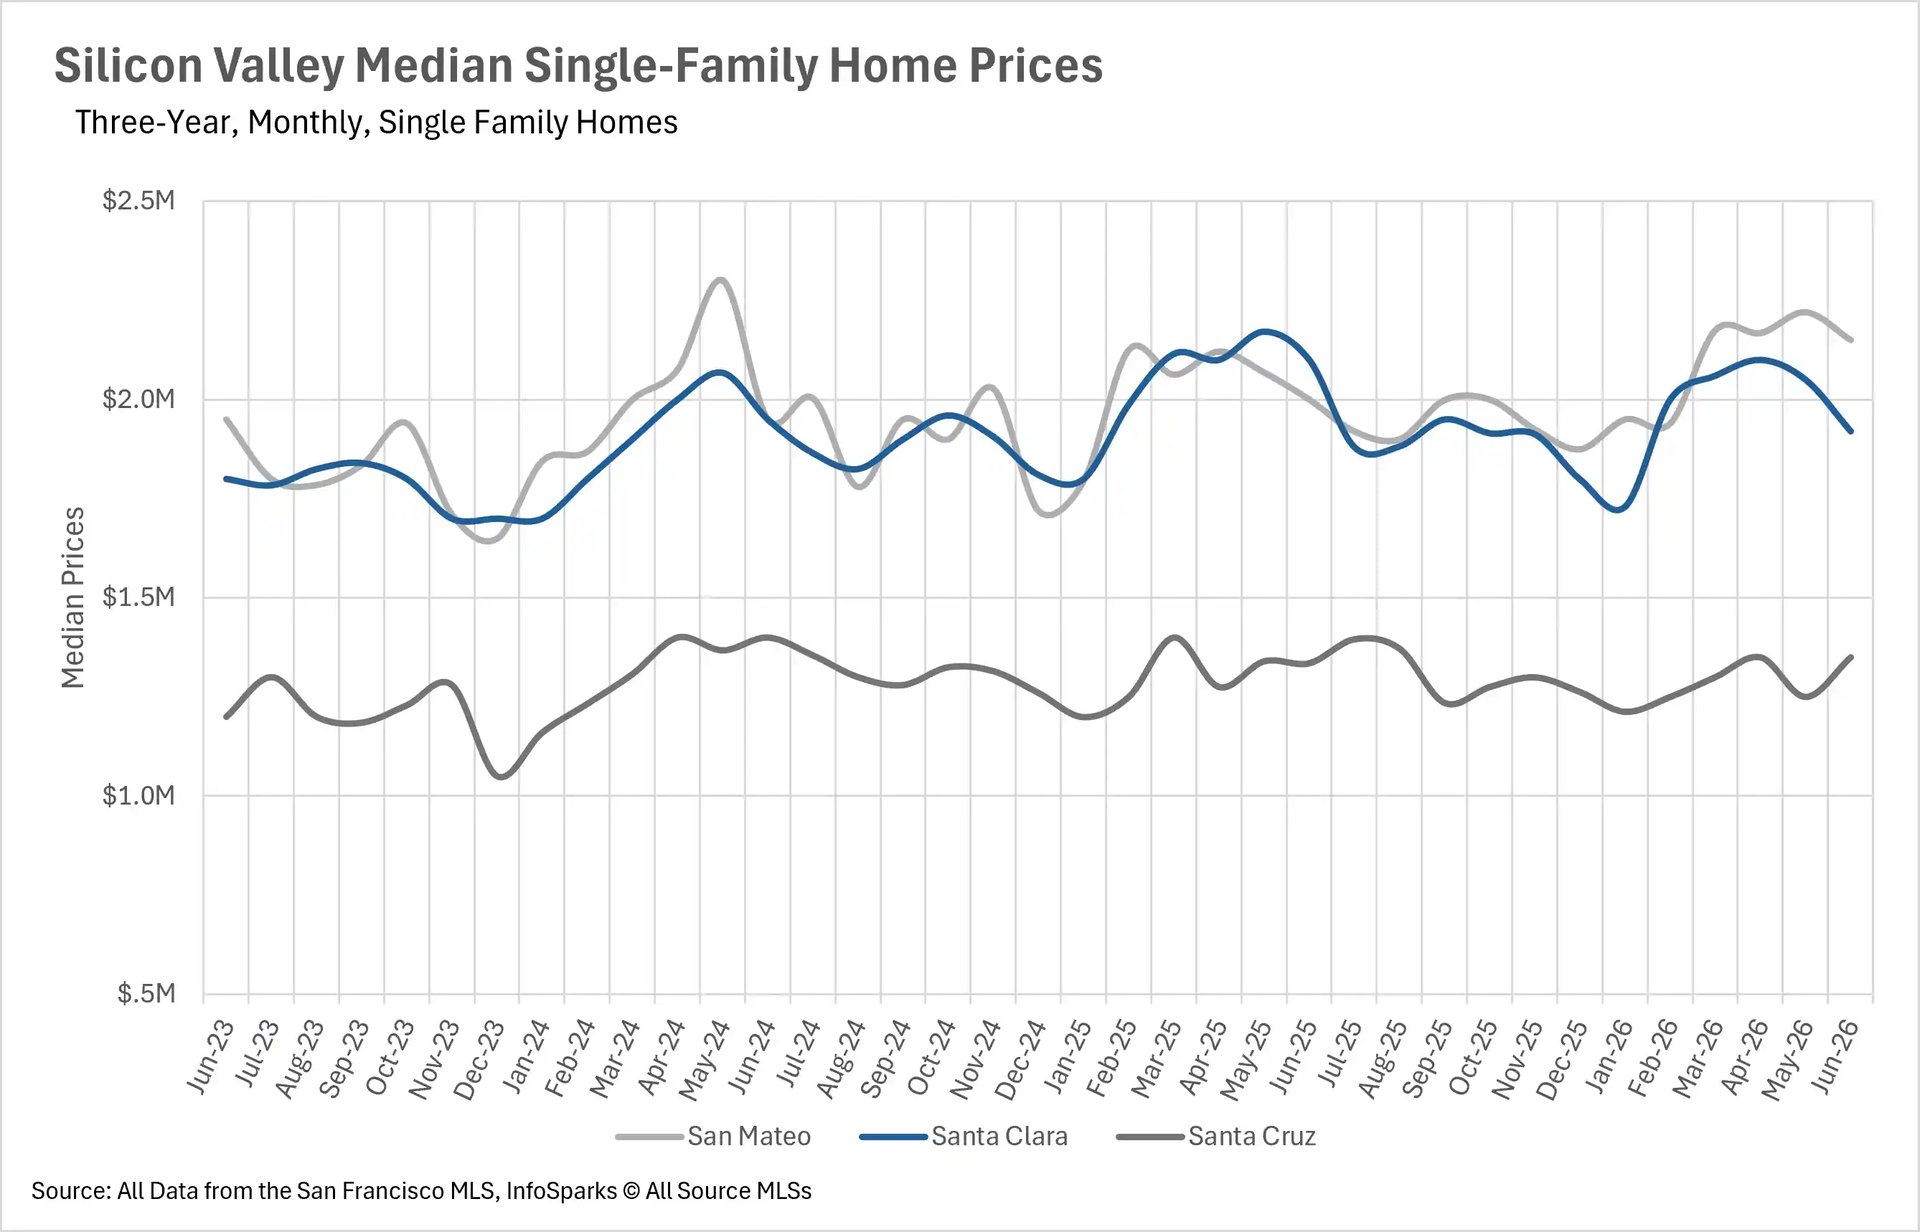
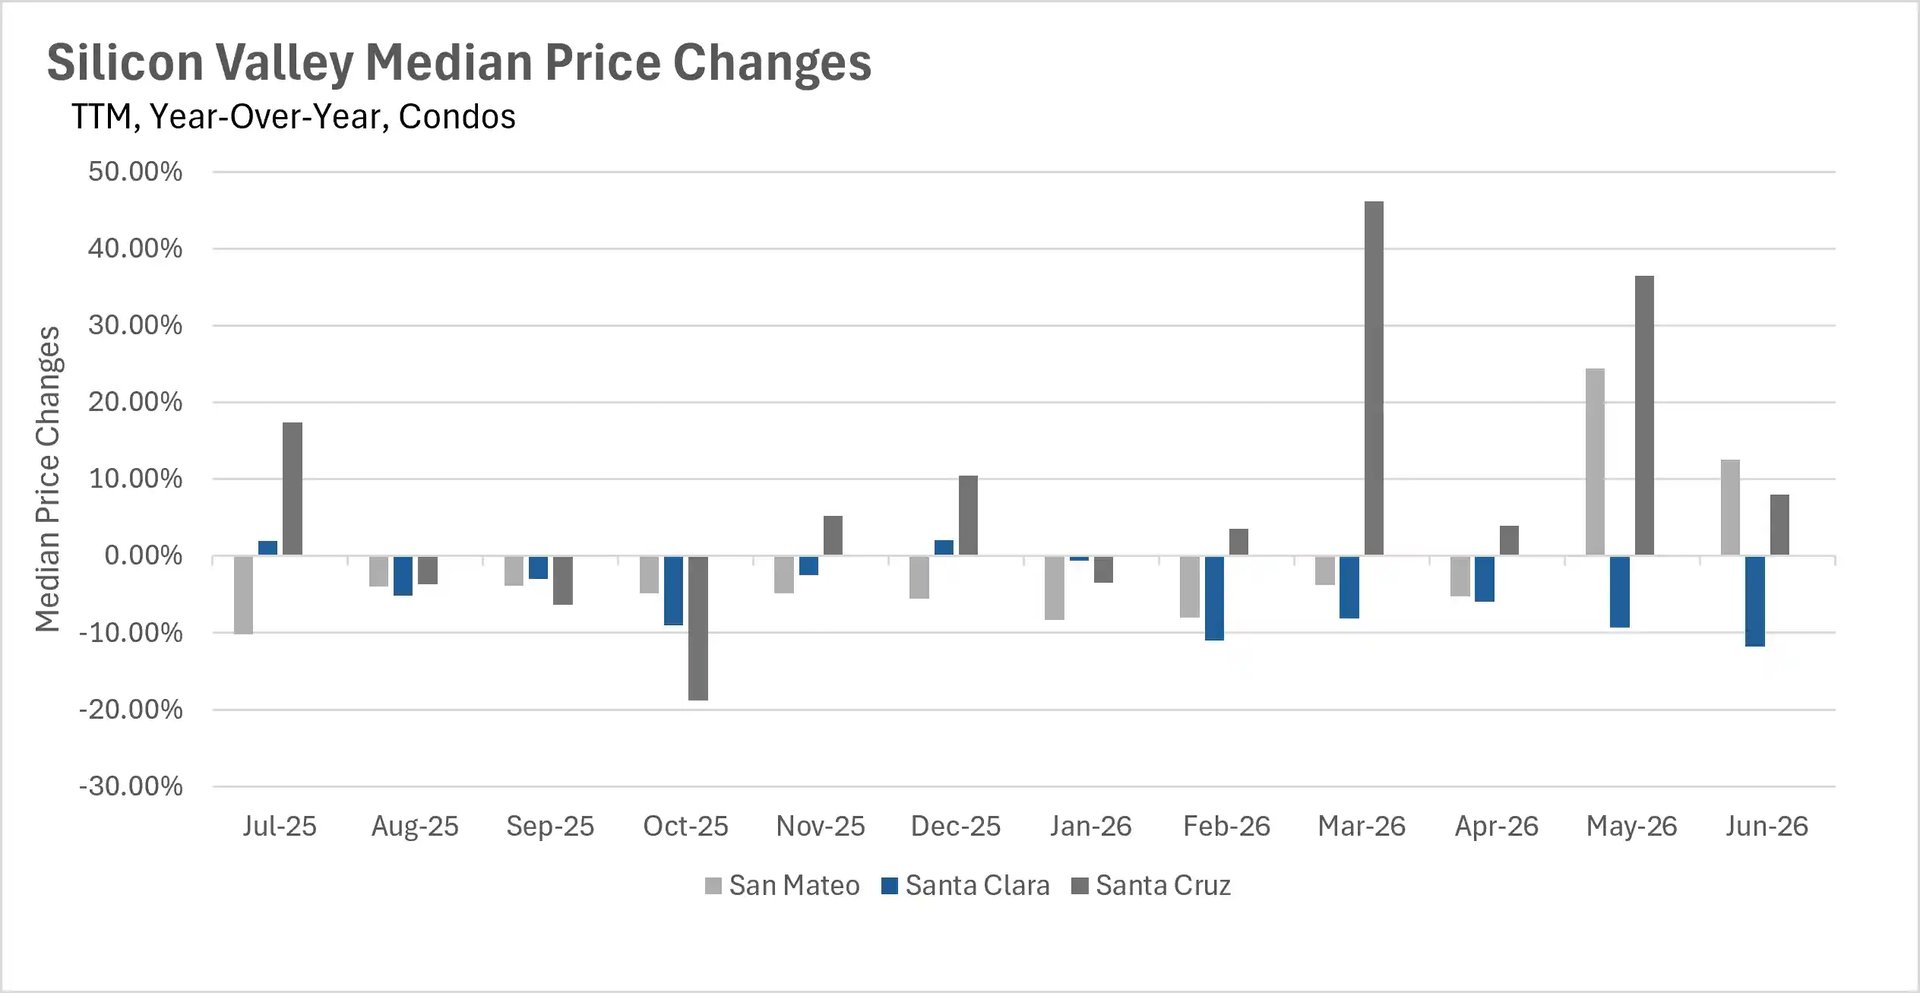
The single-family home market in Silicon Valley showed divergent trends in June as we move deeper into summer. San Mateo County posted an impressive 7.50% year-over-year increase in median sale price, with the median home selling for $2,150,000. Santa Cruz County also showed modest gains, with the median home selling for $1,350,000, representing a 1.12% year-over-year increase. However, Santa Clara County experienced a significant 8.57% year-over-year decline, with the median home selling for $1,920,000. The condo market painted a similar picture, with San Mateo County condos surging 12.50% year-over-year to $787,500 and Santa Cruz County condos climbing 7.96% to $728,750, while Santa Clara County condos dropped 11.80% to $661,500.
Inventory plummets as summer demand heats up
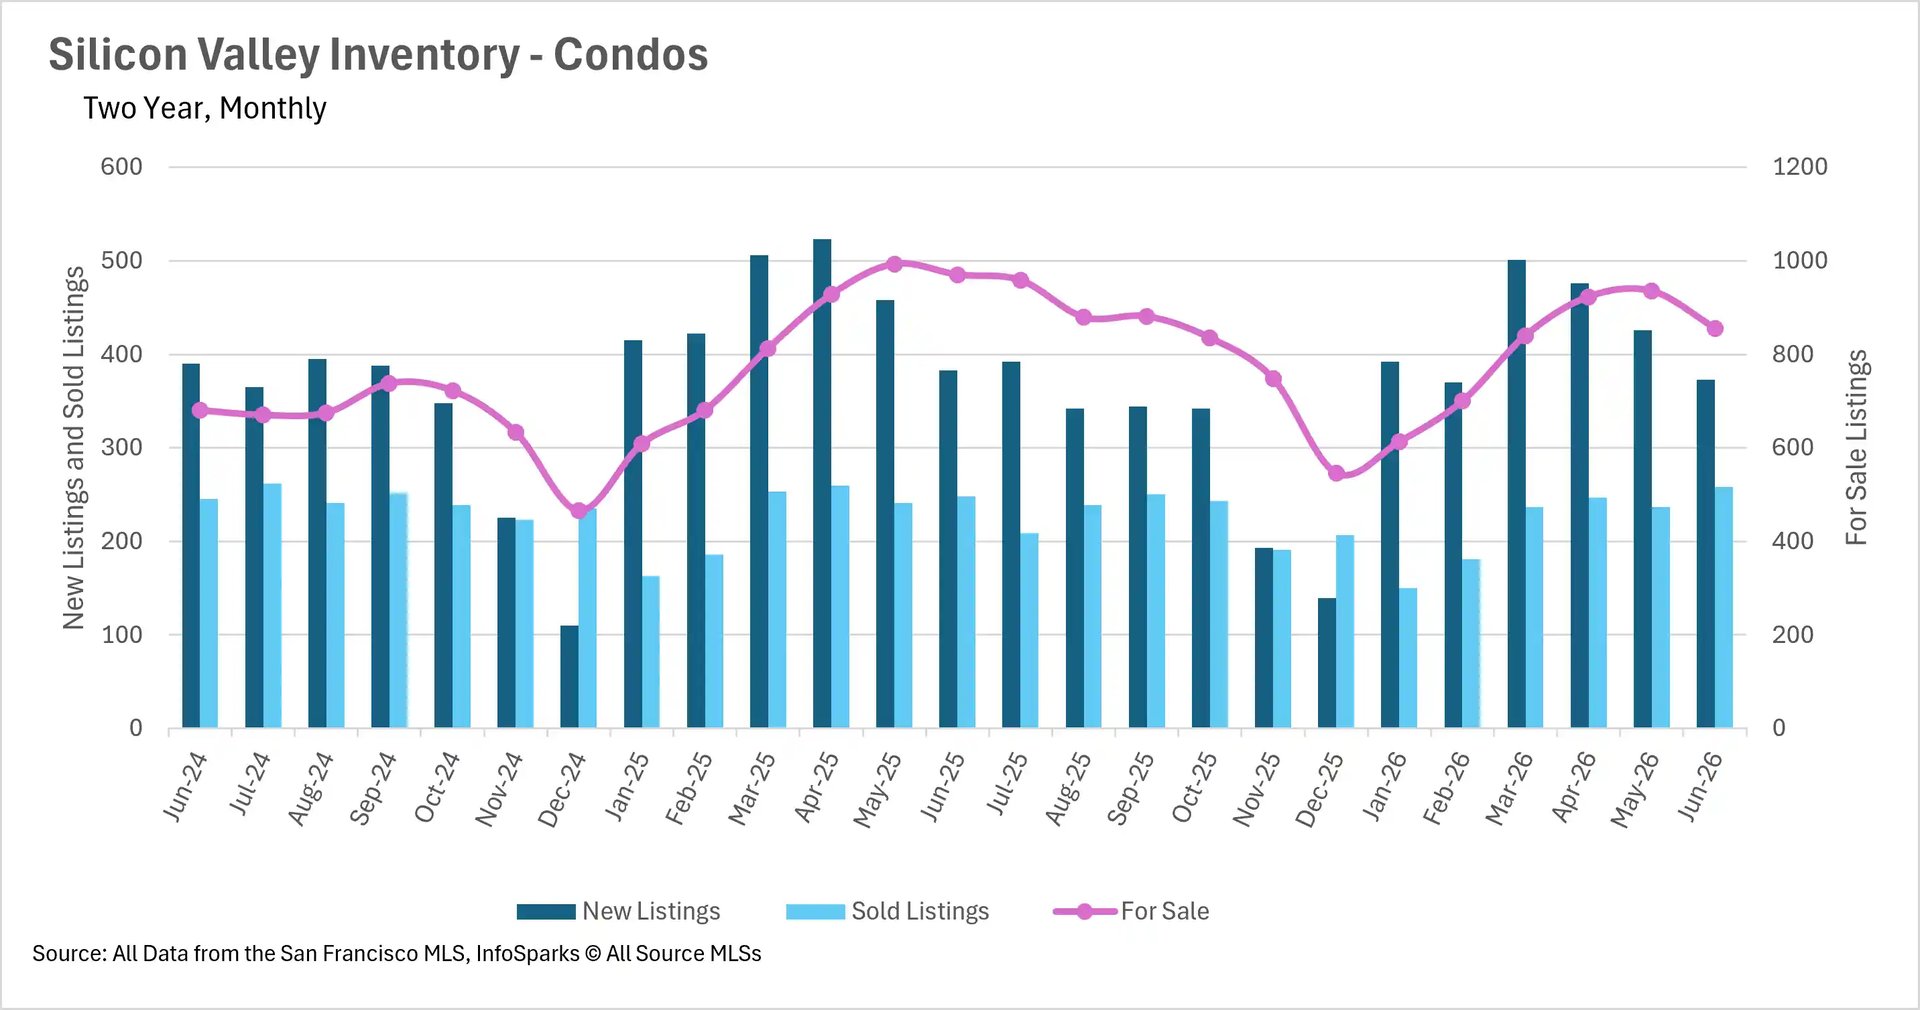
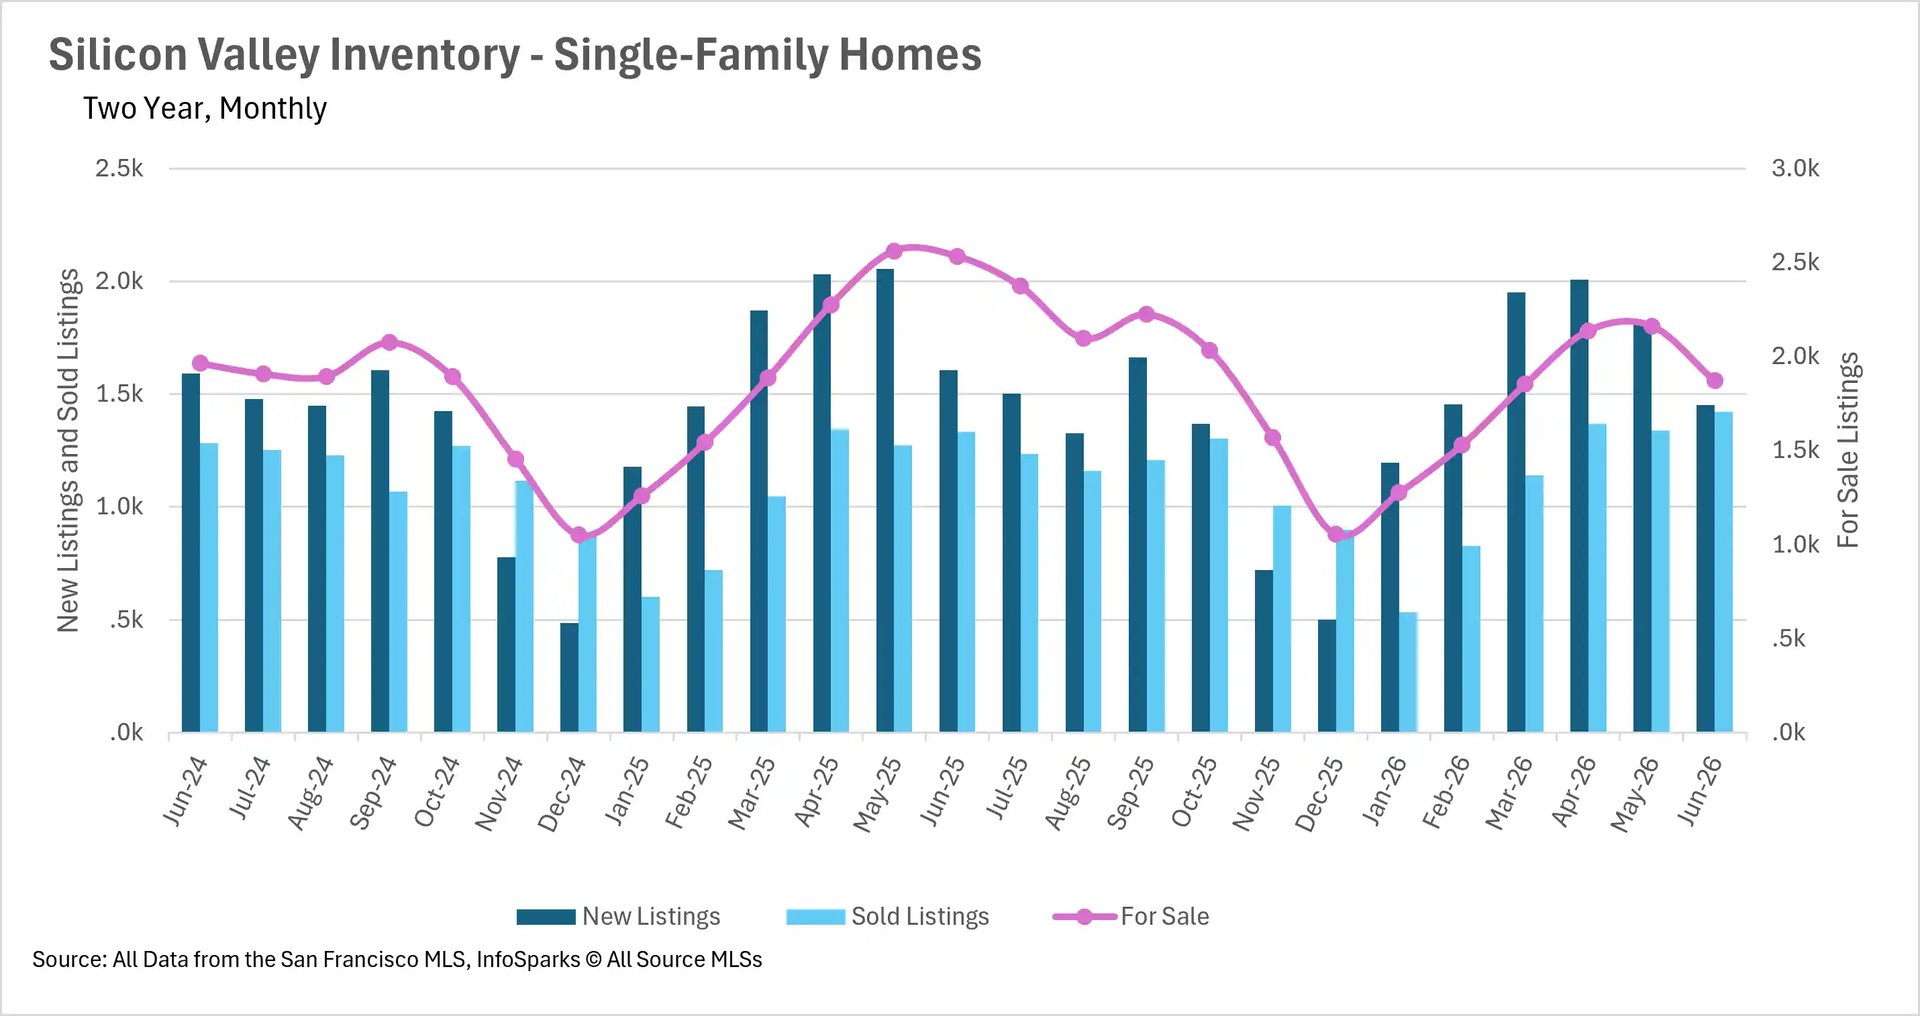
The inventory situation in Silicon Valley has become remarkably tight as we head into the heart of summer. There are currently just 1,870 single-family homes for sale across the region, representing a substantial 26.15% year-over-year decline. While new listings are down 9.59% compared to last year, sold listings jumped 6.91%, demonstrating that buyer demand is absorbing available inventory at an impressive pace. The condo market is experiencing similar constraints, with 856 condos currently for sale, down 11.75% year-over-year. This dramatic inventory shortage is creating fierce competition among buyers, particularly in the single-family home segment where options are increasingly limited.
Homes are flying off the shelves across Silicon Valley
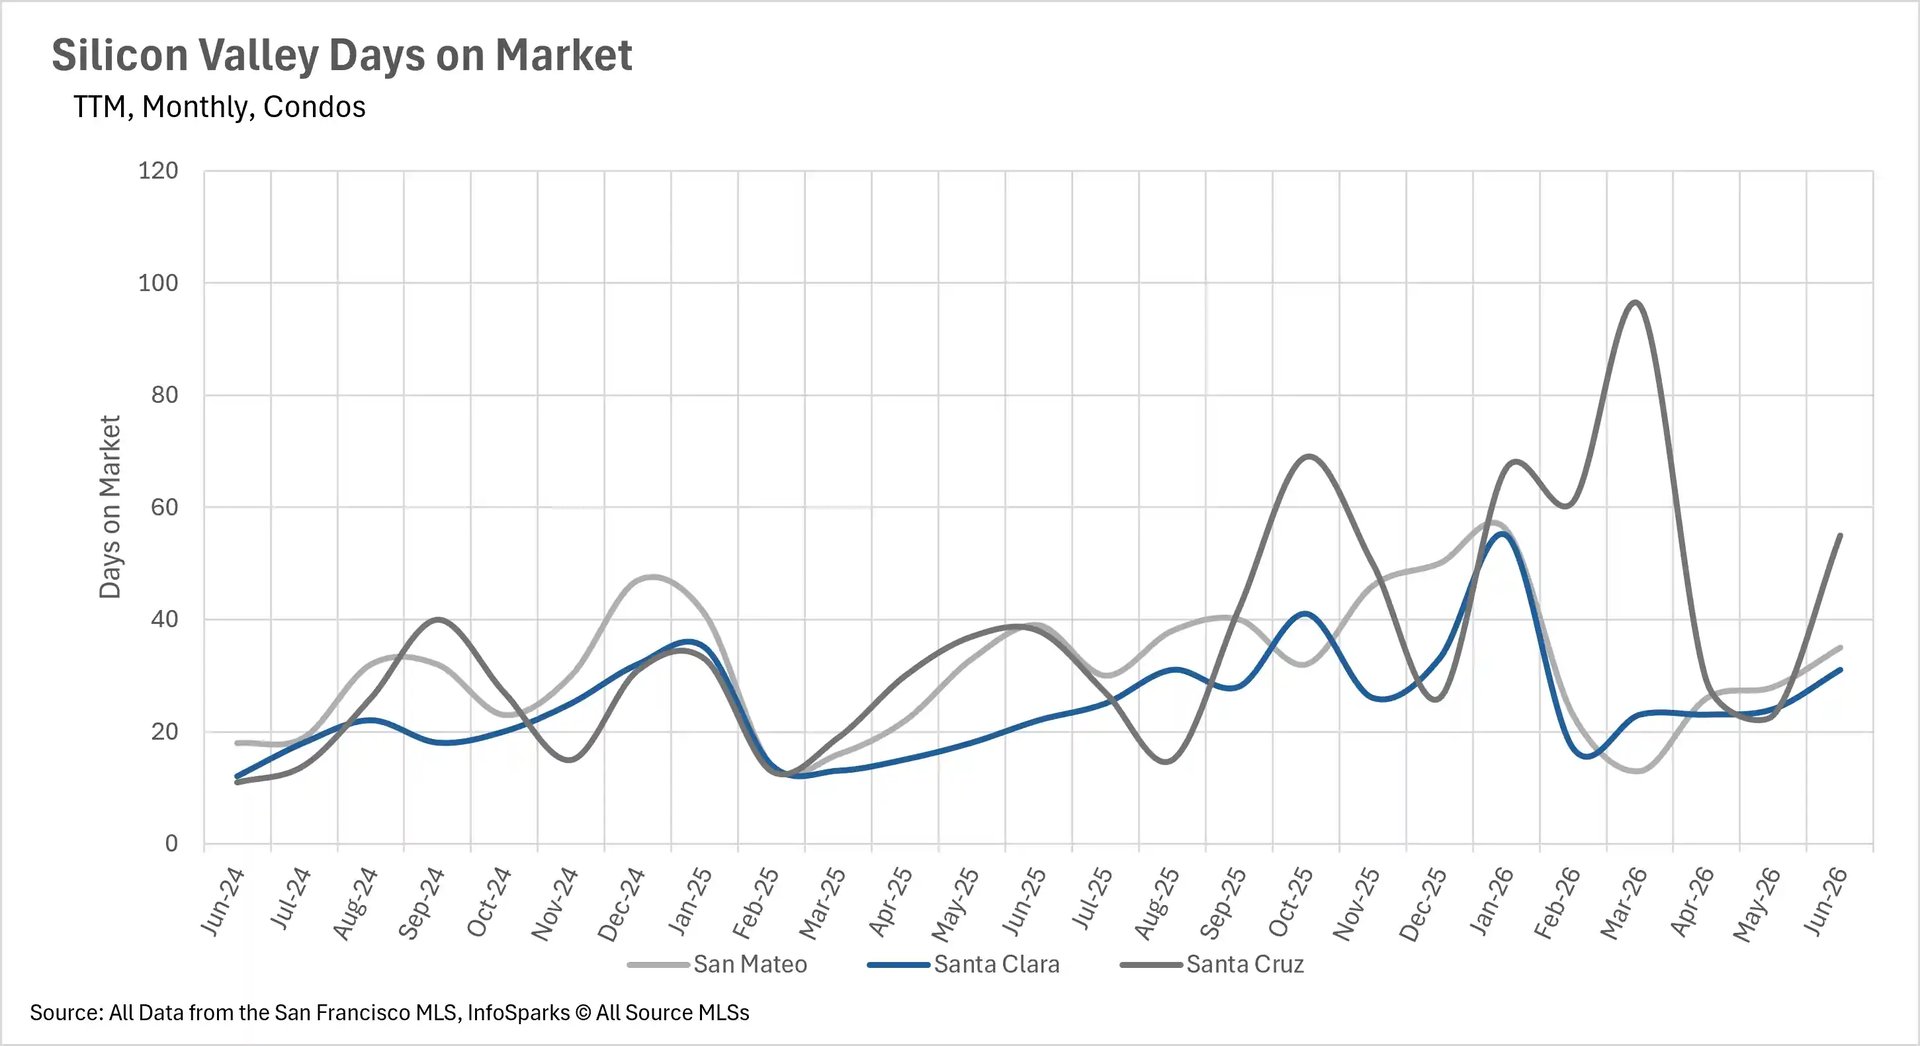
Single-family homes are selling at a blistering pace throughout Silicon Valley this summer. In San Mateo County, the average single-family home is selling in just 12 days, representing a 7.69% improvement compared to last year. Santa Clara County homes are also spending 12 days on the market, while Santa Cruz County homes are averaging 17 days, unchanged from this time last year. The condo market presents a more mixed picture. San Mateo County condos are selling 10.26% faster than last year at 35 days on average. However, Santa Clara and Santa Cruz County condos are taking considerably longer to sell, with year-over-year increases of 40.91% and 44.74%, bringing their average days on market to 31 and 55 days, respectively.
Silicon Valley is a deeply entrenched seller's market this summer
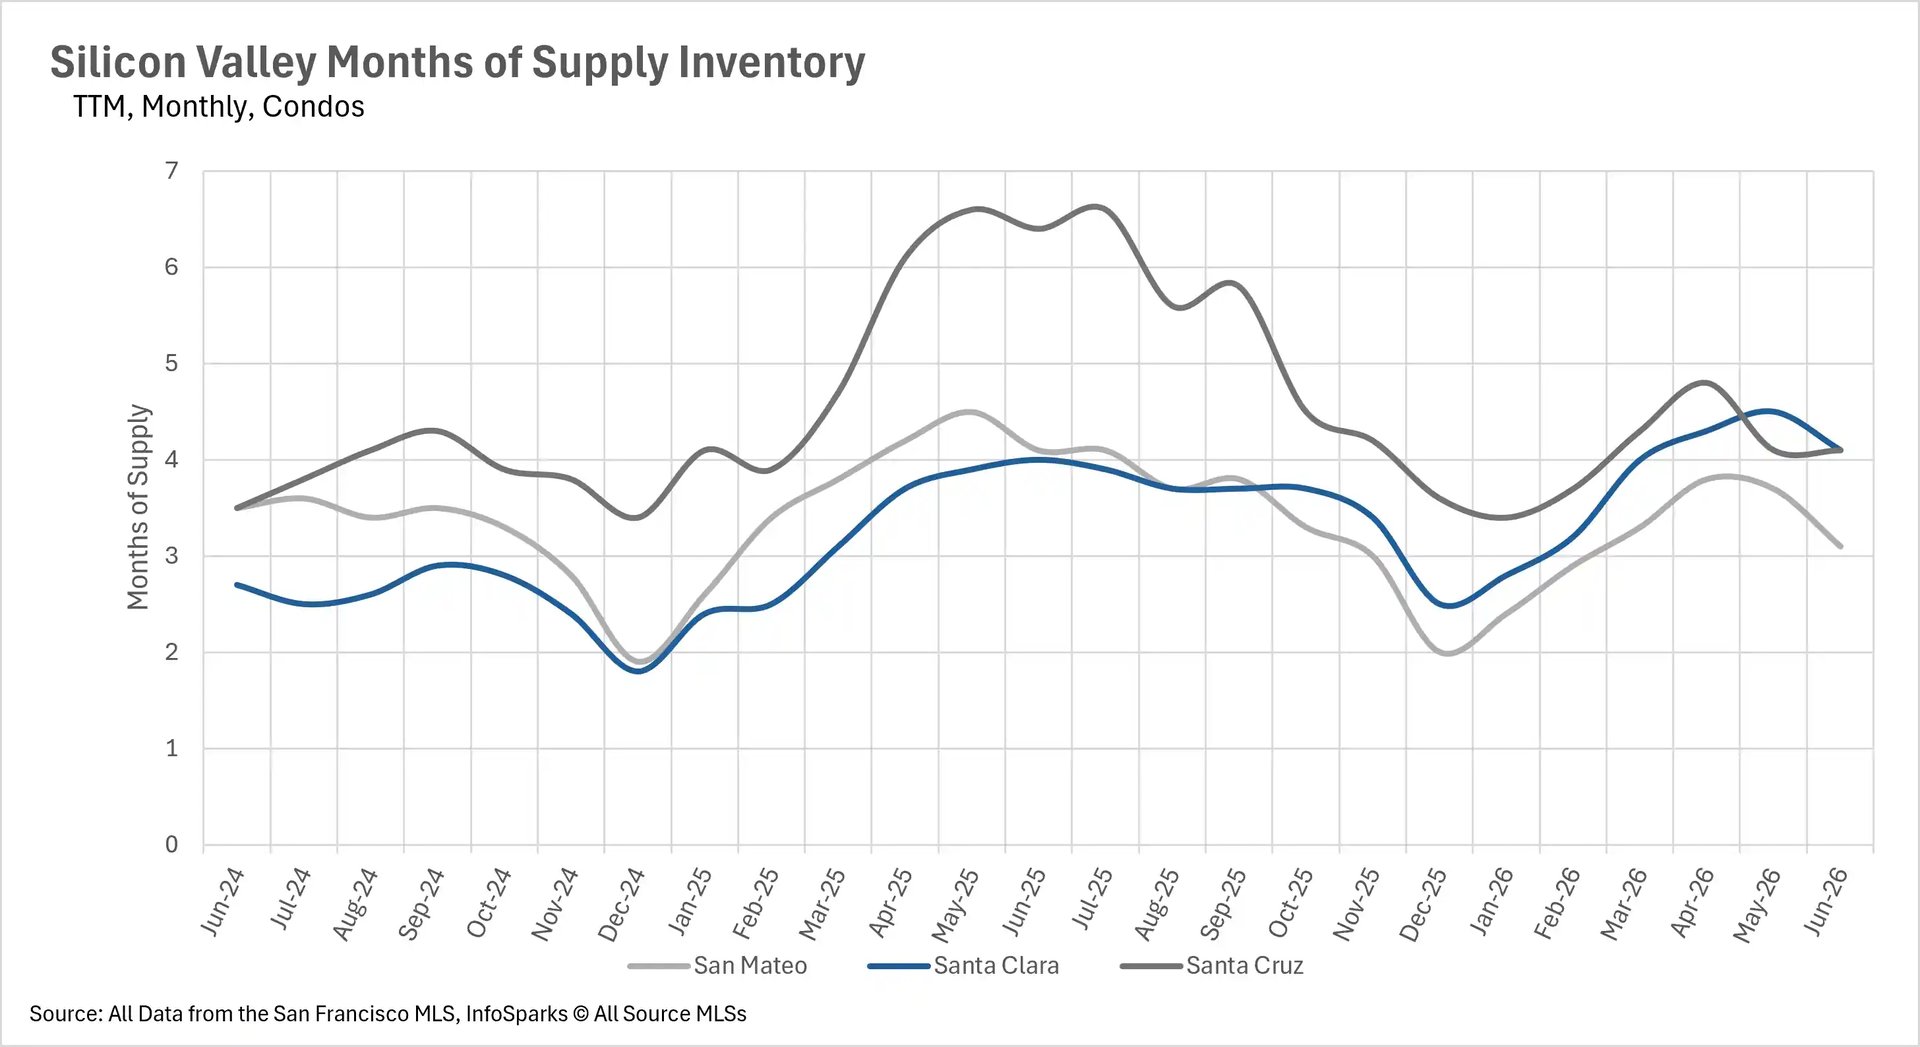
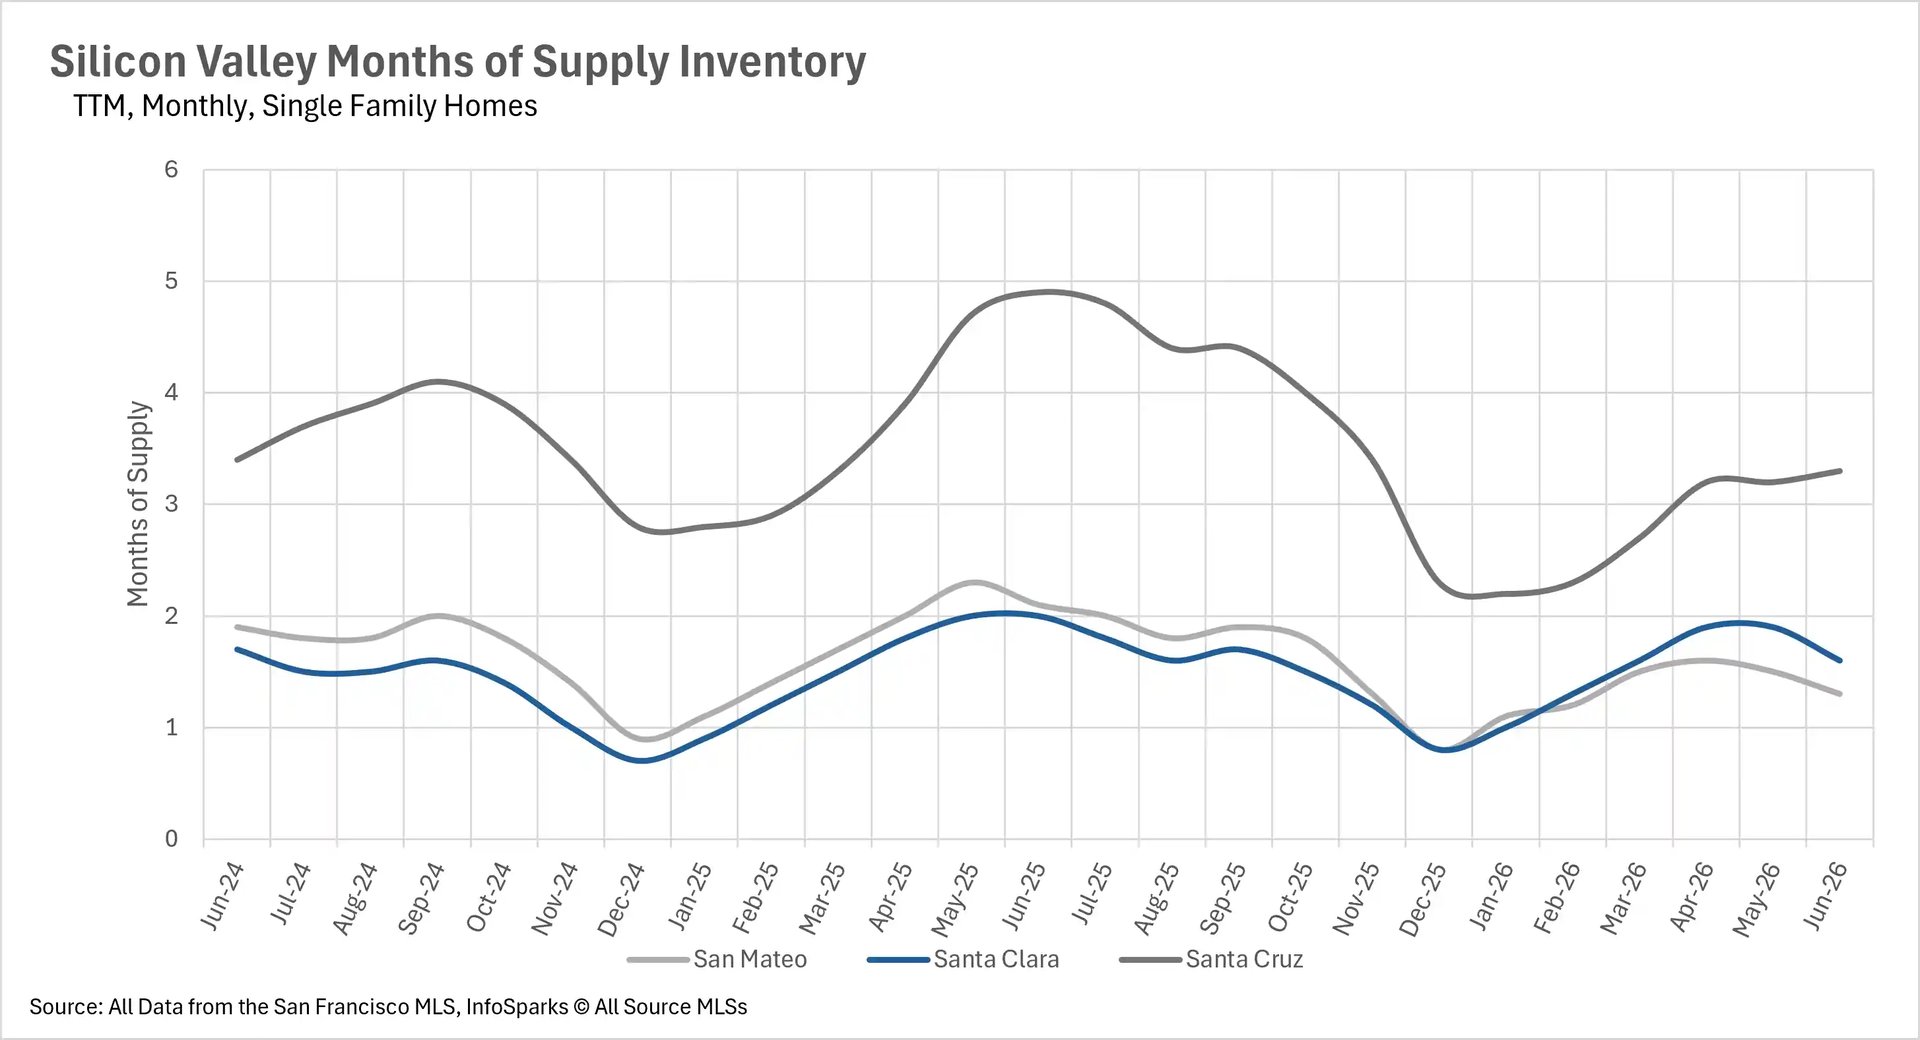
When determining whether a market is a buyers' market or a sellers' market, we look at the Months of Supply Inventory (MSI) metric. The state of California has historically averaged around three months of MSI, so any area with at or around three months of MSI is considered a balanced market. Any market that has less than three months of MSI is considered a seller's market, whereas markets with more than three months of MSI are considered buyers' markets.
The single-family home market has become an even more pronounced seller's market compared to last year. San Mateo County has just 1.3 months of supply on the market, representing a dramatic 38.10% year-over-year decline. Santa Clara County has 1.6 months of supply, down 20% from last year, while Santa Cruz County has 3.3 months of supply, a substantial 32.65% year-over-year decrease that has brought it much closer to balanced market territory. The condo market is more favorable for buyers, with San Mateo County at 3.1 months of supply (down 24.39% YoY), and Santa Clara and Santa Cruz Counties both at 4.1 months. With single-family inventory at critically low levels and homes selling in under two weeks, buyers in that segment should be prepared for intense competition throughout the summer!