The Local Lowdown
Quick Take:
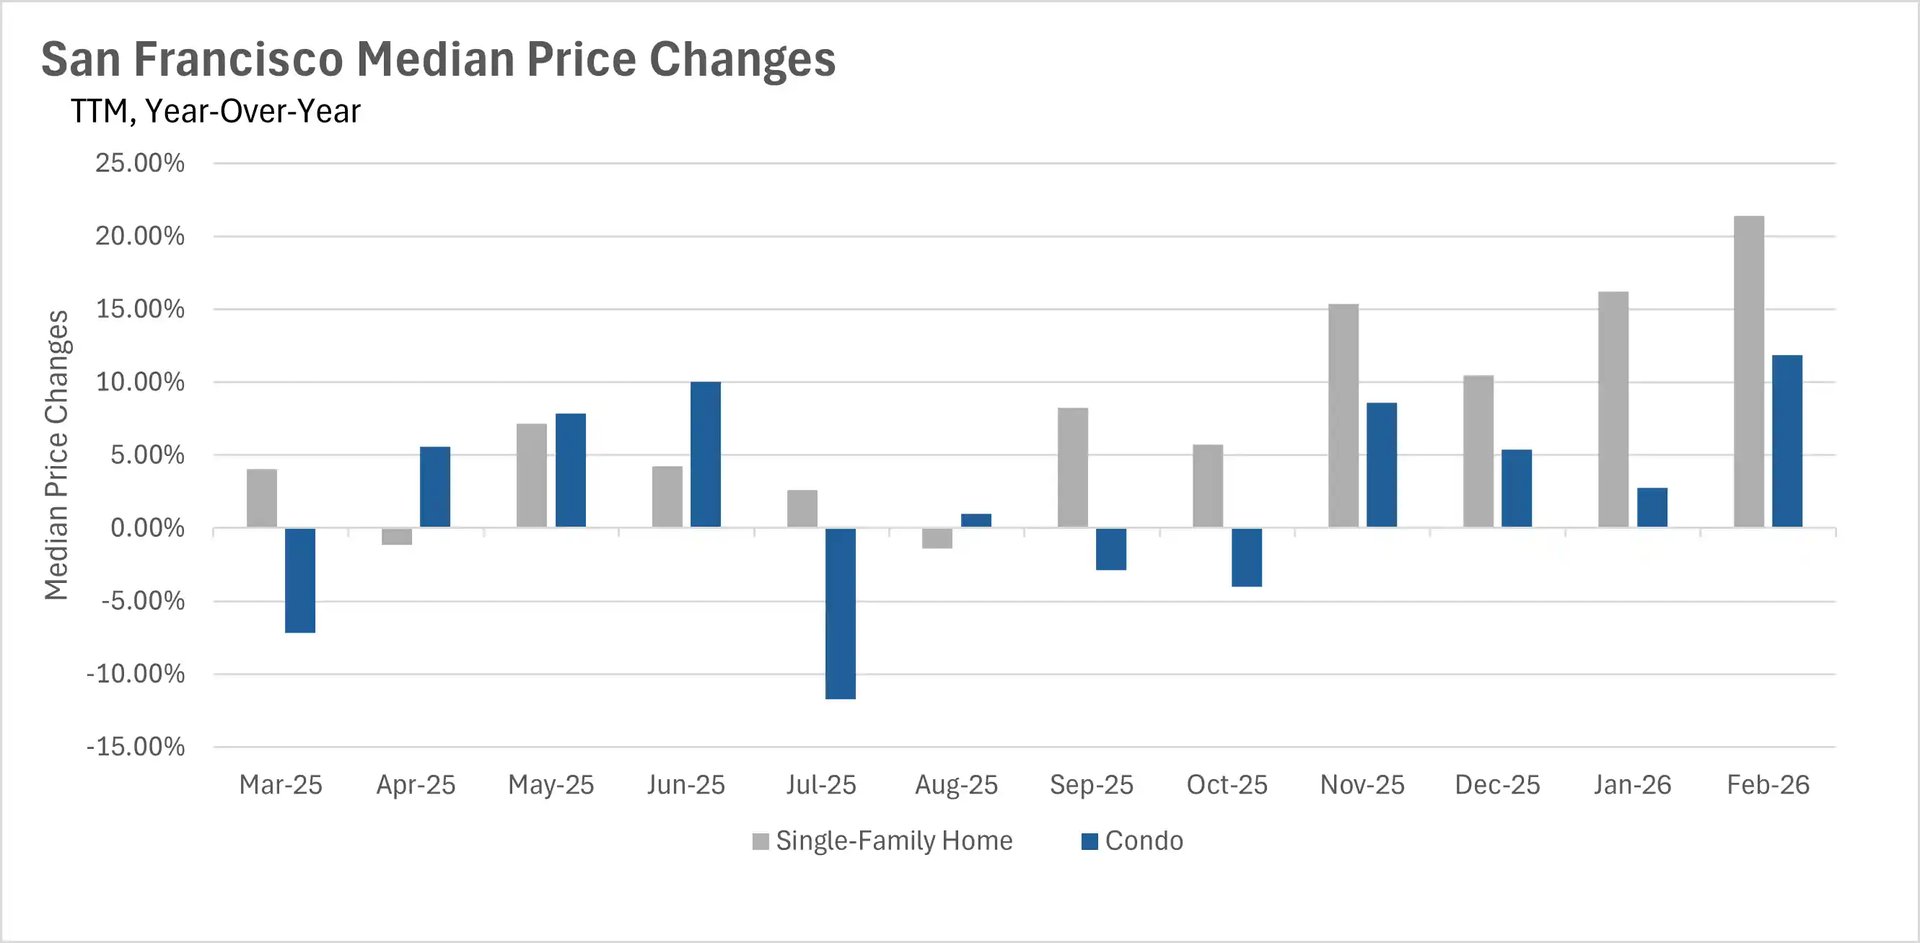
- Median sale prices surged across the board in February, with single-family homes up more than 21% year-over-year.
- Inventory remains severely constrained, with both single-family homes and condos down nearly 40% compared to last year.
- Listings are flying off the market at an incredible pace, with single-family homes selling in just 12 days and condos in just 14 days.
Note: You can find the charts/graphs for the Local Lowdown at the end of this section.
San Francisco's housing market is on fire to start 2026
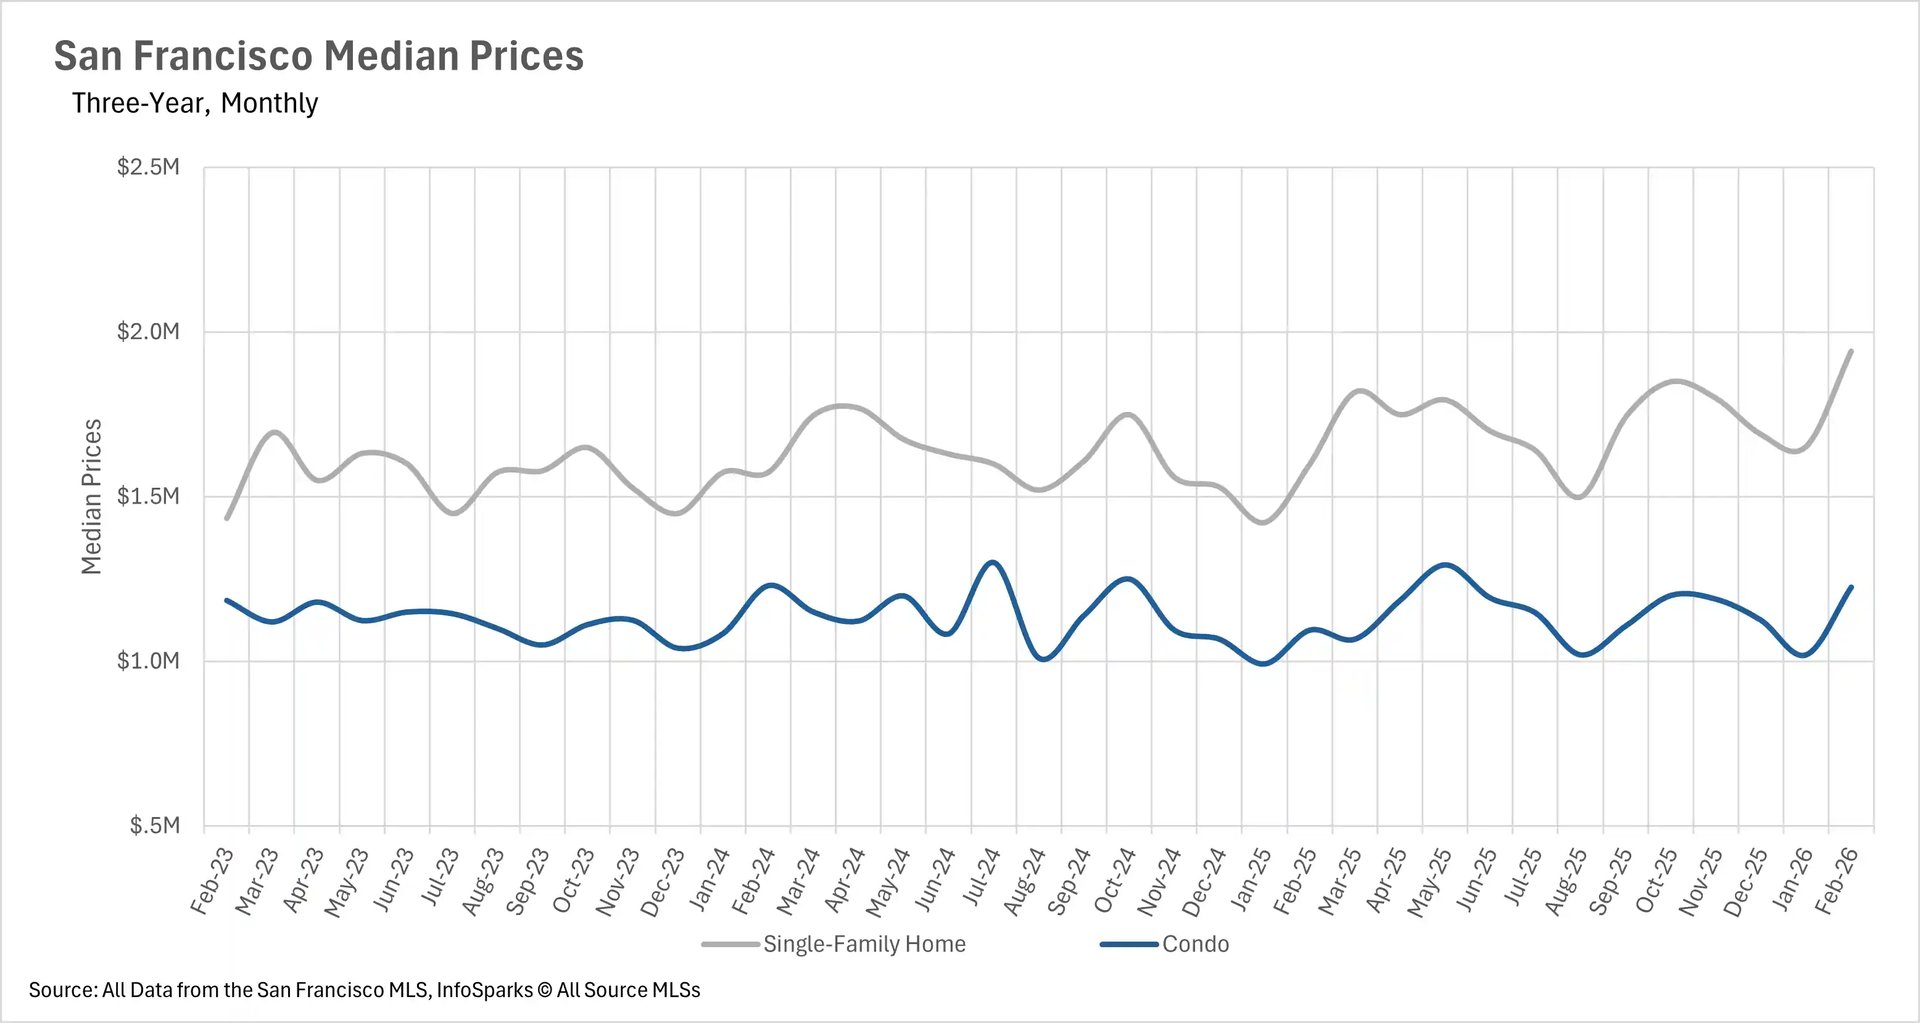
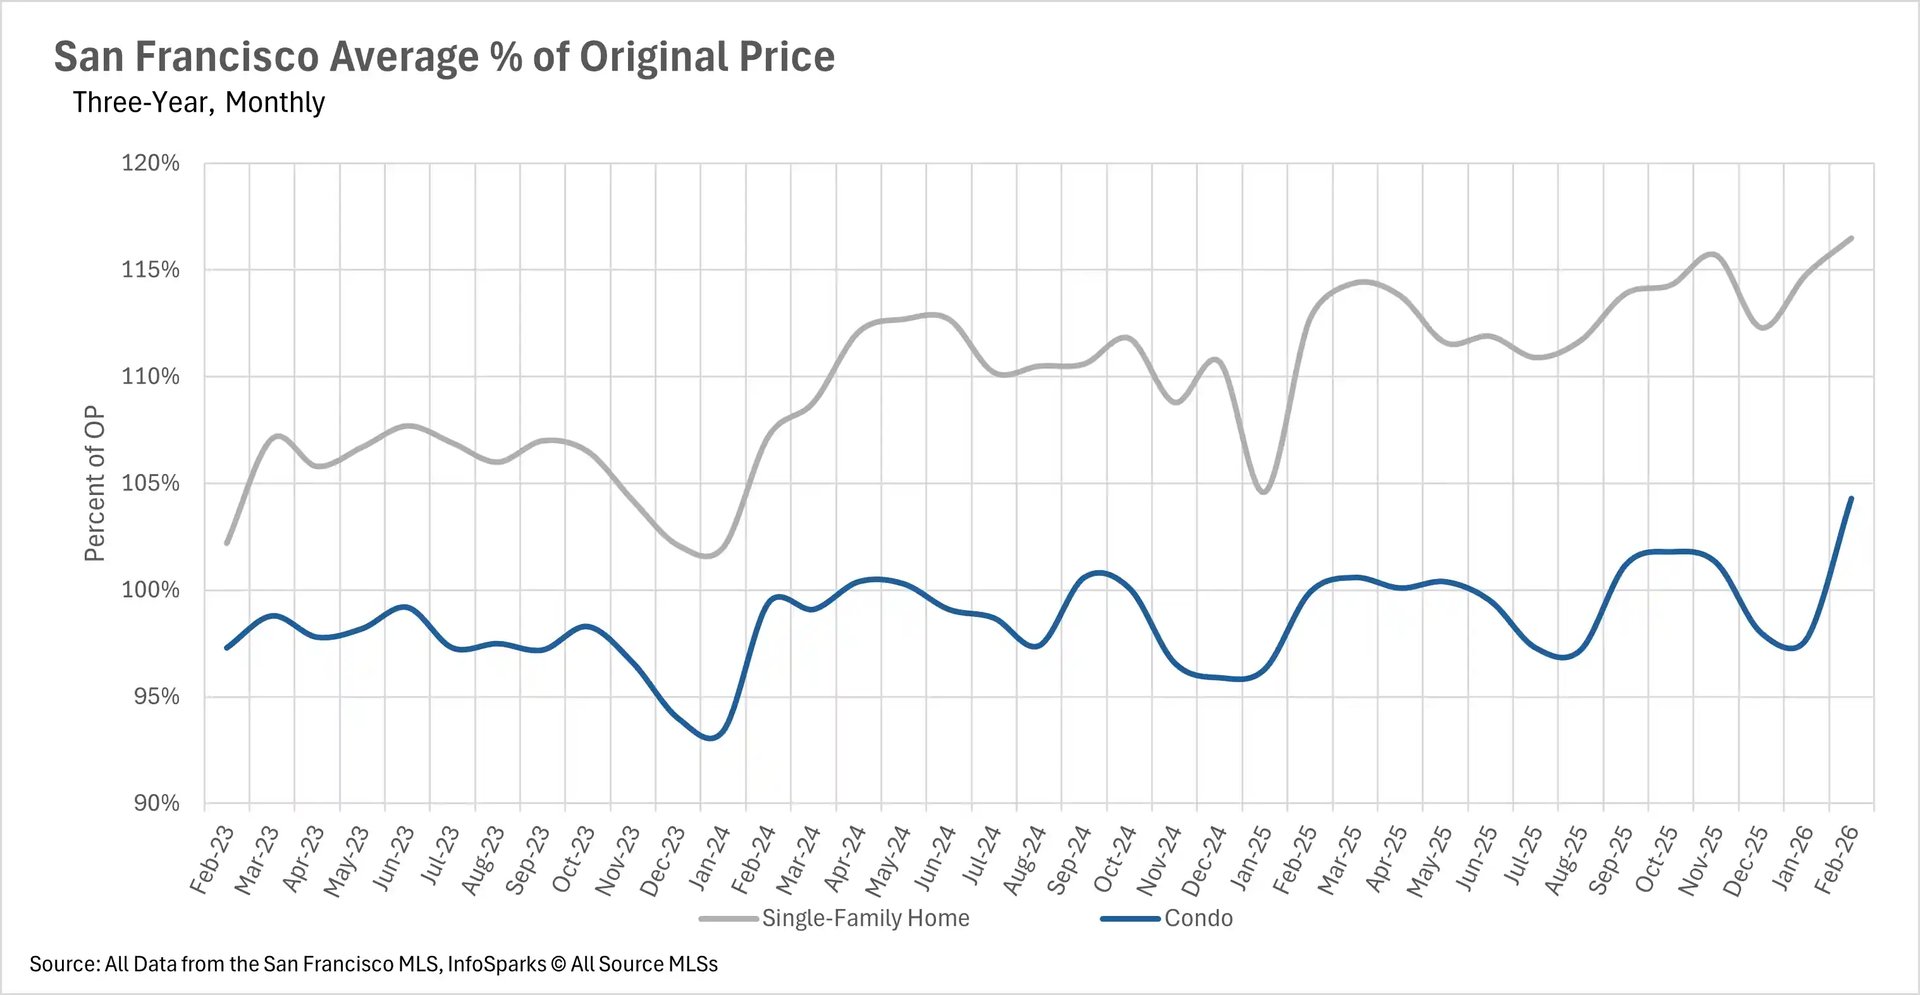
February brought extraordinary price appreciation to San Francisco, with both single-family homes and condos posting impressive year-over-year gains. Single-family homes saw a remarkable 21.41% increase in median sale price, with the median home selling for $1,942,500. Condos also had an exceptional month, with the median sale price climbing 11.87% to $1,225,000. The competition for homes has reached a fever pitch, with single-family homes selling for 16.5% over the original asking price on average, and condos selling for 4.3% over asking. This marks one of the strongest months for condo premiums in recent memory.
Inventory levels remain at historic lows throughout San Francisco
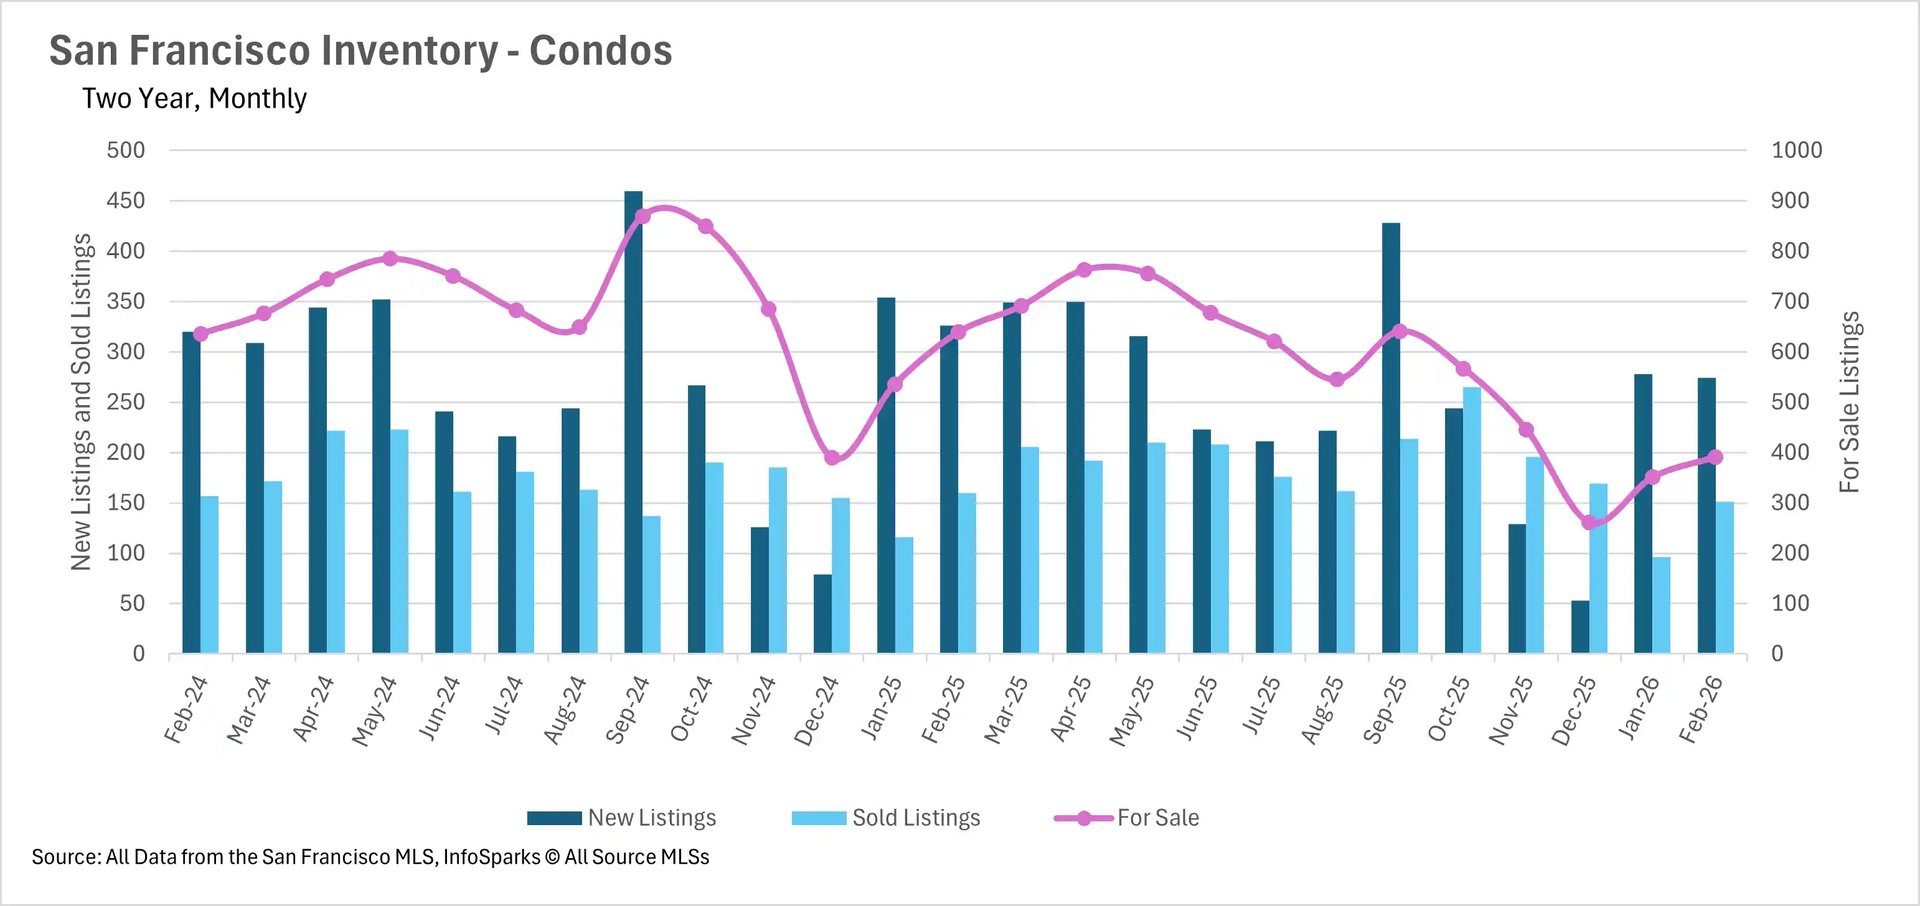
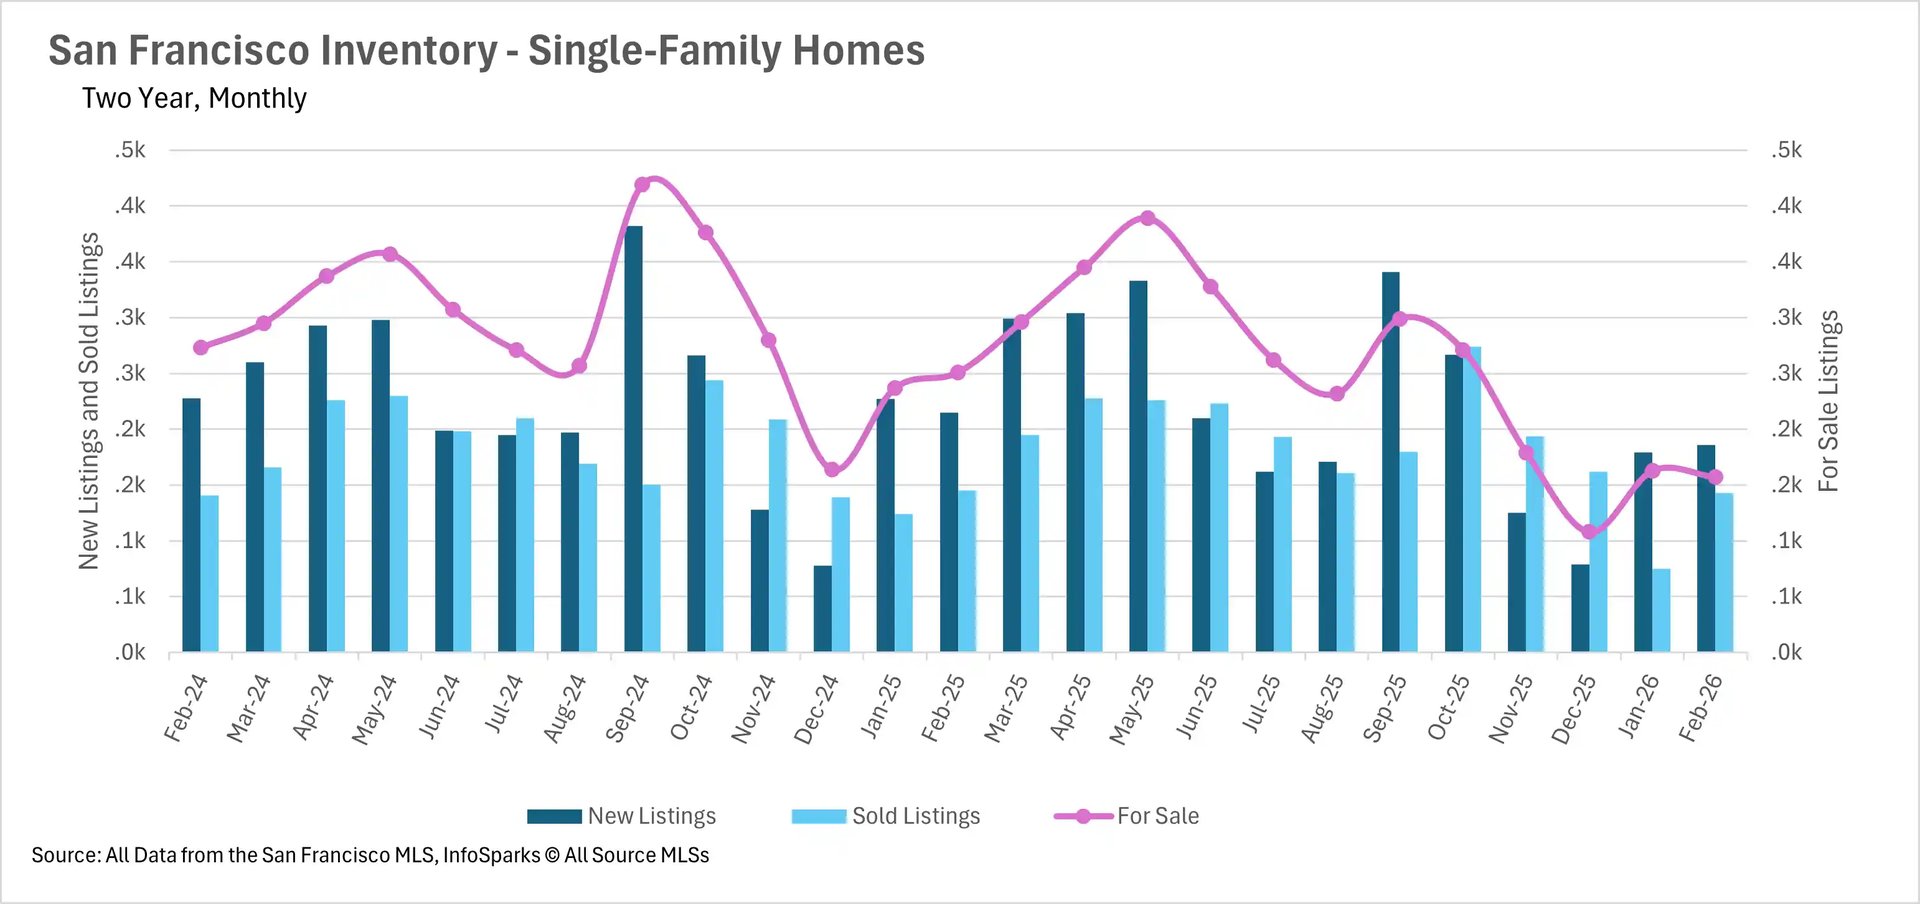
Despite the typical spring uptick in new listings, inventory levels remain drastically below where they were a year ago. There are currently just 157 single-family homes for sale in San Francisco, representing a 37.45% decline compared to February 2025. The condo market is experiencing a similar shortage, with inventory down 38.81% year-over-year to just 391 units. Combined, there are fewer than 550 homes available for sale in the entire city. Until more homeowners decide to list their properties, this severe supply crunch will continue to fuel intense competition among buyers.
Homes are selling at a blistering pace in San Francisco
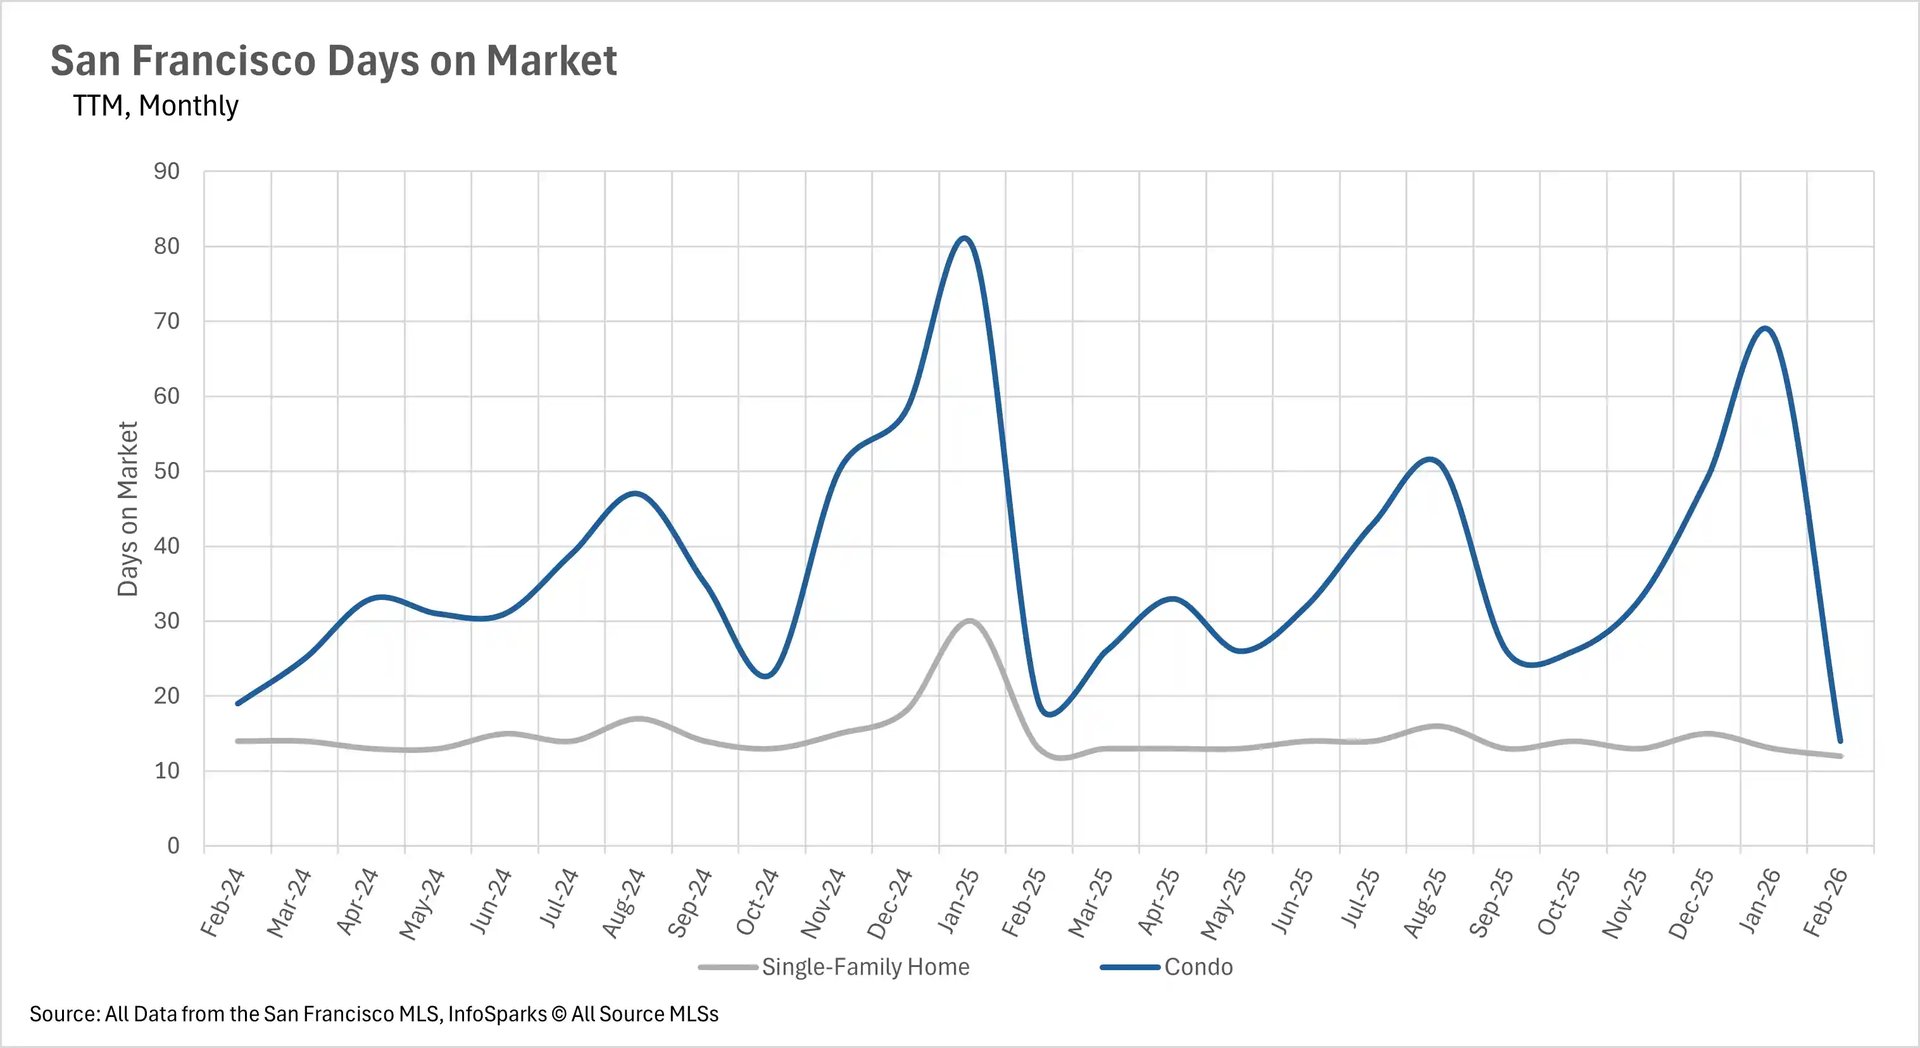
With inventory at such critically low levels, listings are being snapped up almost as soon as they hit the market. The average single-family home is selling in just 12 days, representing a 7.69% decrease compared to last February. The condo market has seen an even more dramatic acceleration, with the average condo selling in just 14 days, a 26.32% year-over-year decline. This rapid pace means buyers must be prepared to act immediately when a desirable property becomes available, leaving little room for deliberation in this ultra-competitive market.
San Francisco is one of the strongest seller's markets in California
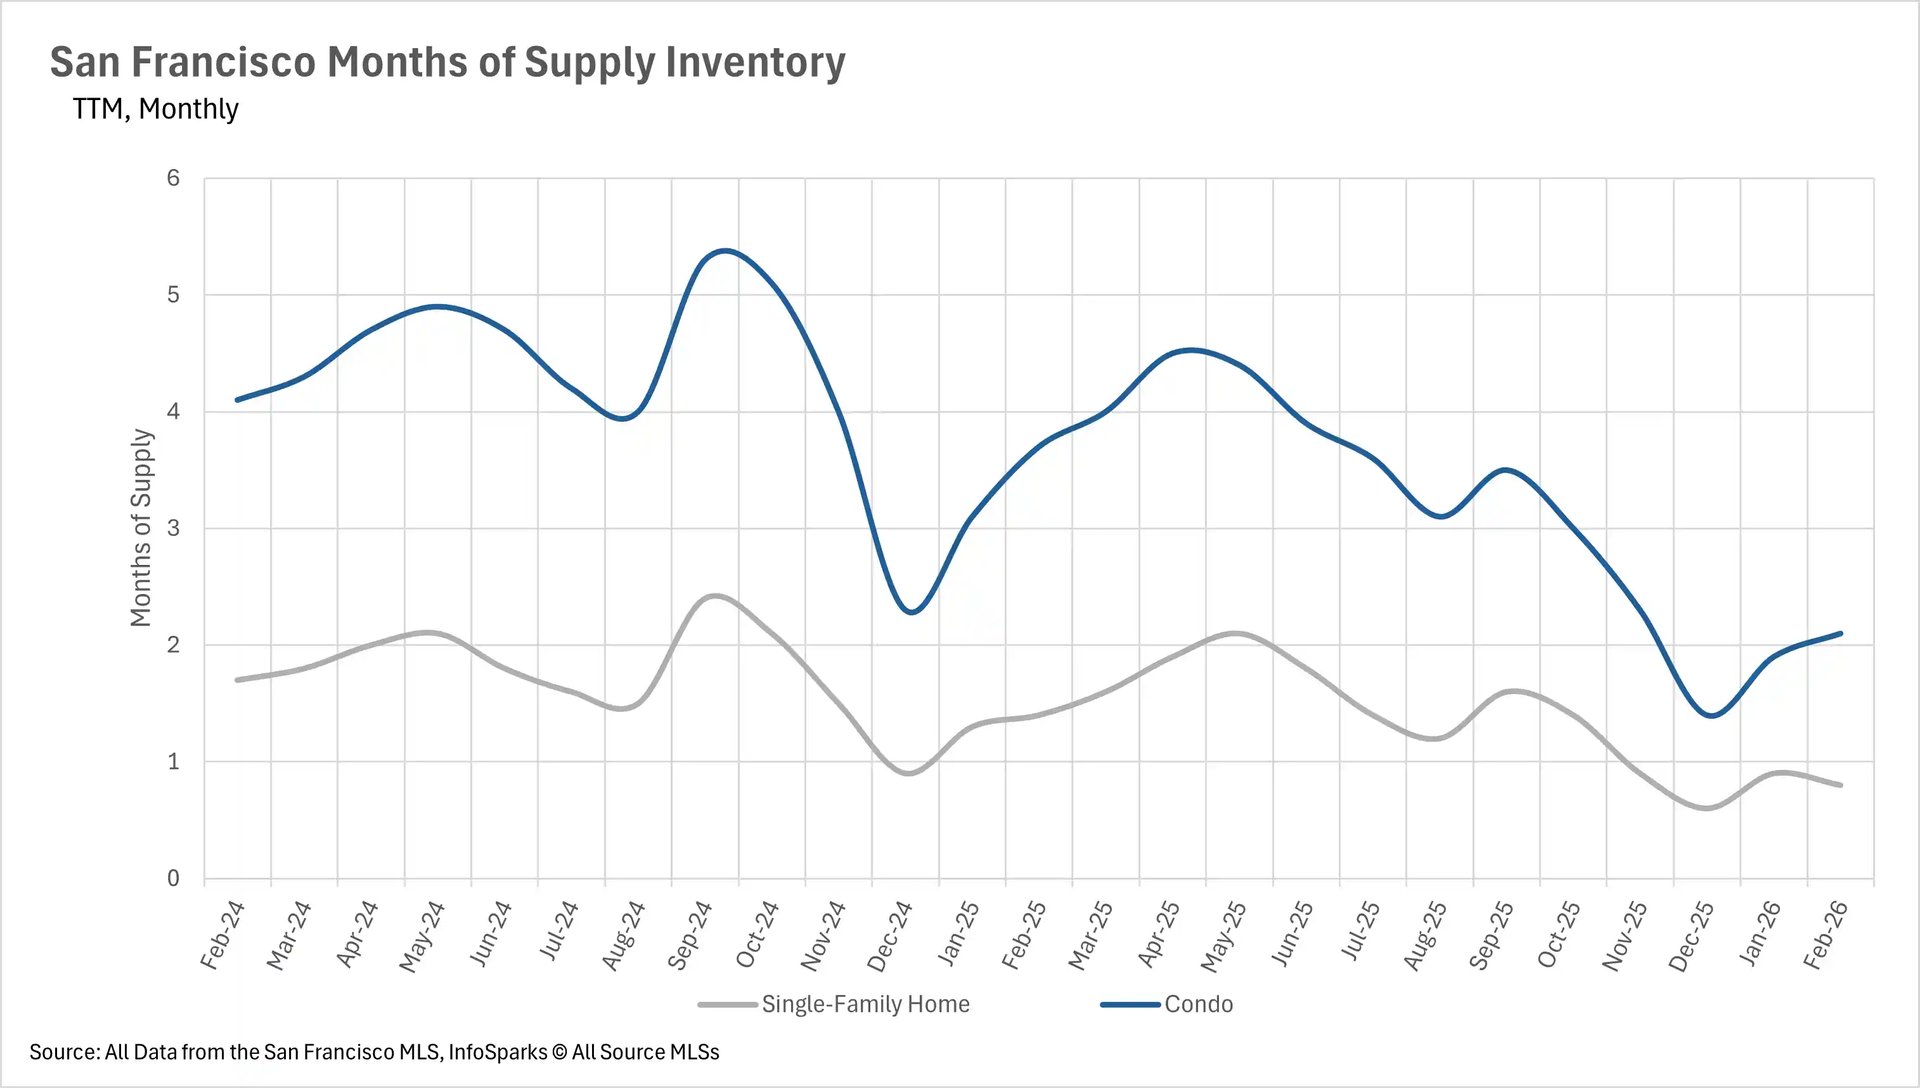
When determining whether a market is a buyers' market or a sellers' market, we look to the Months of Supply Inventory (MSI) metric. The state of California has historically averaged around three months of MSI, so any area with at or around three months of MSI is considered a balanced market. Any market that has lower than three months of MSI is considered a seller's market, whereas markets with more than three months of MSI are considered buyers' markets.
With just 0.8 months of single-family home inventory and 2.1 months of condo inventory on the market, San Francisco remains a deeply entrenched seller's market across all property types. Both figures represent year-over-year declines of more than 40%, underscoring just how tight conditions have become. Sellers continue to hold all the leverage in negotiations, and there is no indication that this dynamic will shift any time soon.