The Local Lowdown
Quick Take:
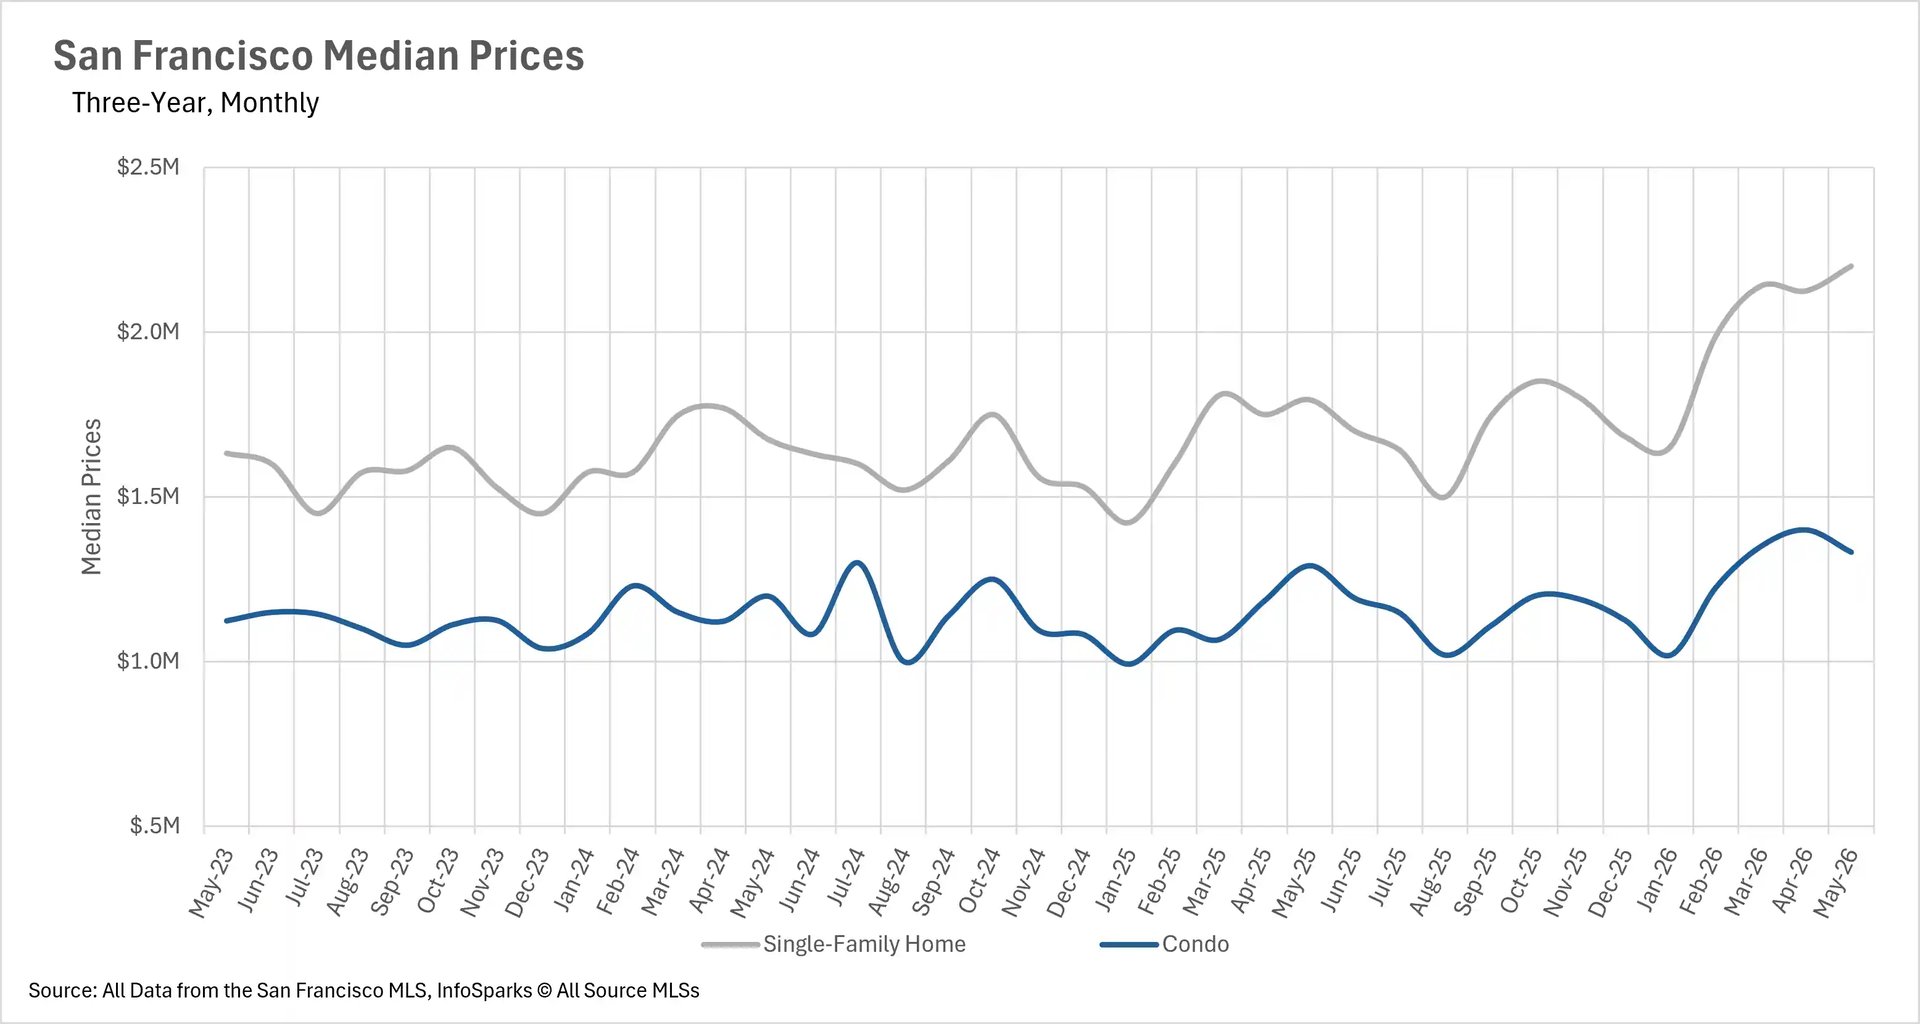
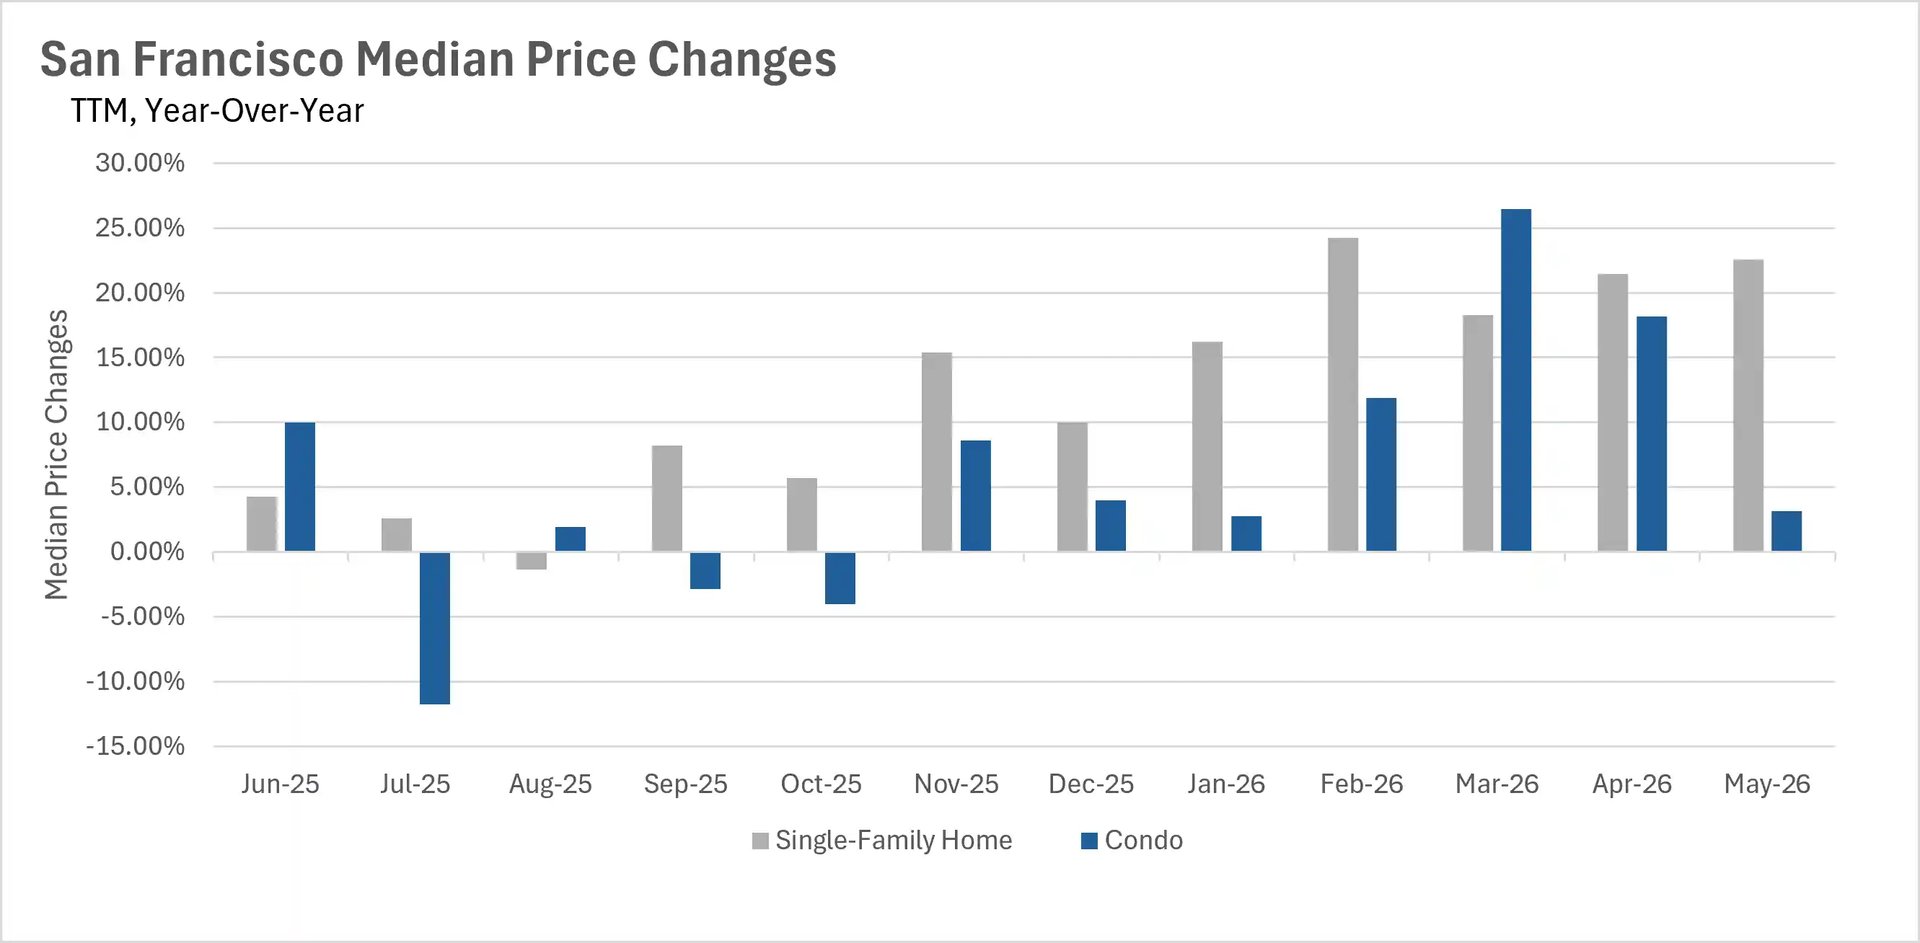
Single-family home prices continue their meteoric rise, climbing more than 22% year-over-year to a median of $2.2 million.
Inventory levels have plummeted by more than 40% compared to last year, with fewer than 700 total homes available for sale.
Listings are selling in roughly two weeks or less, giving buyers almost no time to make decisions.
Note: You can find the charts/graphs for the Local Lowdown at the end of this section.
Single-family homes breach the $2.2 million mark for the first time
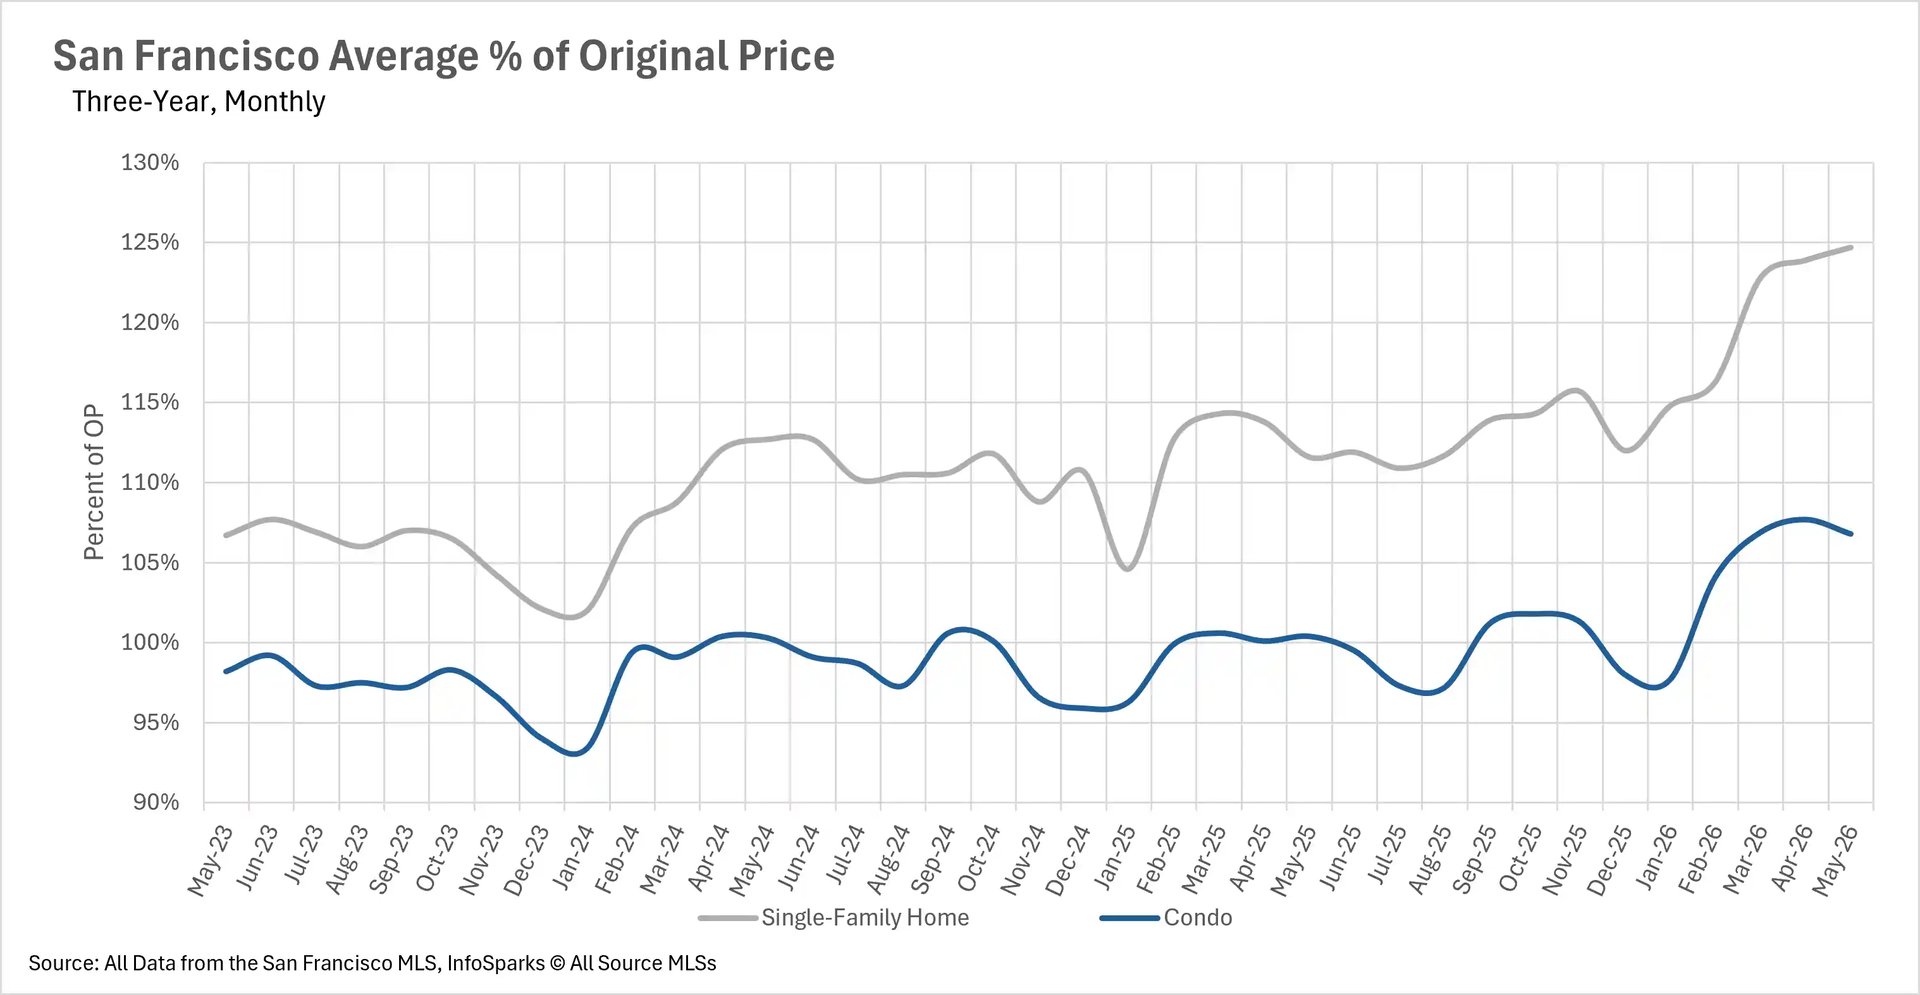
San Francisco's single-family home market continues to reach new heights, with the median sale price climbing 22.56% year-over-year to $2,200,000. This marks one of the strongest year-over-year gains we've seen in the market's recent history. The condo market posted more modest gains, with the median sale price increasing 3.17% to $1,332,500. Competition remains extraordinarily fierce, with single-family homes selling for nearly 25% over the original asking price on average, and condos selling for nearly 7% over asking. These premiums reflect the intense demand from buyers who are willing to pay top dollar to secure a home in San Francisco.
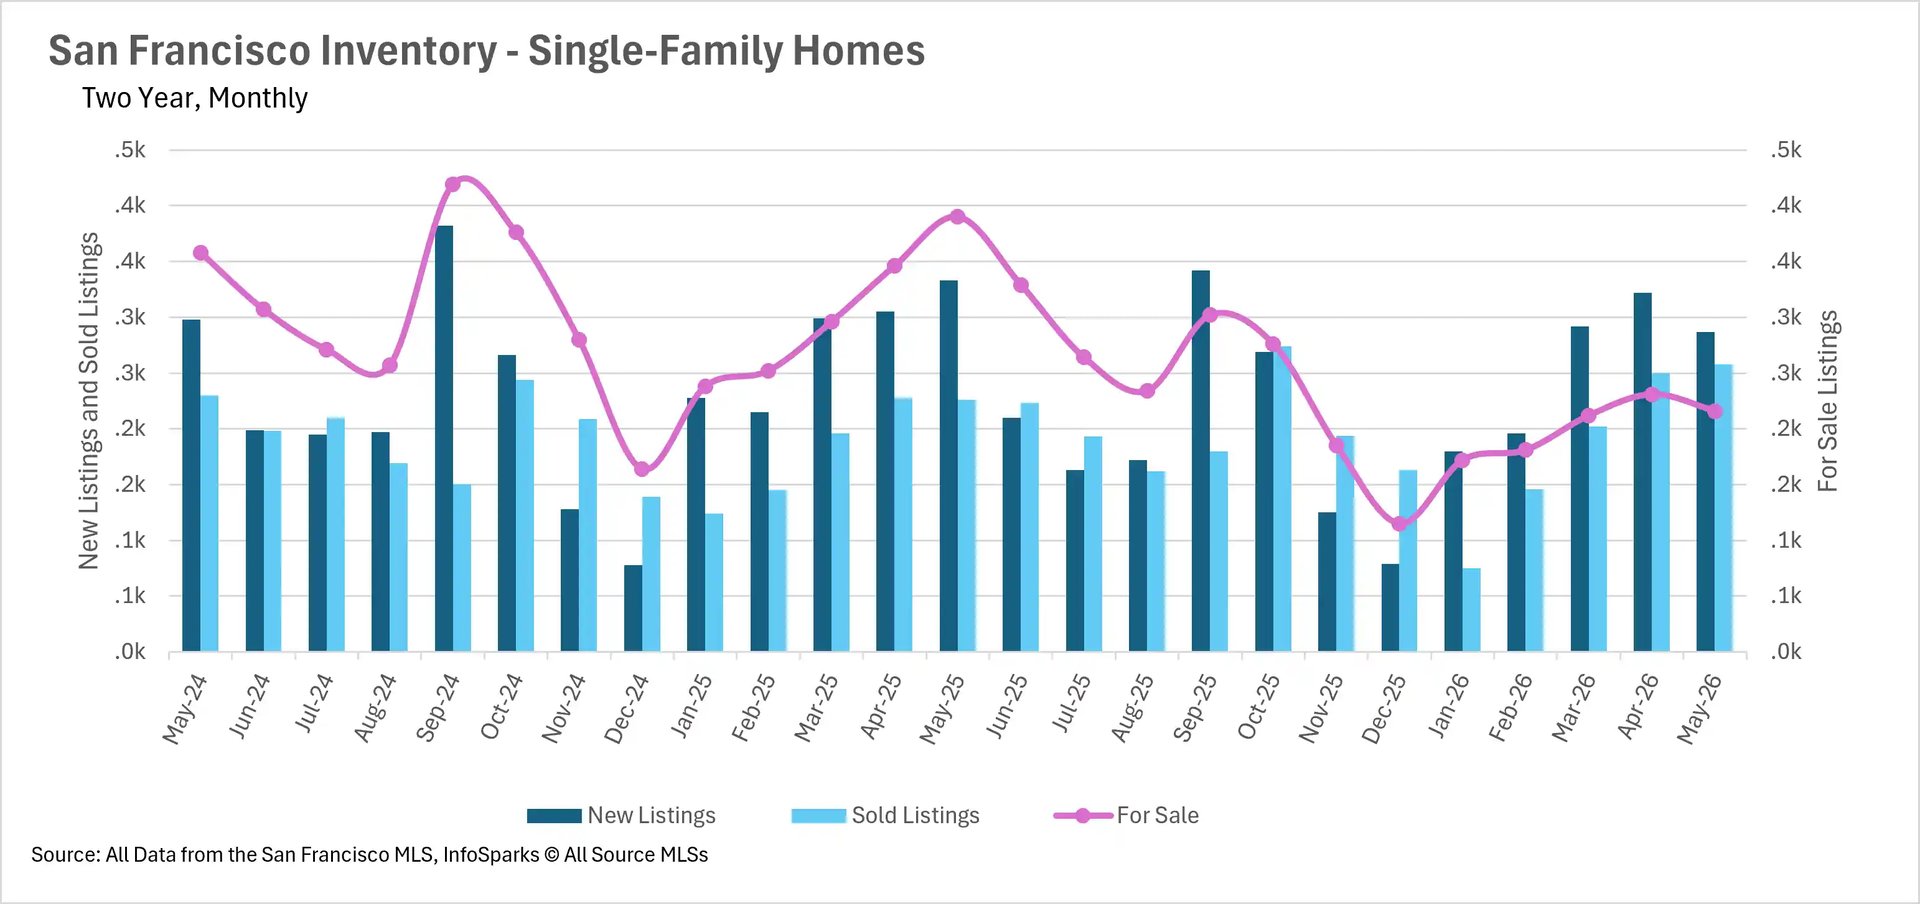
Inventory has been cut nearly in half compared to last year
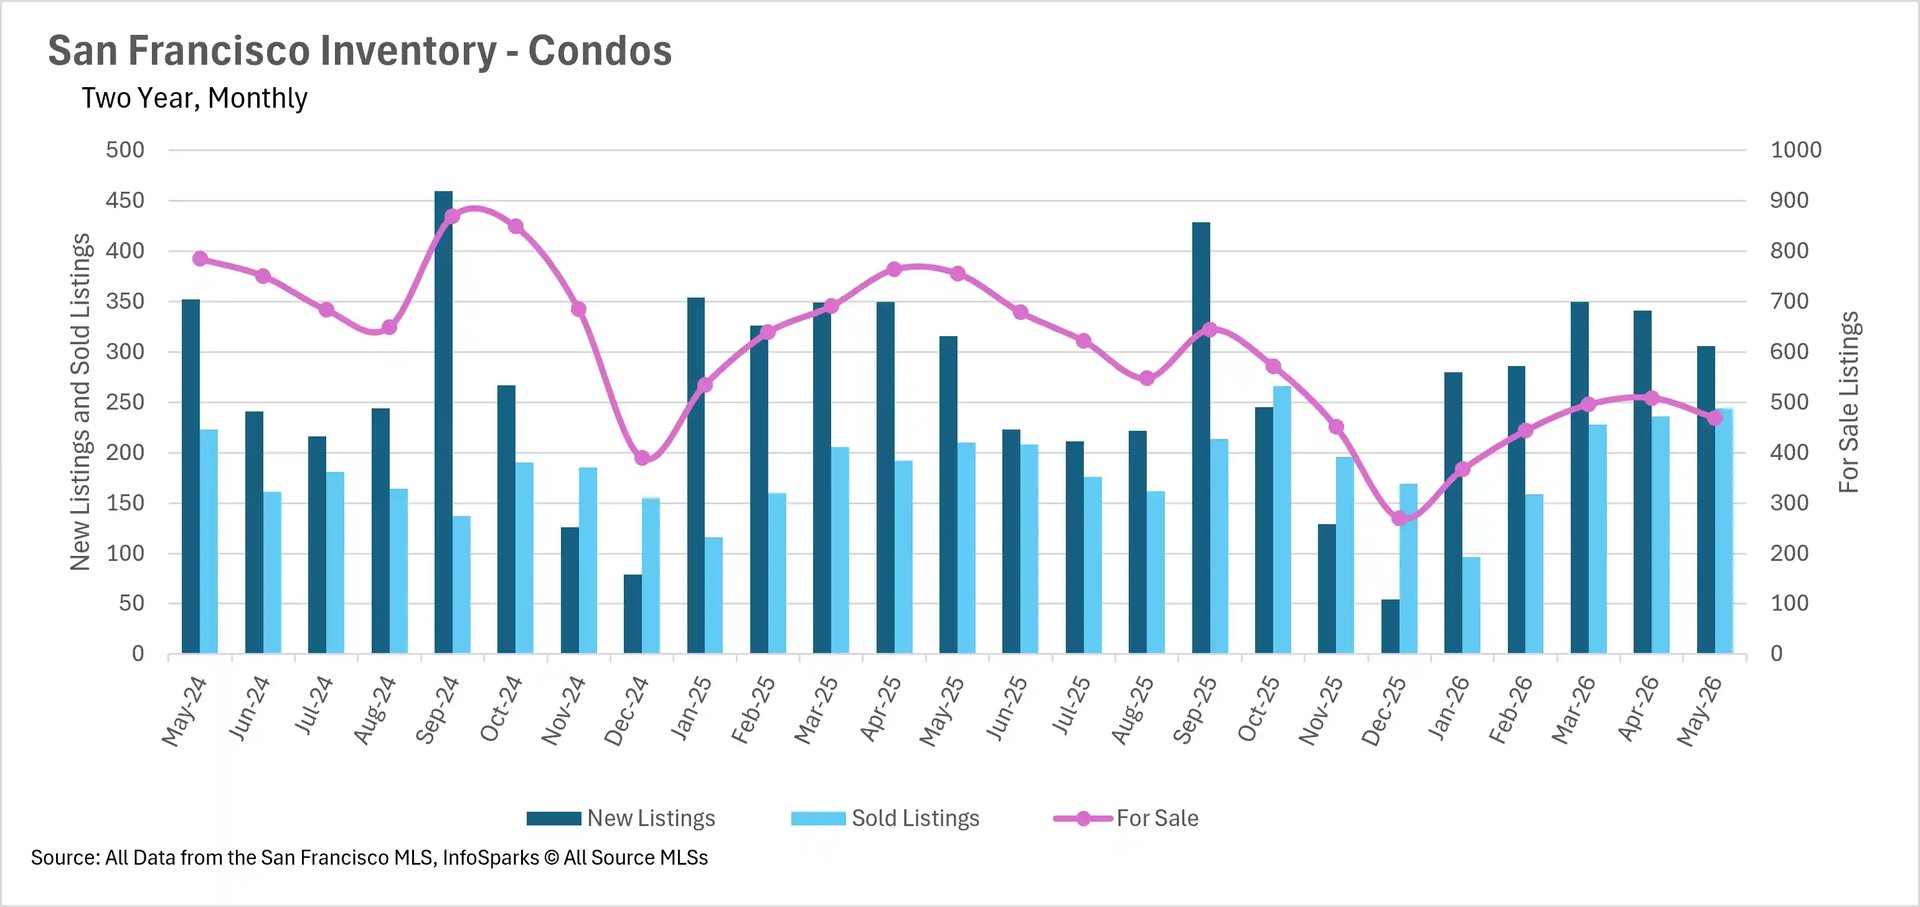
The inventory shortage that has defined San Francisco's market throughout 2026 shows no signs of easing. There are currently just 216 single-family homes for sale in the city, representing a staggering 44.62% decline compared to May 2025. The condo market is facing a similar crunch, with inventory down 37.96% year-over-year to 469 units. Combined, there are fewer than 700 homes available for sale in all of San Francisco. The good news for sellers is that their properties are in high demand; The challenge for buyers is finding anything suitable to purchase in the first place.
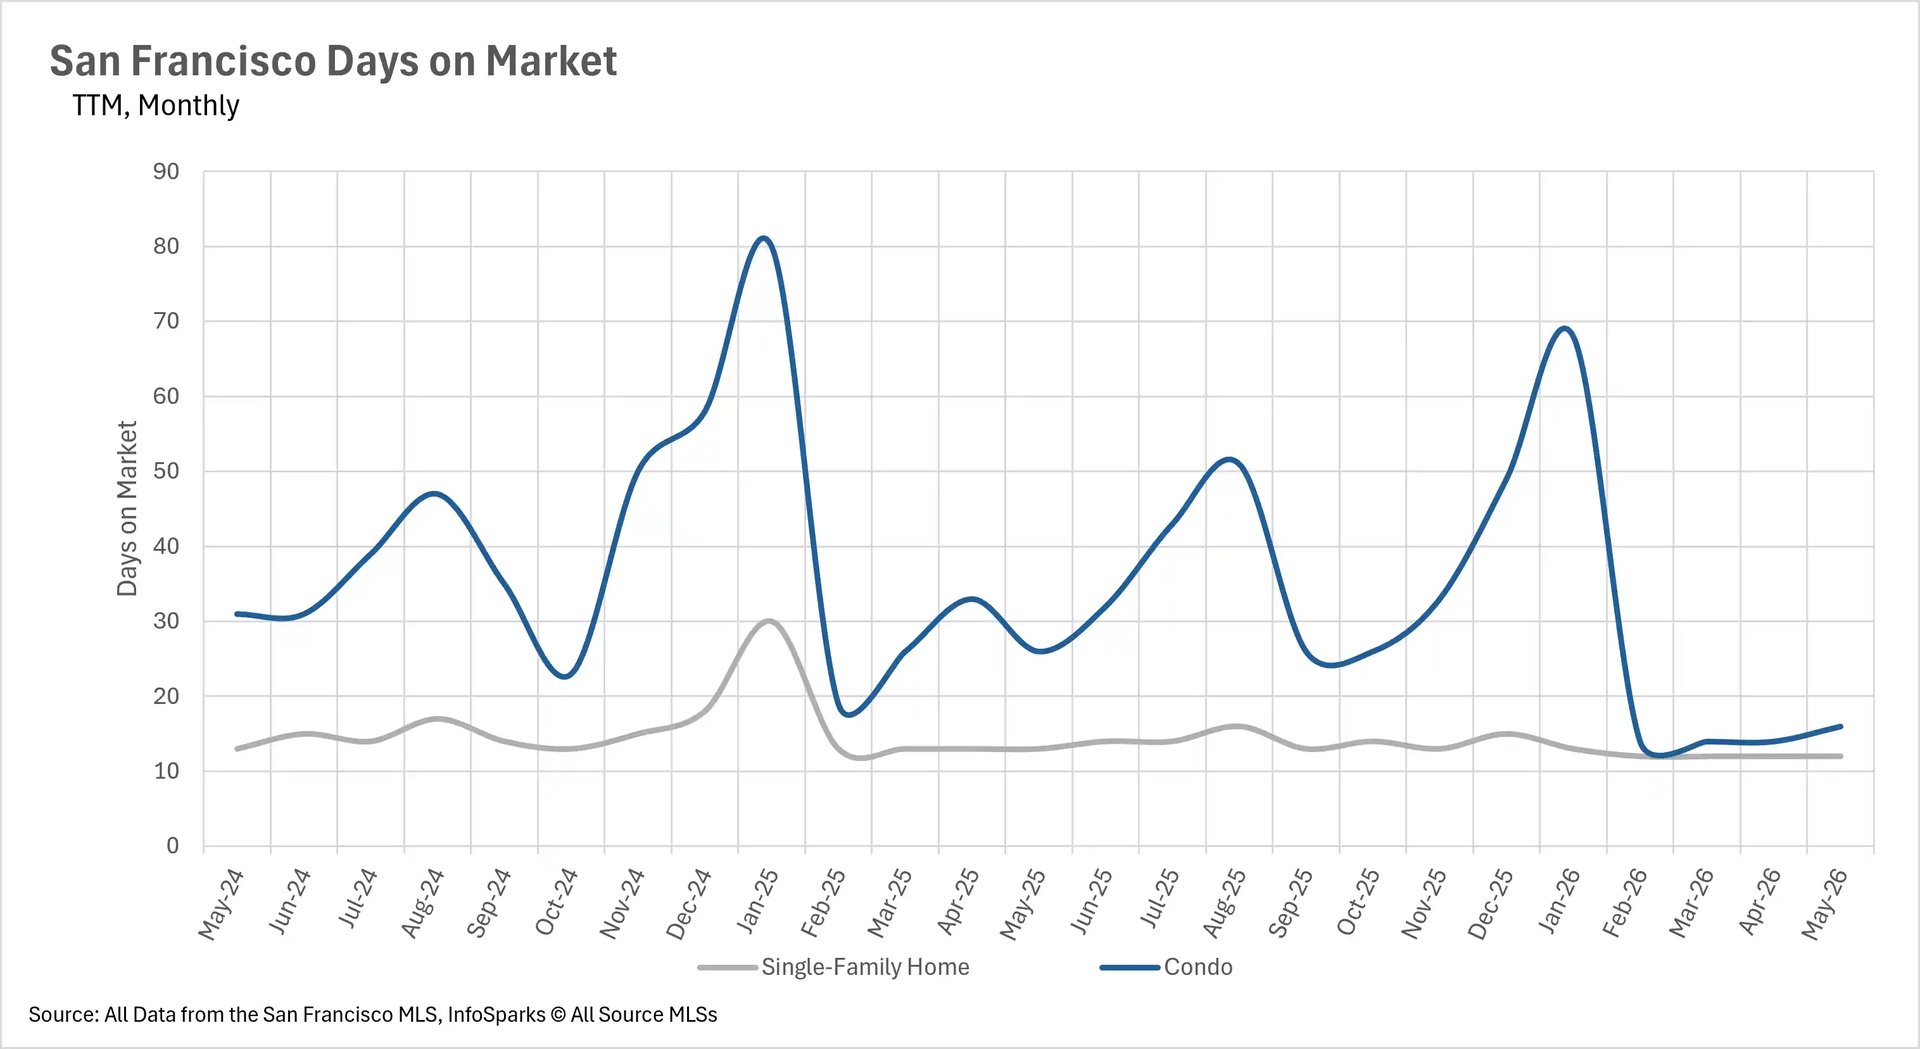
Homes are flying off the market at a breakneck pace
With inventory at such critically low levels, listings are being snapped up almost immediately. The average single-family home is selling in just 12 days, representing a 7.69% decrease compared to last May. The condo market has seen an even more dramatic acceleration, with the average condo selling in just 16 days, a 38.46% year-over-year decline. For context, last May the average condo sat on the market for 26 days. This rapid pace continues to put buyers at a disadvantage, as there is virtually no time to weigh options before committing to an offer.
San Francisco remains one of the most competitive seller's markets in the state
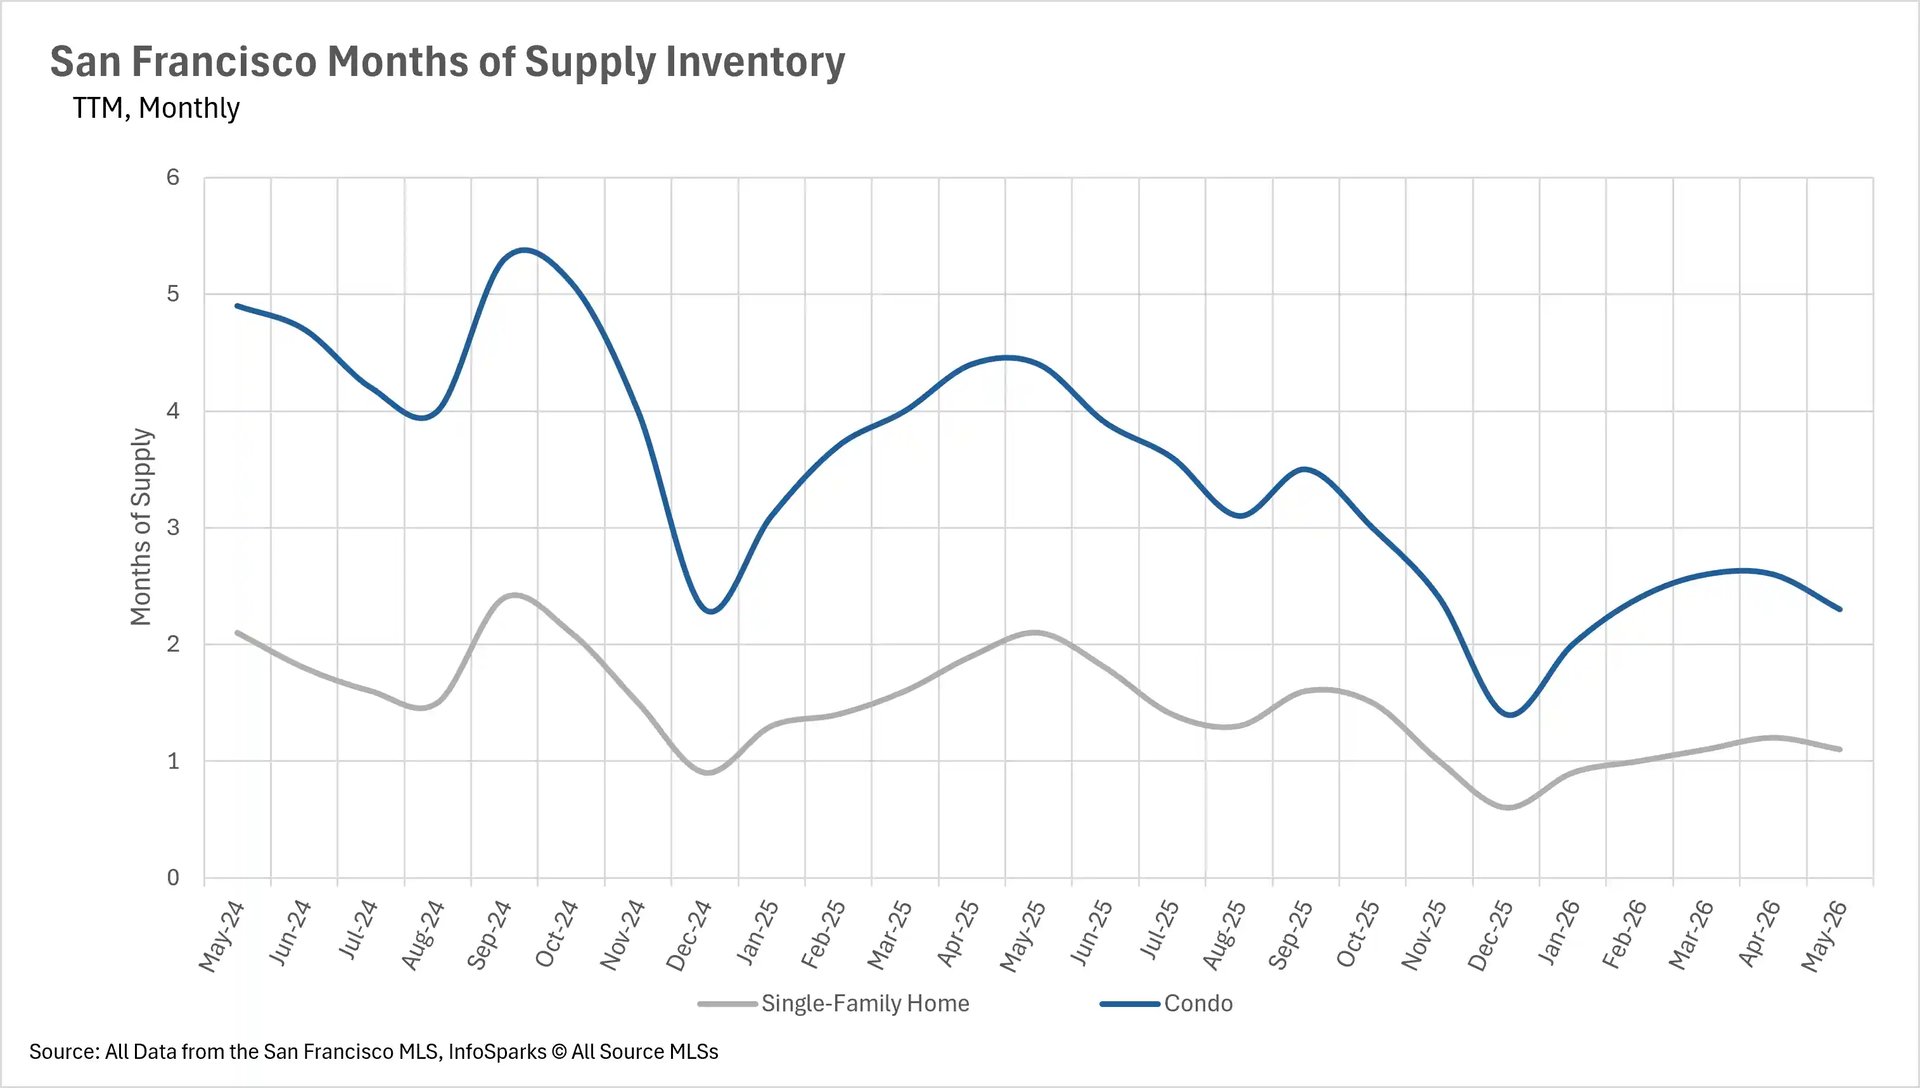
When determining whether a market is a buyers' market or a sellers' market, we look at the Months of Supply Inventory (MSI) metric. The state of California has historically averaged around three months of MSI, so any area with at or around three months of MSI is considered a balanced market. Any market that has less than three months of MSI is considered a seller's market, whereas markets with more than three months of MSI are considered buyers' markets.
With just 1.1 months of single-family home inventory and 2.3 months of condo inventory on the market, San Francisco remains a deeply entrenched seller's market across all property types. Both figures are down nearly 48% year-over-year, representing some of the most dramatic shifts we've seen in recent memory. The condo market, which was firmly in buyer's territory last May at 4.4 months of supply, has completely transformed into a strong seller's market. Until new inventory enters the market in meaningful quantities, sellers will continue to hold all the cards.