The Local Lowdown
Quick Take:
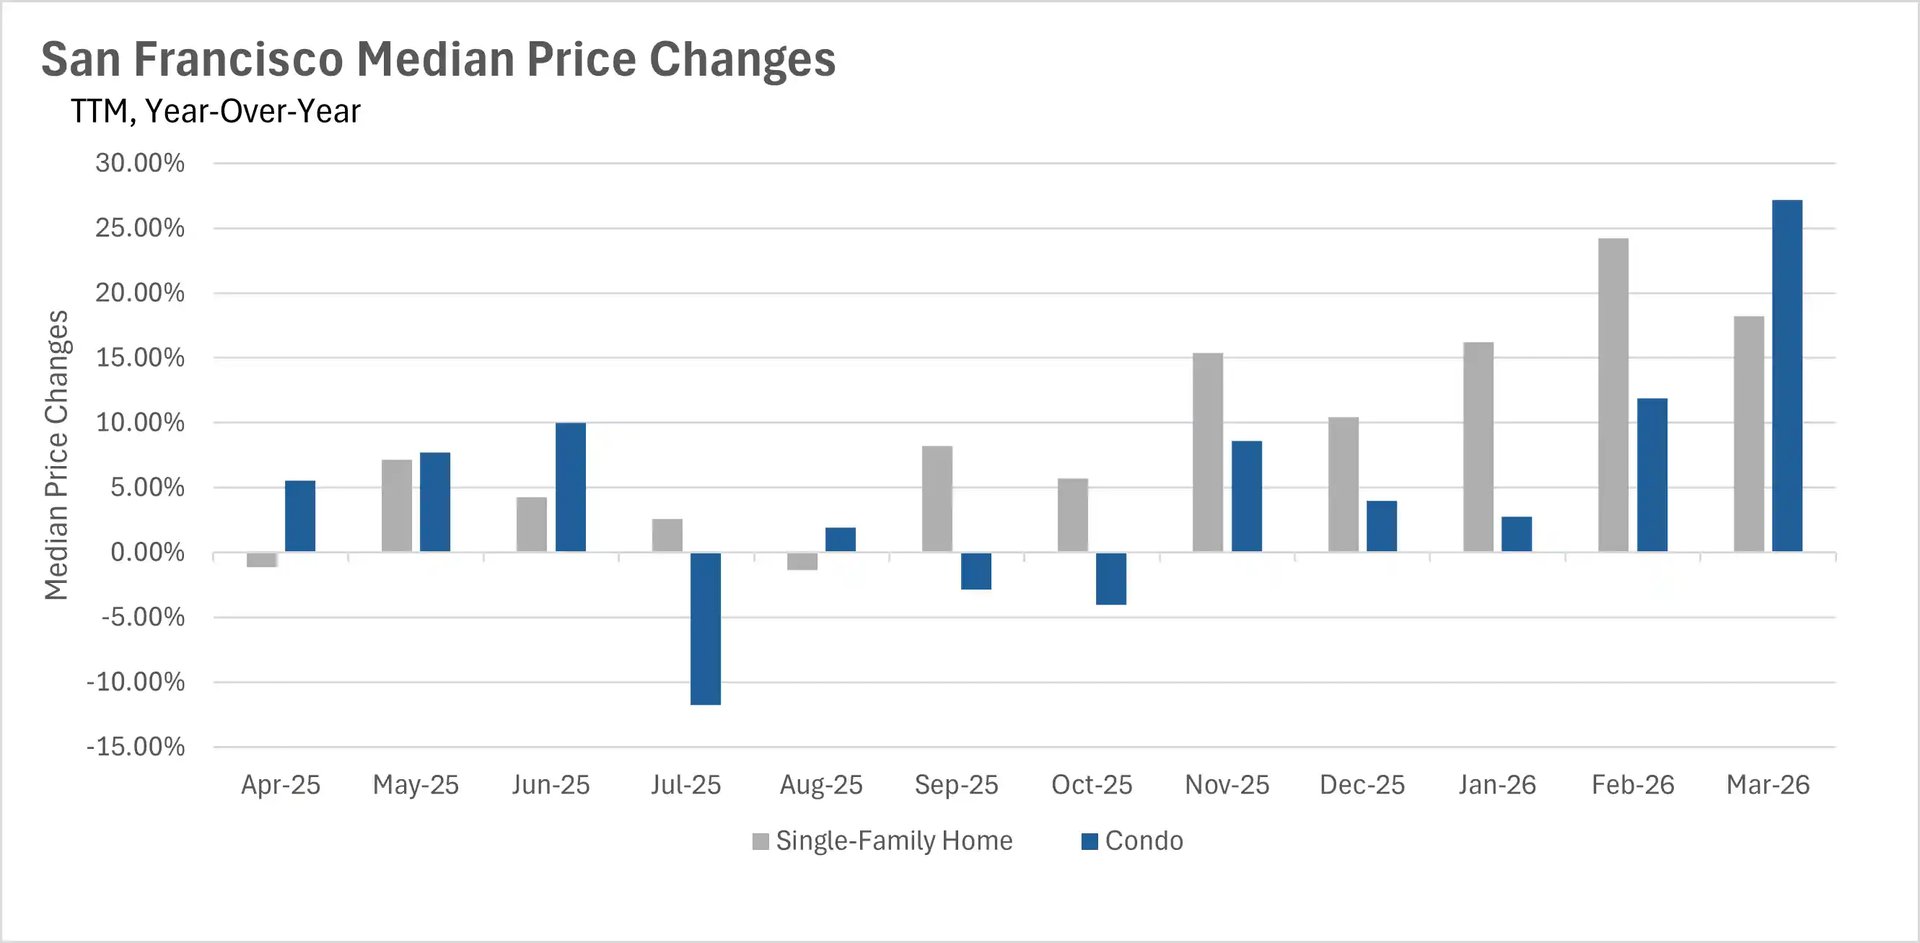
- Median sale prices are soaring in San Francisco, with condos up more than 27% and single-family homes up more than 18% year-over-year.
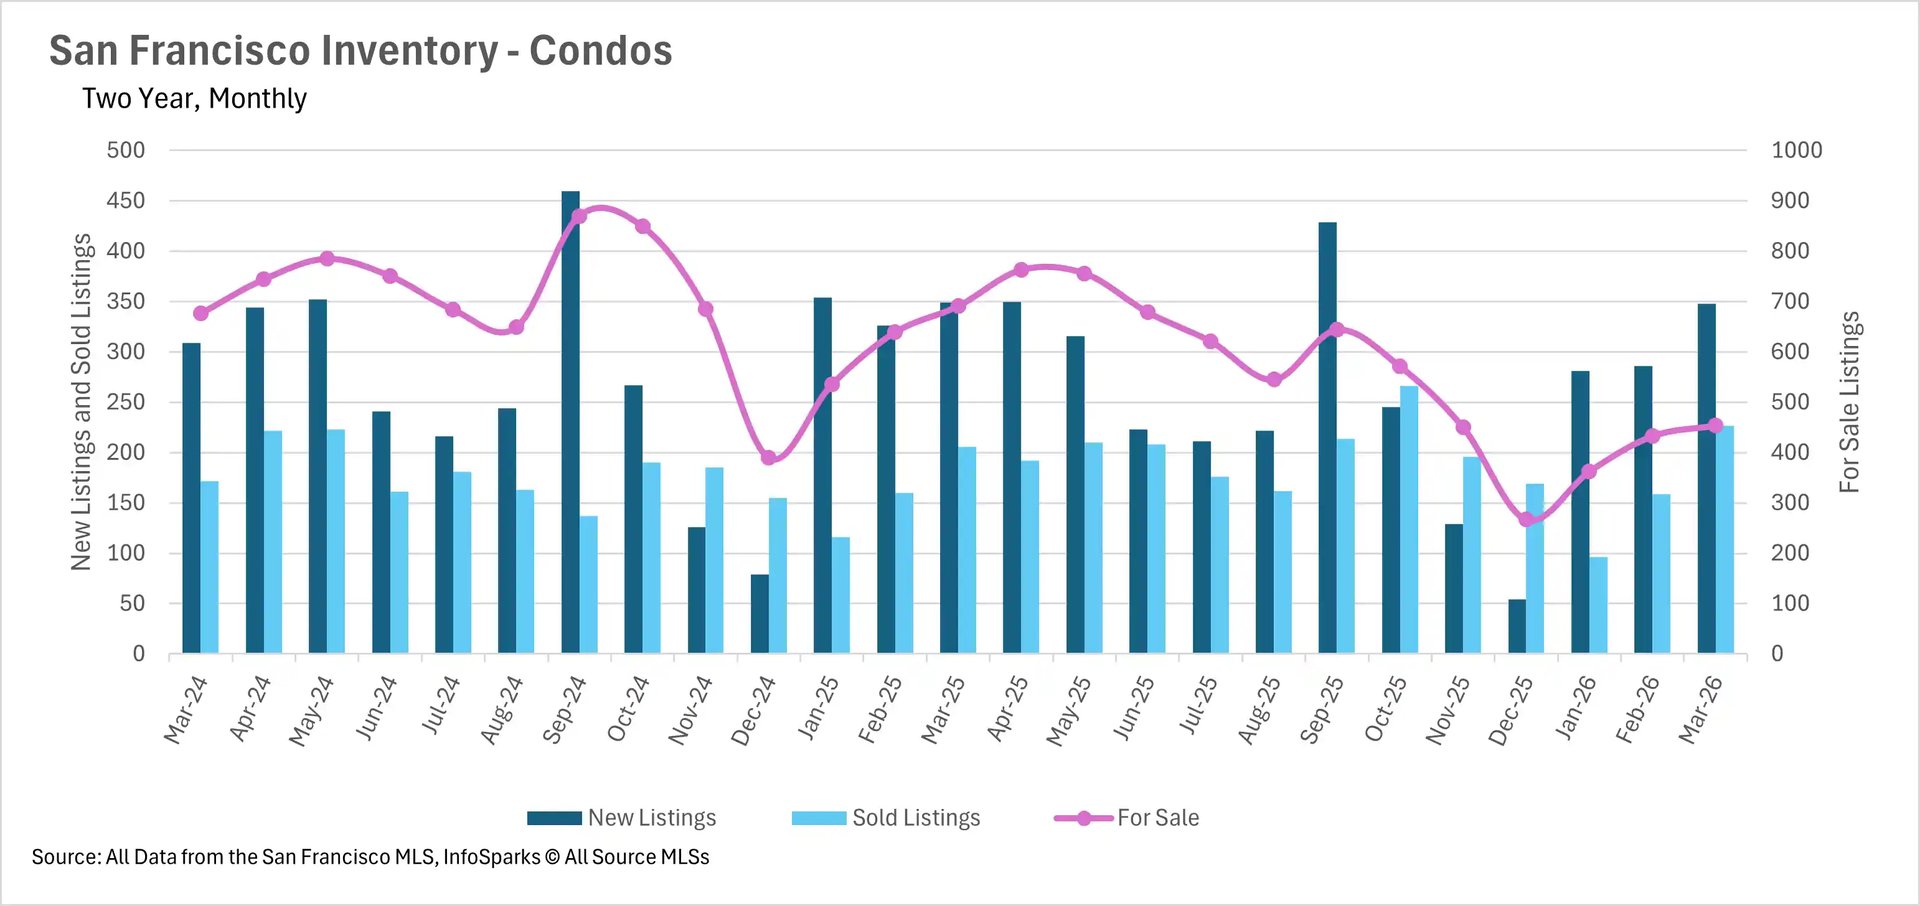
- Inventory levels remain more than a third below where they were last year, despite the typical spring uptick in new listings.
- Listings are selling at a breakneck pace, with single-family homes moving in 12 days and condos in just 14 days.
Note: You can find the charts/graphs for the Local Lowdown at the end of this section.
San Francisco's spring market kicks off with record-breaking price growth
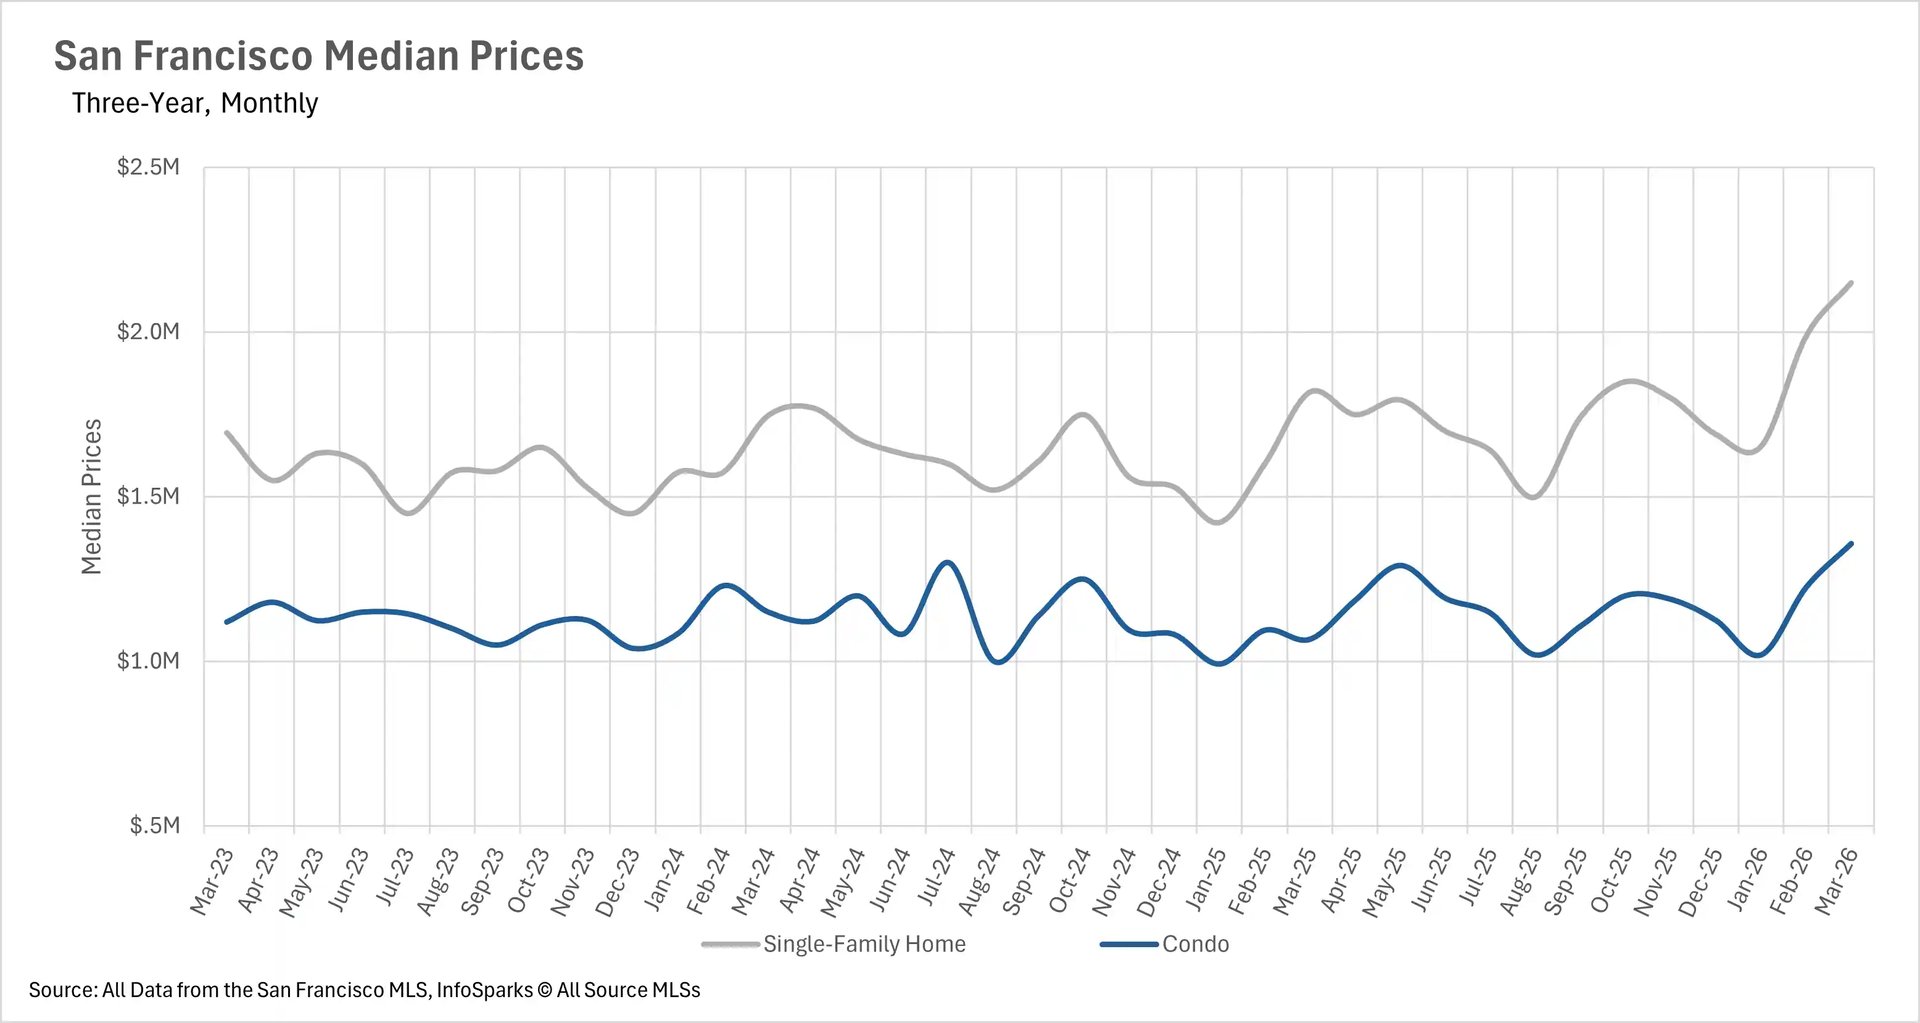
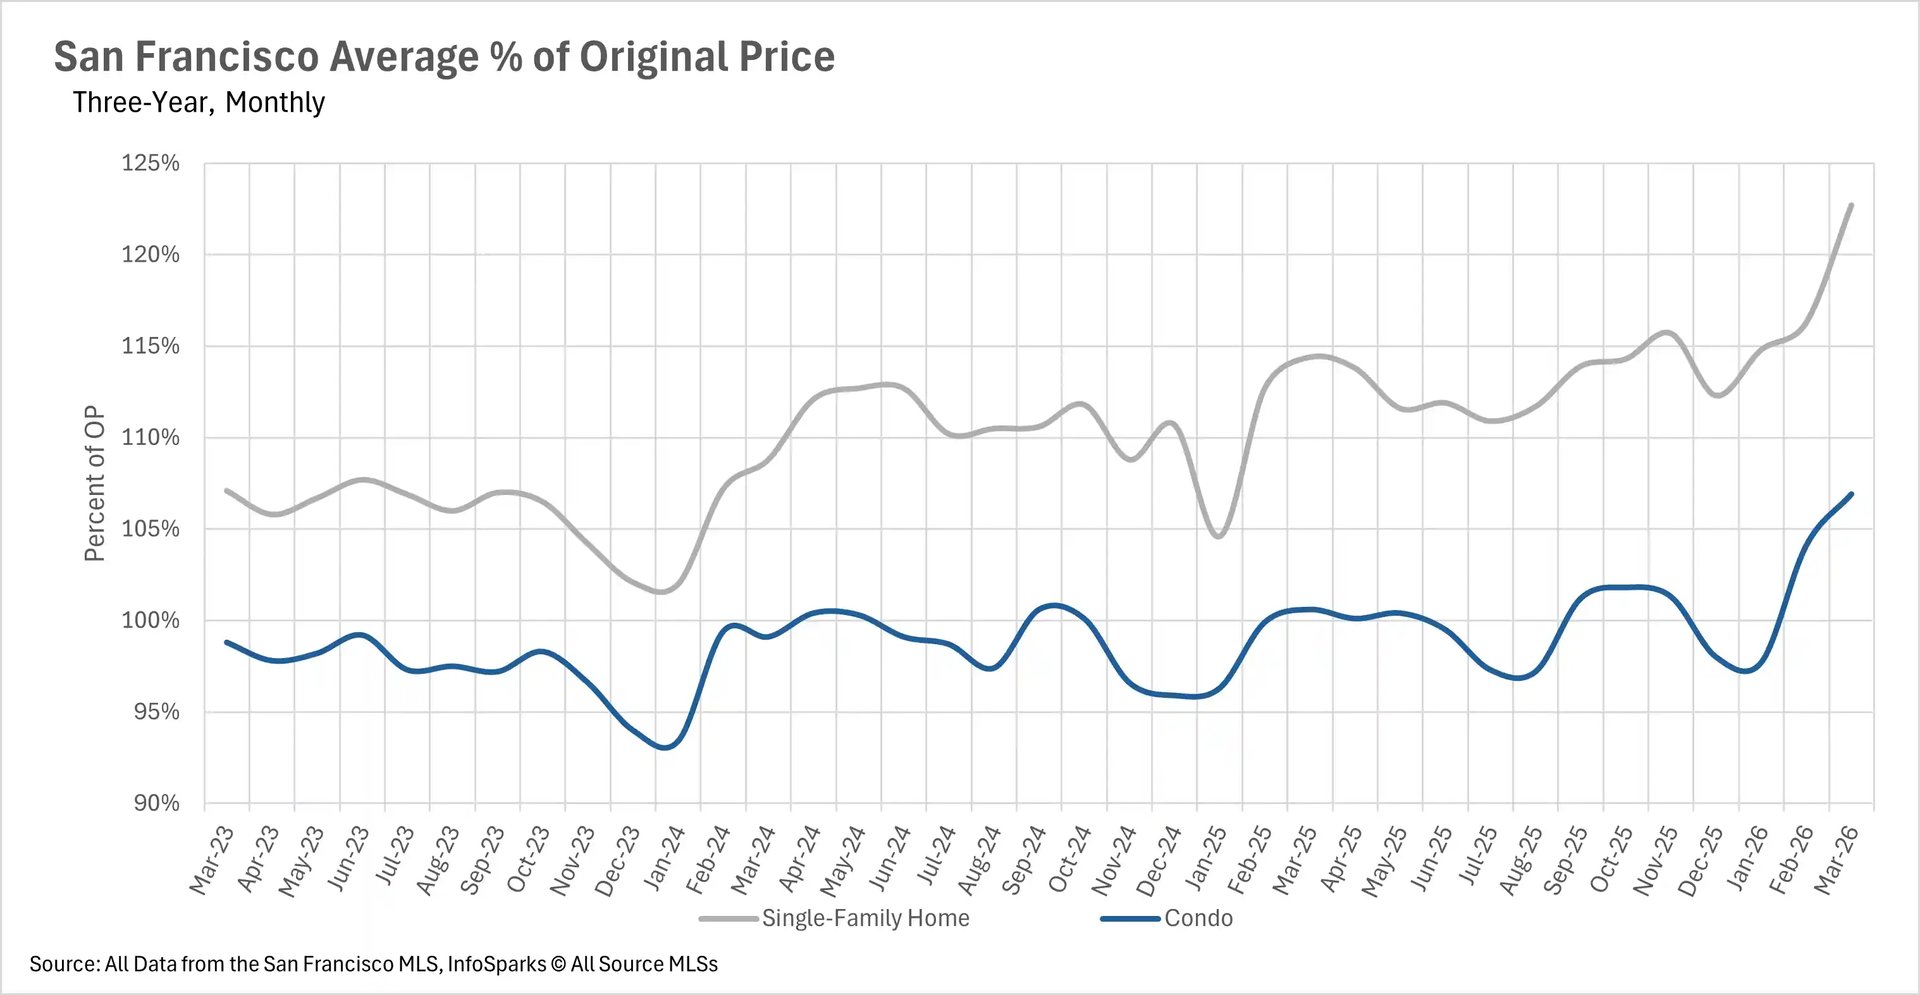
March brought explosive price appreciation to San Francisco, with both property types posting exceptional year-over-year gains. Single-family homes saw an 18.24% increase in median sale price, with the median home selling for $2,150,000. The condo market stole the spotlight this month, however, with a remarkable 27.17% surge in median sale price to $1,357,500. Competition for homes has reached an extraordinary level, with single-family homes selling for nearly 23% over the original asking price on average, and condos selling for nearly 7% over asking. These are some of the highest premiums we've seen in recent memory, reflecting the intense demand in San Francisco's housing market.
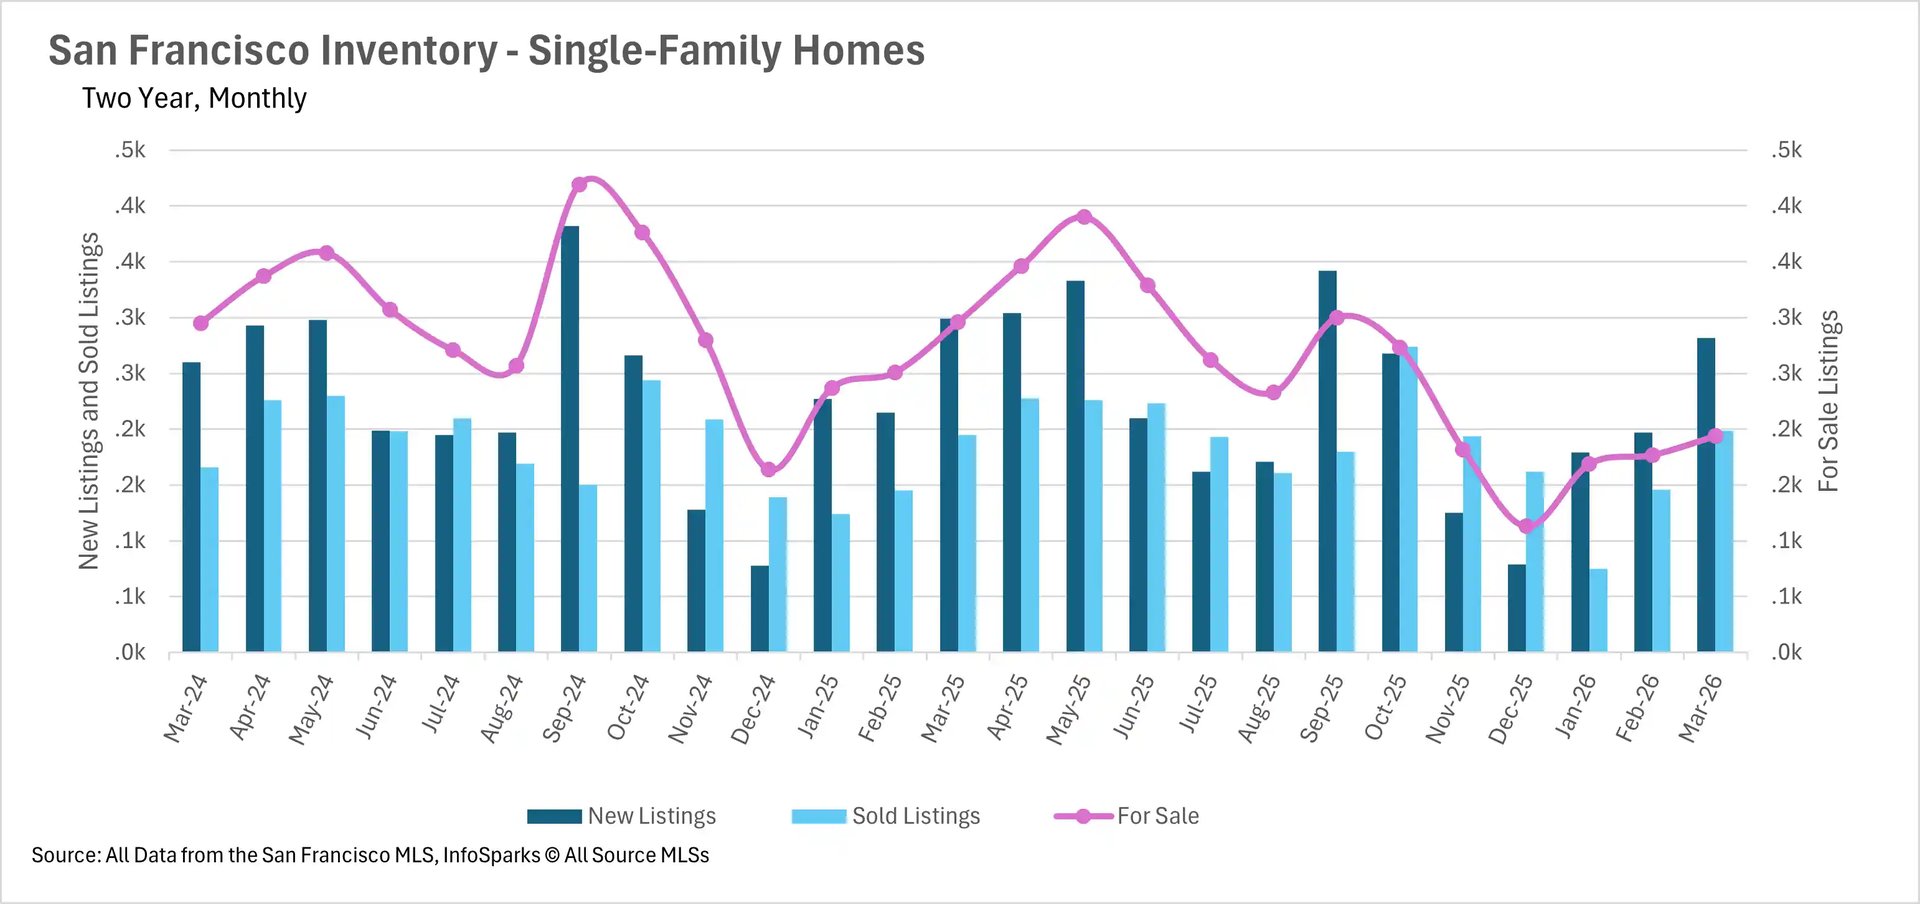
Inventory remains severely constrained as the spring selling season heats up
Despite the arrival of spring and the typical increase in new listings, inventory levels remain drastically below where they were a year ago. There are currently just 194 single-family homes for sale in San Francisco, representing a 34.46% decline compared to March 2025. The condo market is facing a similar shortage, with inventory down 34.30% year-over-year to 454 units. While new listings did increase from February, with 282 new single-family homes and 348 new condos hitting the market, the pace of sales has kept overall inventory suppressed. Buyers continue to face an extremely limited selection of properties as we head deeper into the spring season.
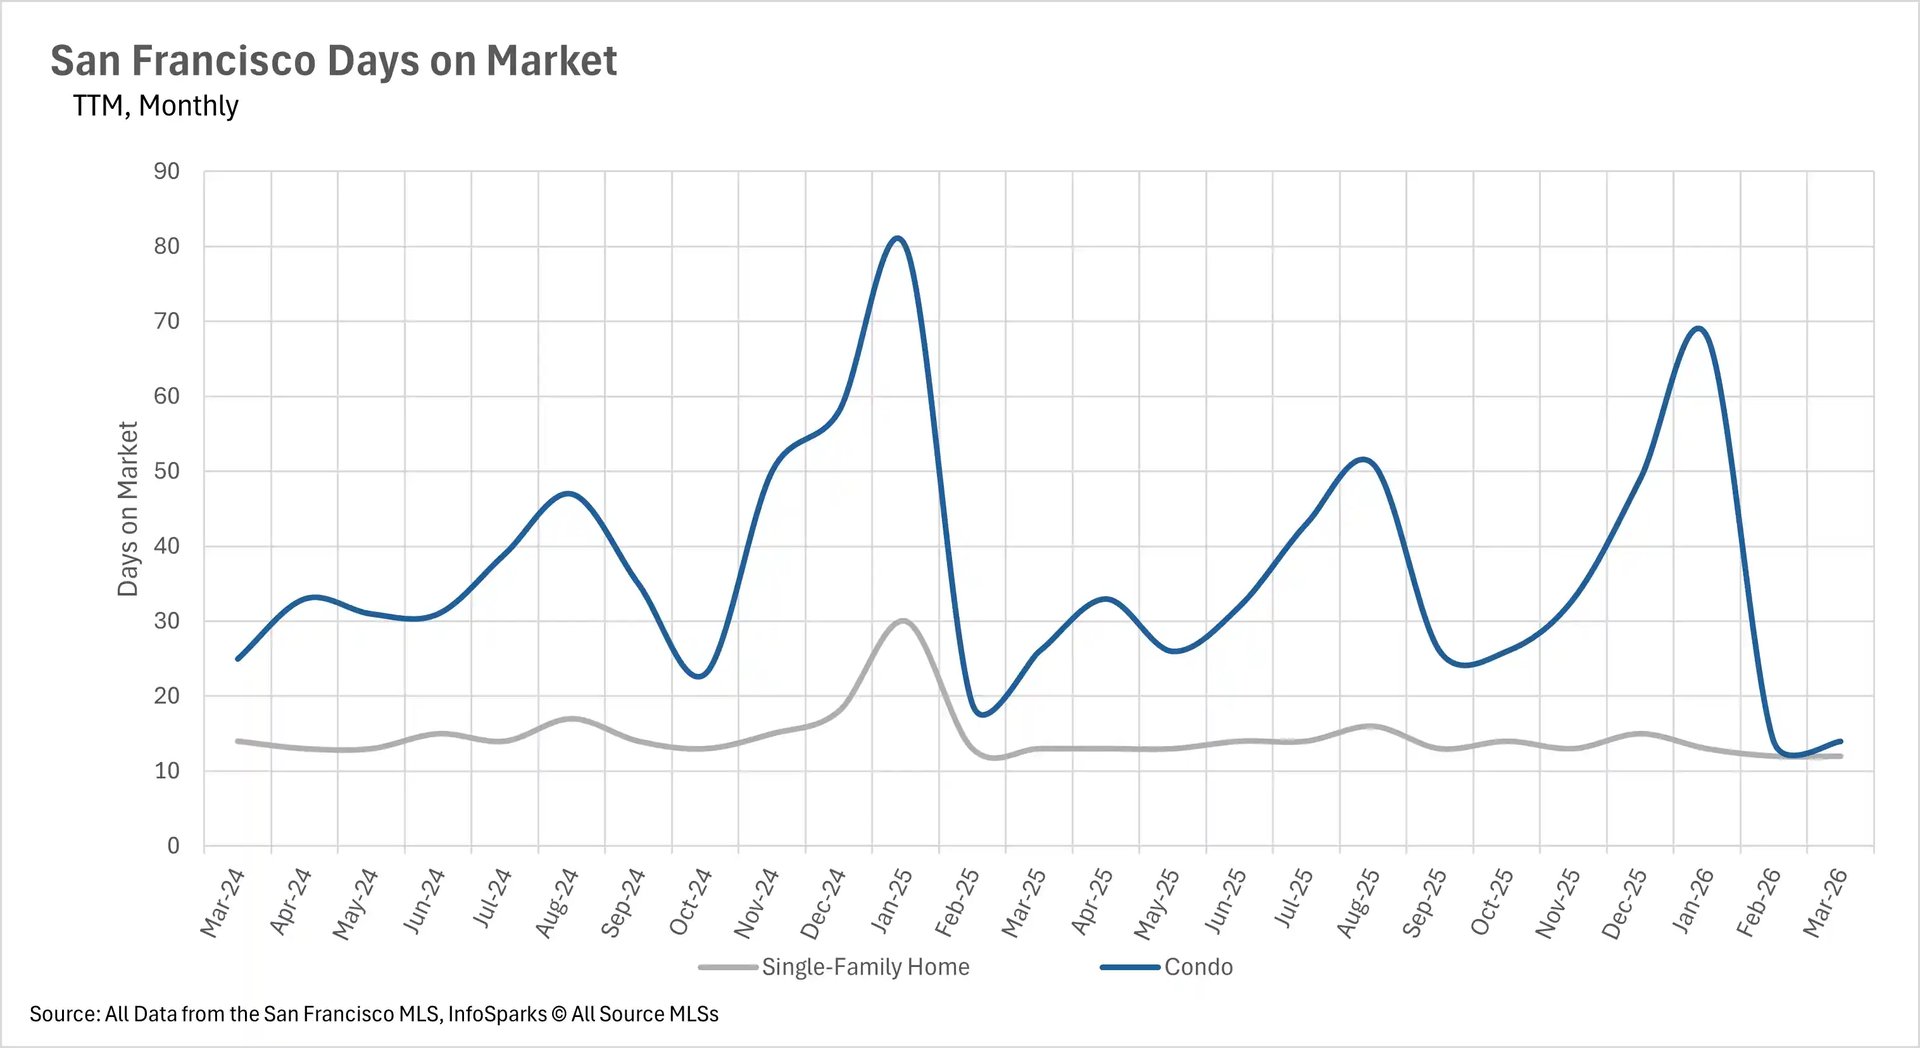
Homes are selling almost as quickly as they're listed
The severe inventory shortage has created one of the fastest-moving markets San Francisco has seen in years. The average single-family home is selling in just 12 days, representing a 7.69% decrease compared to last March. The condo market has seen an even more dramatic acceleration, with the average condo selling in just 14 days, a stunning 46.15% year-over-year decline. For buyers, this means there is virtually no time to deliberate before making an offer, and multiple-offer situations have become the norm rather than the exception.
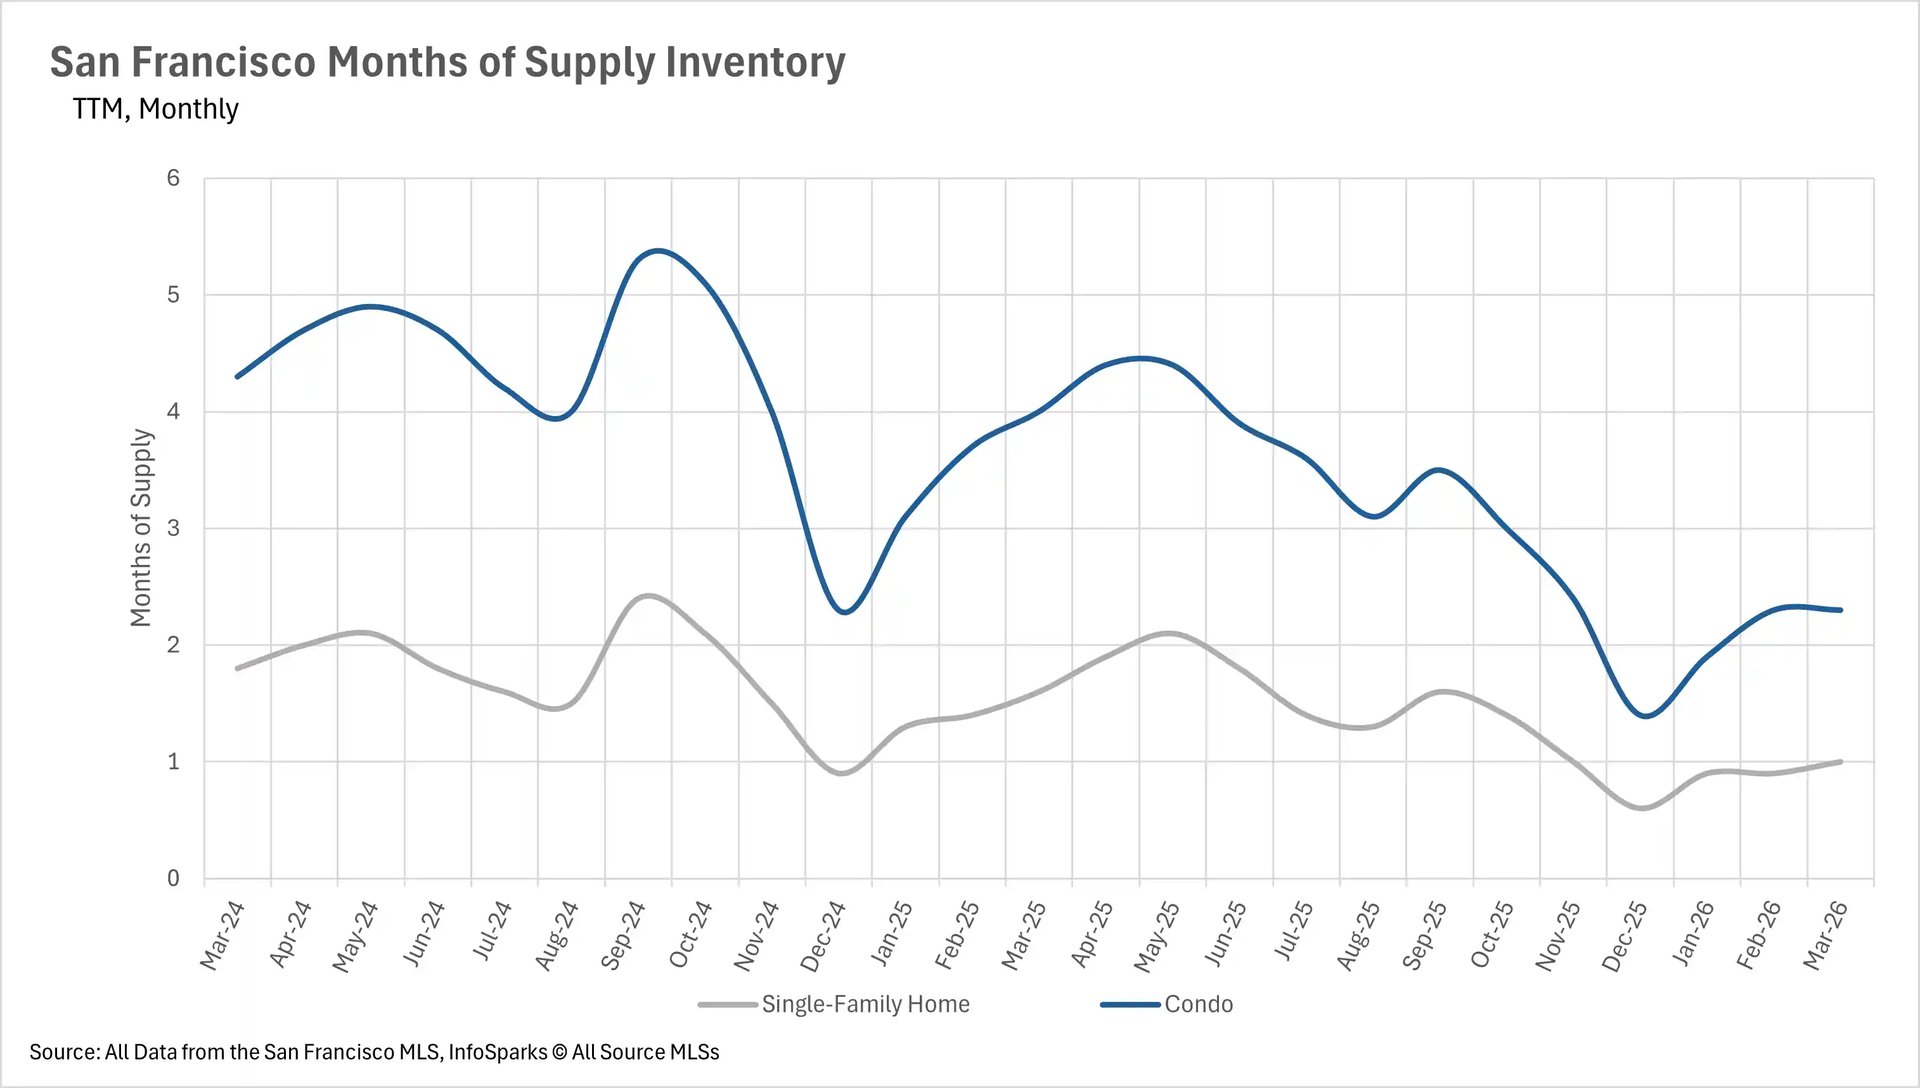
San Francisco remains one of the tightest seller's markets in the state
When determining whether a market is a buyers' market or a sellers' market, we look to the Months of Supply Inventory (MSI) metric. The state of California has historically averaged around three months of MSI, so any area with at or around three months of MSI is considered a balanced market. Any market that has lower than three months of MSI is considered a seller's market, whereas markets with more than three months of MSI are considered buyers' markets.
With just 1.0 months of single-family home inventory and 2.3 months of condo inventory on the market, San Francisco remains a deeply entrenched seller's market across all property types. Both figures are down more than 37% year-over-year, and the condo market has shifted from a buyers' market last year to a strong seller's market today. Sellers continue to enjoy significant leverage in negotiations, and buyers should be prepared for fierce competition throughout the spring season.