Welcome to the latest San Francisco Real Estate Market Report from Kinoko Real Estate! As your trusted local Real Estate experts in San Francisco, we're committed to providing you with the most accurate and insightful data to guide your home buying or selling journey in this dynamic city.
The Local Lowdown Quick Take:
-
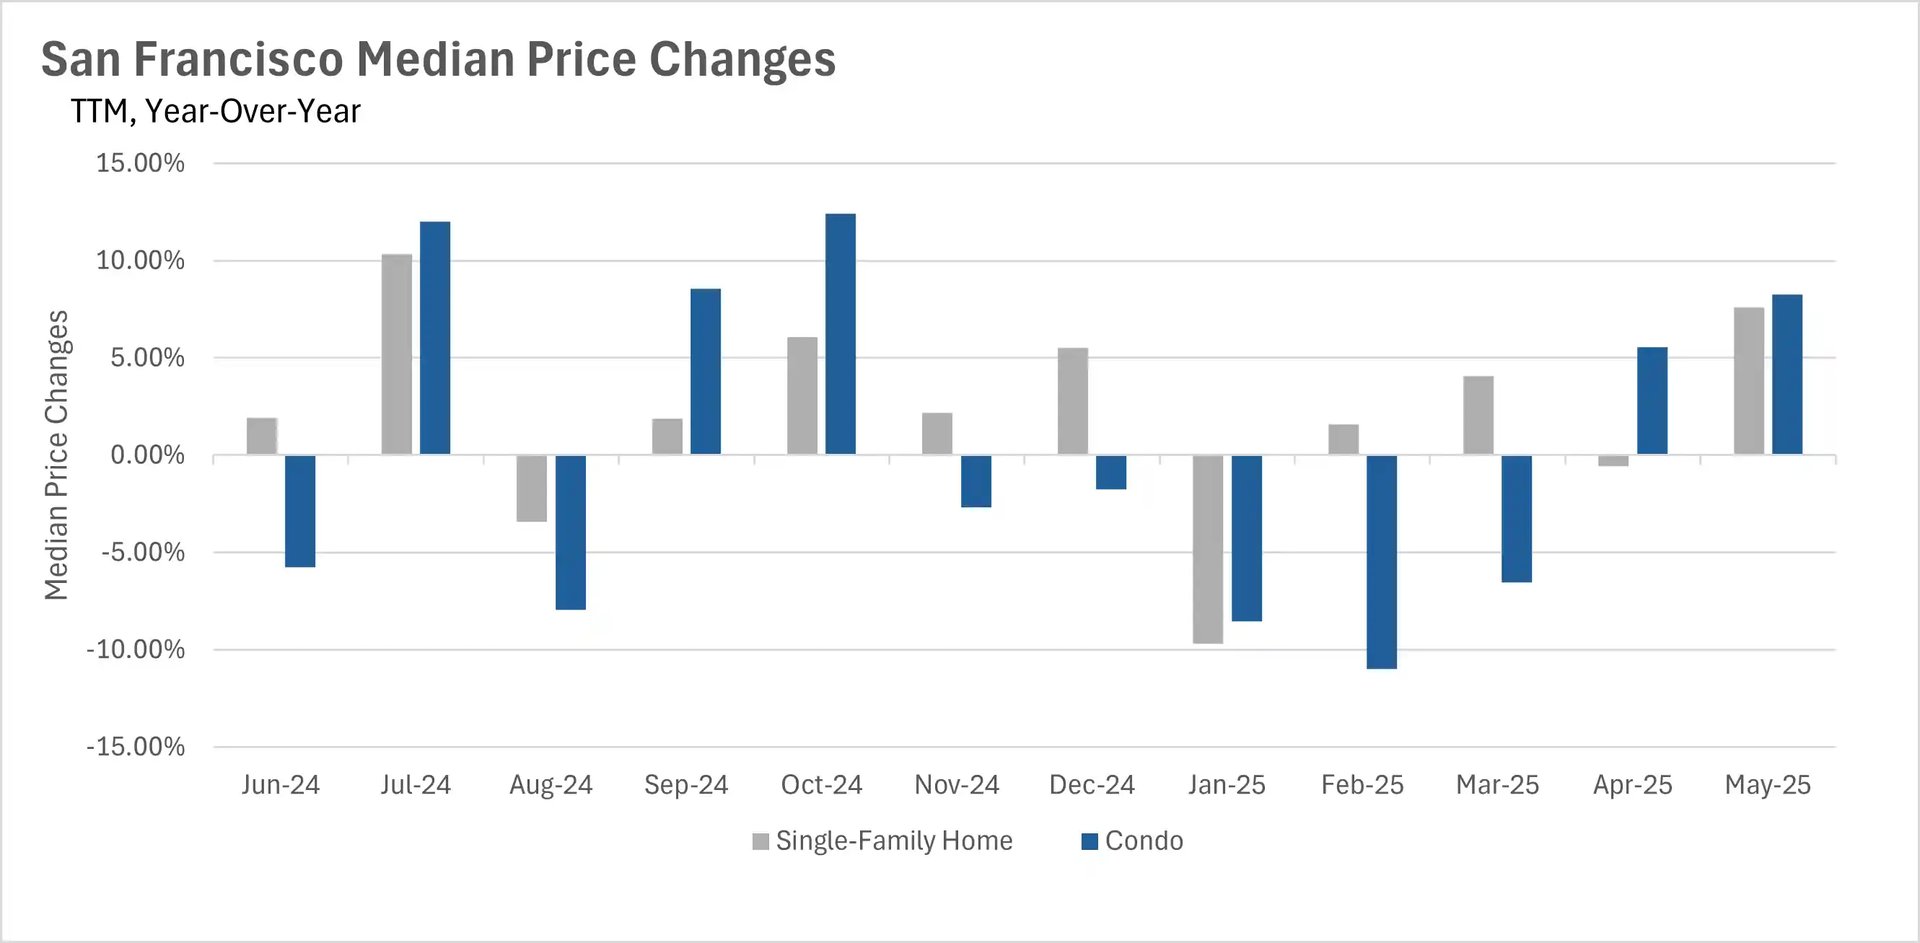
San Francisco median home prices surged significantly on a year-over-year basis in May, with San Francisco condo values increasing by over 8%.
-
San Francisco housing inventory remains tighter than last year, with fewer new listings hitting the market.
-
San Francisco properties are being snapped up incredibly quickly, with the average single-family home spending less than two weeks on the market.
Note: For detailed charts and graphs supporting these insights, please refer to the comprehensive data at the end of this report.
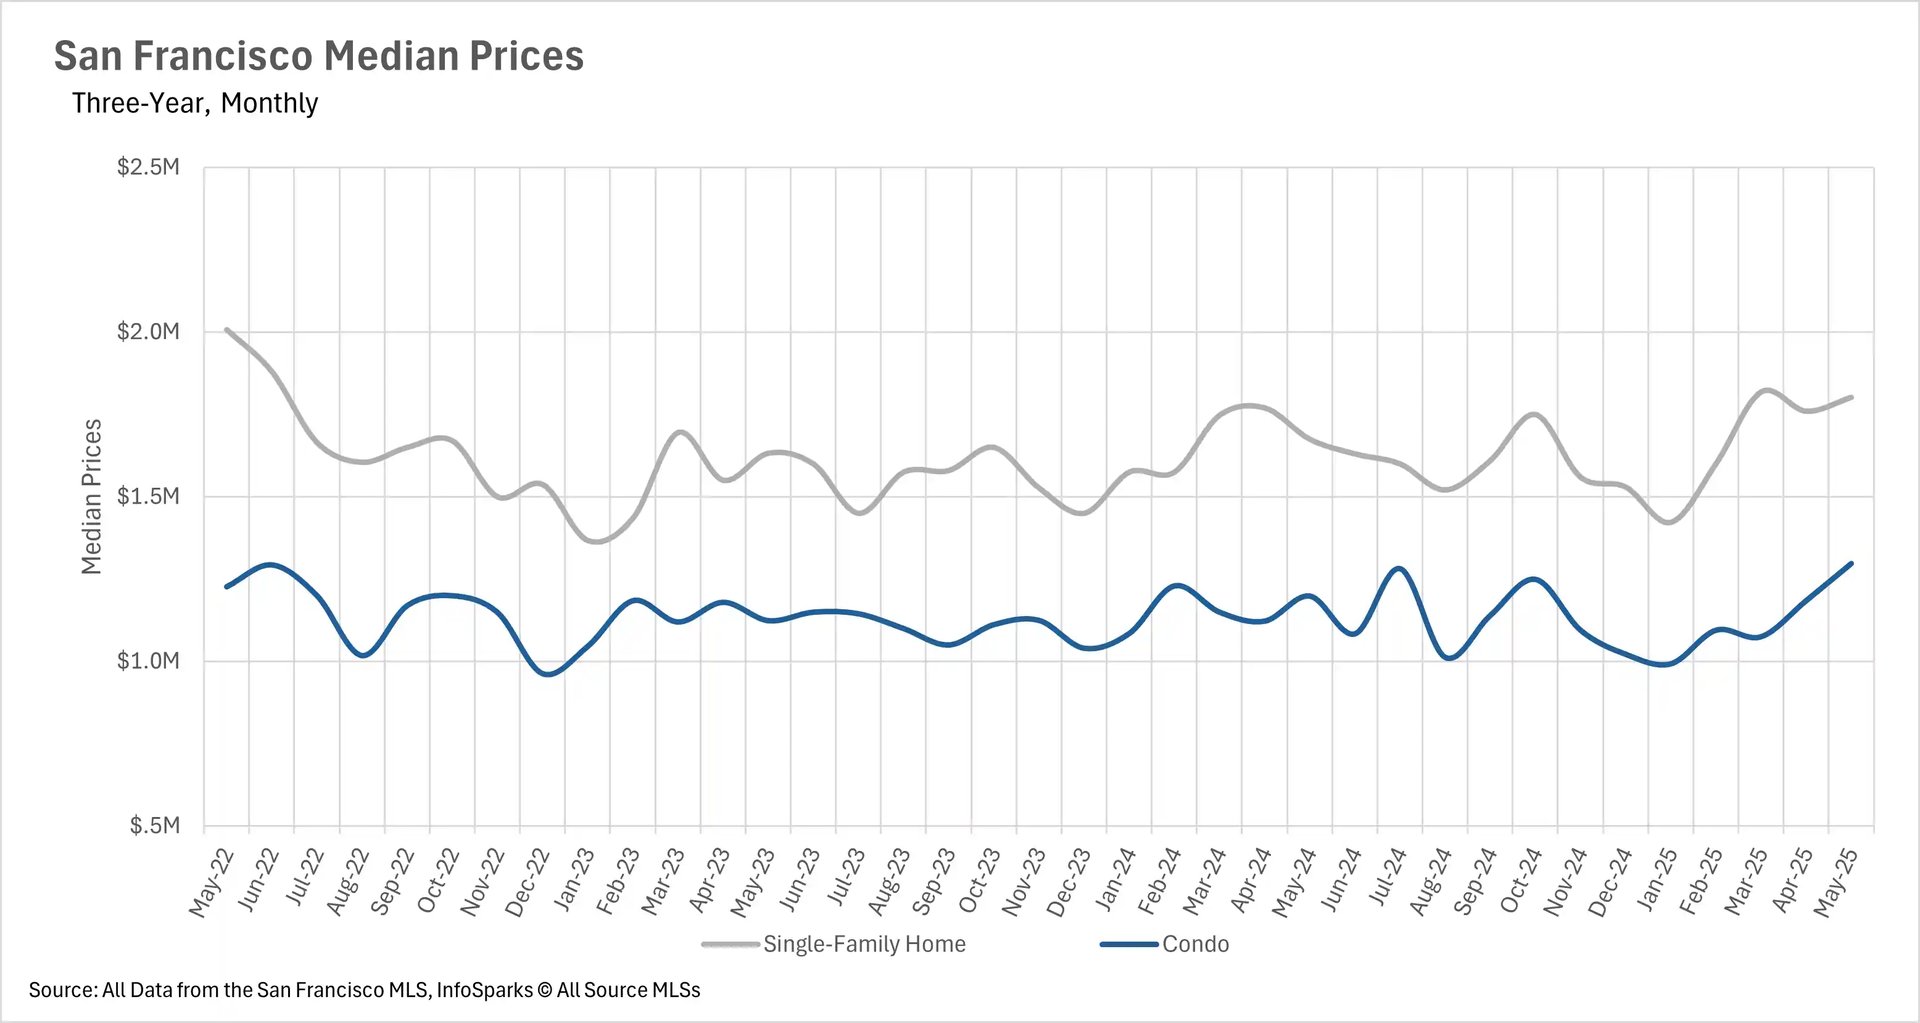
San Francisco Median Sale Prices Surge in May
Despite a downtrend in pricing observed in many other markets, San Francisco real estate has once again demonstrated remarkable resilience. In May, we witnessed a notable surge in median sale prices, with home values reaching some of the highest levels seen in over two years. The median single-family home in San Francisco sold for an impressive $1,802,000, marking a 7.58% increase compared to May of last year. Meanwhile, the median San Francisco condo sold for $1,298,000, representing a substantial year-over-year increase of 8.26%. This robust performance is largely attributable to the persistent decline in San Francisco housing inventory over recent years.
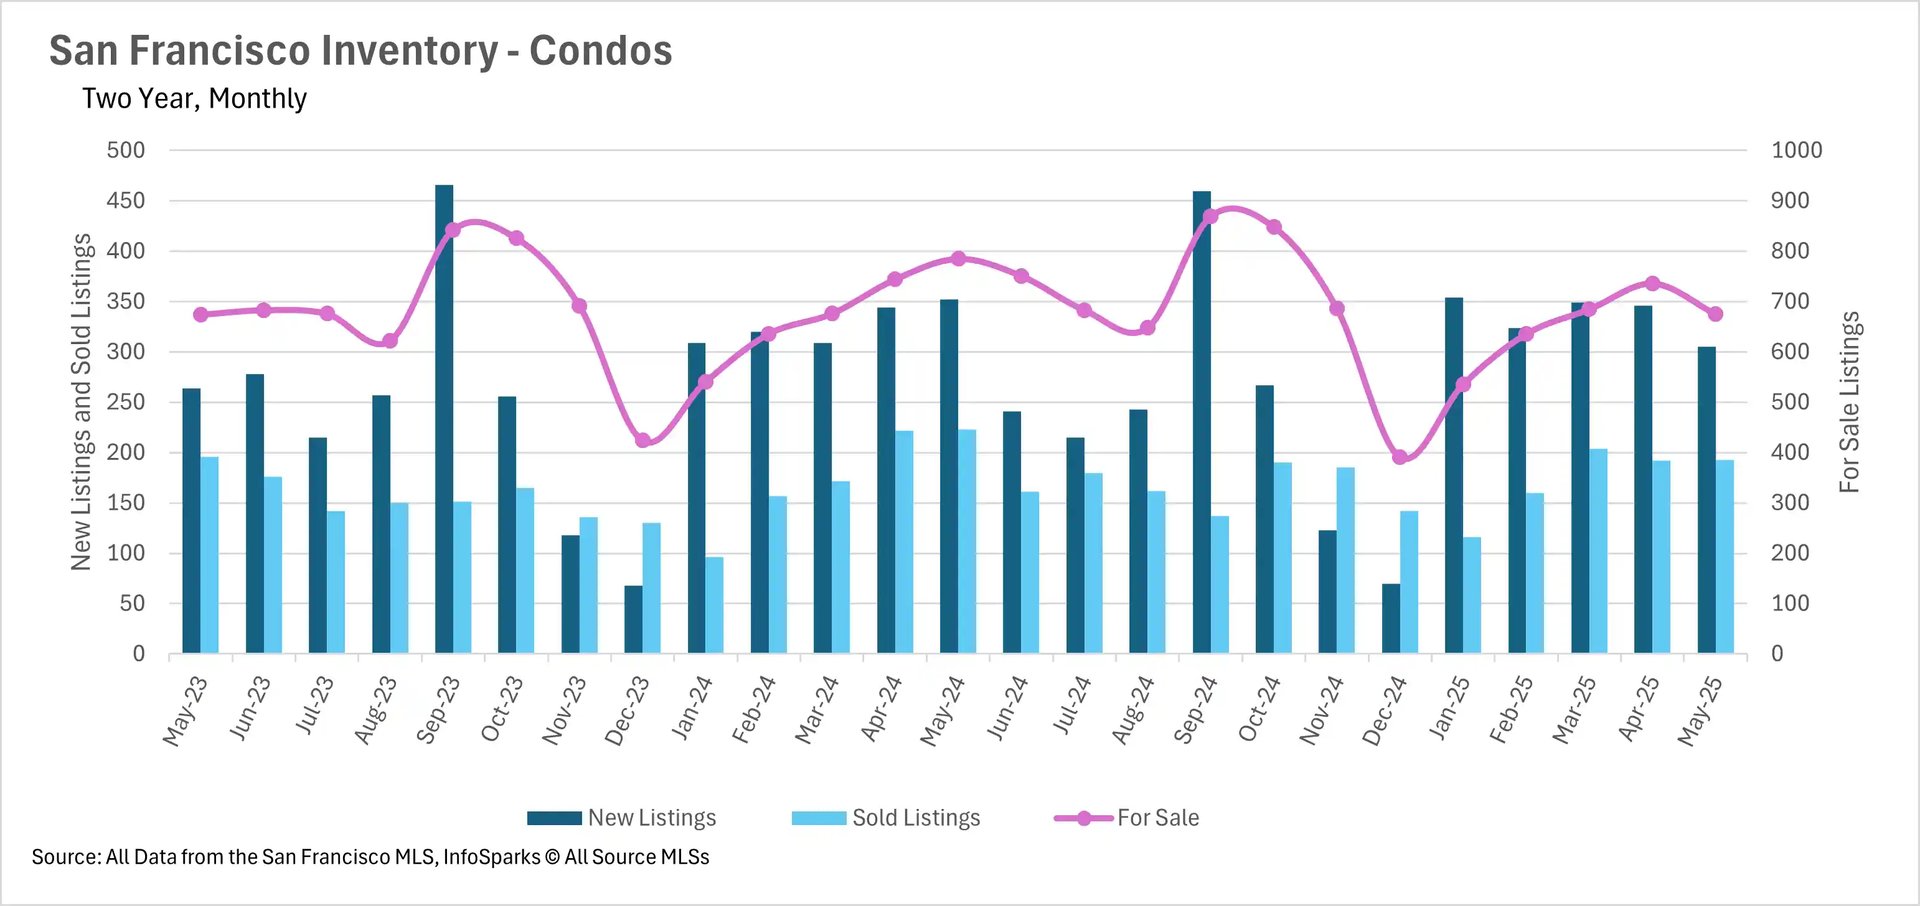
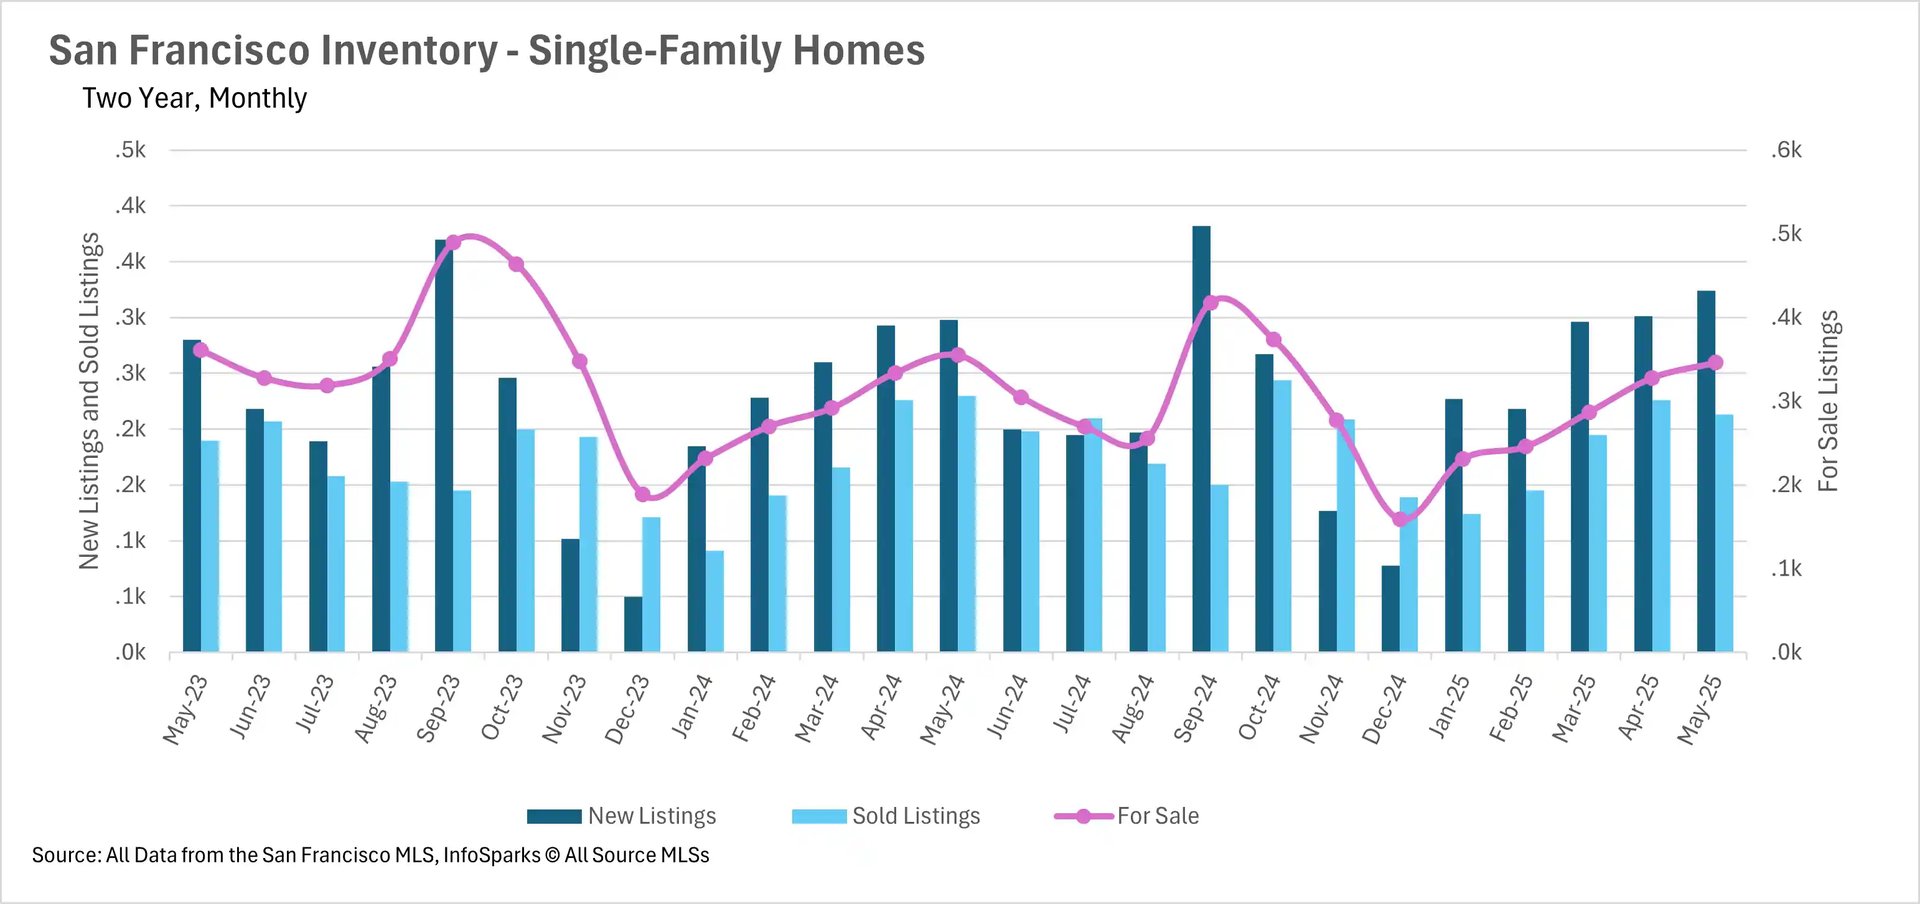
Inventory Levels Remain Lower Than Last Year
As we've highlighted, San Francisco housing inventory has been on a consistent downtrend for years, a pattern that continued through May. Single-family home inventory saw a 2.54% decrease on a year-over-year basis, even with a 5.49% month-over-month increase. This interesting dynamic occurred despite a 7.39% decrease in sales and an 8.72% increase in new listings year-over-year.
The San Francisco condo market experienced an even more drastic decline, with 14.01% fewer active condo listings compared to this time last year. This significant drop in inventory aligns closely with a 13.35% decrease in new condo listings and a 13.45% decrease in sold condo listings on a year-over-year basis. For sellers, this sustained low inventory continues to create competitive conditions. If you're considering selling your San Francisco home, explore our proven seller resources for maximizing your property's value: Selling Your Home in San Francisco.
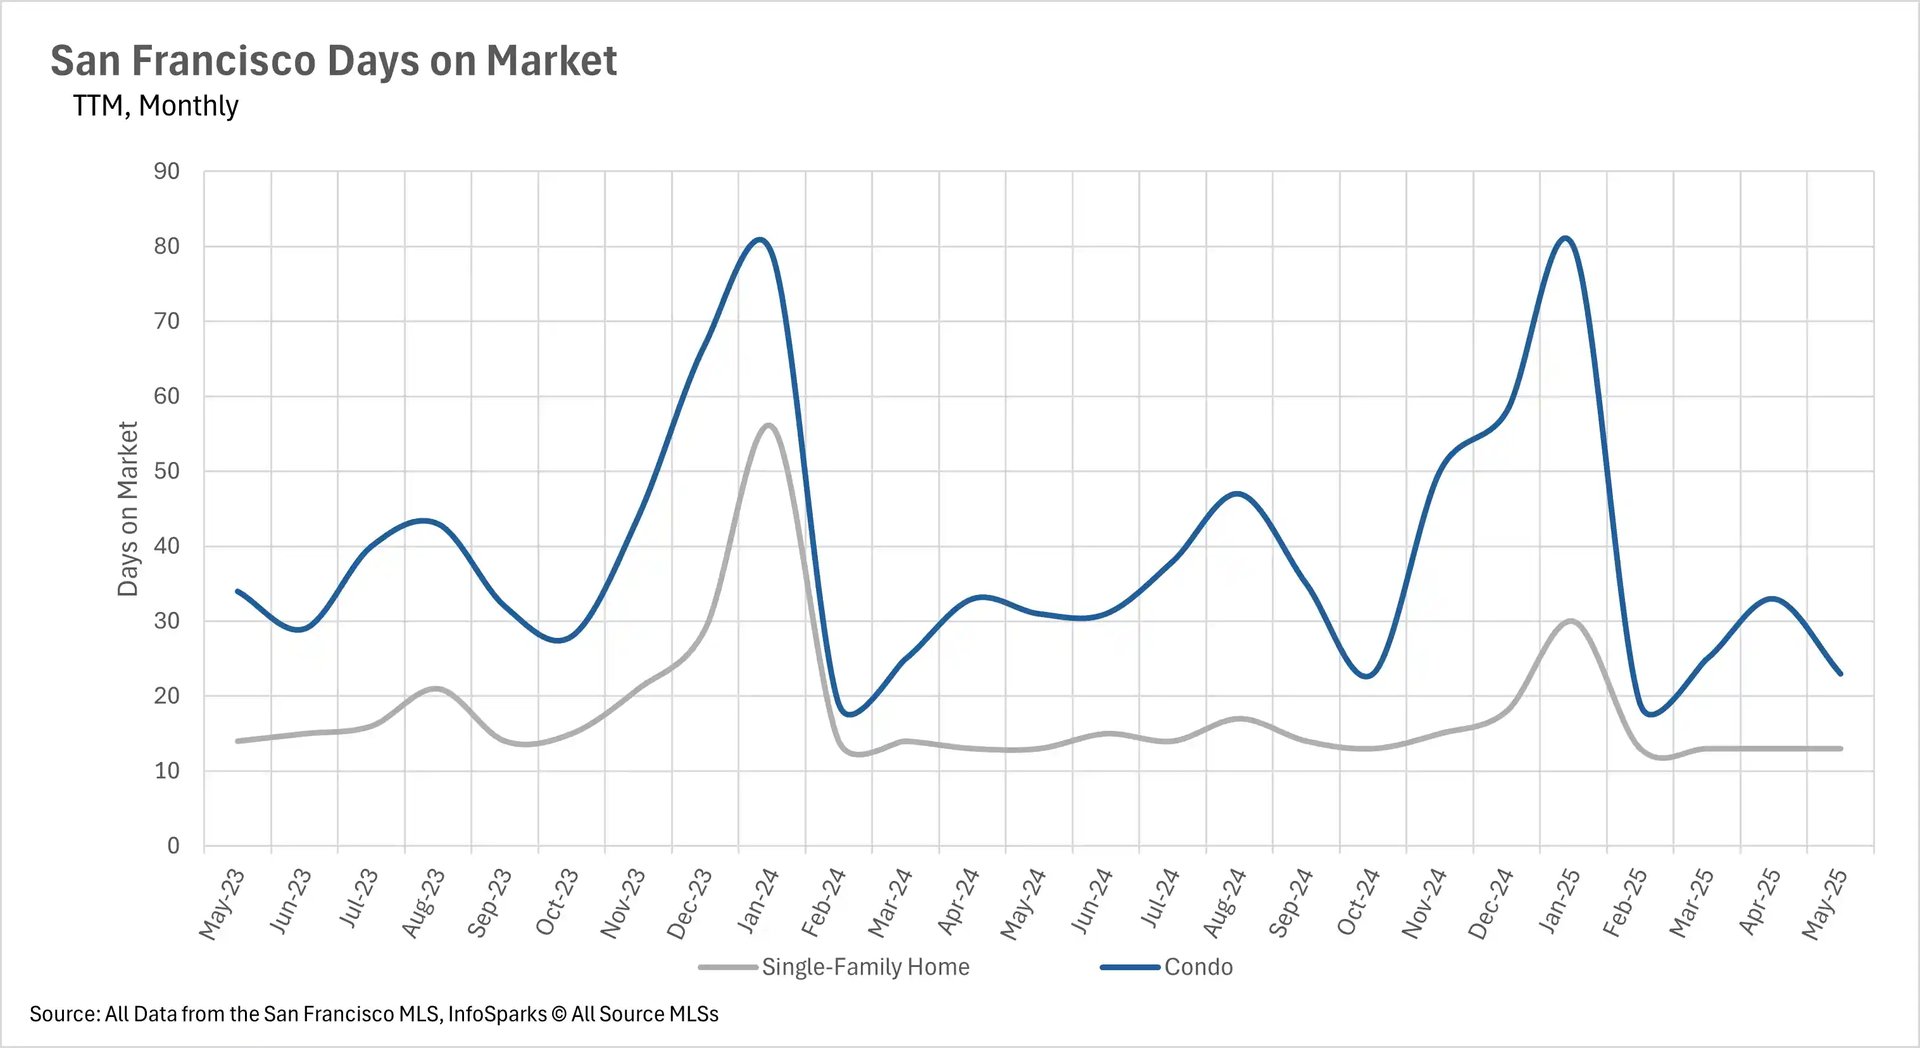
Listings Are Still Being Snapped Up Incredibly Quickly
Given the consistently low housing inventory in San Francisco, it's no surprise that properties are selling quickly. The average San Francisco single-family home spent just 13 days on the market before going under contract, mirroring the speed we observed at this time last year. San Francisco condos do take slightly longer to sell, with an average of 23 days on the market. However, this is still remarkably fast and represents a significant 25.81% decrease from the 31 days on market we saw in May of last year! This quick turnover highlights the strong buyer demand for San Francisco properties. For buyers navigating this fast-paced market, our San Francisco buyer's guide can provide invaluable insights: San Francisco Buyer's Guide.
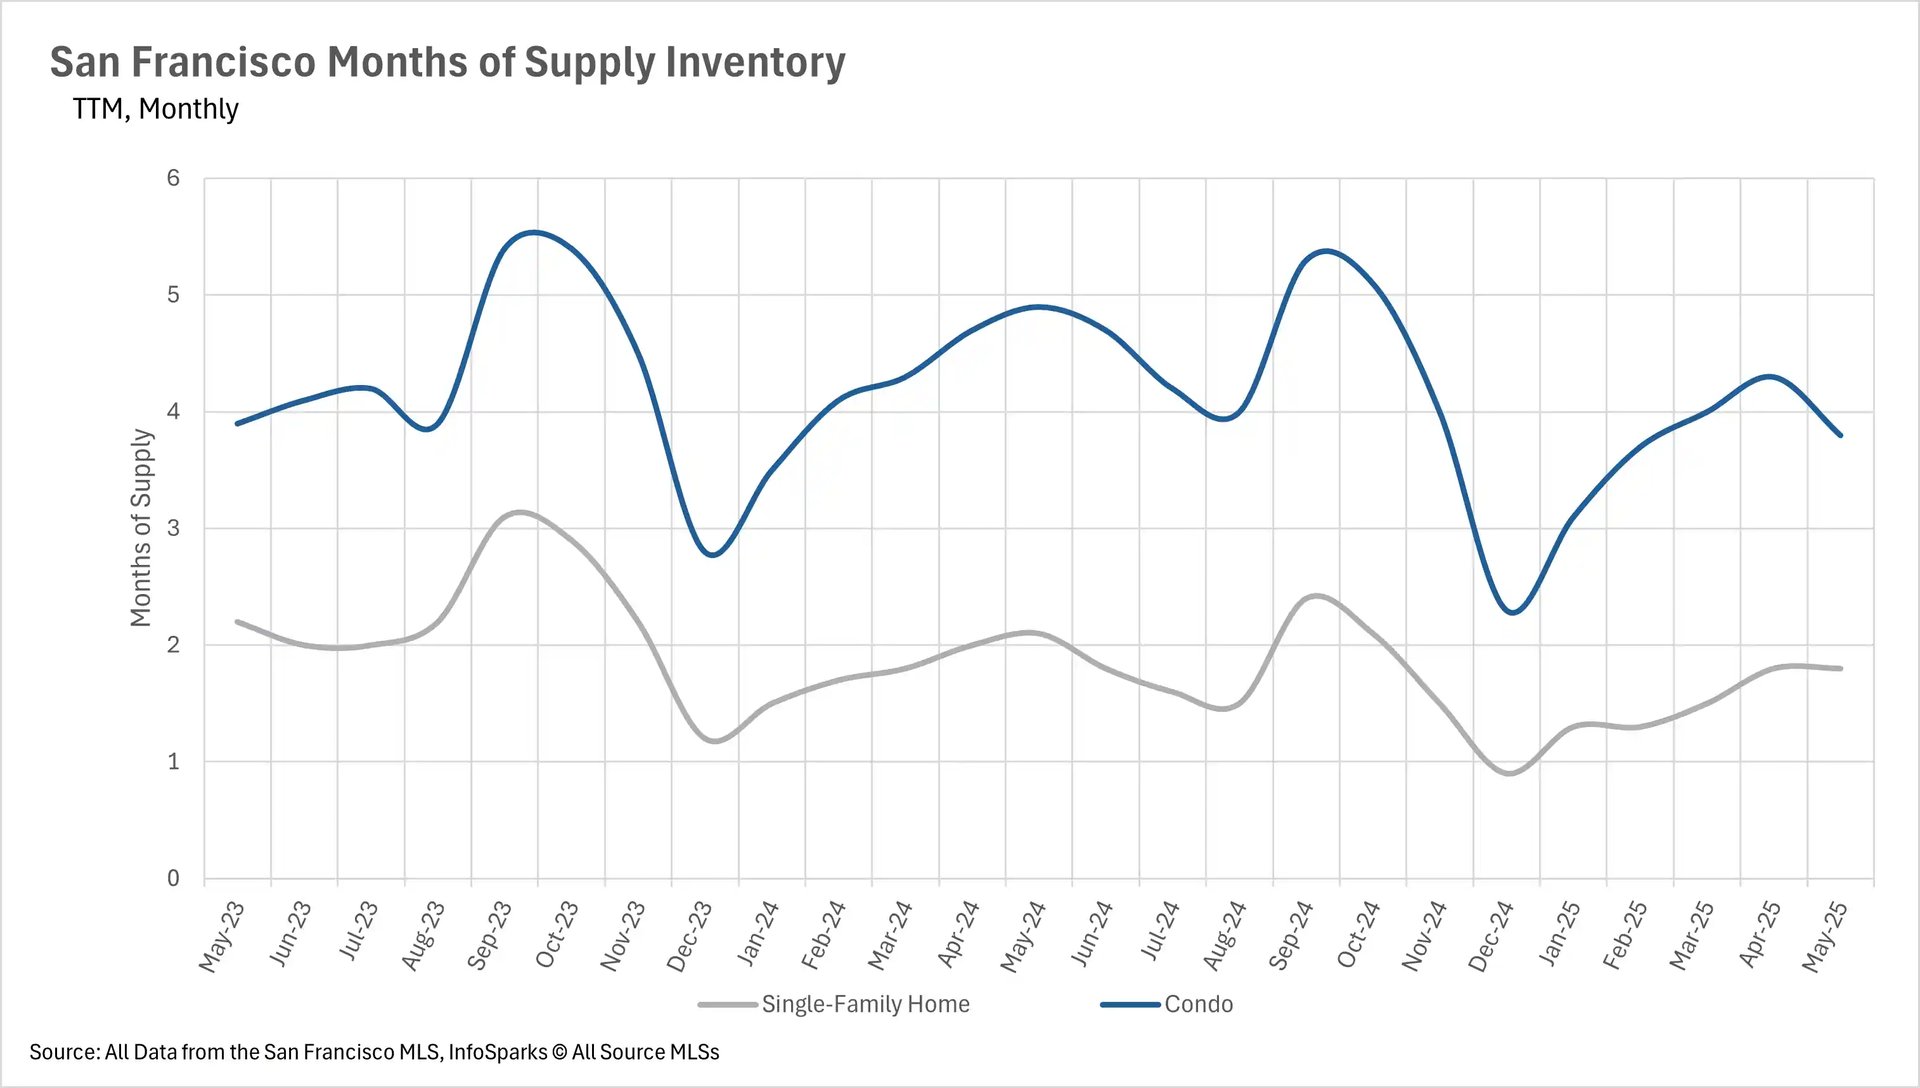
The Condo Market Remains a Buyer's Market, While Single-Family Homes Favor Sellers
To determine whether a market favors buyers or sellers, we utilize the Months of Supply Inventory (MSI) metric. Historically, California has averaged around three months of MSI, signifying a balanced market. Anything below three months indicates a seller's market, while anything above suggests a buyer's market.
In San Francisco, the single-family home market has consistently been a seller's market, and the condo market has remained a buyer's market. While this trend continued in May, we did observe year-over-year declines in the months of supply. Single-family home supply decreased by 14.29% to just 1.8 months of inventory, further solidifying its position as a strong seller's market. The San Francisco condo market also saw a significant decline in supply, dropping by 22.45% to 3.8 months of inventory, indicating a shift towards a more balanced market, though still favoring buyers.
Strategic Insights for San Francisco Buyers & Sellers:
-
For Sellers: The current market conditions, especially for single-family homes, present an excellent opportunity to achieve strong returns. Low inventory and high buyer demand mean your property is likely to sell quickly and at a competitive price. Leverage Kinoko Real Estate's expertise in San Francisco property valuation and strategic marketing to maximize your sale. Get Your Free Home Valuation.
-
For Buyers: While single-family homes are competitive, the San Francisco condo market offers more opportunities for negotiation. With our deep understanding of San Francisco neighborhoods and access to off-market listings, Kinoko Real Estate can help you find your ideal San Francisco home, whether it's a luxury condo in Pacific Heights or a charming house in Noe Valley. Explore our current featured properties here: Featured San Francisco Listings.
At Kinoko Real Estate, we are dedicated to providing our clients with unparalleled service and expertise in the ever-evolving San Francisco real estate market. Whether you're looking to sell or buy your home in San Francisco, or simply understand the latest San Francisco real estate trends, our team is here to help. Contact us today for a personalized consultation! Contact Kinoko Real Estate.