
Updated November 5, 2026. Data through October 31, 2026.
The short version: Richmond District house prices are up 17% over the last 12 months to a median of $2.325 million, the highest in the 10 years we track, and 91% of houses sold above asking. Condos sped up: the typical one now goes under contract in 12 days, down from 20.5, and 75% sold above asking, up from 54%.
Are Richmond District homes selling above asking price?
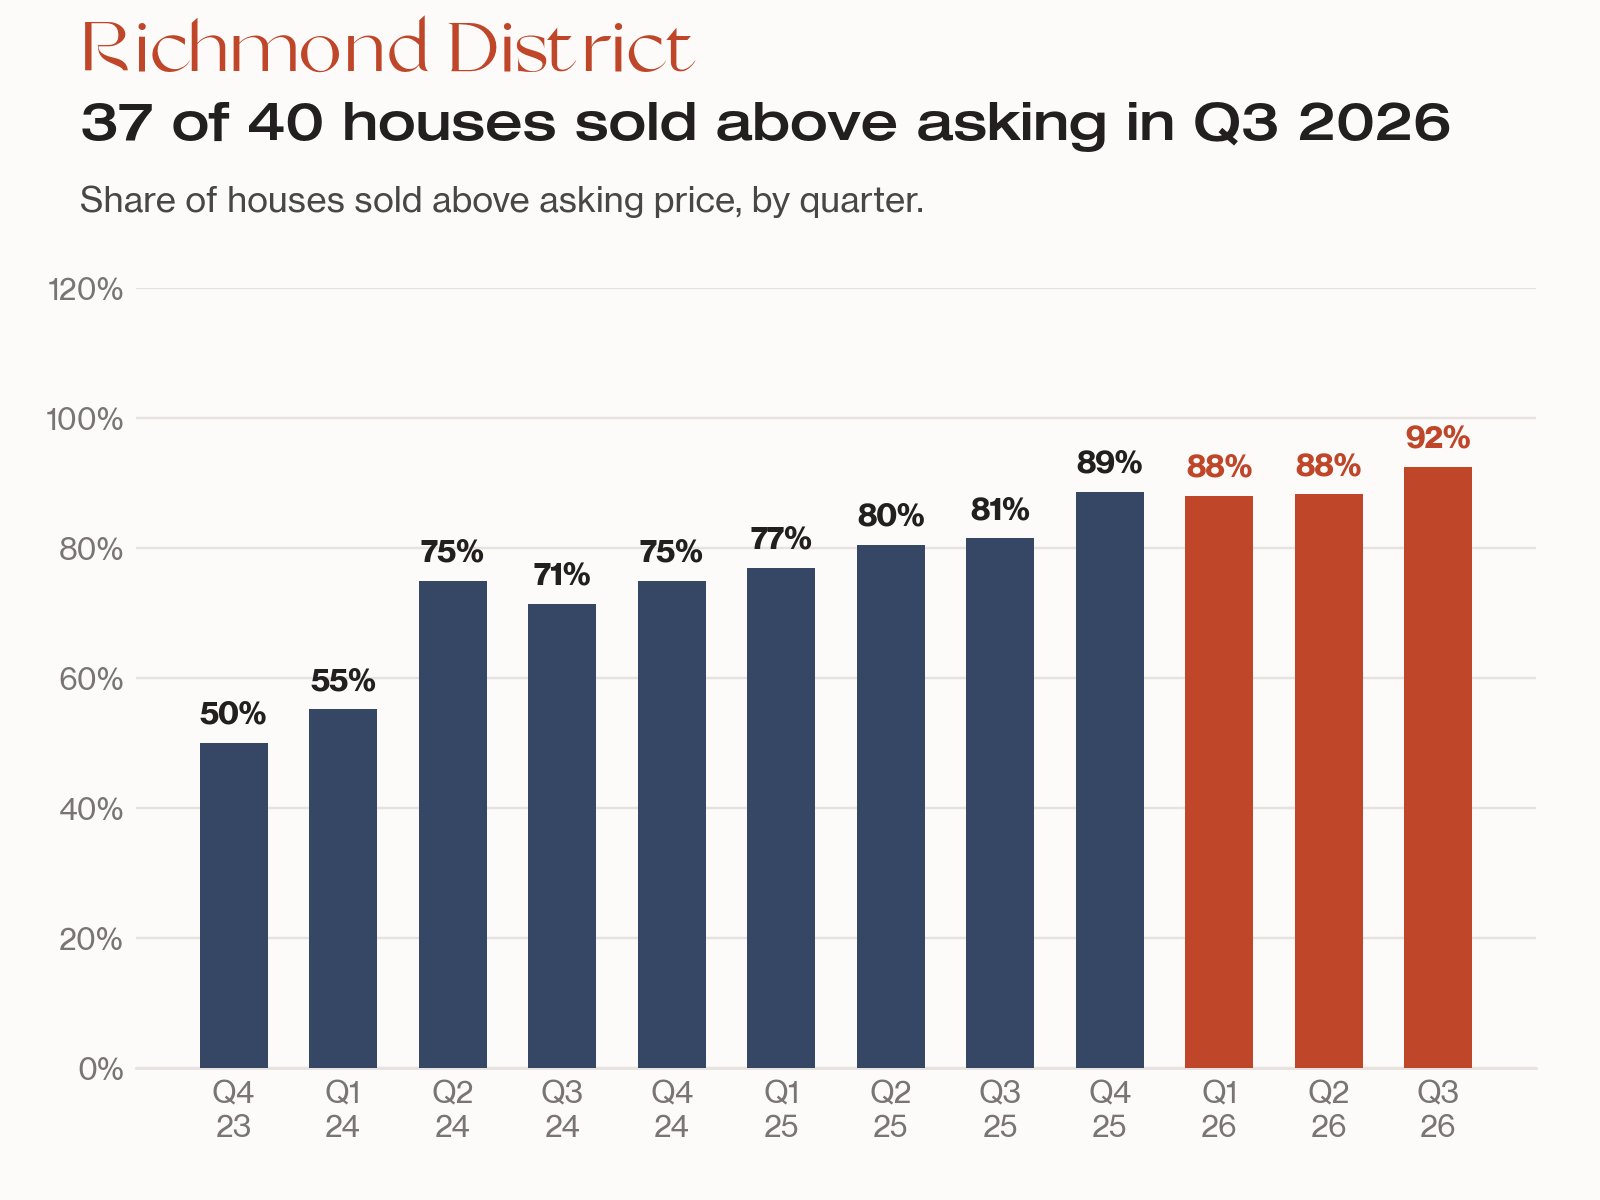
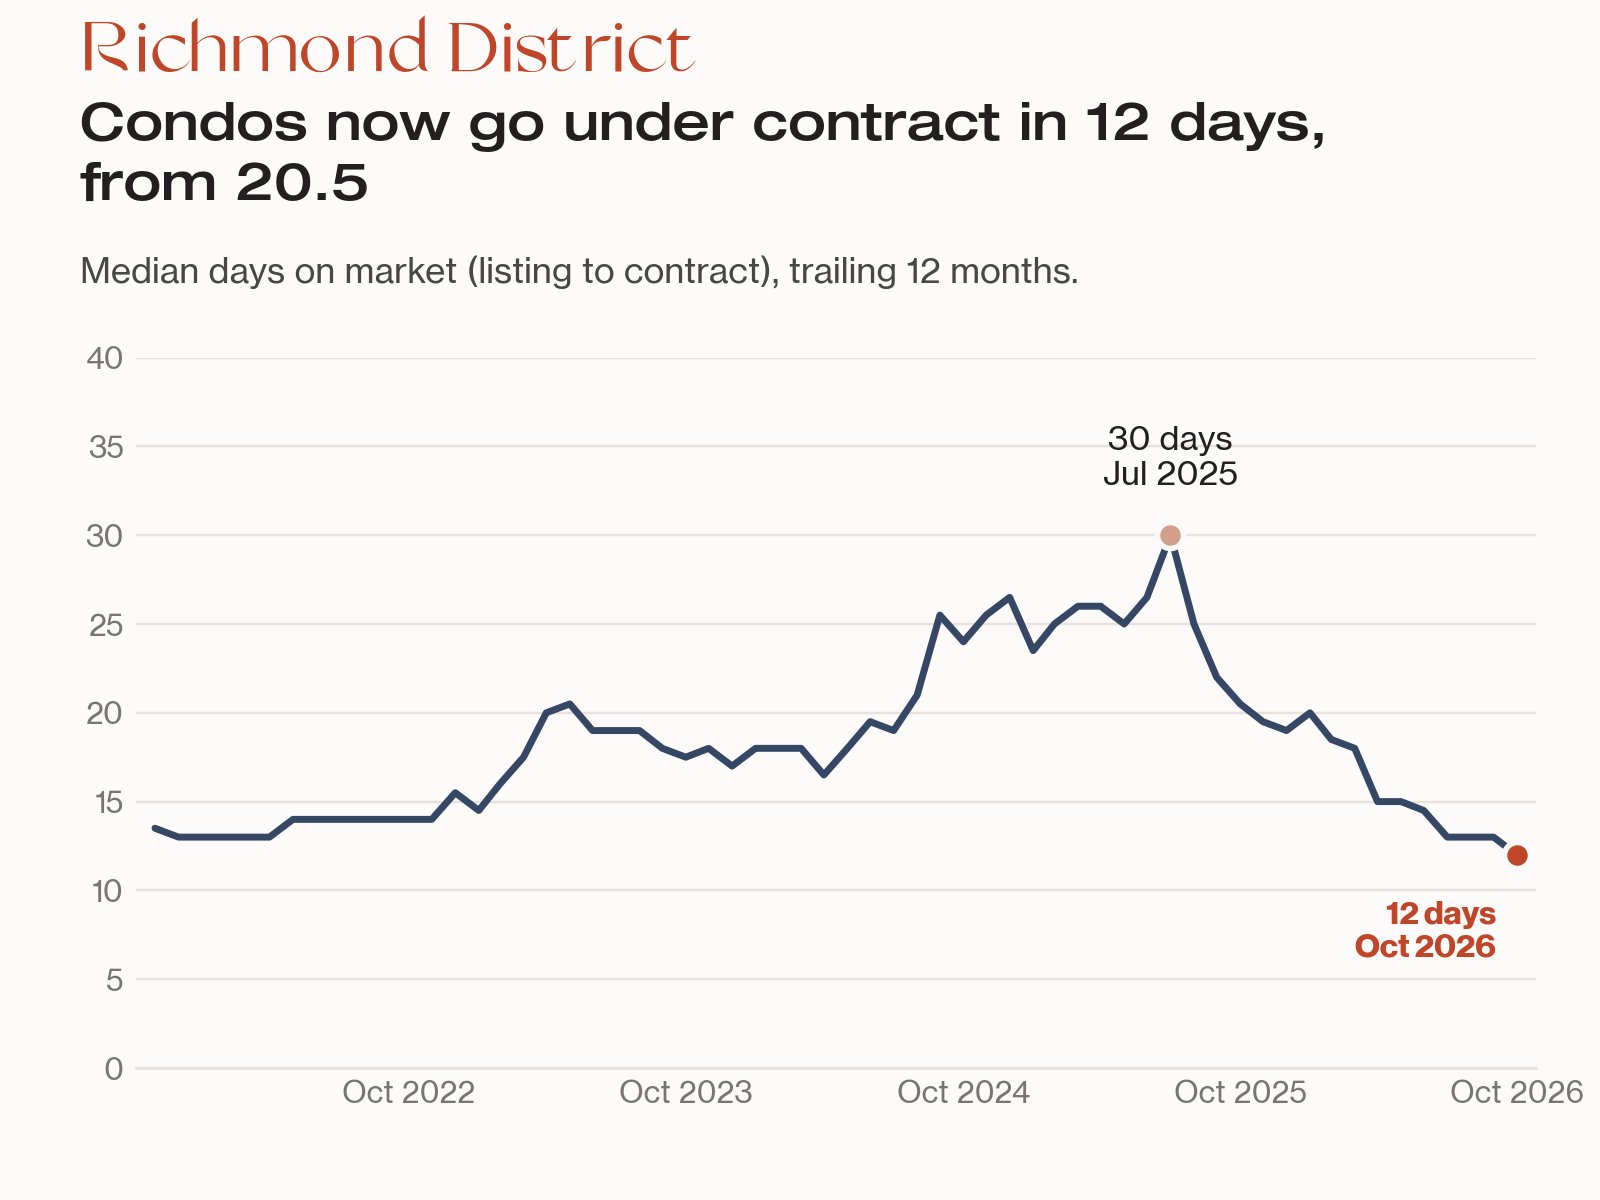
Yes, and more of them are than a year ago. From November 2025 through October 2026, 91% of the 160 single-family houses that sold in the Richmond District closed above asking price (145 of 160), up from 80% the year before (101 of 126). In the last three months, August through October, it was 94% (48 of 51). Among the 61 condos, 75% sold above asking (46 of 61), up from 54%. The typical house went under contract in 11.5 days and the typical condo in 12, down from 20.5.
Here's what we're seeing: houses are being bid up from a high base, and condos have moved from negotiable to competitive. This update covers the Outer, Central and Inner Richmond, using San Francisco Association of REALTORS (SFAR) MLS sales through October 31, 2026. We never blend property types, because a blended "Richmond median" would describe neither a $2.3 million house nor a $1.4 million condo. Houses are 67% of the district's sales and condos 26%. TICs and other types were 18 sales in the 12 months, too few to report.
What do the latest Richmond District numbers show?
Over the last 12 months, houses sold for about a sixth more than the year before and condos sold much faster. The table below compares the 12 months through October 2026 with the 12 months before. For comparison with the wider city, see our San Francisco market update.
Measure | Houses (now) | Houses (a year ago) | Condos (now) | Condos (a year ago) |
|---|---|---|---|---|
Closed sales | 160 | 126 | 61 | 48 |
Sold above asking | 91% (145 of 160) | 80% (101 of 126) | 75% (46 of 61) | 54% (26 of 48) |
Median days to contract | 11.5 | 12 | 12 | 20.5 |
Sales that needed a price cut | 5% (8 of 160) | 7% (9 of 126) | 7% (4 of 61) | 19% (9 of 48) |
Median sale price as a share of list price | 127% | 112% | 109% | 100% |
Median price per sq ft | $1,177 | $1,050 | $1,150 | $892 |
Median sale price | $2,325,000 | $1,980,000 | $1,409,000 | $1,300,000 |
August through October 2026 versus the same months of 2025:
- Houses sold above asking: 94% (48 of 51), up from 83% (30 of 36)
- Condos sold above asking: 94% (17 of 18), up from 72% (13 of 18)
- Days to contract: 12 for houses (13 a year earlier) and 8 for condos (12.5)
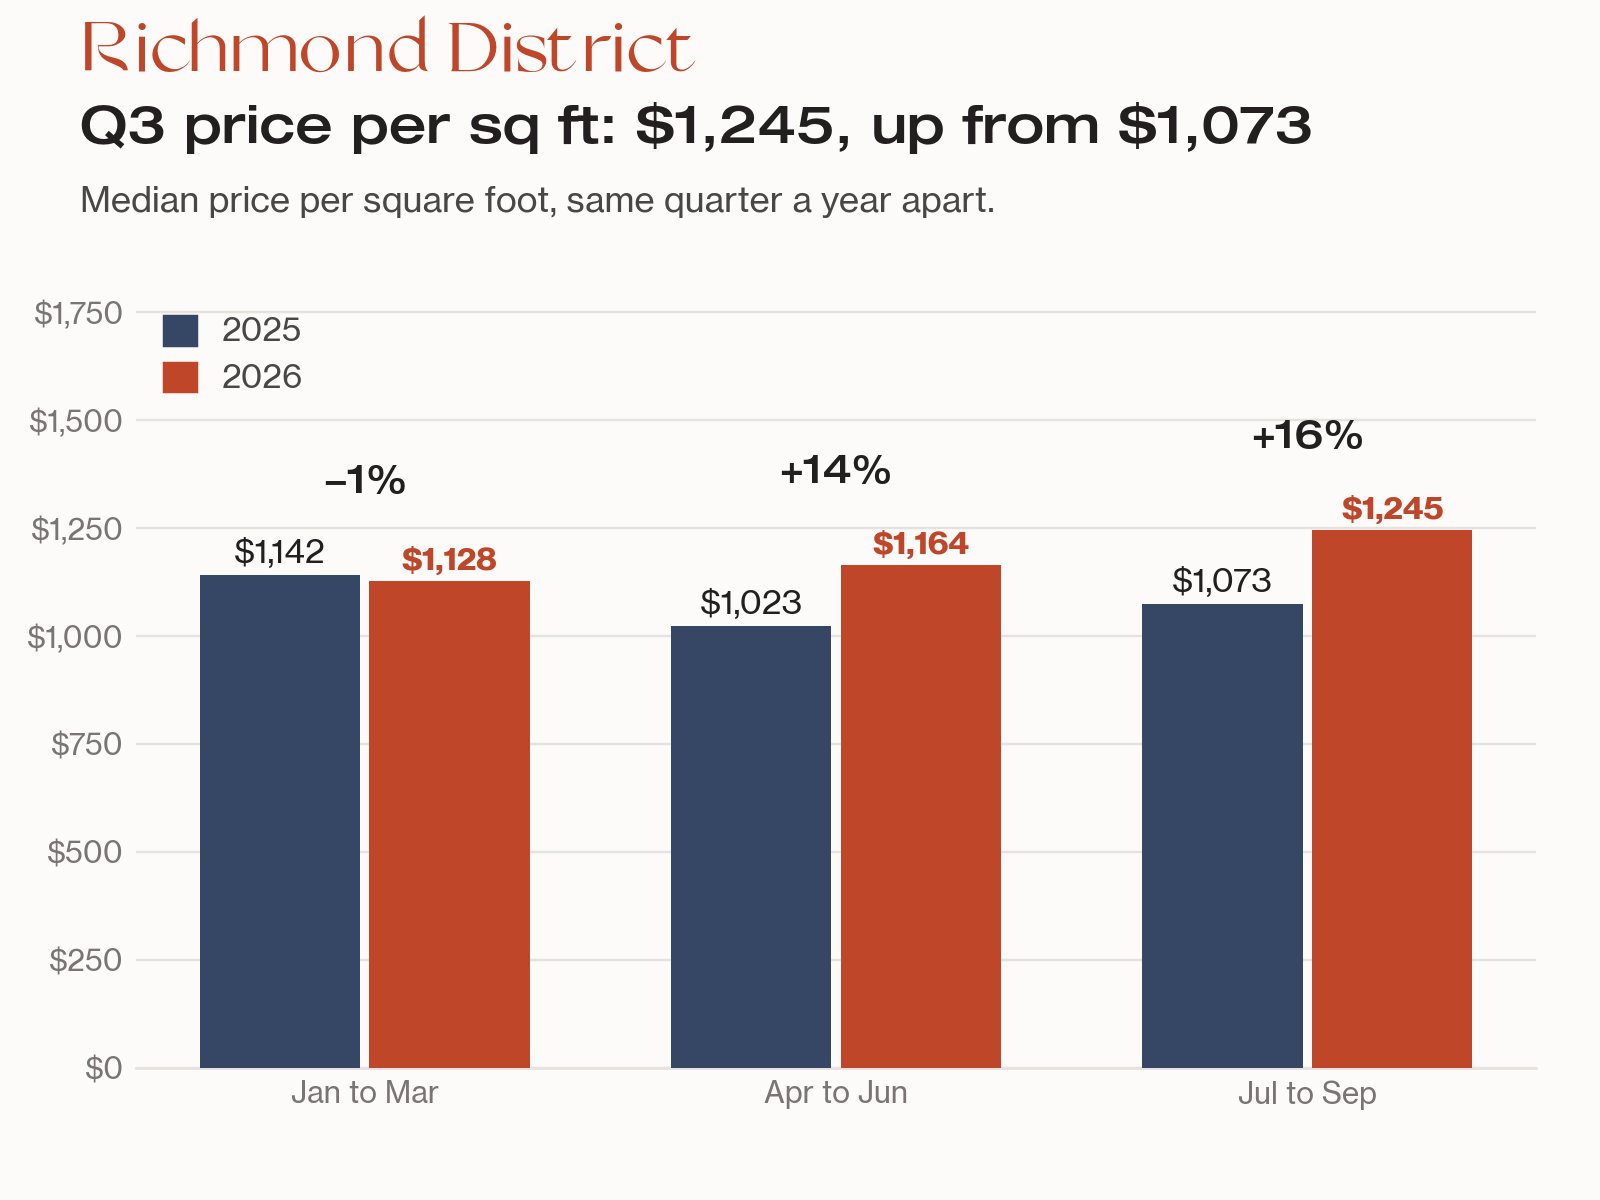
- Price per sq ft: $1,228 for houses (from $1,073) and $1,193 for condos (from $927, with 18 sales in each period)
- New house listings and contracts: 65 new listings (47 a year earlier) and 55 houses under contract (37)
- New condo listings and contracts: 26 new listings (23 a year earlier) and 18 condos under contract (19)
October on its own: 23 houses sold, with a median price of $2,210,000, 12 days to contract and a typical sale at 131% of list price. Only 2 condos sold, too few for a monthly figure. A single month is a small number of sales, so the 12-month and three-month figures are the better guide.
How do the Outer, Central and Inner Richmond compare?
The Inner Richmond costs the most and sells the fastest, the Outer Richmond has the most sales and the lowest price, and houses sold above asking about nine times in ten in all three. The table groups house sales by the area name in the MLS. The 12-month median house price was $3.3125 million in the Inner Richmond, $2.53 million in the Central Richmond and $2.114 million in the Outer Richmond. The table below compares each area with the 12 months before.
Area | Closed sales | Median sale price | Change in median price | Median price per sq ft | Median days to contract | Sold above asking |
|---|---|---|---|---|---|---|
Inner Richmond houses | 26 | $3,312,500 | +28% | $1,349 | 10.5 | 88% (23 of 26) |
Central Richmond houses | 64 | $2,530,004 | +30% | $1,222 | 12 | 92% (59 of 64) |
Outer Richmond houses | 70 | $2,114,000 | +13% | $1,073 | 12 | 90% (63 of 70) |
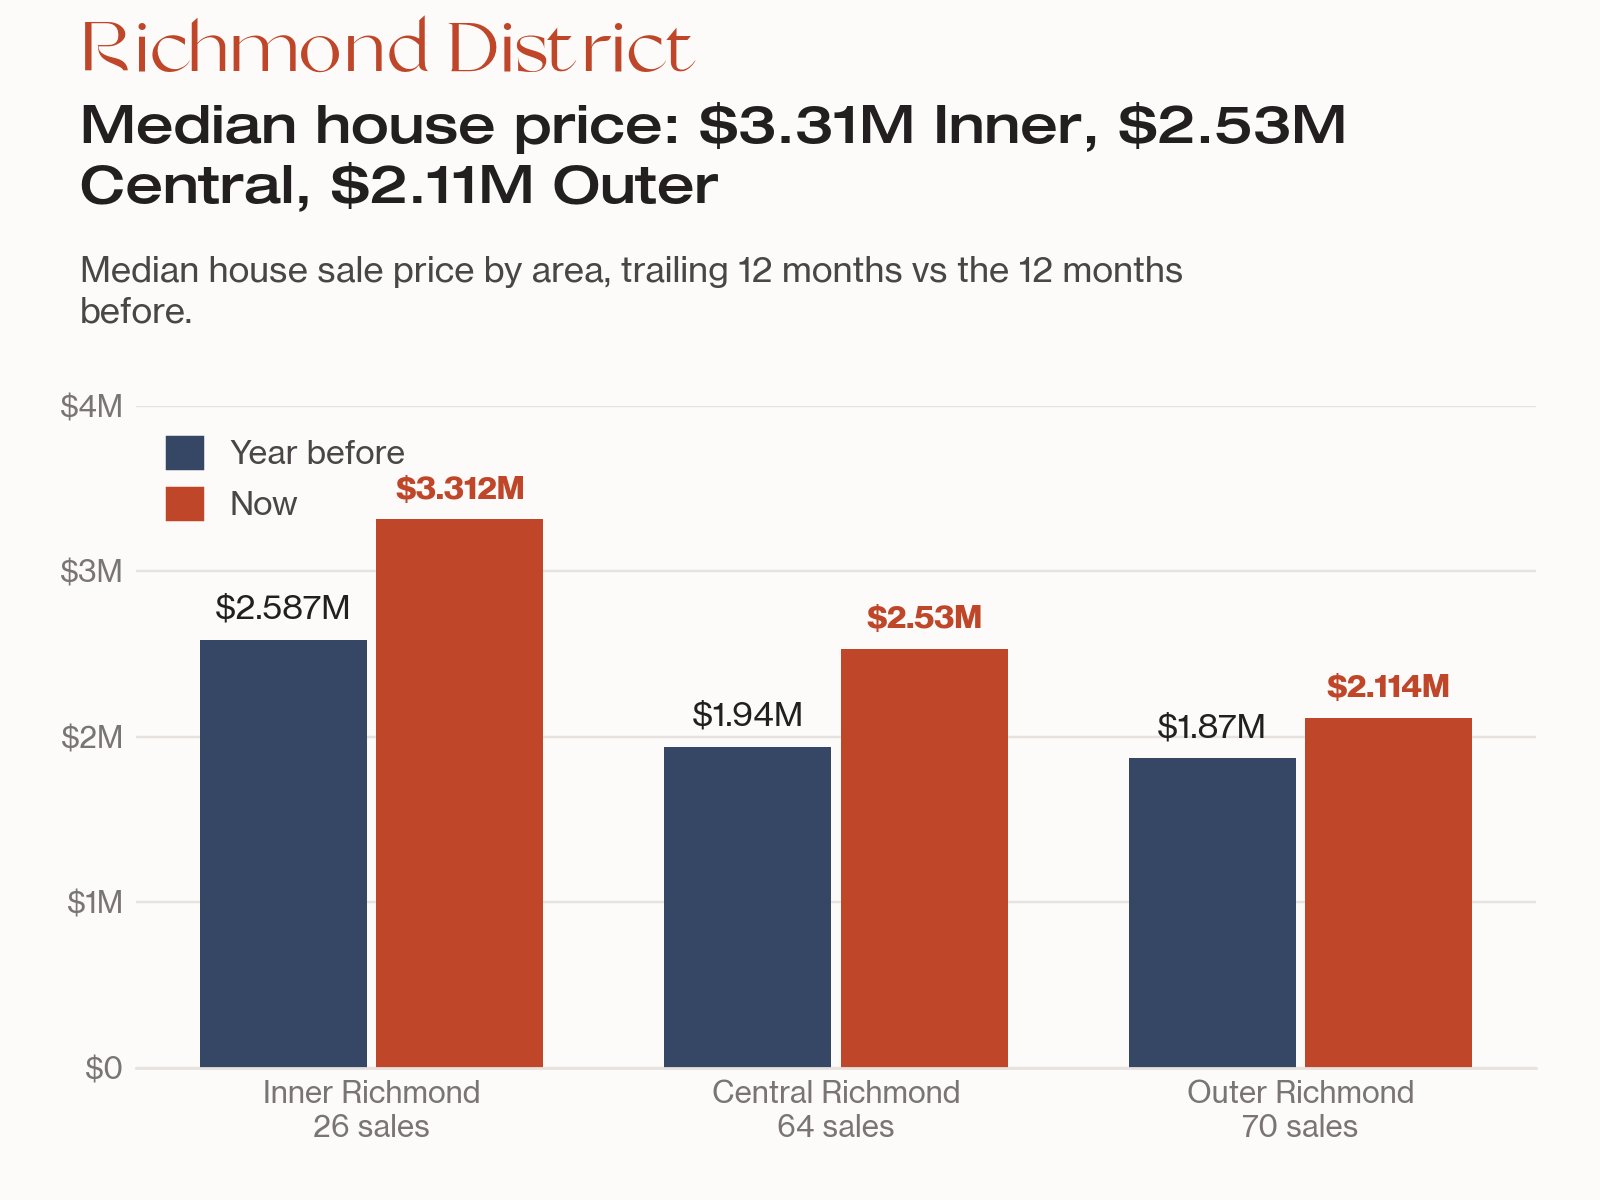
Central Richmond houses made the largest gain the data fully supports. The median Central Richmond house price rose 30% ($1.94 million to $2.53 million), and with 64 sales it could plausibly sit anywhere from about 15% to 45% higher. Price per square foot rose about 14% there ($1,073 to $1,222), also a gain the data supports. In the Inner Richmond the median rose 28%, but with 26 sales the range of plausible changes runs from about 11% lower to 58% higher, so price per square foot is the better guide there: it rose about 19% ($1,130 to $1,349). In the Outer Richmond the median rose 13% and price per square foot about 7% ($1,004 to $1,073), but both could be explained by which homes happened to sell, so all we can say is that the Outer Richmond is up, not by how much.
The Inner Richmond's median house price is about 57% above the Outer Richmond's, and its price per square foot is about 26% higher, so part of the gap is home size and part is price per foot. Condos are spread more evenly across the district than houses: of the 61 condo sales in the last 12 months, 24 were in the Central Richmond, 23 in the Inner Richmond and 14 in the Outer Richmond. At month end, 4 houses were on the market in the Inner Richmond, 7 in the Central Richmond and 3 in the Outer Richmond.
What changed in the Richmond District single-family market?
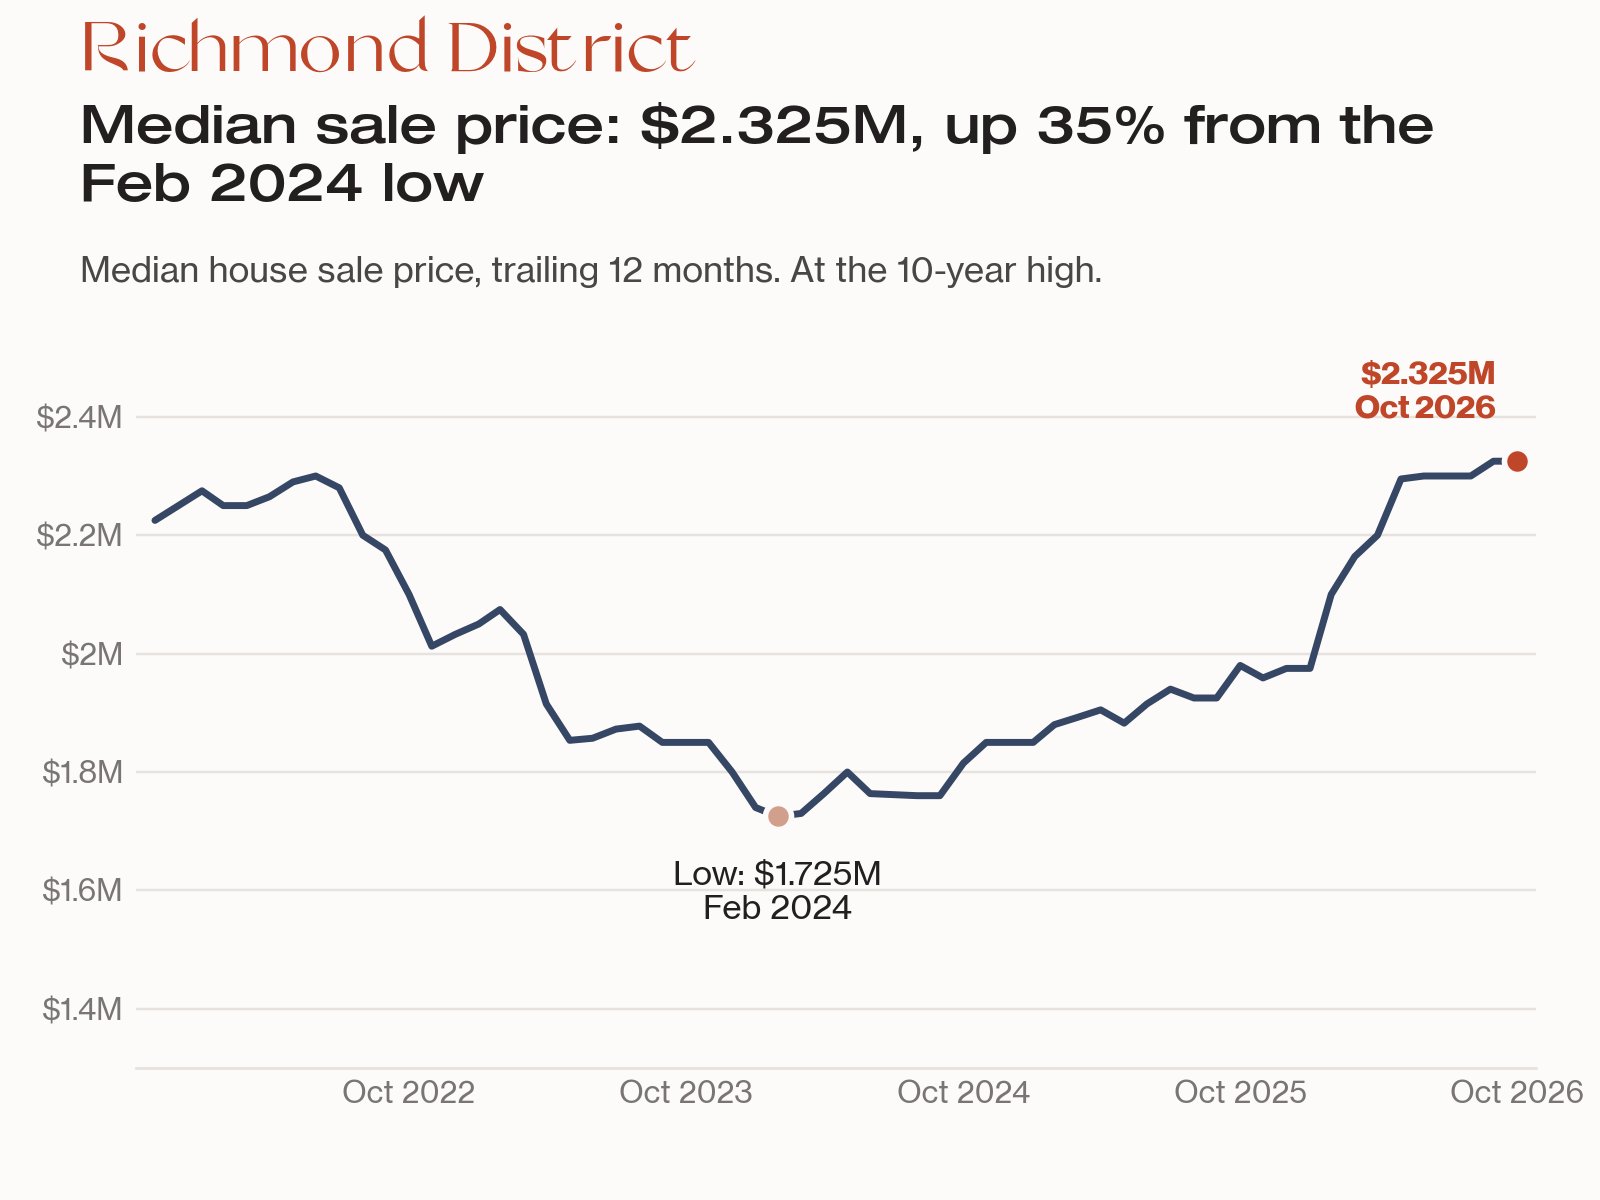
Prices rose, and the data supports the increase. Over 12 months the median house sale price rose 17%, from $1.98 million to $2.325 million, and it could plausibly sit anywhere from about 4% to 28% higher. Price per square foot rose 12% ($1,050 to $1,177), with a plausible range of about 5% to 21%, and about 13% when we hold last year's bedroom mix fixed. The six-month median price was up about 21%, but that figure has a wide range, while price per square foot was up about 16% over the same six months. With 160 sales in the last 12 months, we're comfortable calling this a real move.
Competition rose too. The share of houses sold above asking went from 80% to 91%, with a plausible range of 2 to 19 points higher, and the typical house closed at 127% of list price, up from 112%. Median days to contract barely moved (12 to 11.5), so houses were already selling fast and the change is in how much buyers paid and how many had to pay over asking.
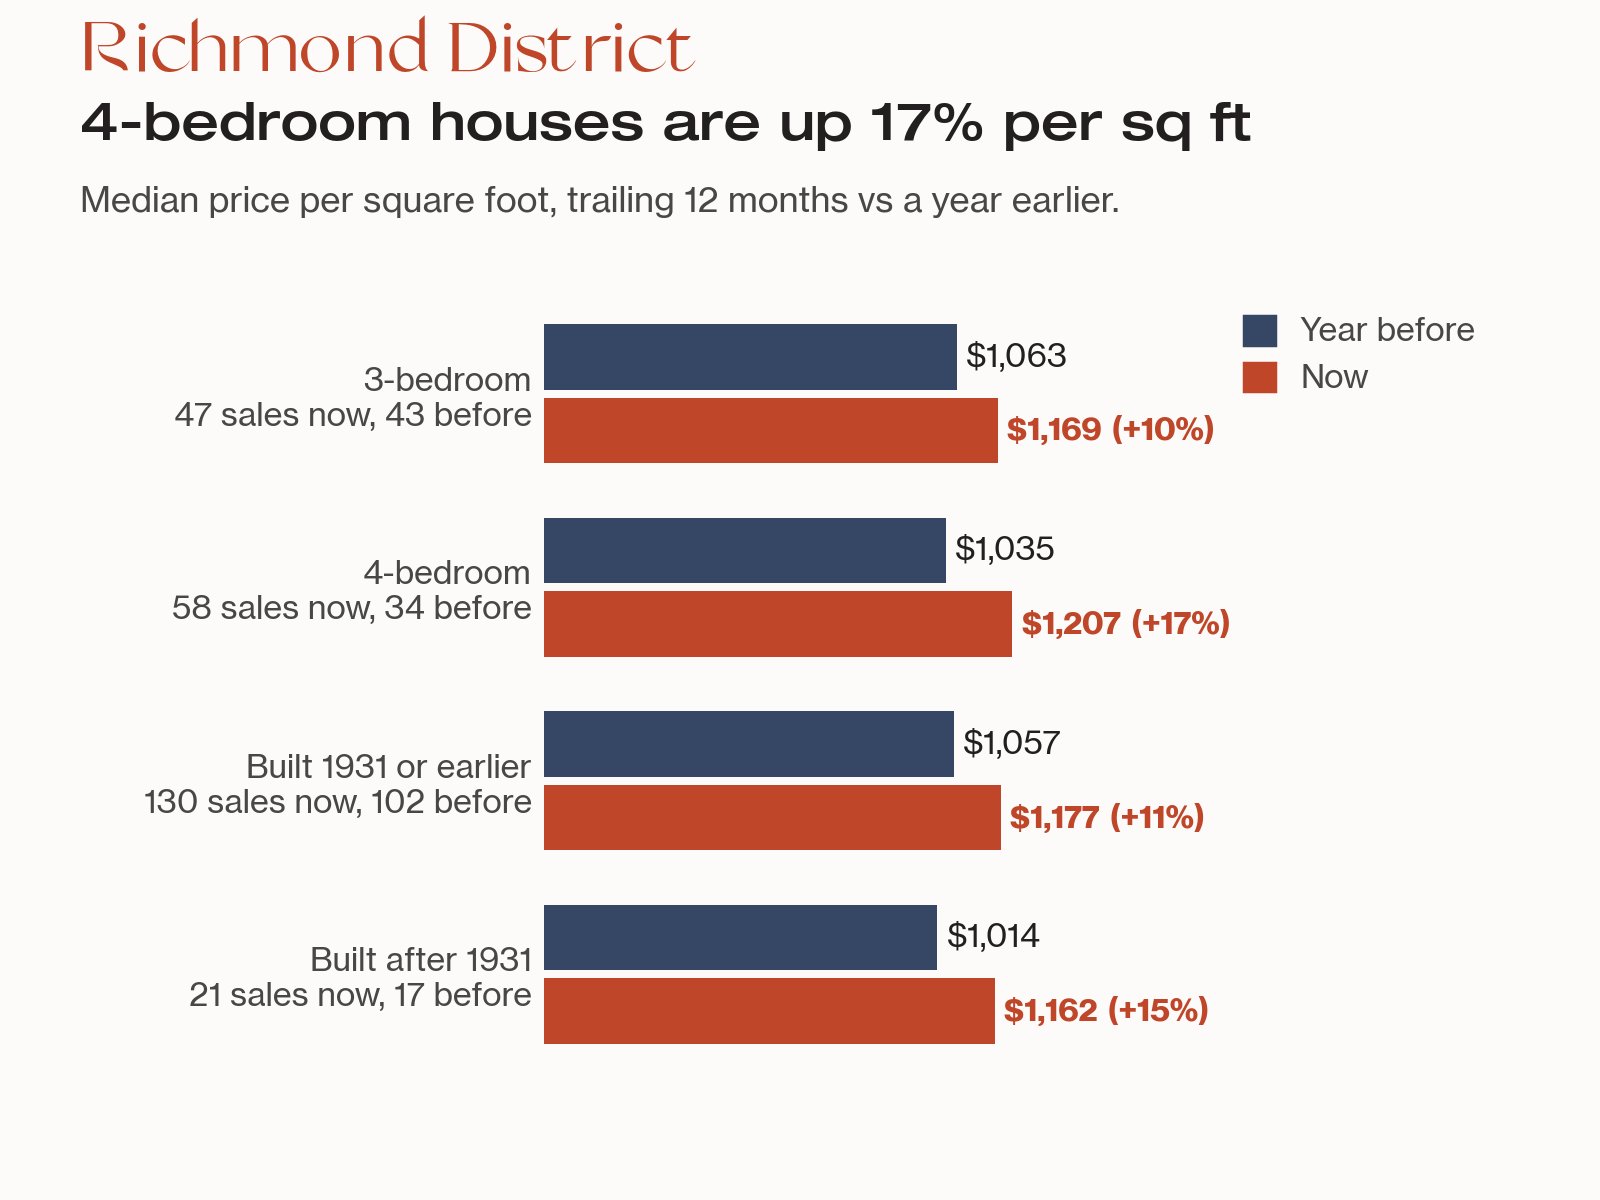
The gains show up across house types. Price per square foot for four-bedroom houses rose about 17% ($1,035 to $1,207, with 34 sales before and 58 now), and for three-bedroom houses about 10% ($1,063 to $1,169, with 43 and 47 sales). Houses built in 1931 or earlier, which are most of the sales (130 of the 160), rose about 11% ($1,057 to $1,177). Houses built after 1931 rose about 15% ($1,014 to $1,162), but that is 17 and 21 sales, so we'd treat it as a sign of direction, not a precise figure.
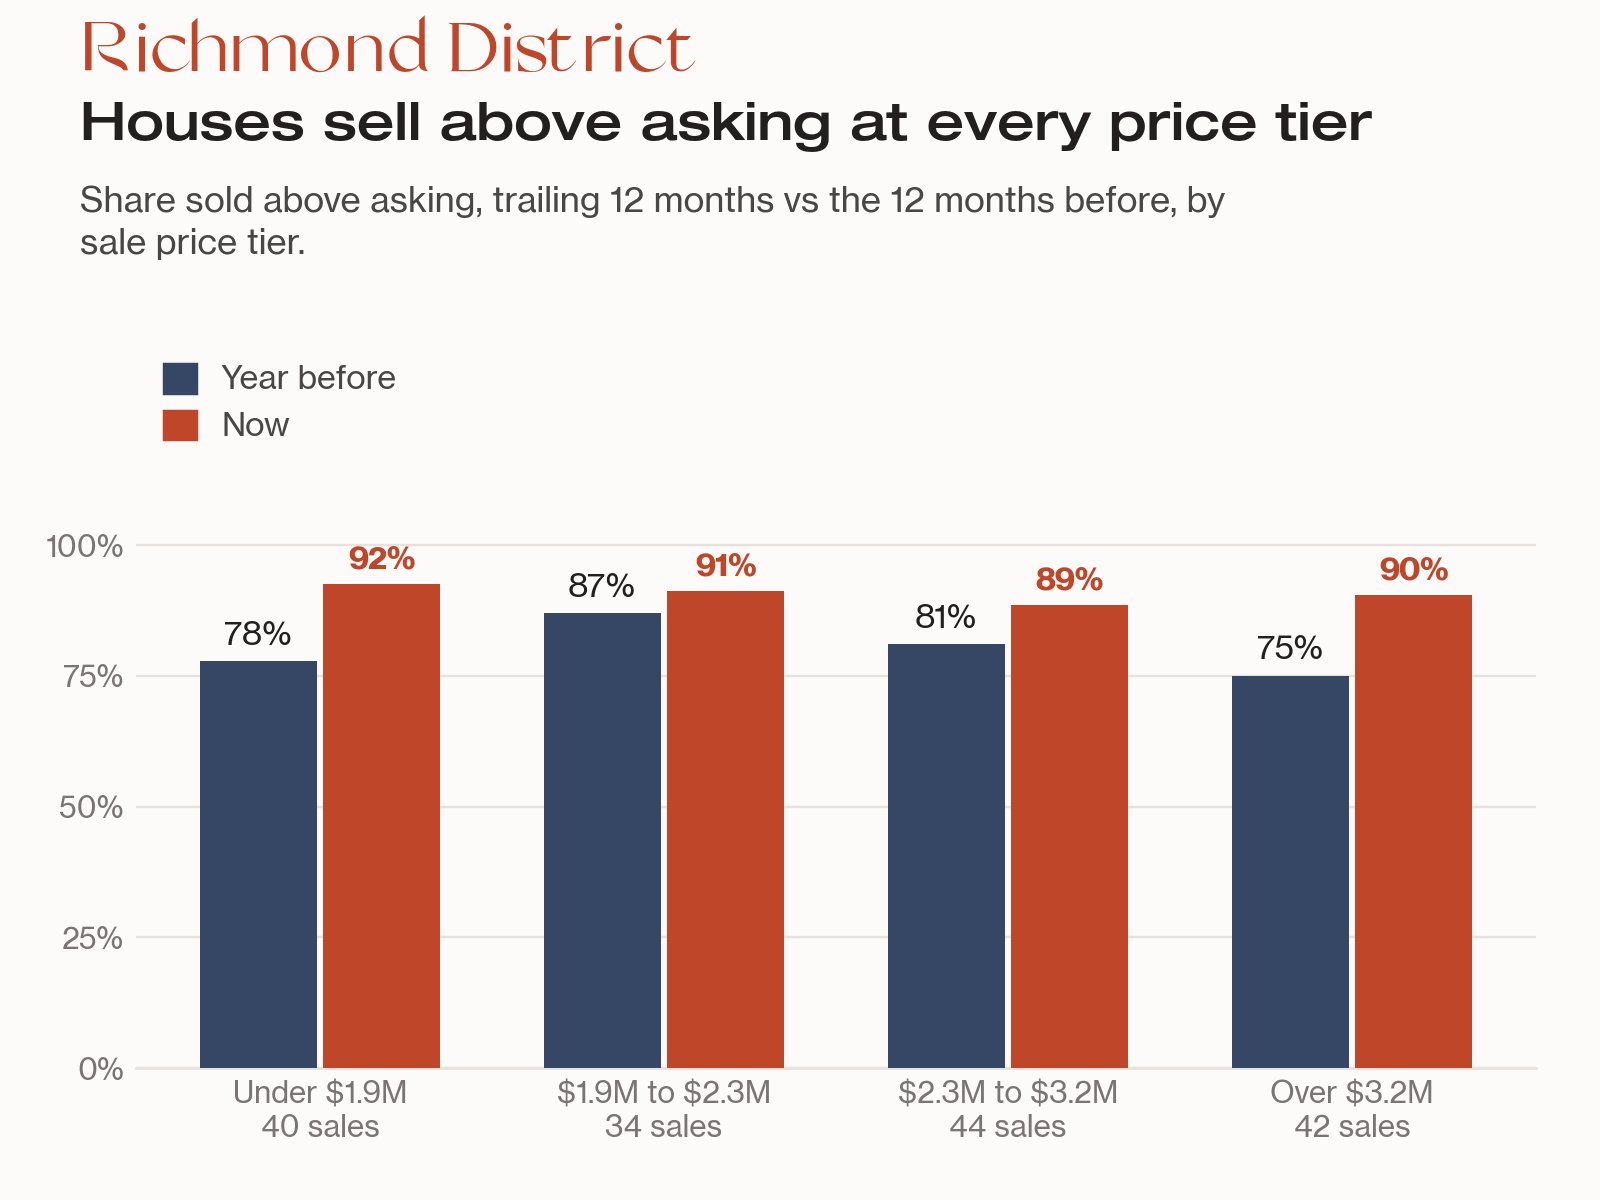
House competition is about the same at every price. Houses sold above asking 92% of the time under $1.9 million (40 sales), 91% from $1.9 million to $2.3 million (34 sales), 89% from $2.3 million to $3.2 million (44 sales) and 90% above $3.2 million (42 sales). Median days to contract was between 9 and 13 in every tier. A year earlier the share ranged from 75% to 87%, so every tier moved up, and the cheapest tier moved the most (78% to 92%).
Listings are up, and contracts are up more. From August through October 2026, 65 new house listings came to market against 47 in the same months of 2025, while 55 houses went under contract against 37. At the end of October, 14 houses were on the market (active plus contingent). Of the 13 houses listed in our export, 3 were new in the last two weeks, 3 had been listed 60 days or more and 2 had a price cut. Houses that resold after being held at least a year (50 of them) gained a median of 69% over about 5.6 years, and 98% of them sold for more than the previous price.
What changed in the Richmond District condo market?
Condos went from negotiable to competitive. The share sold above asking rose 21 points, from 54% to 75%, with a plausible range of 4 to 39 points. Median days to contract fell from 20.5 to 12, with a plausible range of about 2 to 18 days faster. The typical condo closed at 109% of list price, up from 100%, and 7% of sales needed a price cut (4 of 61), against 19% a year earlier (9 of 48). In August through October, 17 of 18 condos sold above asking, against 13 of 18 a year earlier.
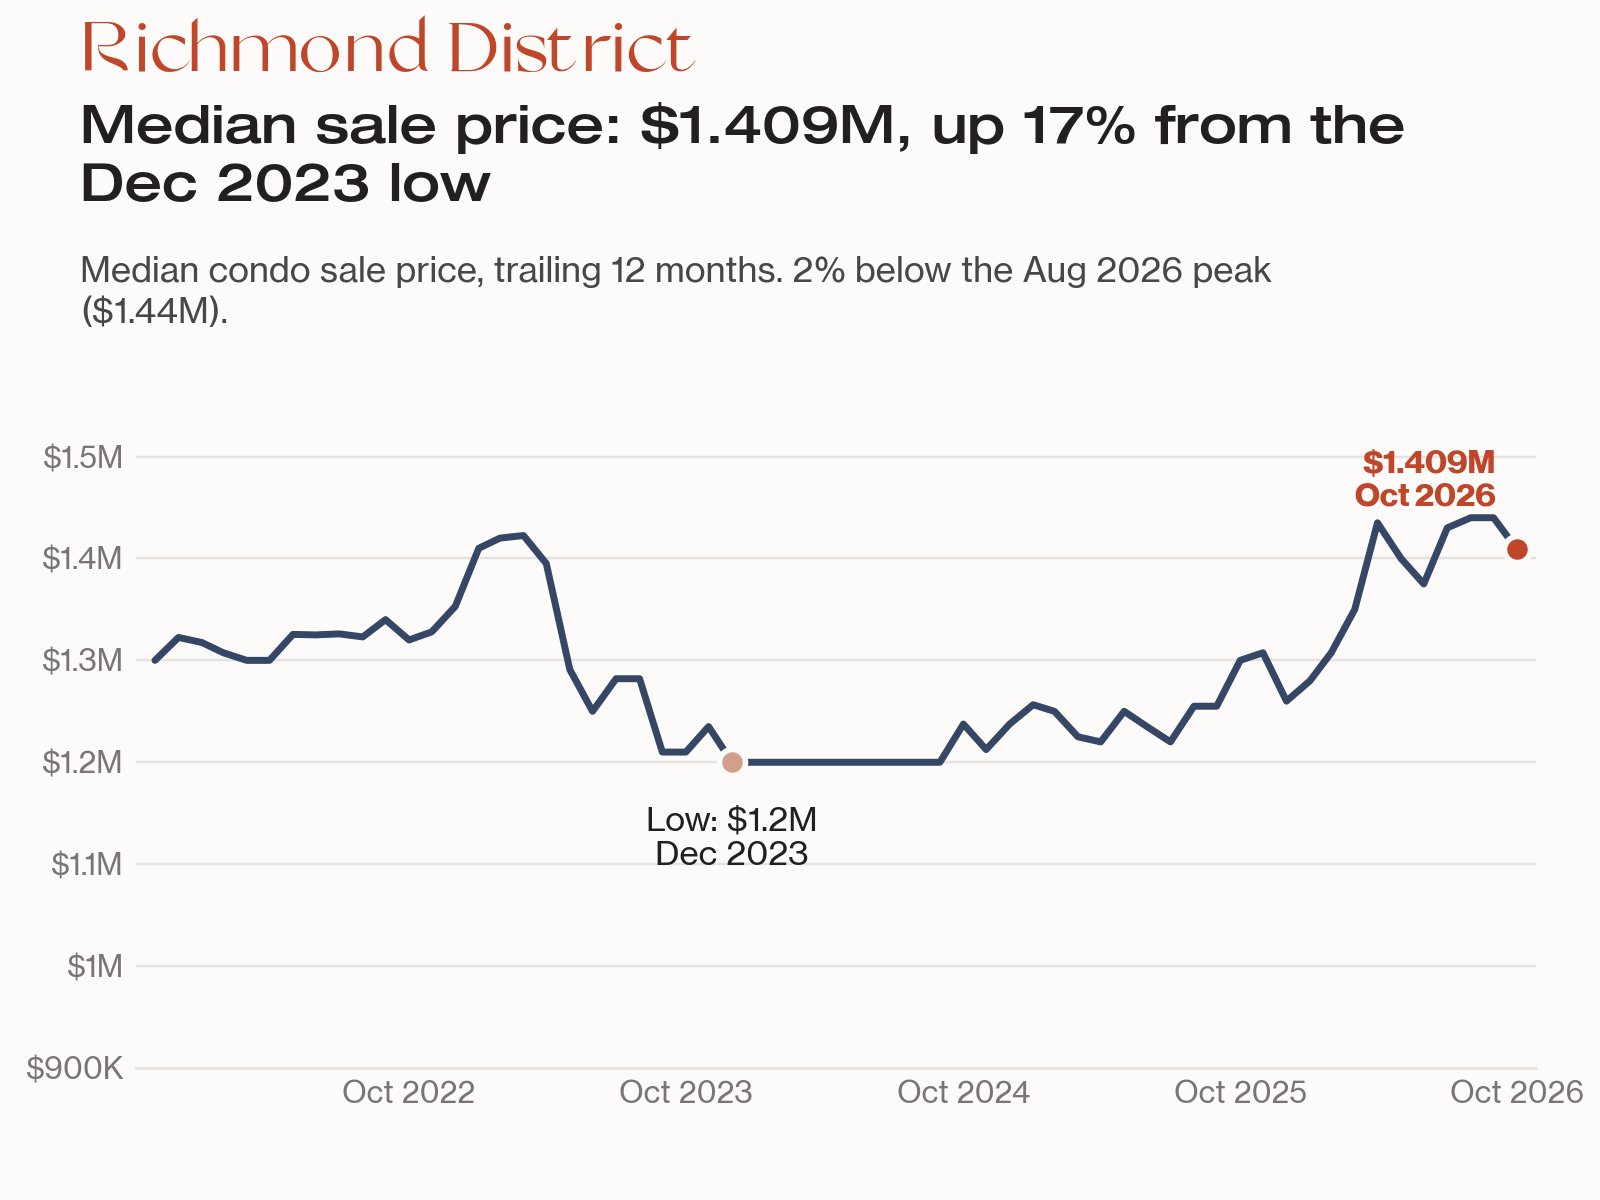
Price per square foot is the clearest price signal. It rose about 29% over 12 months ($892 to $1,150), a gain that holds even after allowing for last year's mix of bedroom counts. The median sale price rose about 8%, from $1.3 million to $1.409 million, but with 61 sales it could plausibly sit anywhere from 6% lower to 32% higher, because the median can swing with which condos happened to sell. Competition also depends on price: condos under $1 million sold above asking 43% of the time (14 sales, with a median of 24 days to contract), while condos from $1.4 million to $1.8 million did 93% of the time (15 sales, 12 days). Condos that resold after being held at least a year (20 of them) gained a median of 20% over about 7.5 years, a much slower pace than houses, and 90% sold for more than the previous price.
At month end, 7 condos were on the market, 4 of them new in the last two weeks, and the median list price was $995,000. Months of supply for condos was about 1.2.
Is the Richmond District a buyer's or seller's market?
Right now it's a seller's market for both property types. Months of supply, meaning how long current listings would last at the recent sales pace, was about 0.8 for Richmond District houses and 1.2 for condos in October 2026 (based on the average of the last three months of sales). At month end, 14 houses and 7 condos were on the market. We count active and contingent listings as inventory. Under 3 months is a seller's market, 3 to 6 is balanced, and over 6 is a buyer's market.
Houses have been a seller's market in 57 of the last 60 months and balanced in the other 3, and never a buyer's market. Condos were a seller's market in 48 of the last 60 months and balanced in the other 12, never a buyer's market. In both, buyers have not had the upper hand at any point in five years.
Richmond District house prices
Richmond District condo prices
Are Richmond District prices at a record?
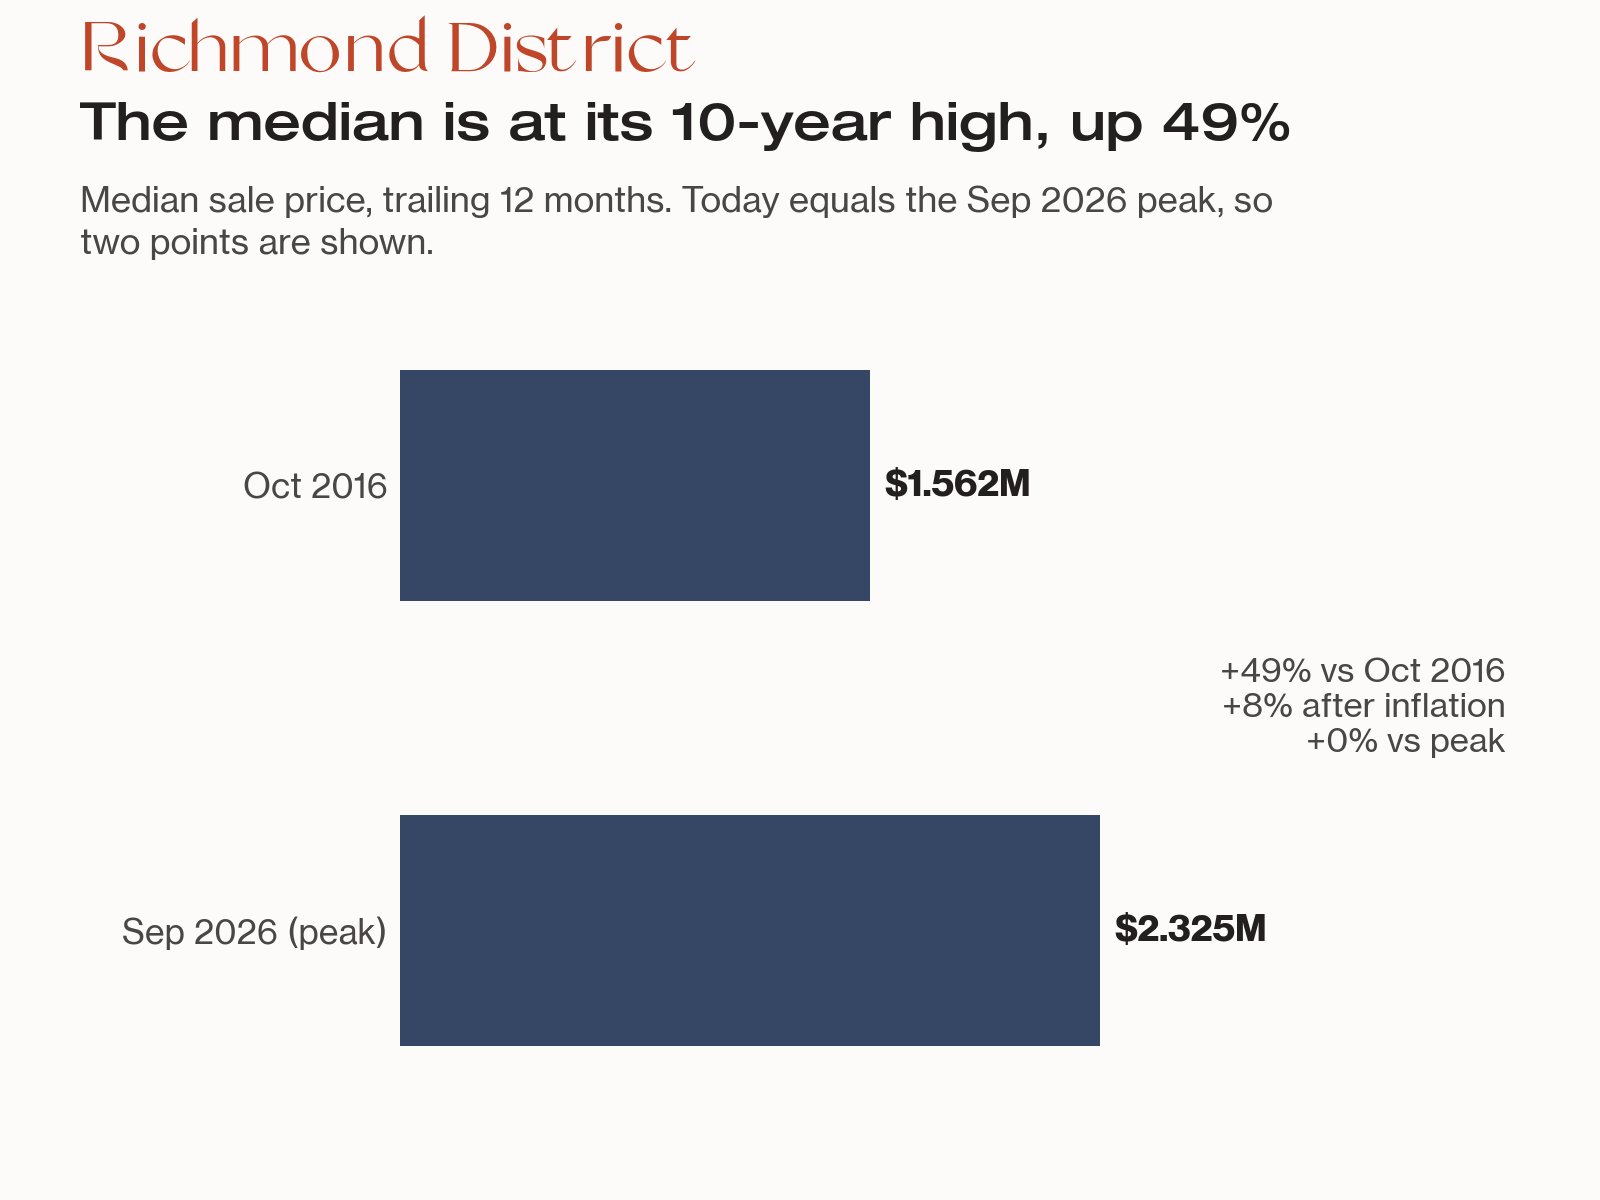
Houses are, within the 10 years we track; condos are 2% short, and after inflation neither has gained much. The 12-month median house price of $2.325 million is the highest in our window: 49% above October 2016 ($1.5625 million), about 4.1% a year, and 22% above the 10-year average of $1.9 million. After San Francisco-area inflation, which was about 38% over the same period, that is roughly an 8% gain. It is 11% above five years ago ($2.1 million), and price per square foot is up 38% over the decade, from $850 to $1,177.
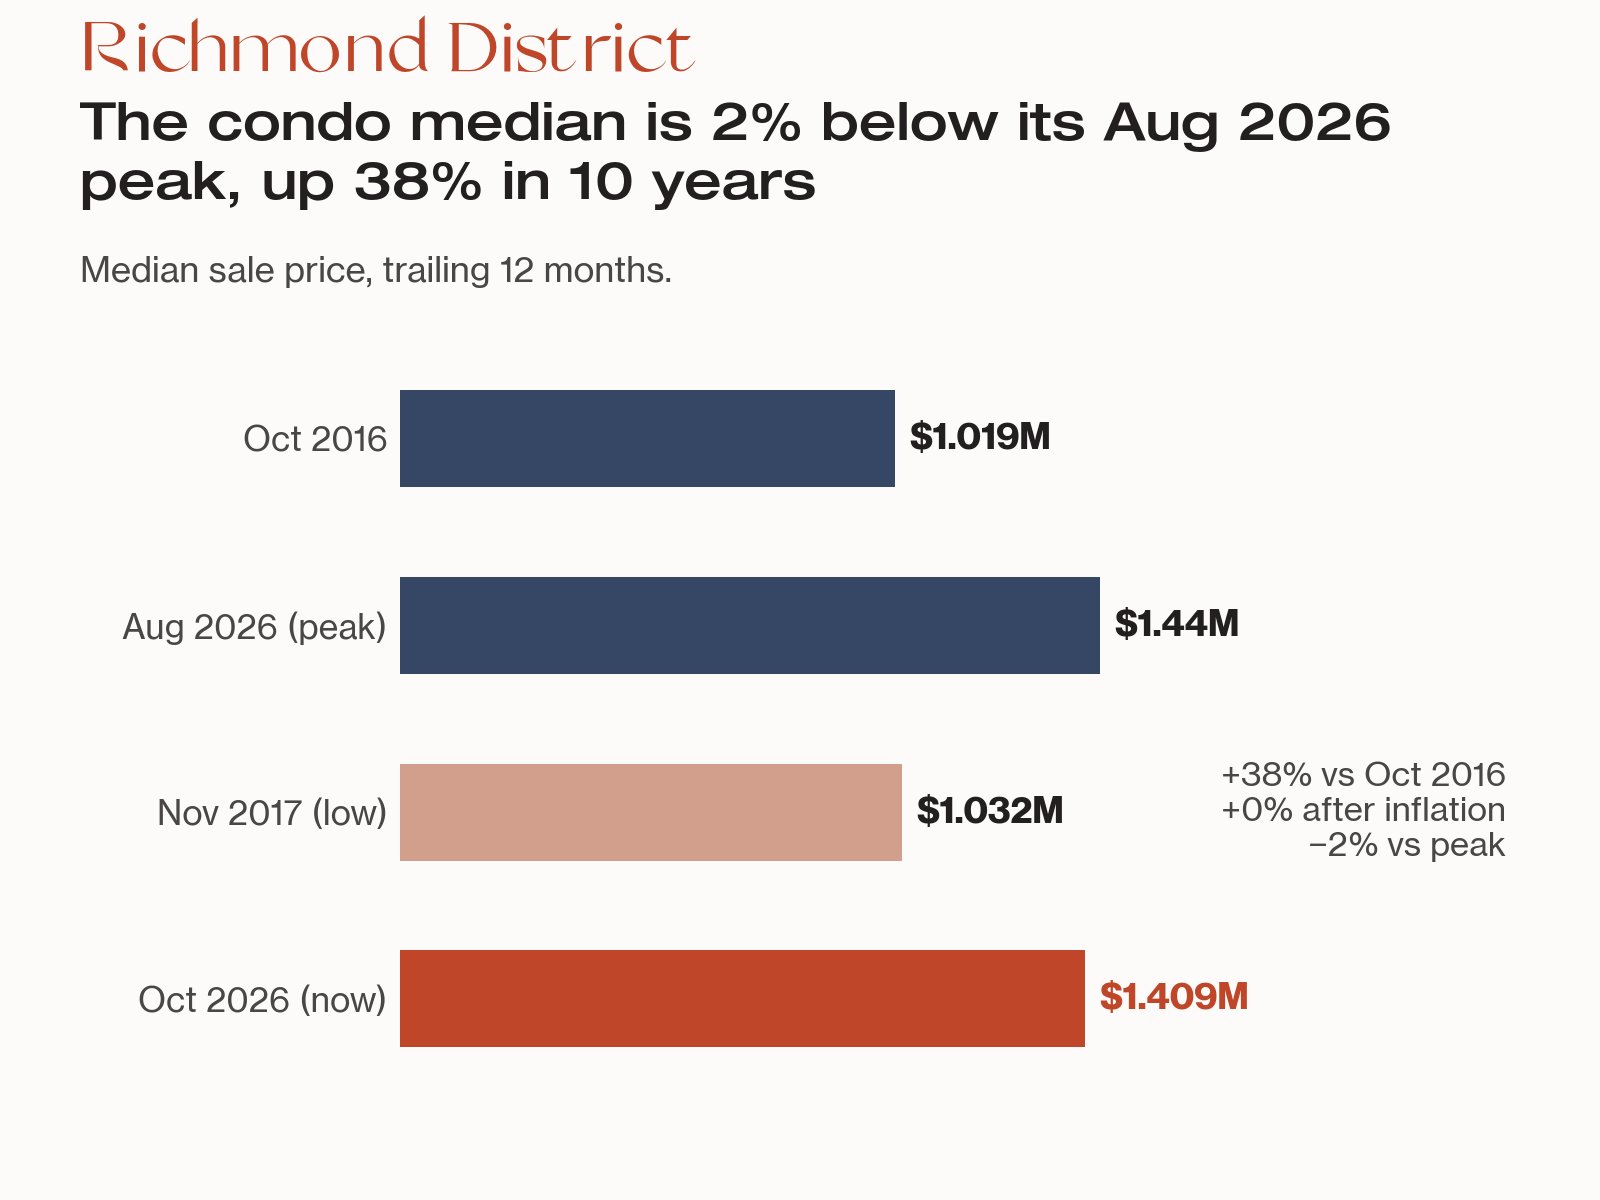
The 12-month median condo price of $1.409 million is 2% below its August 2026 peak of $1.44 million, 38% above October 2016 ($1.019 million), about 3.3% a year, and 14% above the 10-year average. After inflation, the condo gain is about 0%, which means condo prices have not moved in real terms over the decade. The condo median fell to $1.2 million in December 2023 and has since risen 17%.
What does this mean for Richmond District buyers and sellers?
If you're buying a Richmond District house
Our recommendation is to be ready to offer before you tour, because 91% of houses sold above asking and competition was similar at every price level. Our buying process walks through each step.
- Plan for little negotiating room. Only 5% of houses sold after a price cut, and above-asking sales ranged from 89% to 92% in every price tier. The typical house sold for 127% of its list price.
- Expect a thin selection. There were 14 houses on the market at the end of October, and contracts have grown faster than new listings.
- Talk to a lender about rate locks and buydowns now. Freddie Mac's 30-year fixed average was 7.18% on November 5, 2026, down from 7.24% the week before but up from 6.22% a year earlier.
- Choose your area deliberately. The median house cost $3.3125 million in the Inner Richmond, $2.53 million in the Central Richmond and $2.114 million in the Outer Richmond. If you want to compare across Golden Gate Park, our Sunset District neighborhood guide covers the area to the south.
If you're buying a Richmond District condo
Our recommendation is to get pre-approved and set your maximum offer before you tour, because 75% of condos sold above asking and the typical one went under contract in 12 days.
- Expect to compete, especially from $1.4 million up. A year ago a condo buyer could often negotiate, as only 54% sold above asking. Now 46 of 61 did, including 93% of condos in the $1.4 million to $1.8 million range.
- The most negotiating room is under $1 million. Only 6 of 14 condos in that tier sold above asking, and they took a median of 24 days, so there is more room to negotiate there.
If you're selling in the Richmond District
The goal is to launch fully prepared at a price grounded in current sales, not last year's. Our selling process covers preparation and timing, and you can start with a free home valuation.
- Price from current comps. Our recommendation is to price from recent sales, not last year's, because houses that sold from August through October 2026 had a median of $1,228 per square foot, versus $1,073 a year earlier. Median price can swing with the mix of homes sold, so compare on price per square foot and by area: the Inner Richmond's median house price is about 57% above the Outer Richmond's.
- Choose your launch date deliberately. Our guide to the best time to sell a home in San Francisco shows how the calendar affects timing, so you can plan the preparation work backward from it.
- Prepare before you list. With a median of 11.5 days to contract for houses and 12 for condos, buyers decide fast, so photos, disclosures and pre-inspections should be done before launch.
What should you watch in the Richmond District market this winter?
Here's the line between what we've measured and what we haven't. For houses, the rise in price and price per square foot and the higher share sold above asking are supported by the numbers. For condos, faster days to contract, more above-asking sales and higher price per square foot are. The change in median condo price, in house days to contract, in the Outer Richmond's prices, and in the smaller groups could simply reflect which homes happened to sell.
What we haven't measured is how 7.18% mortgage rates will affect buyers. Sales close weeks after a contract is signed, so October's closings mostly reflect offers made earlier. November and December closings will be the first to show whether buyers respond. We're watching three things:
- Homes going under contract (the leading indicator). 55 houses and 18 condos went under contract from August through October, compared with 37 and 19 a year earlier. A fall in contracts would be the first sign of a slowdown.
- New listings versus inventory. New listings were 65 for houses and 26 for condos, against 47 and 23 a year earlier, and 14 houses and 7 condos were on the market at the end of October. More listings would loosen supply.
- Sale-to-list ratio. The typical house sold for 127% of its list price over 12 months, up from 112%, and the typical condo for 109%, up from 100%. A fall toward 100% would signal buyers pushing back.
Thinking about a move this winter? Let's look at the data for your home, not the neighborhood headline. Contact our team and we'll send you a short read on your property. You can also browse all of our Bay Area market updates, or visit Kinoko Real Estate to see how we work. For a neighborhood overview, start with our Richmond District neighborhood guide.
Richmond District real estate market FAQ
How much does a home cost in the Richmond District?
In the 12 months through October 2026, the median Richmond District single-family house sold for $2.325 million, or $1,177 per square foot, across 160 sales. The median condo sold for $1.409 million, or $1,150 per square foot, across 61 sales. Source: Kinoko analysis of SFAR MLS data.
How much do houses cost in the Outer, Central and Inner Richmond?
Over the same 12 months, the median house sold for $2.114 million in the Outer Richmond (70 sales), $2.53 million in the Central Richmond (64) and $3.3125 million in the Inner Richmond (26). The Inner Richmond was highest per square foot at $1,349, and the Outer Richmond lowest at $1,073.
Do Richmond District homes sell above asking price?
Yes. From November 2025 through October 2026, 91% of Richmond District houses (145 of 160) sold above asking price, up from 80% the year before, and 75% of condos (46 of 61) did, up from 54%. In August through October 2026, 94% of houses and 94% of condos sold above asking.
Is the Richmond District a buyer's or seller's market?
It's a seller's market for both. In October 2026, Richmond District houses had about 0.8 months of supply and condos had about 1.2, both under 3 months. Houses were a seller's market in 57 of the last 60 months, while condos were balanced in 12 of them, so the condo shift is more recent.
Sources
- Kinoko Real Estate analysis of San Francisco Association of Realtors (SFAR) MLS data, Richmond District single-family homes and condominiums (Outer, Central and Inner Richmond), through October 31, 2026. Retrieved November 5, 2026.
- Freddie Mac, "Mortgage Rates" (Primary Mortgage Market Survey, 30-year fixed average of 7.18% on November 5, 2026, 7.24% the prior week and 6.22% a year earlier), freddiemac.com/pmms. Retrieved November 5, 2026.
- U.S. Bureau of Labor Statistics, "Consumer Price Index for All Urban Consumers, San Francisco-Oakland-Hayward" (series CUURS49BSA0), data.bls.gov/timeseries/CUURS49BSA0. Retrieved October 30, 2026.
- Kinoko Real Estate, "San Francisco Housing Market Update: Prices and Trends", kinokorealestate.com/blog/san-francisco-real-estate-market-update. Retrieved November 5, 2026.
Kevin Gueco | CA DRE #01461677